Embed Size (px)
Citation preview
Macroeconomics Case Study:
Chinese Macroeconomic Policy
Position Paper1
zz45085 Mai Seki2
zz45092 Shingo Nakayama
zz45049 Yukako Suzuki
February 2, 2006
1This project aims at providing policy recommendations to the Chinese authorities as
if the project team held an IMF Article IV consultation discussions with them. The IMF
Article IV consultation discussion is an actual policy review provided by the IMF. It requires
member countries’ officials to exchange opinions with the IMF staff on the short- to medium-
term macro economic issues. It is conducted on a regular basis and China currently holds
such discussion once a year.2We wish to thank Mr. Ichiro Otani and Professor Takatoshi Ito for there comments on
drafts of this paper.

Contents
1 Executive Summary 2
2 Economic Developments During the Past Decade 3
2.1 High GDP Growth . . . . . . . . . . . . . . . . . . . . . . . . . . . . 3
2.2 Money and Credit Growth . . . . . . . . . . . . . . . . . . . . . . . . 5
2.3 Features of Fiscal Policy . . . . . . . . . . . . . . . . . . . . . . . . . 7
2.4 External Sector Performance . . . . . . . . . . . . . . . . . . . . . . 9
2.5 Developments in Exchange Rate Regime . . . . . . . . . . . . . . . . 11
3 Macroeconomic Objectives 13
4 Macroeconomic Policy Issues 13
4.1 Monetary and Credit Policy . . . . . . . . . . . . . . . . . . . . . . . 13
4.2 Fiscal Policy . . . . . . . . . . . . . . . . . . . . . . . . . . . . . . . 14
4.3 Exchange Rate and Regime Policy . . . . . . . . . . . . . . . . . . . 16
5 Structural Issues 18
5.1 Banking Sector Reforms . . . . . . . . . . . . . . . . . . . . . . . . . 18
5.2 Labor Market Reforms . . . . . . . . . . . . . . . . . . . . . . . . . . 20
5.3 Income Redistribution Policies . . . . . . . . . . . . . . . . . . . . . 22
6 Appendix/Annex: Quantification of Monetary Policy 23
6.1 Summary . . . . . . . . . . . . . . . . . . . . . . . . . . . . . . . . . 23
6.2 Introduction . . . . . . . . . . . . . . . . . . . . . . . . . . . . . . . . 23
6.3 Model . . . . . . . . . . . . . . . . . . . . . . . . . . . . . . . . . . . 23
6.4 Estimation Results . . . . . . . . . . . . . . . . . . . . . . . . . . . . 25
1

1 Executive Summary
China’s current macroeconomic conditions are sound, with promising prospects for
the future. However, there are a few points that must be taken into consideration.
Given signs of inflationary pressure, the central bank should raise policy interest
rates. Independence of the central bank from the government is also necessary, since
the government was deciding credit allocations in the past.
New fiscal revenue resources must be introduced to finance increasing expenditure.
A comprehensive value added tax system will be an effective revenue source. Ex-
penditures are expected to increase in pension payments and the clearance of non-
performing loans. Also, expenditure in human capital investment should be in-
creased to raise labor productivity and to smoothly move labor across industries.
Expenditure on the social security system should be increased to mitigate social
instability.
The central bank should stop intervening in the foreign exchange market excessively,
fully implement their announced exchange rate regime, and let the exchange rate
fluctuate within the 0.3% band in the short run. . In the long run, the exchange
rate regime should shift to a free float in order to gain the independence of monetary
policy.
Reform of the banking sector must be given high priority. Internal management,
audit, and corporate governance should be improved, combined with a stronger
supervisory regime. This is necessary not only to increase competitiveness of the
Chinese economy, but to prevent non-performing loans to increase.
Implicit restrictions are still present in the labor market, causing income disparities
and inefficient allocation of labor resources. The household registration system needs
to be further liberalized, especially in large cities. Infrastructure investment in
the urban area will be crucial to support the labor inflow. Education and job
opportunities need to be equally offered to immigrants from the rural areas as well.
2

Income disparity is rising, which may trigger social instability. The inter-governmental
transfer system needs to be reformed to favor low income provinces. Also, income
taxes should become further progressive. The gains are expected to be larger than
the costs of tax distortions.
2 Economic Developments During the Past Decade
2.1 High GDP Growth
Overview of GDP Growth
Real GDP has grown steadily since 1990. The average annual real growth rate during
1990-2004 was 8.5%. In the first half of 2005, real GDP growth rate is projected
to be 9% by the IMF. This is 0.5%pts lower than the one for 2004. Slowdown in
investment has contributed to lower GDP growth.
Figure 1: Real GDP Growth
46
810
12
14
Real G
DP
Gro
wth
(%
)
2000
4000
6000
8000
Real G
DP
(bill
ion R
MB
)
1990 1995 2000 2005
(RHS)Real GDP Growth Rate(LHS)Real GDP (billion RMB)
Source: WEO Database
Real GDP Growth
Recent GDP growth by expenditures1
1As of now, there are no data on components of GDP by expenditure in real terms.
3

Nominal GDP increased at 13.5% in 2004, up by 2.1%pts from 2003. Household
consumption in nominal terms grew at 10.8% in 2004, up by 3.6%pts from 2003.
Fixed capital formation in nominal terms increased at 16.4% in 2004, down by
1.9%pts from 2003. The investment boom has slowed down due to the tightening of
monetary policy in 2004. Government consumption in nominal terms rose at 9.6%
in 2004, up by 3.6%pts from 2003 after two years of a decline in 2002 and 2003.
Net exports in nominal terms increased at 23.8% in 2004, up by 28%pts from 2003.
In 2005, net export growth slowed down from 2004. While the year-on-year growth
rate of exports(in U.S. dollar terms) stayed around 32% from January to July of
2005, that of imports (in U.S. dollar terms) gradually fell during the same period.
Therefore, the overall trade surplus increased.
Figure 2: Nominal GDP Growth by Expenditure
010
20
30
Perc
ent
19911992199319941995199619971998199920002001200220032004
Source: CEIC Database
Private Consumption GovernmentGross Capital Formation Gross Fixed Capital FormationChanges in Inventories Net Export of Goods and Services
Inflation
Following the two digit inflation period in the mid 1990’s, inflation has become
considerably low and stable. There has even been two periods of deflation, a phe-
nomenon that is unusual for a country with such rapid growth. Most prices were
controlled until 1993. Currently, prices are not controlled with exceptions in certain
sectors, such as education and pharmaceutics. Inflation has started to trend upward
4

Figure 3: CPI
010
20
30
Perc
ent
1990q1 1995q1 2000q1 2005q1
Source: IFS
since 1999.
2.2 Money and Credit Growth
As for the first and second quarters of 2005, the Peoples Bank of China(PBC) took
a view that there are indications of overinvestment, and has been implementing
a contractionary monetary policy. Presently, main policy instruments are reserve
requirement ratio, re-discounting, open market operations and the policy interest
rates.
The time series labeled “bank rate” in figure(4) is the interest rate on loans from the
PBC to financial institutions, with a maturity date of 20 days. It is one of the policy
interest rates that the central bank has direct control over, and the PBC lowered
the interest rate from 1995 to 2004. The bank rate fluctuates very little, and the
PBC has not been using this instrument frequently. Currently, the bank rate has
been increased since 2004, and has become 3.2%. The interest rate spread between
the Federal Funds Rate and the bank rate has been negative in the period between
2002 and 2004.
5

Figure 4: Interest Rates
05
10
15
Perc
ent
1990q1 1995q1 2000q1 2005q1
Bank Rate Deposit RateLending Rate Federal Funds Rate
Source: IFS
The interest rate on required reserves has not changed since 2002, but the required
reserves ratio has been increased to 7.9%.
As for money growth, the average growth rate of narrow money has been around
17%. Although the exchange rate has been pegged to the dollar, the implementation
of capital controls, especially on capital outflows, has allowed the PBC to conduct
a fairly independent monetary policy. These observations suggest that the contrac-
tionary monetary policy has succeeded in decreasing money growth, and keeping
inflation low.
Although the money market is still under considerable restrictions, reforms are tak-
ing place. China had adopted a credit plan prior to 1998, where the government
established credit quotas. This is now abolished. The PBC also restricts various
interest rates. These restrictions will be lifted, making the determination of interest
rates in the market. The control over broad money by the PBC will become weaker,
and new roles for indirect policies will arise. The PBC is intending to strengthen
the role of interest rates as a monetary policy instrument (“China Monetary Re-
port”Quarter 2, 2005).
6

Figure 5: Monetary Instruments
05
10
15
per
cent per
annum
1998m1 2000m1 2002m1 2004m1 2006m1
Rediscount RateRequired Reserves RatioInterest Rate on Required ReservesInterest Rate on Excess Reserves
Source: CEIC Database
Figure 6: M2 Growth, year on year
10
15
20
25
Perc
ent
1990 1995 2000 2005
Source: IFS
2.3 Features of Fiscal Policy
Overview of Chinese Expenditure
China’s fiscal condition is currently sound, although both revenue and expenditures
have been rising since the mid 1990s. The deficit proportional to GDP is less than
5%, with the help of a high GDP growth rate.
7

Figure 7: Budget Revenue, Expenditure, and Deficits per GDP
−5
05
10
15
20
Perc
ent
19901991199219931994199519961997199819992000200120022003
Source: IFS
Revenue per GDPExpenditure per GDPDeficit per GDP
Since 1999, the deficit has been gradually increasing. In 1998, when the negative
shock of the Asian financial crisis prolonged, China faced deflation and unemploy-
ment rate rose. The Chinese government decided to take an aggressive fiscal policy
and issued long term government bonds(100 billion RMB). Treasury bills were also
issued to recapitalize state owned enterprises(SOEs) after the crisis.
Overview of Chinese Revenue
The Chinese government has been taking necessary steps to raise revenue while
implementing tax reforms in 1994 and 2004. The 1994 tax reform was aimed at
building a rule-based intergovernmental transfer system. The target of this reform
was to ensure higher revenue shares against GDP. Figure(7) shows the success of
the 1994 tax reform, which shows that revenue has quickly recovered through the
mid 1990s.
The 2004 tax reform was targeted on corporate taxes, VAT, income taxes and tariffs.
The Chinese authorities cut income taxes while shifting reliance on VAT.
8
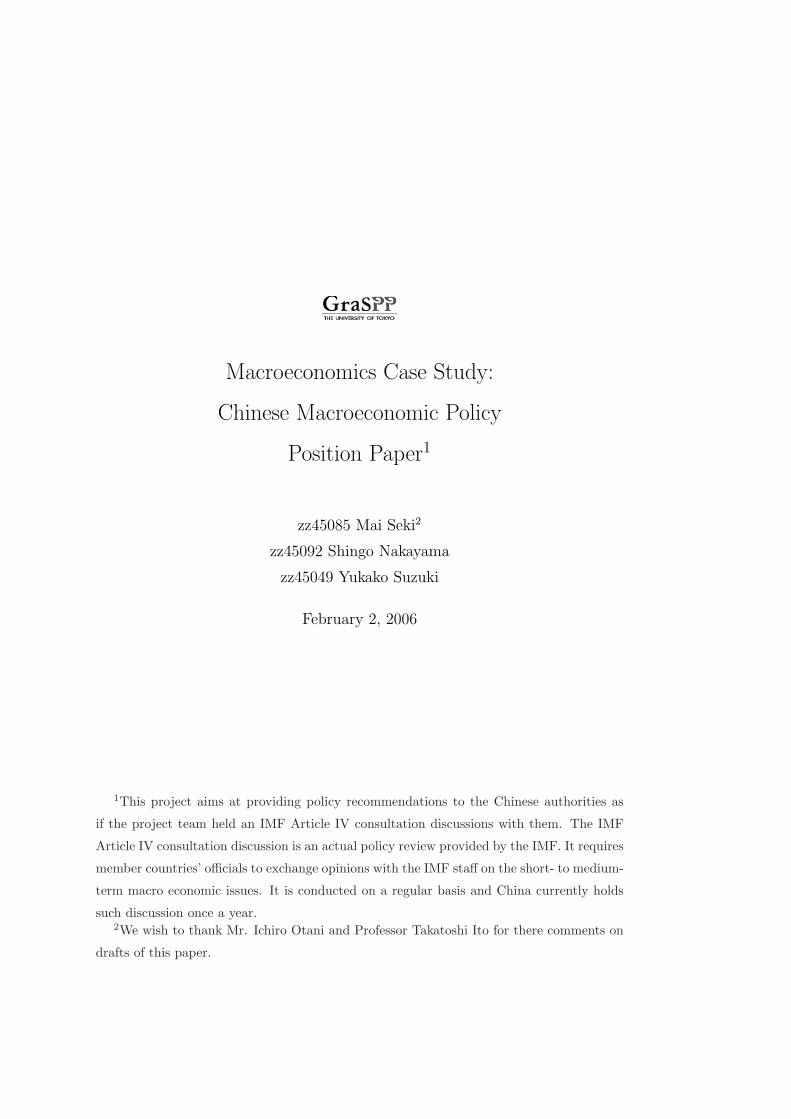
2.4 External Sector Performance
External Sector Performance
For the first time, China replaced Japan as the third largest exporter of merchandise
exports in 20042. The WTO reports that the most dynamic product category in
China’s export was office and telecom equipment, which increased by 45% to $171
billion in 2004. Clothing exports were far less dynamic, increasing by 19% to $62
billion. Chinese merchandise imports rose by 36% in 2004, somewhat faster than its
exports. The total of current account and capital account balances was $206 billion
in 2004. About two third of the surplus was due to the current account surplus,
while the rest was due to the capital account.
The current account balance has been in surplus since 1990 except for the year 1993.
Especially after 2001, the surplus in percent of GDP has been growing steadily. The
current account surplus accounted for $68.7 billion in 2004, representing a growth
rate of 49.6% from 2003. According to the IMF(2005) it is projected that the value
of the current account would continue to increase in 2005 and 2006. However, the
ratio of the current account surplus to GDP would slightly fall in 2006. Since trade
balance, which account for a large part of current account, is projected to fall in
2006.
Foreign direct investment(FDI) has been steadily increasing except for a stagnant
period from 1999 to 2001. This may be a lagged effect of the Asian financial crisis,
yet we need to carefully examine the causality. FDI inflows have increased steadily
to $54.9 billion in 2004. They are expected to continue increasing as the Chinese
economy grows. This would contribute to the development of the Chinese economy.
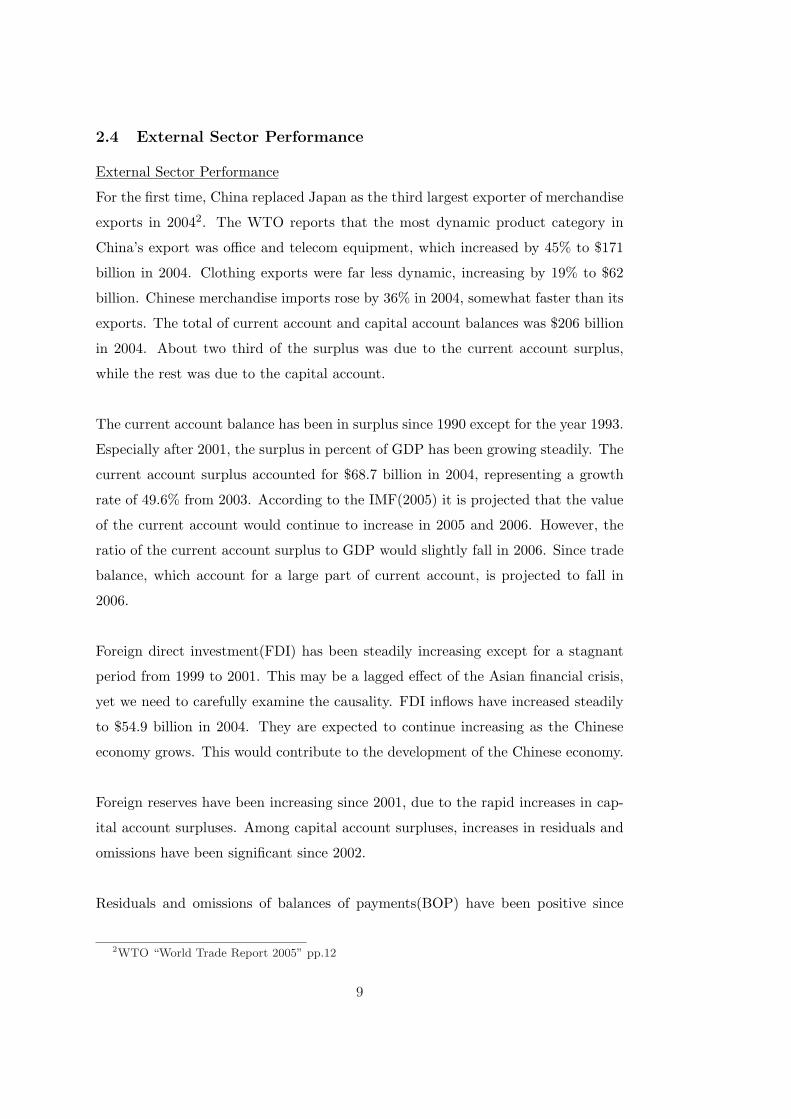
Foreign reserves have been increasing since 2001, due to the rapid increases in cap-
ital account surpluses. Among capital account surpluses, increases in residuals and
omissions have been significant since 2002.
Residuals and omissions of balances of payments(BOP) have been positive since
2WTO “World Trade Report 2005” pp.12
9

Figure 8: Current Account Balance
−2
02
46
Perc
ent
050
100
150
Bill
ion U
SD
1990 1995 2000 2005
(RHS)Current Account Balance(LHS)Current Account Balance per GDP
Source: WEO Database
Figure 9: Net FDI
020000
40000
60000
Net F
DI
1990 1995 2000 2005
Source: IFS
Net FDI
2002, and they accounted for $7.5 billion in 2002. The illegal inflow of capital is
thought to fall into this category. This indicates that speculative money has flowed
into China since 2002 and this trend is still continuing at this point of time. Residuals
and omissions of the BOP accounted for $27.0 billion in 2004, which is about a half
the amount of FDI. If residuals and omissions decrease in the near future due to the
recent revaluation, the exchange regime policy change had certain effects to calm
10
Figure 10: Foreign Reserves
70
80
90
100
110
Reserv
es p
er
Import
s
200
400
600
800
1000
Reserv
es
1996 1998 2000 2002 2004 2006
(LHS)Stock of Nominal Reserves at the year end (billion USD)(RHS)Ratio of Reserves to Imports of Goods and Services
Source: WEO Database
down speculative movements.
2.5 Developments in Exchange Rate Regime
Developments in Exchange Rate Regime
In 1994, the Chinese exchange rate regime was reformed. The multiple exchange
rates of the RMB vis-a-vis the U.S. dollar were unified. Since then, the RMB
has been pegged to the U.S. dollar at a relatively stable rate until July 21st 2005.
Following the 2% revaluation on July 21st, the Chinese authorities have let the RMB
fluctuate within 0.3% for both sides in a day. The rate has cumulatively appreciated
by 0.3% (from the level prevailing on Jul 22) in the three months.
Real effective exchange rate(REER) appreciated over the first quarter to the second
quarter of 20053. If REER continuously appreciate in the future, the nominal RMB
rate will further appreciate within the decided daily fluctuation. However, the Chi-
nese authorities continue to intervene in the exchange market; the fluctuations of
the nominal RMB will be limited for a while.
3REER data are annual averages. For the period of a dual exchange rate system, nominal
exchange rate used in the calculation is a combination of both the official and swap center exchange
rates, weighted by the transaction volumes.
11

Figure 11: Spot Rate of RMB to USD
8.1
8.1
58.2
8.2
58.3
Exchange R
ate
(R
MB
/US
D)
2005m1 2005m3 2005m5 2005m7 2005m9
Source: CEIC Database
Figure 12: Exchange Rate Development
56
78
9
Spot R
ate
(RM
B/U
SD
)
200180160140120100
80
60
40
20
0In
dex o
f R
EE
R a
nd N
EE
R
1990q1 1995q1 2000q1 2005q1
NEERREERSpot Rate (RMB/USD)
Source: IFS
Exchange Rate Development
12

3 Macroeconomic Objectives
Based on the observations done in the previous section, we believe China’s main
macroeconomic objective should be aimed at continuing to achieve economic growth,
while keeping inflation at a minimum.
Economic growth is important in order to create job opportunities. A growth rate
of 8% is thought to create 7 million job opportunities a year, while 10 to 12 million
jobs are needed to keep the current rate of unemployment. Excess labor will be
supplied from the rural areas, as well as from restructuring SOEs. The rise in
unemployment will make the economy vulnerable to social instability. Low inflation
will be necessary for a funded pension system to function.
At the same time, the country is facing major changes as well. China’s accession
to the WTO means opening up the economy by reducing trade barriers, and the
financial sector will be opened to foreign financial institutes for business with Chinese
enterprises, starting from 2006. The “gradual reform” policy stance may have been
one of the reasons for success, but at the same time, this has left the hard problems
unsolved. To name a few, income disparities and non-performing-loan problems
need to be tackled with determination, and insufficient disclosure of statistical data
makes accurate assessment of the problems difficult.
In the proceeding sections, we focus our discussion to monetary policies, fiscal poli-
cies, and exchange rate policies, as we think these three are the most effective policies
to obtain this goal.
4 Macroeconomic Policy Issues
4.1 Monetary and Credit Policy
The PBC should further raise policy interest rates, given signs of an upward trend
in inflation. Among the main policy instruments, interest rates seem to be the most
effective instrument for controlling inflation, compared to quantative measures. The
use of interest rates as a policy instrument should become more important, as the
13

development of the financial market progresses4.
Independence from the central government is a task that is not being dealt with
much. Monetary policy is conducted under the leadership of the State Council. The
nomination and dismissal of the board is also done by the State Council. Since gov-
ernment projects are still being financed by the PBC indirectly, further independence
should prove necessary.
4.2 Fiscal Policy
Future increase in expenditure is inevitable, but at the same time, it is necessary to
keep deficits at a minimum. Further increase in NPL related expenditures, educa-
tion, and the expansion of the social safety net is recommended.
NPL problem is a major element that may slow economic growth. From 1999 to 2000,
four asset management companies were created to clean up NPLs. 1.4 trillion RMB
worth of NPLs were purchased from the four state owned commercial banks(SCBs)
and China Development Bank. The cleaning up of NPLs will be a fiscal challenge,
yet as the Korean case after the Asian financial crisis shows, it is effective to take
drastic approaches against this issue. Drastic measures include disclosure of total
NPLs, improvement of internal management and corporate governance.
Expenditure on upper secondary education should be strengthened. The Chinese
literacy rate was 90.9% in 20005. This high literacy rate is attractive to foreign
investors, which promotes economic growth and international trade. Further in-
vestment in human capital is necessary to gain competitiveness in high value-added
products.
The share of primary industry is still very high at almost 50% in the Chinese labor
market. To smoothly shift labor across sectors, the authorities should provide suf-
ficient training opportunities. A higher level of education will also smooth the shift
of labor across sectors.
4For a further discussion, look in Annex 25Data source: UNESCO
14

The coverage of the social safety net should be widened. Over the past twenty years,
a market-oriented labor market has emerged. On the other hand, SOEs have been
downsized. The social safety net is also necessary to smoothly shift labor across
industries and reduce social instability.
How should the Chinese authorities raise their revenue to finance increasing ex-
penditure requirements discussed above? An adoption of a comprehensive tax VAT
system is recommended for the following reasons. First, administrative costs are low
compared to introducing a new tax system. VAT was introduced in China in the
1980s, and shifted the share of revenue from income taxes to VAT in 2004. Second,
the VAT is a stable revenue source since it does not fluctuate as much as income
tax during economic boom and busts. Despite these reforms, there is still room to
widen the coverage of VAT.
The best timing of VAT introduction is in a early phase of economic develop-
ment6.European countries succeeded to introduce regressive taxes in the 1960s, while
economic growth was still low. On the contrary, Japan and Canada faced hardships.
In the Japanese case, the VAT proposal was blocked by strong opposition in late
1970s and mid 1980s. VAT was introduced in Japan in 1989, but the tax rate was
low. Japan has compensated their deficit by VAT and suffered a looming deficit with
stagnated tax revenue during the lost decade. In addition, the Japanese continued
to suspect tax increases when the economy boomed. The difference which aparts
success and failure of VAT adoption is whether the authorities introduce the system
during or after a period of high economic growth. We recommend that China should
widen the coverage of the VAT system now, given that China is still at a early stage
of economic development.
6Junko Kato”Regressive Taxation and the Welfare State: Path Dependence and Policy Diffu-
sion”2003 Cambridge University Press
15

4.3 Exchange Rate and Regime Policy
On July 21st, 2005, the PBC has announced to revalue the RMB against the dollar by
2% in nominal terms while limiting the daily fluctuation against the dollar to 0.3%7 .
In the market, many had thought the appreciation was not sufficient. Within a week
after the first revaluation announcement, the PBC denied a further revaluation of
the RMB in order to halt appreciation expectation in the market. In August, they
announced that they would refer to the basket of major currencies, US dollar, the
Euro, the Yen, the Won, and some other currencies of Asian and Western countries.
However, estimation suggests that the RMB is still tightly pegged to the dollar.
Appreciation pressure on the RMB
According to IMF estimates of equilibrium RMB rates, it is uncertain if the
RMB is overvalued or undervalued in the medium run(IMF 2004). However, in the
long run, the RMB has been undervalued based on the Balassa-Samuelson approach
(Frankel 2005 and Goldstein 2005). This indicates that the appreciation pressure
on the RMB would build up as economic growth continues. If the appreciation of
the nominal rate lags behind the real rate appreciation, inflation pressure would
increase instead. In order to secure price stability, it is unavoidable to further
appreciate the RMB. Given this long-term goal, we will come back to the question
of how to adjust the RMB.
The current Chinese exchange rate regime has two drawbacks. One is the tradeoff
between independence of monetary policy and a fixed exchange rate regime. In
order to promote the independence of monetary policy and liberalization of the
capital market, the economy needs to give up stability of the exchange rate.
Another drawback is the accumulation of foreign reserves, which amount to about
7On September 23rd, the PBC announced that they would allow 3% daily fluctuations for other
currencies except the U.S. dollar. This announcement is thought to be a simple adjustment to the
recent fluctuations of dollar against the Euro.
16

40% of GDP. This is a result of continuous market interventions to keep the RMB
against USD rate stable mainly against the speculative inflows which expect future
appreciation of the exchange rate.
The large amount of foreign reserves in China contains three major risks: interest
rate risks, exchange rate risks, and excess-liquidity risks8. Increasing liquidity in
the domestic financial market due to the incompleteness of sterilization accelerated
investment, which induced inflation.
The implementation of what the Chinese authorities announced on July 21st will
result in greater benefits than costs. Benefits of a floating rate regime are simple:
gaining the independence of monetary policy and reducing three risks due to the
further accumulating foreign exchange reserves.
Costs of a floating rate regime are rather uncertain. Increase of exchange rate
volatility and possible loss of price competitiveness may cause a negative effect on
domestic employment and financial sector stability. However, magnitude of the net
impact on the Chinese economy is far from certain.
Should the RMB float freely? In the long run, yes. However, in the medium run,
the answer is no. The Chinese authorities should avoid heavy intervention in the
foreign exchange market too much as they do now and let the RMB fluctuate within
the announced band. Also, the Chinese authorities should actually diversify the
reference currencies beside the U.S. dollar in order to lower exchange rate risks.
8Interest rate risks: Gains/Losses=(US bond interest rate − Chinese bond interest rate) *
Foreign reserves, Exchange rate risks: Actual Gains/Losses=(spot rate when bought − spot rate
when sold) * Foreign reserves
17

5 Structural Issues
5.1 Banking Sector Reforms
In order to keep sustainable economic growth in China, banking sector reforms are
essential to promote efficient allocation of financial resources.
Figure 13: NPL of Official Statistic and Ratio to Total Loans
910
11
12
13
Perc
ent
130001400015000160001700018000
100 m
illio
n R
MB
2004q4 2005q1 2005q2 2005q3 2005q4period...
NPLs Share in Total Loans
Source: China Banking Regulatory Commisions
In China, the banking sector is dominated by State Owned Commercial Banks(SCBs).
The SCBs focus on financial resource allocation to the SOEs based on government
credit plans. However many SOEs were unable to repay their loans, and these loans
became non-performing. These debts are not fully recorded in the official statistics.
If the authorities leave the NPL problem unsolved, and the balance sheet of banks
do not improve, then these NPLs will become sources of potential fiscal liabilities.
Although the authorities tried to clean up NPLs after the Asian financial Crisis,
these steps were not enough.
In 2006, the implementation of the WTO rules will open the banking sector to foreign
participants. However, the Chinese financial sector remains in a fragile financial
condition. In December 2003, the authorities injected $45 billion to recapitalize two
SCBs, Bank of China and China Construction Bank as seen in figure(13), yet this
capital injection was not effective enough to clean up the NPLs.
Learning from other Asian countries, NPLs should be recognized and disclosed with
18

accuracy. The Korean case shows that drastic approaches are effective. On the
contrary, the Japanese case shows taking a long time to resolve NPLs worsens the
problem.
As for the solution of NPLs problems, the Chinese financial sector should improve
internal management, audit, and corporate governance. In the past, they lacked
sense of cooperate governance. It was not only an issue of the banking sector, but
also of Chinese corporations as a whole. Many Chinese enterprises, SOEs, lacked
responsibility of borrowing, and many loans became bad loans. These elements have
a minus effect on FDI.
In addition, the Chinese government should improve legal systems for financial ac-
tivities, such as banking mergers and closures, deposit protection, and the court
system. Also the authorities should strengthen their supervisory regime in terms of
financial management. In 2003, the authorities set the China Banking Regulatory
Commissions and transferred the regulatory responsibilities from the PBC. However
its activities is needs further improvement.
These financial institutional reforms have been aimed at expediting competitiveness
and efficiency of Chinese banks in the global market. Moreover, since the Chinese
authorities are heading toward a more flexibility exchange regime, SWAP and fu-
tures markets should be developed to hedge against risks due to foreign exchange
transactions. Some progress has been made in strengthening and modernizing the
Chinese banking system, however key areas like the improvement of supervisory
regime, implementation of corporate governance, and legal systems still remain .
The Origin of NPLs
NPLs are a legacy of China’s planned economy. The SOEs could not promptly
adopt to the market-oriented economy after the opening up of the economy about
25 years ago. They were not efficient in terms of management. In addition, many
foreign companies entered the market from the 1980s through 2000, competing
against domestic companies. Many of the SOEs could not survive among the
19

competition and their management deteriorated. Accordingly, SOEs could not
repay their loans owed to SCBs.
The potential losses from NPLs of SCBs could amount to about 13% in GDP .
However, much smaller banks like banks in the rural areas must have more NPLs,
and the ratio of NPLs may be higher than the SCBs . Why does China have
such high levels of NPLs? One of the reasons is nested to their management.
Chinese banks have small incentives to monitor their borrowers, and properly lend
to profiting projects. Such distortion is historically inherited from the central
planning system. Prior to 1984, China had a mono-bank system(In 1984, China
established a two-tier banking system, separating commercial banking operations
from the PBC. The Central Bank Law and the Commercial Bank Law was enacted
in 1994.), and this bank allocated credits decided by the government to SCBs.
After 1984, the Chinese government established commercial and policy banks(e.g:
Agricultural Bank of China, Bank of China, The China Construction Bank, ,
Industrial and Commercial Bank of China, and Export-Import Bank of China).
However, these banks lacked the knowledge to asses project profitability. The
second reason is that borrowers tended to lack sense of obligation to repay their
loans. They had a sense of implicit grantee by the government. Therefore, banks
had little incentives to monitor their loans.
5.2 Labor Market Reforms
In order to sustain high GDP growth and mitigate income disparity, the Chinese
authorities should reduce restrictions on labor mobility and increase higher invest-
ment in human capital 9.
Further liberalization of the household registration system, especially in large cities,
will decrease restrictions on labor mobility significantly10. Surplus labor in the rural
9The true rate of return to education in China is estimated to be 30 to 40%. Thus the current
level of investment in human capital relative to physical capital is lower than efficient level (Heckman
J. James “China’s Investment in Human Capital.” NBER Working Paper 9296).1050% of middle to small sized cities have already eased household registration system by 2003.
20

area will further immigrate into the urban area for higher wages and it will enhance
efficient allocation of labor resources. Income disparity may widen in the short
run; however, improvement in labor market efficiency will enhance higher economic
growth for the economy as a whole.
In principle, higher wages are a signal of a higher rate of return on education. If
labor mobility is further liberalized, less productive rural workers will be motivated
to invest in education facing the opportunities to earn higher wages in other sectors
than current occupation11. The more productive rural labor becomes, the faster
they will be able to adapt to new technology. Accumulation of such labor forces will
enhance technological changes in the industrial sectors and will fuel further economic
growth in the long run.
Concrete steps to achieve the above policy targets are as follows. First, construct
infrastructure in urban areas to respond to the increase of residents. Second, pro-
vide social security to the immigrants from rural areas. Lack of social security has
been another restriction on labor mobility besides household registration system.
Third, provide education and job training services equally to the children of the
immigrants from rural areas. Education opportunity affects location decisions of
immigrant labor. As a policy instrument, the central government could subsidize
local governments for public education expenditure. Along with direct public sup-
port, the Chinese authorities could support the development of a capital market for
tuition12.
Shenzhen city of Guang dong province, Chong ging city, and Shandong province have eased the
restrictions of household registration system (The Japan Institute for Labor Policy and Training
“Migration and Development of Family Registration System.” http://www.jil.go.jp/foreign/
jihou/2005 3/china 01.htm).11Chinese labor productivity in agriculture is lower than other Asian countries (Brooks, Ray.
“Labor Market Performance and Prospects” IMF Occasional Paper 232, pp55-56.).12Another policy to finance education is to promote ties between industries and universities. It
will provide means to finance research and education expenditures as well as enhance universities
to respond to practical problems(Heckman).
21

5.3 Income Redistribution Policies
The Gini coefficient was 0.45 in 2001, according to the most recent estimate by the
World Bank. This is 37th out of 127 countries in the Gini coefficient ranking in
the United Nations Development Program(UNDP). This figure has been steadily
increasing since the reform of the economy starting from 1978, although part of
this outcome was predictable due to the egalitarianism nature of the socialist econ-
omy prior to the reform. Income disparity is also a multidimensional problem, with
dimensions such as urban-rural disparities, inter-regional disparities(i.e. coastal-
central-western) and inter-industrial disparities. A decomposition of the Gini coef-
ficient shows that income disparities are prominent between rural-urban areas and
between industries.
The budget transfer system should be reformed to favor low income provinces to
decrease inter-regional disparities. The current transfer system is highly regressive,
with transfers consisting of revenue returned, specific-purpose, general-purpose, and
fixed subsidies. The revenue returned component is the main source of transfer,
which is proportional to the tax collected by the provinces. This system was im-
plemented in the 1984 fiscal reform where revenues were centralized, and revenue
return was introduced to alleviate objections by high tax collecting provinces. 10
years after the reform, the political costs should be much lower than the benefits
gained by social stability.
Inter-industrial disparities should be dealt with by strengthening a comprehensive
tax system on high productivity industries, and lowering the tax rate on low produc-
tivity industries, especially agriculture. The decomposition of the Gini coefficient
suggest that the main source in inter-industrial disparity is non-wage income, which
is not taxed. The benefits of social stability should be significantly larger that the
costs of distorting taxes.
Investment in the rural areas should be strengthened for further industrialization.
Ease of migration should also alleviate this problem, although the effects may be
limited due to the increase in laid-off workers from SOEs in the urban areas.
22

6 Appendix/Annex: Quantification of Monetary Policy
6.1 Summary
The monetary transmition mechanism of China is estimated using a structural vec-
tor autoregression(SVAR) model. A 5 variable system is estimated, identifying the
contemporaneous structure of the endogenous variables via a Cholesky decomposi-
tion of the covariance matrix. Estimation results suggest that the response of the
economy to unexpected policy shocks are significant.
A forecast with a time period of 16 quarters is also done. The forecast projects
China’s real growth may slow down.
6.2 Introduction
The recent literature quantifies the effect of monetary policies utilizing a structural
vector autoregression (SVAR) estimation procedure. Although there are many em-
pirical works on the US and other G7 countries, analysis of developing countries such
as China are still few. For developing countries, the modeling of an open-economy
create difficulties, combined with the lack of data, both in quantity and quality.
The estimation results of a SVAR estimation is often summarized in forms of an
impulse response function and forecast error variance decomposition. An impulse
response function is the reponse of the whole system, given a specific realization of
the random variables of the system(shock). The choice of the realization is somewhat
ambiguous, making the interpretation of the shocks difficult. If this is not done with
care, the estimation results in puzzling outcomes. Most developments in the SVAR
literature are done in identifying the contemporaneous structure of the endogenous
variables or fundamental shocks. The estimation here utilizes the standard Cholesky
identification strategy, justified by the planned nature of the Chinese economy.
6.3 Model
A general representation of the SVAR model is as follows.
A
Xt
M t
= B(L)
Xt−1
M t−1
+ DZt + Cεt (1)
23

where Xt is the economy block, M t is the monetary block, and Zt are exogenous
variables. εt are shocks which are fundamental in the sense that these random
variables are not functions of any other random variables. The matrix A expresses
the contemporaneous structure of the endogenous variables, while C expresses the
contemporaneous structure of the fundamental random variables.
The actual model that is estimable is the following reduced form.
Xt
M t
= F (L)
Xt−1
M t−1
+ GZt + ut (2)
The relation between the two models are,
A−1B(L) = F (L), A−1D = G (3)
A−1Cεt = ut (4)
All structures with a nonsingular matrix A result in the same reduced form,
making them observationally equivalent. Further a priori information is necessary
in order to identify the structure.
In this work, a 5 variable system was estimated using the following endogenous
variables.
Xt =
GDP Growtht
CPIt
REERt
, M t =
∆M2t
Bank Ratet
(5)
Interest rate spread of the Federal Funds Rate and the Bank Rate was included
as an exogenous variable.
Zt = FFR-Bank Ratet (6)
Quarterly data was collected from the IFS database for the period 1990Q2 to
2002Q3, except for GDP growth data. There are no national statistics for quarterly
GDP data prior to 1999. As a proxy, the industrial production index from the CEIC
database was used instead.
24

Lag length was set to 2 using AIC and BIC criterions.
The contemporaneous structure is identified as being lower triangular.
a11
a21 a22
a31 a32 a33
a41 a42 a43 a44
a51 a52 a53 a54 a55
GDP Growtht
CPIt
REERt
∆M2t
Bank Ratet
= εt (7)
with Var(εt) being diagonal.
This implies that the bank rate is determined with contemporaneous feedback
from all variables in the system. In other words, the central bank’s decision of the
policy interest rate is done using full information of the system. ∆M2 is determined
with contemporaneous feedback other than the bank rate. At the other extreme,
there is no contemporaneous feedback to GDP growth from other variables. The
slow responding, recursive structure of the economy can be justified by the somewhat
planned nature of the economy.
6.4 Estimation Results
Figure(14) is the estimated impulse response function with a time horizon of 16
quarters. The confident intervals were estimated by bootstraping(Runkle, 1987).
Only the impulse response function of the bank rate has the luxury of interpreting
the shocks as fundamental, exogenous shocks. The contemporaneous feedback of the
policy equation is as follows.
0.065GDP growtht − 0.068CPIt+
0.009REERt − .127∆M2 + 0.371Bank Ratet = εmt
The impulse response of bank rate shock(policy innovation) shows a one standard
deviation shock, which is equivalent to a 0.371 increase in bank rate. The signs of
response are consistent with theory. CPI steadily decreases 30 basis points for the
proceeding 8 quarters. This result is useful, not only that is shows the magnitude
of CPI decrease, but also the length of the monetary transmission lag. M2 also
25

Figure 14: Impulse Response Function
0 10 200
0.2
0.4
0.6GDP growth
GDP growth
0 10 20-0.4
-0.2
0
0.2Spread
0 10 200
0.5
1
1.5CPI
0 10 20-0.4
-0.2
0
0 10 20-0.5
0
0.5
1
1.5REER
0 10 200
0.5
1
1.5
0 10 20-40
-20
0
20
40
�M2
0 10 20-300
-200
-100
0
100
0 10 200
0.2
0.4Bank Rate
0 10 20-0.4
-0.2
0
0 10 20-0.05
0
0.05
0.1CPI
0 10 20-0.5
0
0.5
1
1.5
0 10 200
0.5
1
1.5
0 10 20-40
-20
0
20
40
0 10 20-0.1
0
0.1
0 10 20-0.05
0
0.05
0.1REER
0 10 20-0.4
-0.2
0
0.2
0 10 201
1.2
1.4
1.6
0 10 20-40
-20
0
20
40
0 10 20-0.04
-0.02
0
0.02
0 10 20-0.1
-0.05
0
M2
0 10 20-0.2
0
0.2
0 10 20-0.8
-0.6
-0.4
-0.2
0 10 200
50
100
150
0 10 20-0.4
-0.2
0
0 10 20-0.1
0
0.1
Bank Rate
0 10 20-0.4
-0.2
0
0 10 200
0.2
0.4
0.6
0 10 20-30
-20
-10
0
10
0 10 20-0.2
0
0.2
0.4
decreases, a cumulative amount of 273 billion RMB. There is also persistence in
own response, evidence of interest rate smoothing. There is a minus impact on
GDP growth, although the level of impact is 5 basis points and small. REER also
appreciates approximately 0.7 units. Summarizing, the effect of slowing GDP is
small, at the same time being an effective instrument at controlling inflation.
Figure(15) is a 4 quarter forecast, using the last 2 periods of the data. The
26

interest rate spread was set to zero for all periods of the forecast horizon.
Figure 15: 4 Quarter Forecast
0 20 40 60
8
10
12
14
GDP growth
0 20 40 60-5
0
5
10
15
20
25
30CPI
0 20 40 6060
70
80
90
100
110REER
0 20 40 600
200
400
600
800
1000
1200
1400
�M2
0 20 40 602
4
6
8
10
12Bank Rate
The results show an upward trend for inflation. GDP growth is also projected to
slow down. This result suggests that the monetary authorities further increase the
bank rate to bring inflation down.
The estimation results show that the bank rate is a good policy instrument. But
this promising result may not hold in the future due to reforms in the financial
market.
References
[1] IMF:www.imf.org
[2] Brooks, Ray ”Labor Market Performance and Prospects” IMF Occasional Paper
232
[3] China Monetary Report, Quarter 2, 2005
[4] Junko Kato “Regressive Taxation and the Welfare State: Path Dependence and
Policy Diffusion” 2003, Cambridge University Press
[5] Heckman J. James “China’s Investment in Human Capital” NBER Working
Paper 9296
27

[6] Frankel, Jeffrey, 2005, “On the Renminbi: The Choice Between Adjustment Un-
der A Fixed Exchange Rate and Adjustment Under A Flexible Rate.” (NBER
Working Paper Series. 11274)
[7] Goldstein, Morris, 2004, “Adjusting China’s Exchange Rate Policies.” (Institute
for International Economics.)
[8] World Bank:www.worldbank.org
[9] Prasad, Eswar, 2004, “China’s Growth and Integration into the World Economy
Prospects and Challenges”(Washington: IMF occasional paper 232)
[10] People’s Bank of China : www.pbc.gov.cn
[11] State Administration of foreign Exchange: www.safe.gov.cn
[12] National Bureau of Statistics: www.stats.gov.cn
[13] Ministry of Finance: www.mof.gov.cn
[14] CIA: http://www.cia.gov/cia/
[15] CEIC Data Company Ltd: http://www.ceicdata.com
[16] IMF, International Financial Statistics, 2005 Sep.
[17] http://www.chinaepayments.com/resource/info/info08.asp
[18] WTO “World Trade Report 2005”
[19] UNESCO http://www.uis.unesco.org/ev.php?URL ID=5204&URL DO=
DO TOPIC&URL SECTION=201
28