Embed Size (px)
Citation preview

EX POST EVALUATION OF INVESTMENT PROJECTS CO-FINANCED BY THE
EUROPEAN REGIONAL DEVELOPMENT FUND (ERDF) OR COHESION FUND
(CF) IN THE PERIOD 1994-1999
M1 MOTORWAY
PREPARED BY: DKM ECONOMIC CONSULTANTS, DUBLIN
IN PARTNERSHIP WITH CSIL, CENTRE FOR INDUSTRIAL STUDIES, MILAN
PREPARED FOR: EUROPEAN COMMISSION DIRECTORATE-GENERAL
REGIONAL POLICY POLICY DEVELOPMENT
EVALUATION
MILAN, SEPTEMBER 5, 2012

This report is part of a study carried out by a Team selected by the Evaluation Unit, DG Regional Policy,
European Commission, through a call for tenders by open procedure no 2010.CE.16.B.AT.036.
The consortium selected comprises CSIL – Centre for Industrial Studies (lead partner – Milan) and DKM
Economic Consultants (Dublin).
The Core Team comprises:
- Scientific Director: Massimo Florio, CSIL and University of Milan;
- Project Coordinators: Silvia Vignetti and Julie Pellegrin, CSIL;
- External experts: Ginés de Rus (University of Las Palmas, Spain), Per-Olov Johansson (Stockholm School
of Economics, Sweden) and Eduardo Ley (World Bank, Washington, D.C.);
- Senior experts: Ugo Finzi, Mario Genco, Annette Hughes, Marcello Martinez and Antonio Massarutto;
- Task managers: John Lawlor, Julie Pellegrin and Davide Sartori;
- Project analysts: Emanuela Sirtori, Gelsomina Catalano and Rory Mc Monagle.
A network of country experts provides the geographical coverage for the field analysis: Roland Blomeyer,
Fernando Santos (Blomeyer and Sanz – Guadalajara), Andrea Moroni (CSIL – Milano), Antonis Moussios,
Panos Liveris (Eurotec - Thessaloniki), Marta Sánchez-Borràs, Mateu Turró (CENIT – Barcelona), Ernestine
Woelger (DKM – Dublin).
The authors of this report are John Lawlor and Rory Mc Monagle of DKM.
The authors are grateful for the very helpful comments from the EC staff and particularly to Veronica
Gaffey, Anna Burylo and Kai Stryczynski. They also express their gratitude to all stakeholders who agreed
to respond to the team’s questions and contributed to the realisation of the case study. The authors are
responsible for any remaining errors or omissions.
Quotation is authorised as long as the source is acknowledged.
Cover: The M1 bridge over the River Boyne near Drogheda. Picture released into the public domain by its
author Sarah777 and originally uploaded on en.wikipedia.

TABLE OF CONTENTS
EXECUTIVE SUMMARY ....................................................................................................................... 1
1 PROJECT DESCRIPTION ............................................................................................................... 9
1.1 KEY FEATURES OF THE INFRASTRUCTURE AND SERVICE DELIVERED............................................................... 9 1.2 CONTEXT ...................................................................................................................................... 11 1.3 TARGET POPULATION ...................................................................................................................... 12 1.4 CURRENT PERFORMANCE ................................................................................................................. 14
2 ORIGIN AND HISTORY ............................................................................................................... 17
2.1 CONTEXT FOR THE PROJECT .............................................................................................................. 17 2.2 KEY STAKEHOLDERS AND MANAGEMENT STRUCTURES ............................................................................ 28 2.3 MAIN DEVELOPMENTS SINCE COMPLETION .......................................................................................... 31 2.4 HAS THE PROJECT STABILISED? .......................................................................................................... 32
3 LONG-TERM DEVELOPMENT EFFECTS ........................................................................................ 35
3.1 KEY FINDINGS ............................................................................................................................... 35 3.2 DIRECT ECONOMIC GROWTH ............................................................................................................ 40 3.3 ENDOGENOUS DYNAMICS ................................................................................................................ 45 3.4 SOCIAL COHESION .......................................................................................................................... 46 3.5 ENVIRONMENTAL EFFECTS ............................................................................................................... 46 3.6 TERRITORIAL COHESION ................................................................................................................... 48 3.7 INSTITUTIONAL QUALITY .................................................................................................................. 49 3.8 SOCIAL HAPPINESS .......................................................................................................................... 55
4 DETERMINANTS OF PROJECT OUTCOMES .................................................................................. 57
4.1 KEY FINDINGS ................................................................................................................................ 57 4.2 APPROPRIATENESS TO THE CONTEXT .................................................................................................. 57 4.3 PROJECT DESIGN ............................................................................................................................ 58 4.4 FORECASTING CAPACITY .................................................................................................................. 60 4.5 PROJECT GOVERNANCE .................................................................................................................... 61 4.6 MANAGERIAL RESPONSE .................................................................................................................. 62 4.7 INFLUENCE OF AND INTERPLAY BETWEEN DRIVERS ................................................................................. 62
5 CONCLUSIONS ........................................................................................................................... 65
ANNEX I. METHODOLOGY OF EVALUATION .................................................................................. 69
ANNEX II. COST-BENEFIT ANALYSIS ............................................................................................... 75
ANNEX III. GLOSSARY OF TERMS AND ABBREVIATIONS ................................................................ 101
ANNEX IV. LIST OF INTERVIEWEES ................................................................................................ 103
ANNEX V. REFERENCES ............................................................................................................... 105


1
EXECUTIVE SUMMARY
This case study illustrates the story of the development of the M1 motorway in Ireland. The
route forms part of the TEN-T United Kingdom-Ireland-Benelux Road Axis (Priority Axis No.13),
which links the three main cities on the island of Ireland with Great Britain and Continental
Europe. The purpose of the evaluation is to assess the socio-economic long-term effects
generated by the project and to disentangle the possible determinant factors that may have
contributed to producing these effects. More details on the overall evaluation approach are
presented in the box overleaf and, more extensively, in Annex I.
OVERALL APPROACH AND METHODOLOGY
The Conceptual Framework delivered in the First Intermediate Report has been developed from the evaluation questions included in the ToR1, and further specified and organised in accordance with the study team’s understanding. In particular, the Team identified three relevant dimensions of analysis:
a. The object of the evaluation (the ‘WHAT’): this relates to the typologies of long-term contributions that can be observed. Starting from the typologies identified in the ToR (socio-economic develop-ment and quality of life) the Team developed the following classification of long-term effects: ‘Eco-nomic development’ (including effects on GDP growth and endogenous dynamics) and ‘Quality of life’, taken here to be synonymous with additional social wellbeing, i.e. including effects that are not captured by the economic variables. ‘Quality of life’, in turn, has been divided into: social cohe-sion, territorial cohesion, institutional learning, environmental effects and social happiness.
b. The timing of the long-term effects (the ‘WHEN’): this dimension relates to the point in the project’s lifetime at which the effects materialise for the first time (short-term dimension) and stabilise (long-term dimension). The proper timing of an evaluation and the role it can have in relation to the project’s implementation is also discussed here.
c. The determinants of the project’s performance (the ‘HOW’): the assumption here is that five aspects of project’s implementation and their interplay are crucial for the project’s final performance. These aspects are: project design, forecasting capacity, governance, context and managerial response. Five Working Hypotheses are related to these dimensions and explain how each of them can influence the generation of the project’s short or long-term effects.
On the basis of this conceptualisation, a set of detailed evaluation questions are developed, which aim to guide the entire study and to support the provision of conclusions and recommendations.
The methodology developed to answer the evaluation questions consists of a combination of quantitative (Cost Benefit Analysis) and qualitative (interviews, surveys, searches of government and newspaper archives, etc.) techniques, integrated in such a way as to produce ten project histories. CBA is an appropriate analytical approach for the ex-post evaluation because it can provide quantification of or indications of some of the long-term effects produced by the project. However, the most important contribution of the CBA exercise is to provide a framework of analysis to identify the most crucial aspects of the projects’ ex-post performance and final outcome. Qualitative analysis on the other had is more focussed on understanding the underlying causes and courses of action of the delivery process. On the basis of the findings of the ten case studies, the Final Report will draw lessons along the key dimensions identified of ‘what’, ‘when’ and ‘how’.
Source: CSIL Milano
1 They are the following: What kind of long-term contributions can be identified for different types of investment in the field of
environment and transport infrastructure? How are these long-term contributions generated for different types of investment in the field of environment and transport infrastructure, i.e., what is the causal chain between certain short-term socio-economic returns and long-term returns from investment? What is the minimum and average time needed for a given long-term contribution to materialise and stabilise? What are these time spans for different types of investment in the field of environment and transport infrastructure? What are the existing evaluation methods to capture a given long-term contribution for different types of investment in the field of environment and transport infrastructure?

2
The context and objective of the project can be considered as:
A well-established need (since the 1960s) to improve the old N1 route, in terms of
improving capacity, speed and safety.
Increasing economic activity and prosperity, and the resultant increase in demand for
travel.
The availability of high levels of funding under the CF.
The Northern Ireland peace process, which reconnected Ireland with Northern Ireland
socio-economically.
The M1 was only the second motorway to be commenced in Ireland, but there was
subsequently a large programme of providing motorways on all the major inter-urban routes
(N2 through to N9), which was mostly delivered in the 2000s and the current decade.
In more detail, the project consisted of seven sections of road, to deliver a continuous
motorway stretching from Dublin airport in the south to just north of Dundalk at the northern
end. Further improvements of the road extending to the border with Northern Ireland and
beyond to Belfast have subsequently been put in place, but do not form part of the project
being analysed.
Construction commenced in 1989 with the Dunleer Bypass, which opened for traffic in 1994.
The final section (Dundalk Western Bypass) commenced construction in 1998 and was
completed in 2005. The project involved a total investment of EUR 787 million (2011 prices,
VAT exclusive), 38% of which co-financed through the Cohesion Fund. The remaining
investment cost was covered through national public contribution (47%) and contributions by
private capital (13%). The European Commission’s contribution was primarily justified by the
fact that the route was part of the TEN-T priority Axis No.13, its importance for the Irish
transport sector and the high cost of delivering the infrastructure.
OVERVIEW OF INVESTMENT COSTS AND SOURCES OF FINANCING
Financing period 1989-2005
First year of operation 2005 (full motorway)
Total investment costs (2011 prices) EUR 786.6 million 100%
Sources of financing and co-funding rates over the total investment costs
Cohesion Fund EUR 300.6 million 38.2%
European Regional Development Fund EUR 0 0.0%
European Investment Bank EUR 0 0.0%
National-regional-local public contribution EUR 382.4 million 48.6%
Private capital EUR 103.6 million 13.2%
The cost of building motorways increased significantly in Ireland over the period of
construction, reflecting increased inflation in the construction sector as the economy entered
the “Celtic Tiger” era. Generous compensation for land acquisition also added to costs. Cost

3
overruns were a particular issue on the Dundalk Western Bypass because of these reasons, as
well as the discovery of a number of archaeological sites on the route.
Institutional and management structures evolved over the timeframe of the project. Perhaps
the most significant institutional change was the establishment of the National Roads
Authority (NRA) in 1993. The NRA has “overall responsibility for the planning and supervision
of works for the construction and maintenance of national roads”, as well as powers to enter
into tolling arrangements with private operators. Previously these functions were in the hands
of Local Authorities.
Other important developments related to the decision to offer a toll concession on the road,
which was awarded to Celtic Roads Group (CRG). The toll agreement included the construction
of the Dundalk Western Bypass and maintenance of the entire road from the Balbriggan
Bypass northwards. Tolls are collected on the Drogheda Bypass section.
More recently there has been a change in the planning process with respect to major
infrastructure such as motorways. Firstly, the law was changed in 2001, so that the Planning
Appeals Board replaced the Minister of the Environment as the body which provides final
approval for a motorway scheme to commence. This as a positive development which
depoliticised the planning process. Secondly, under the Planning and Development (Strategic
Infrastructure) Act 2006, planning applications for “strategic infrastructure” are made directly
to the Planning Appeals Board instead of to a Local Authority, which is designed to speed up
approvals.
The new road has performed satisfactorily since opening. Over the years the various sections
of the motorway have seen strong traffic growth, albeit volumes have fallen somewhat since
the peak year of 2008. Volumes are heaviest at the southern end of the motorway, closest to
Dublin, and tend to decrease the further north one goes.
In terms of financial sustainability, the toll concession is designed to ensure that all but the
southern sections of the road will be properly maintained for the concession period. Falling
traffic volumes have meant reduced toll income, but as one of the busiest roads in the country
income should still be sufficient going forward. Recent regional traffic forecasts generated by
the NRA point to modestly growing traffic volumes over the coming decades.
The M1 has contributed to direct economic growth, most directly through cutting journey
times. The sum of time savings on the sections of the motorway on opening is estimated at 37
minutes, with a large concomitant reduction in journey time variability. Other direct impacts
include reduced accident costs. Annex II sets out the CBA undertaken on the M1. It indicates
that the financial NPV of the project is minus EUR 0.65 billion, while the economic NPV
amounts to positive EUR 6.15 billion (2011 prices). These results are highly robust: the project
has already generated (as of end 2011) sufficient benefits to justify itself.
We estimate that 6,300 work years of employment were generated over the 16 years of
construction of the M1 (albeit some would have been displaced). Residents along the route of
the motorway experienced increased employment over the period 1996-2006 (higher than the

4
national average), but also increased the distance they travelled to work, pointing to a
combination of increased local economic activity and urban sprawl.
There would have been an increase of knowledge and expertise in the institutions and firms
involved in the management and delivery of the new road, thus improving Irish human capital
and driving organisational development. This could be expected to have overflowed into the
building of subsequent motorways, and possibly into other areas of civil engineering.
It is less clear the degree to which the M1 motorway contributed to social cohesion. Prima
facie it would have opened up more employment opportunities, which the travel to work data
indicate the workforce of Co. Louth succeeded in accessing. On the other hand, it may be that
those who were already better off were in a stronger position to avail of these opportunities.
The M1 motorway has had positive and negative environmental impacts. On the positive side,
the environment for humans in the by-passed towns improved. However, there are a number
of environmental negatives, including an increase in fuel usage and consequently in
Greenhouse gas (GHG) emissions and other pollutants, increased noise and severance in rural
areas, and possibly undermining the attractiveness of the parallel rail route.
Territorial cohesion would have benefited from the new road. The cost of transport in the
north east of the country was reduced and connectivity between the region and Dublin, the
main economic centre in Ireland, was increased.
Institutional structures and capacity changed significantly over the course of the building of
the M1 motorway. Much of this was driven by the requirements of the large and
unprecedented investment in Ireland’s infrastructure, rather than by individual projects.
However, as the M1 was one for the first motorways to be built in Ireland, it was so to speak
something of a “pioneer”, and it is reasonable to conclude that the lessons and experiences of
delivering the M1 were influential in the institutional developments that occurred.
In terms of social happiness, in general the motorway network is a source of public pride and
satisfaction. On the negative side, there was considerable resistance to the decision to toll the
motorway at Drogheda, and this has persisted to a degree.
This project was highly appropriate to the context. It had been well-established (as far back as
the 1960s) that there was a requirement for increased capacity and safety on the route. The
first section of the road to be upgraded opened in 1994, as both the “Celtic Tiger” era and the
Northern Ireland peace process were beginning, so the road received a very “fair wind” in
terms of external circumstances.
It was clear at the time that Ireland’s infrastructure was inadequate, particularly in terms of
roads. EU co-funding was seen as kick-starting a programme of investments, which in the pre-
Celtic Tiger era might have appeared too daunting for the Government. As a result, the public
mood was overwhelmingly in favour of the investment programme. It is arguable whether,
pre-Celtic Tiger, the Irish Government would have been in a position to fund a motorway along
the entirety of the route.

5
Design of the road proved robust, for instance proving capable of coping with the decision to
accommodate tolling on the Drogheda Bypass.
Forecasting capacity with regard to the demand side (traffic volumes) was somewhat
redundant, as it had been decided in the 1989-1993 and 1994-1999 Operational Programmes
to build the road to motorway standard throughout. Forecasting capacity as a mechanism to
reduce risk did come into sharp focus with the decision to offer a toll concession for part of the
route. Traffic forecasts would have been key to negotiations and bidding for the toll
concession, although we are not privy to these forecasts and how accurate they proved to be.
Governance structures were novel in an Irish context, and evolved over time. The overall
Community Support Framework (CSF) 1989-1993 and 1994-1999 had a Monitoring Committee,
as did the Operational Programmes for Peripherality and Transport, and there were extensive
reporting and monitoring requirements. The discipline of complying with these added to the
quality of the governance and decision-making process in the course of the delivery of the
programme.
The establishment of the NRA and its expanding role, the adoption of “design & build”
contracts and the encouragement of international competition for contracts, as well as the
changing role for the Planning Appeals Board over time are all positive examples of the
strength of governance and its ability to cope with changes.
There are some signs of a return to the politicised approach to infrastructure development
subsequent to 1999 when there was a significant reduction in EU funding as well as a
strengthening of the Exchequer position. Possible examples include the decision to build all the
major inter-urban routes to motorway standard, well in excess of the standard recommended
in the national Road Needs Study, and the system for compensating landowners for land
acquisition, agreed with the Irish Farmers’ Association in 2001. Fiscal difficulties have returned
in recent years, and have re-established their traditional constraining role on public
infrastructure budgets.
In terms of managerial response, at the wider level of public policy (e.g. evolution of the role of
the NRA, the planning system, of contract design and the compensation agreement with
farmers) there was a significant degree of evolution and adaptation to circumstances.
However, at the project management level for the M1 itself, there is limited evidence of
adaptation to unforeseen events. The main category of such events would be unexpected on-
site conditions in the building of the road, and the contract structures prescribed in large
degree how these would be dealt with.
The role of the EC was in general positive, providing a large proportion of the total cost of the
investment, as well as requiring the establishment of strong governance and oversight
structures.
By and large it can be said that the project has stabilised. No major future developments are
envisaged, although some uncertainties about the future do exist, mainly around the impact of

6
ongoing economic weakness on traffic volumes. The possibility that the nearby M2 will be
tolled at some point in the future might see some traffic diverted back to the M1.
The key lesson to be gleaned from the experience of the M1 - and it applies to the wider body
of road infrastructure investment in Ireland over the last two decades - is: “context is king”.
It was well-established that Ireland’s road infrastructure and institutional structures were
inadequate, and the solutions had been identified. Little action had followed, mainly for fiscal
reasons (public capital was invariably the first victim of economic downturns in Ireland), but
also possibly because of lack of political and social consensus on where and how to invest the
State’s scarce resources.
Also, by the late 1980s, Ireland was slowly emerging from a major fiscal crisis and the return of
largescale emigration which had not been seen since the 1950s. The crisis had only been
halted by painful fiscal retrenchment, introduced by a minority Government but made possible
by broad political and social consensus on the remedies required. This consensus included a
process that became known as “social partnership”, involving the State, trade unions and
employers’ representatives, which traded tax reductions for pay restraint. It was a watershed
moment in the history of the Irish State, triggered a significant turnaround in the fortunes of
the economy, and is generally seen as a key element in the emergence of the Celtic Tiger.
Thus, as the 1980s were coming to an end, two out of three key requirements were in place:
(1) knowledge of what needed to be done, and (2) socio-political consensus to facilitate a
focussed programme of investment. The missing factor was money, and borrowing was
problematic because of the overhang of public debt.
At this point the expanded ERDF and Cohesion Funds came on the scene. Ireland drew up
National Development Plans and succeeded in gaining a disproportionately large share of
these funds in the 1989-1993 and 1994-1999 rounds. This became a virtuous circle. The EU
funds made the National Development Plans feasible and thus created a strong incentive to
“do it right” (put together a good plan and implement it properly and on time), in order to
make sure that no funding was lost.
As the 1990s progressed, the Celtic Tiger began to emerge, and the process of ending decades
of civil strife in Northern Ireland (particularly relevant for the M1) began to bear fruit.
Infrastructure investment was one of the catalysts for economic growth and in turn was
justified by it.
As Ireland entered the 2000s, EU funding reduced, but the economy continued to grow and
the Exchequer was in a sufficiently strong position to take over the funding of even more
ambitious investment programmes, including the completion of the M1 and the M50 (and its
subsequent expansion) as well as the Northern Post Access Tunnel which linked the M1 and
M50 to Dublin port. In a period of little more than two decades, Ireland went from having no
motorways at all to a network of over 700 km, with all the major urban centres linked by
motorways. While arguments can be made that the level of investment was excessive, it is
likely that important network benefits were generated.

7
Thus the M1 caught a fair wind from many directions, which helped its delivery and provided
the subsequent growing demand for its services.
The EU Commission’s role was notably positive in the Irish experience, particularly in the
1990s, and points to the scope the Commission has to leverage positive change through
infrastructure funding.
The degree to which the lessons learnt are transferable to other countries and circumstances
will vary from case to case. It may prove difficult to reproduce a similar combination of positive
circumstances. On the other hand the positive leverage the Commission can apply
institutionally and in terms of management is likely to be stronger in most other countries than
it was in Ireland during the 2000s.

8

9
1 PROJECT DESCRIPTION
1.1 KEY FEATURES OF THE INFRASTRUCTURE AND SERVICE DELIVERED
The M1 motorway is the key route stretching northwards from Dublin to the border with
Northern Ireland. As Figure 1.1 indicates, it forms part of the TEN-T United Kingdom-Ireland-
Benelux Road Axis (Priority Axis No.13), which links the three main cities on the island of
Ireland with Great Britain and Continental Europe. The M1 replaced the N1, a mostly single
carriageway road passing through a number of towns and villages on the route.
Figure 1.1 TEN-T UNITED KINGDOM-IRELAND-BENELUX ROAD AXIS
Source: EU Commission (2005)
The M1 motorway officially begins where the Dublin Port Access Tunnel ends and the Coolock2
interchange begins. The Coolock to Dublin airport section was completed in the mid-1980s.
From Coolock it forms a junction with the M50 Dublin ring road and continues past Dublin
Airport. The M1 ends at Ballymascalon just north of Dundalk. After Dundalk the road has a
dual carriageway designation (named the N1) until it reaches the border with Northern
Ireland, where it becomes the A1 dual carriageway. The A1 eventually joins the Northern
Ireland M1 which continues to Belfast. (See Annex III Glossary of Terms for definitions of
motorway and dual carriageways for the purposes of this report).
2 A suburb of North Dublin.

10
For the purposes of this report we are considering the M1 motorway from the Dublin Airport
interchange (Junction 2) to the end of the Dundalk Western Bypass at Ballymascalon (Junction
18), as set out in Figure 1.2 overleaf. This road consists of a mostly two lane (plus hard
shoulder) motorway3, is 83 km long4 and includes seventeen junctions.
The motorway replaces the old N1 national route, which passed through a number of towns.
Figure 1.2 shows the old route in pink and the new route in blue. After the opening of the new
motorway the old road was re-designated as the R132 regional route.
Figure 1.2 NEW M1 (WITH JUNCTIONS MARKED) AND OLD N1
Source: Authors
The completion of the road necessitated the construction of 94 bridges to cross various
streams, rivers, minor roads and the Dublin to Belfast railway line at various points. There is a
toll plaza between junctions 7 and 8 on the Drogheda bypass.
3 Some short exceptionally busy lengths of the motorway (e.g. passing Dublin airport) are three lane.
4 The route was constructed in sections, which when they were opened had to link to as yet uncompleted sections, and in all some
85km of motorway were constructed, as well as a number of stretches of non-motorway link roads. However, when completed the entire length of the motorway is 83 km.

11
The motorway was delivered in seven sections over 16 years, 1989 to 2005 (Figure 1.3). It was
only the second motorway to be commenced in Ireland, the first being the M50 ring road
around Dublin.
Figure 1.3 SEQUENCE OF COMPLETION OF SECTIONS OF M1 MOTORWAY
Source: Authors
1.2 CONTEXT
In brief, the context for the investment was the well-established need to improve the old N1
route, and in particular to by-pass the various towns and villages through which the route
went. The objective was to increase capacity, reduce the length and variability of journey
times, to reduce accidents and to relieve congestion and improve the environment in by-
passed towns.
While various plans were made over the decades to comprehensively improve the road, only
limited progress was made until the launch of the Operational Programme on Peripherality
Dundalk Western Bypass (2005)
Dunleer – Dundalk Road (2001)
Dunleer Bypass (1993)
Drogheda Bypass (2003)
Balbriggan Bypass (1998)
Lissenhall – Balbriggan (2003)
Cloghran – Lissenhall (2003)

12
1989 – 1993 (OPP), and its successor the Operational Programme for Transport 1994-1999
(OPTRANS).
The completion of the first section of the road, in 1994, coincided with the start of the “Celtic
Tiger” era in Ireland, during which the economy (see Box 2.3), the population and the vehicle
fleet5 grew at exceptional rates (Figure 1.4). There is clearly a strong correlation between the
fleet size and GDP6. In this period Irish incomes rapidly converged with and eventually
surpassed EU average levels, peaking at 148% of EU27 GDP per capita in 2007, but still at 127%
in 20107.
Figure 1.4 IRISH GDP AND POPULATION GROWTH, EU GDP GROWTH, INDEX 1990 =
100
Source: CSO, Eurostat
The context for the road is discussed in more detail in Section 2.1.
1.3 TARGET POPULATION
The motorway passes through three EU NUTS 3 regions:
Dublin (containing Fingal County),
Mid-East (containing County Meath) and
Border (containing County Louth) (Figure 1.5).
5 A consistent national series of traffic volumes pre-2000 is not available.
6 Correlation coefficient = 0.984.
7 http://epp.eurostat.ec.europa.eu/tgm/table.do?tab=table&init=1&plugin=1&language=en&pcode=tsieb010

13
Figure 1.5 REGIONS AND COUNTIES THROUGH WHICH THE M1 PASSES
Source: Authors
Table 1.1 sets out the populations in these regions/counties in the most recent two Censuses
of Population.
Table 1.1 POPULATION OF REGIONS AND COUNTIES THROUGH WHICH THE M1 PASSES
Area Population (2011) Population (2006) Change 2006-2011 % age change
Dublin 1,270,603 1,187,176 83,427 7.0%
Mid - East 530,437 475,360 55,077 11.6%
Border 514,152 468,375 45,777 9.8%
Fingal 273,051 239,992 33,059 13.8%
Meath 184,034 162,831 21,203 13.0%
Louth 122,808 111,267 11,541 10.4%
State 4,581,269 4,239,848 341,421 8.1%
Source: Central Statistics Office. 2011 populations are preliminary
Table 1.2 sets out the population of the towns through which the old N1 route went.

14
Table 1.2 POPULATION OF TOWNS BY-PASSED BY NEW ROUTE
Town Population (2006)
Dundalk 35,085
Castlebellingham/Kilsaran 816
Dunleer 2,340
Drogheda 35,090
Julianstown/Whitecross 615
Balbriggan 15,559
Swords* 33,998
* Swords was bypassed by an at-grade dual carriageway in 1984. Source: Central Statistics Office
1.4 CURRENT PERFORMANCE
The motorway was completed in sections, as shown in Figure 1.3. Figure 1.6 summarises the
traffic volumes on the various sections since 1994. Volumes are clearly heaviest at the
southern end of the motorway, closest to Dublin, and tend to decrease the further north one
goes.
Figure 1.6 AADTS* ON SECTIONS OF M1 MOTORWAY SINCE OPENING
*AADT = Annual Average Daily Traffic. Source: NRA, CRG, DKM interpolations
Volumes also reflect the economic growth in Ireland over the last two decades8. Since the
completion of the final section of the M1 motorway in 2005, however, Ireland has experienced
severe recession, and this has been reflected in the traffic volumes recorded in more recent
years. 8 Correlation coefficient between GDP and Dunleer Bypass traffic volumes (the longest available series for a section of the new
road) is 0.94.

15
Volumes on most sections of the road were below their peak in 2010, and overall 2008 has
been the busiest year on the route to date. Latest data for 2011 is limited, but does appear to
indicate that traffic volumes may have stabilised.
Table 1.3 AADT GROWTH ON SECTIONS OF M1
Cloghran - Lissenhall
Lissenhall - Balbriggan
Balbriggan Bypass
Drogheda Bypass
Dunleer Bypass
Dunleer Dundalk
Dundalk Western Bypass
Annual Avg Growth since opening
3.6% 3.2% 3.5% 2.6% 9.1% 5.9% 1.8%
Peak Year 2010 2008 2008 2007 2008 2008 2008
%age reduction from peak to 2010
0.0% -5.5% -7.0% -13.8% -6.3% -8.0% -8.5%
Source: NRA
Two interesting features are apparent in Table 1.3:
i. Volumes on the most southerly section of the road, Cloghran-Lissenhall, while falling
marginally in 2009, rose to their highest levels yet in 2010.
ii. The tolled section, the Drogheda Bypass, is also the section with the steepest decline
from peak, and the first section to experience a decline (in 2008). This may be
reflective of an additional heightened sensitivity to tolls, in the context of the
economic downturn.

16

17
2 ORIGIN AND HISTORY
2.1 CONTEXT FOR THE PROJECT
While delivery of the new M1 commenced in 1989 and was continued over the following 16
years, it had been well-established in numerous studies and reports that there was a need to
improve the route, based on traffic volumes and accident rates, and to by-pass the various
towns and villages through which the route went.
The construction of motorways in Ireland has proceeded in tandem with the evolution of the
institutions which planned and developed them. This is evident from the earliest
documentation available to us as we researched this project. The 1964 Government report
Second Programme for Economic Expansion (Part II), recognised that most traffic growth had
occurred primarily on “main roads” as opposed to county roads. It was noted that: “congestion
on the main roads hinders the development of agriculture, industry, commerce and tourism”
(p. 210).
Previous investment on roads had been much less focused on specific routes and it was
proposed to set up a road fund in central government for the capital funding of the as of yet
undefined “arterial routes”. Priority was to be given to those arterial routes radiating from
Dublin, for some of which dual-carriageway standards were already deemed necessary.
In 1964 the National Institute for Physical Planning and Construction Research (An Foras
Forbartha or AFF) was established. It had a dedicated research section on roads and was the
main source of technical and engineering advice to the Government9.
The Minister for Local Government in 1965 designated “arterial roads” (which could
incorporate motorways), for the purposes of identifying the routes most crucial to the
country’s future economic development. A “Road Fund” was established within the
Department for the funding of these strategic corridors10. The far researching consequences of
this designation are obvious from Figure 2.1, which compares the original arterial designation
and Transport 2111, the state’s most recent official road infrastructure policy. Table 2.1 outlines
the straightforward arithmetic for choosing these roads: they had the most traffic.
In 1966 the Department for Local Government commissioned AFF to investigate if
administration of the arterial road network would be improved if directed under a central
authority. At the time there was no central planning for routes of national significance and
responsibility for all planning, design and construction of roads lay with the local authorities.
9
AFF was a distant ancestor of the National Roads Authority (NRA). 10
At the time local authorities funded road expenditure via ad-hoc grants from central Government and local taxes. Road maintenance was wholly financed by the local authorities. 11
http://www.transport21.ie

18
Figure 2.1 ARTERIAL ROADS IN 1965 AND CURRENT GOVERNMENT TRANSPORT
POLICY (TRANSPORT 21)
Source: Hayes and Sheedy (1966) and www.transport21.ie
Table 2.1 ANNUAL TRAFFIC PER MILE OF ROAD IN COUNTY COUNCIL AREAS,
EXCLUDING COUNTY BOROUGHS IN 1964
Category of road Length (miles) Traffic per mile of road
Arterial roads 1,461 646,000
Major main roads 1,508 255,000
Other rural roads 47,909 69,500
Urban roads 441 258,000
All roads 51,319 93,100
Source: Hayes and Sheedy (1966)
The arterial routes defined in 1965 were modified slightly in 1969 and renamed National
Primary routes. A Road Needs Study published by the Department of Local Government (DoLG)
in 1966, highlighted a backlog of 204 miles of “critically deficient sections” and forecast that
each year a further 28 miles would be become critically deficient due to traffic growth. It
concluded that over a ten year period an estimated expenditure of IR£45 million (1966 prices,
EUR 1,040 million in 2011 prices12) would be required to take road to a tolerable standard.
Hayes and Sheedy (1966) outline the main institutional and technical constraints on any future
programme for the arterial roads, notably a lack of technical engineering expertise in most
local authorities
12
Applying the CPI from 1966 to 1985 and the new road construction deflator from 1985 to 2011 (the latter is only available from 1985)

19
The report proposed the establishment of a new roads authority either as part of the DoLG or
as a separate entity. This would allow the necessary build-up of expertise to be concentrated
within a single institution.
The authors also note that the Minister for Local Government had “agreed in principle” with
the need to build a motorway from Whitehall to Blake’s Cross in Dublin. Much of this
corresponds to the Cloghran–Lissenhall stretch of the M1 motorway which was finally
constructed in 2003.
While the recommendations of the report were not implemented immediately, they were well
flagged at the time. Media reports indicated that the Government was drawing up plans to
transfer powers for the improvement of the arterial roads from the local authorities to the
Department of Local Government. One report suggested that a motorway from Dublin towards
Drogheda should be built “as a first priority” 13.
Some of the report’s recommendations were implemented in legislation in 1974 through the
Local Government (Roads and Motorways Act). Important elements of the act were:
It gave local authorities the power to construct motorways,
It gave the Minister of Local Government powers to direct local authorities in relation
to the arterial routes,
It gave the Minister powers to direct planning and execution of arterial roads works,
It gave the minister the power to declare a road to be part of the arterial network.
The 1972 Dublin Transportation Study comprehensively investigated the transport needs of the
region, and a motorway was again recommended for the Cloghran–Lissenhall section. Beyond
this point a dual carriageway was deemed sufficient, based on the traffic counts at the time,
but the report indicated that “national considerations” might warrant the construction of a
motorway along the entire route.
The next national level report dealing specifically with development of the road network was
the 1974 Road Needs Study on National Primary Routes. This report was not published, and we
have been unable to access a copy. However, Barrett (1975) presents the following
prioritisation of the backlog of road improvements required on the N1, identified in the 1974
report:
13
http://www.irishtimes.com/newspaper/archive/1969/0204/Pg011.html

20
Table 2.2 PRIORITISATION OF ROAD IMPROVEMENTS ON N1, 1974 ROAD NEEDS
STUDY
Year Road Type Became/Will Become Inadequate (LOS D)
Section Existing Road Wide Two-way Road
Dual Carriageway Length of Section (km)
Airport/Dublin city Pre-1968 Pre-1968 1977 2.2
Dundalk to Greenore Junction 1968 1974 1990 0.9
Swords/ Dublin Airport 1972 1969 1986 2.2
Balbriggan/Swords 1970 1973 1999 16.3
Dundalk/Castlebellingham 1973 1975 1993 9.6
Dunleer/Drogheda 1973 1978 1999 12.5
Source: Barrett (1975)
The column entitled “Dual Carriageway” identifies the year in which it was forecast that a dual
carriageway would be inadequate for the traffic volumes, and that a motorway would be
required. The first two sections identified are outside the extent of the road as defined for the
current report. The Swords/Airport section is part of the Cloghran/Lissenhall section as defined
in the current report. These three sections are all very short, comprising less than 6km
between them.
The next three sections, which comprise 38km between the towns of Swords and Balbriggan
and Drogheda and Dundalk, were forecast to require upgrade to motorway during the course
of the 1990s. It is interesting to note that a greater emphasis than one would expect a priori
has been placed on the most northern sections of the road. These roughly correspond to the
Dunleer Bypass, the Dunleer–Dundalk Road, and the Drogheda bypass north of Drogheda.
Without access to the original 1974 report, we are not in a position to investigate this further,
but we have located a reference to it in Walsh (1982). His paper includes an extract from the
1974 study where the future needs of the road are predicted based on a target Level of Service
C. We believe that the original 1974 study predicted future needs for a range of service levels,
thus providing a menu of choice for the policy maker.
Table 2.3 PREDICTED FUTURE NEEDS OF N1 ROAD, 1974 ROAD NEEDS STUDY
Year Road Type Became/Will Become Inadequate (LOS C)
Section Existing Road Wide Two-way Road
Dual Carriageway 2 Lane Motorway
Dublin Airport/Swords Pre-1968 Pre-1968 1979 1986
Swords/Balbriggan Pre-1968 1971 1988 1999
Balbriggan/Drogheda Pre-1968 1974 1989 1996
Drogheda/Dunleer Pre-1968 1975 1991 1999
Dunleer/Castlebellingham Pre-1968 1976 1992 2000
Castlebellingham/Dundalk Pre-1968 1972 1986 1993
Dundalk/Greenore Junction Pre-1968 1971 1984 1990
Source: Walsh (1982)
21
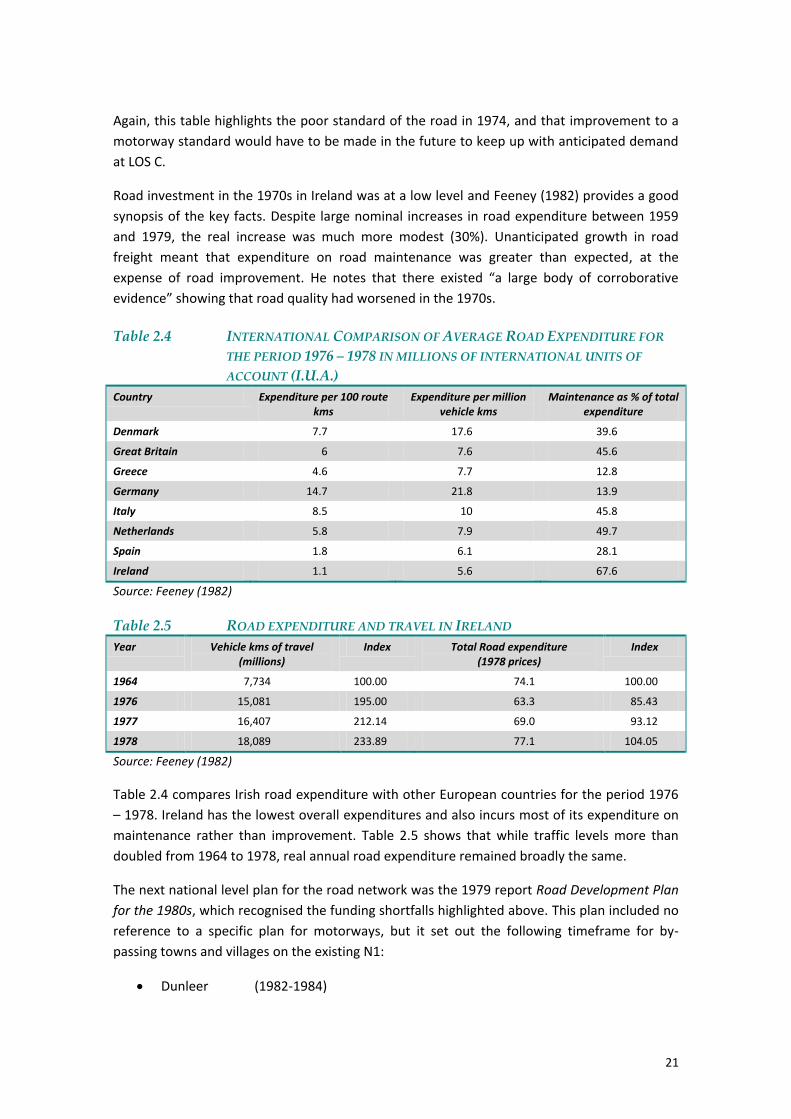
Again, this table highlights the poor standard of the road in 1974, and that improvement to a
motorway standard would have to be made in the future to keep up with anticipated demand
at LOS C.
Road investment in the 1970s in Ireland was at a low level and Feeney (1982) provides a good
synopsis of the key facts. Despite large nominal increases in road expenditure between 1959
and 1979, the real increase was much more modest (30%). Unanticipated growth in road
freight meant that expenditure on road maintenance was greater than expected, at the
expense of road improvement. He notes that there existed “a large body of corroborative
evidence” showing that road quality had worsened in the 1970s.
Table 2.4 INTERNATIONAL COMPARISON OF AVERAGE ROAD EXPENDITURE FOR
THE PERIOD 1976 – 1978 IN MILLIONS OF INTERNATIONAL UNITS OF
ACCOUNT (I.U.A.)
Country Expenditure per 100 route kms
Expenditure per million vehicle kms
Maintenance as % of total expenditure
Denmark 7.7 17.6 39.6
Great Britain 6 7.6 45.6
Greece 4.6 7.7 12.8
Germany 14.7 21.8 13.9
Italy 8.5 10 45.8
Netherlands 5.8 7.9 49.7
Spain 1.8 6.1 28.1
Ireland 1.1 5.6 67.6
Source: Feeney (1982)
Table 2.5 ROAD EXPENDITURE AND TRAVEL IN IRELAND
Year Vehicle kms of travel (millions)
Index Total Road expenditure (1978 prices)
Index
1964 7,734 100.00 74.1 100.00
1976 15,081 195.00 63.3 85.43
1977 16,407 212.14 69.0 93.12
1978 18,089 233.89 77.1 104.05
Source: Feeney (1982)
Table 2.4 compares Irish road expenditure with other European countries for the period 1976
– 1978. Ireland has the lowest overall expenditures and also incurs most of its expenditure on
maintenance rather than improvement. Table 2.5 shows that while traffic levels more than
doubled from 1964 to 1978, real annual road expenditure remained broadly the same.
The next national level plan for the road network was the 1979 report Road Development Plan
for the 1980s, which recognised the funding shortfalls highlighted above. This plan included no
reference to a specific plan for motorways, but it set out the following timeframe for by-
passing towns and villages on the existing N1:
Dunleer (1982-1984)

22
Julianstown (1984 – 1985)
Dundalk (1987 – 1989)
Balbriggan (1987 – early 1990s)
The year 1983 saw the first official proposals at county level to develop the route into a
motorway. These appeared in the County Development Plans of Dublin and Louth County
Councils. However, the Local Authorities lacked the resources to develop motorways, and
delivery of these plans was dependent on funding from the Central Exchequer.
The next policy document to emerge was Policy and Planning Framework for Roads
(Department of the Environment14, 1985), essentially a review of progress made since the
1979 plan. It also included some new objectives for further road investment. The report notes
that the government had not met its spending objectives as set out in the 1979 publication.
Figure 2.2 A REVIEW OF THE 1980S PLAN SPENDING PROPOSALS WITH FUTURE
PROJECTIONS
Source: Policy Planning Framework for Roads (1985)
A severe fiscal crisis developed in Ireland over the course of the 1980s (Figure 2.3), however,
following a fiscally stimulated boom in the late 1970s and the international debt crisis of 1981.
This placed severe restrictions on the State’s capacity to deliver major infrastructure projects.
(Honohan & Walsh, 2002)
14
The Department of Local Government was renamed the Department of the Environment in 1977.

23
Figure 2.3 IRELAND GOVERNMENT DEBT TO GDP RATIO, 1980 TO 2011
Source: Trading Economics.com; Eurostat
Notwithstanding these difficulties, some improvement works had been carried out on the N1
over the years:
The road was up-graded to an at-grade (“Type 2”) dual carriageway in its south-most
section, by-passing Swords town, in 1984;
A new dual carriageway bridge15 was built in Drogheda town, opening in 1976, and a
short section of the road going through Drogheda town connecting with this bridge
was upgraded to at-grade dual carriageway in 1985;
An at-grade dual carriageway inner relief road along the eastern edges of Dundalk
town, was built in four phases over a number of years, commencing in 1968 and being
completed in 199616. It was only on completion that the road effectively acted as a by-
pass.
A major step forward was the launch of a series of National Development Plans and related
Operational Programmes dealing with transport infrastructure. Within the context of
largescale co-funding under the ERDF and Cohesion Funds during the late 1980s and 1990s,
these programmes planned (and more essentially funded and delivered) a range of
infrastructure investments in Ireland over the last two decades, including the M1 motorway
from Dublin to Dundalk.
The relevant plans and programmes were:
The National Development Plan (NDP) 1989-1993, which included the Operational
Programme on Peripherality 1989 – 1993 (OPP),
The National Development Plan 1994-1999, with its constituent Operational
Programme for Transport 1994-1999 (OPTRANS),
15
http://www.engineersireland.ie/sector_papers/Concrete_bridges_photographs.pdf 16
The first two phases were completed in 1982, but there was no further progress until 1989, due to funding difficulties.

24
The National Development Plan 2000-2006, with its constituent Operational
Programme for Economic Infrastructure 2000-200617.
According to the Operational Programme for Peripherality (1989), the motorway was to be
delivered in stages as follows:
Dunleer Bypass (1989-1993)
Balbriggan Bypass (1993-1996)
Dundalk Bypass (1993-1997)
This was followed by the Operational Programme for Transport (1994) which gave immediate
priority to the Dunleer-Dundalk section (1996-2001) and the Balbriggan Bypass (1995–1998).
The OP also mentions the Drogheda Bypass and the Cloghran-Lissenhall as projects which were
in the planning process, and would be considered for funding.
In the late 1980s the minority Irish government, with cross-party support, finally took steps to
reign in public expenditure and reduce the national debt to more sustainable levels. EU
support for infrastructure investment while the fiscal consolidation was underway was a very
useful enabler for this adjustment process.
Summarising project applications and final reports submitted to the Cohesion Fund, the stated
objectives of the M1 motorway were:
i. Help alleviate the impact of Ireland’s peripheral location, particularly by reducing
transport costs by facilitating the competitiveness in the production and export of
goods.
ii. Provide essential infrastructure support for economic (particularly industrial and
tourism) development by improving access to ports, airports and the main domestic
markets.
iii. Improve access to the NUTS sub-regions (Border, Midlands, Mid-East and South East
enhancing its attractiveness as a location for investment and economic development.
iv. Improve transit times, safety levels and level of service.
v. Improve access between Dublin and Belfast and the towns in between.
vi. Contribute to the provision of a consistent standard of motorway.
vii. Improve environment quality (noise and vehicle emissions) and reduce vehicle/
pedestrian and cyclist conflict.
17
The current plan is the National Development Plan 2007-2013, which includes an Economic Infrastructure Priority, with a Transport Programme and a Roads Sub-Programme.

25
viii. Relieve the bypassed towns of congested traffic which would pass through the towns
had the motorway not been built, and facilitate the development of the bypassed
towns.
Box 2.1 WHY WAS THE DUNLEER BYPASS BUILT FIRST?
Before the completion of the Dunleer Bypass in 1993, the corresponding section of the N1 had often been noted as a particularly dangerous stretch of road. Government reports in the early 1970s noted that the road had “very significant accident densities”, which was the worst grading possible.
Carroll (1992) notes that throughout the 1970s there had not been much improvement in this regard. He summarises further traffic studies carried out by AFF in the 1970s, and notes that many points on the road had accident rates that were described as “out of control”. The danger level of the road had also been highlighted in the media (Irish Times 6th July 1983 described it as “our most dangerous national route”). Interviews with engineers at Louth County council also confirm that the Dunleer Bypass was prioritised because of the danger of the old road.
Between 1966 and 1984 there were 32 fatal accidents on the old road18, an average of 1.68 per year. The motorway has brought a very substantial improvement. Road Safety Authority (RSA) statistics for the period 1996 – 2009 indicate only two fatal accidents on the new Dunleer bypass, an average of 0.14 per year. This is all the more remarkable when one considers that traffic on this section is four times greater than on the old road (2010 AADT was 31,032 versus an AADT of 7,536 for the old road in 1984).
Interviews with NRA personal indicated that the Balbriggan Bypass was also prioritised for similar if less extreme reasons. Preliminary CBA analysis also showed that it would provide large time savings for journey times.
In 1984 Swords had been bypassed, so improving the Cloghran to Lissenhall section of the motorway became less urgent. The Dundalk Inner Relief Road was also under construction meaning its traffic needs were being somewhat met. Drogheda was seen as a major bottleneck in the 1980s, notwithstanding improvements already undertaken, but the financial challenge of building a new crossing of the River Boyne meant that less expensive projects were prioritised.
Source: Authors
The M1 was only the second motorway to be commenced in Ireland. The M50 Ring Road
around Dublin, which links all the major radial routes out of the city, commenced in 1987 and
was completed in sections, the final section opening in 2005. There was subsequently a large
programme of providing motorways on all the major inter-urban routes (N1 through to N9),
which was mostly delivered in the 2000s or the early years of the current decade.
18
Louth County Council (1985).

26
Box 2.2 KEY DATES IN THE MOTORWAY’S CONSTRUCTION
1989 –Preparatory works on Dunleer Bypass construction begins
1993 – Dunleer Bypass opens
1996 – Construction commences on Balbriggan Bypass
1998 – Construction Commences on Dunleer – Dundalk road
1998 – Construction commences on Drogheda Bypass
1998 – Balbriggan Bypass opens
2000 – Construction commences on Cloghran-Lissenhall section.
2001 – Dunleer – Dundalk road opens, construction commences on Lissenhall – Balbriggan section
2003 – Construction completed for Cloghran – Lissenhall, Lissenhall – Balbriggan and Drogheda Bypass
2004 - Construction Commences on Dundalk Western Bypass
2005 – Dundalk Western Bypass opens
Source: Authors
The new route also included a number of sizeable structures, including:
Figure 2.4 NOTABLE STRUCTURES ON M1 MOTORWAY
Boyne Bridge is situated 3km west of
Drogheda town. It was the first major
cable-stayed bridge in Ireland and is 352m
long with a main span of 170m. The pylon
is 93m high from its base at the river. It
was designed to have minimal impact on
the river bed, and on the Special Areas of
Conservation (SACs) on either river bank,
as well as on the nearby site of the Battle
of the Boyne. Source : O’Donovan et al. (2003)
Broadmeadow estuary crossing is situated
just east of the town of Swords, north of
Dublin. It was especially designed to take
account of the numerous environmental
amenities of the Broadmeadow estuary
which the bridge crosses. It is a five span
bridge, consisting of two separate
structures for traffic flowing in each
direction. The total length of the bridge is
313m.
Source: Caffrey, Burton and Higgins (2003)

27
Ballynahattin Railway Bridge is 79m long,
12m high and is split over four spans. It
was designed to carry trains over the M1
motorway just north of Dundalk, where
the Dublin to Belfast line crosses. In order
to minimise disruption to train services
during its construction, it was built using
an innovative “sliding process” 19.
Figure 2.5 NET MIGRATION IRELAND 1987-2010 (‘000S)
Source: CSO
Figure 2.6 CPI INFLATION 1990-2011 (%)
Source: CSO
19
The bridge’s construction involved using for the first time in Ireland a technique known as “Autoripage”, patented by French engineering company JMB Methodes. The bridge is constructed very near it final destination and slid into place using hydraulic rams and cables. In this case train services were disrupted for four days over the Easter weekend in 2005. See
http://www.nra.ie/Publications/DownloadableDocumentation/file,17569,en.pdf and
http://www.irrs.ie/Journal%20165/165%20Ballynahattin.htm.
28
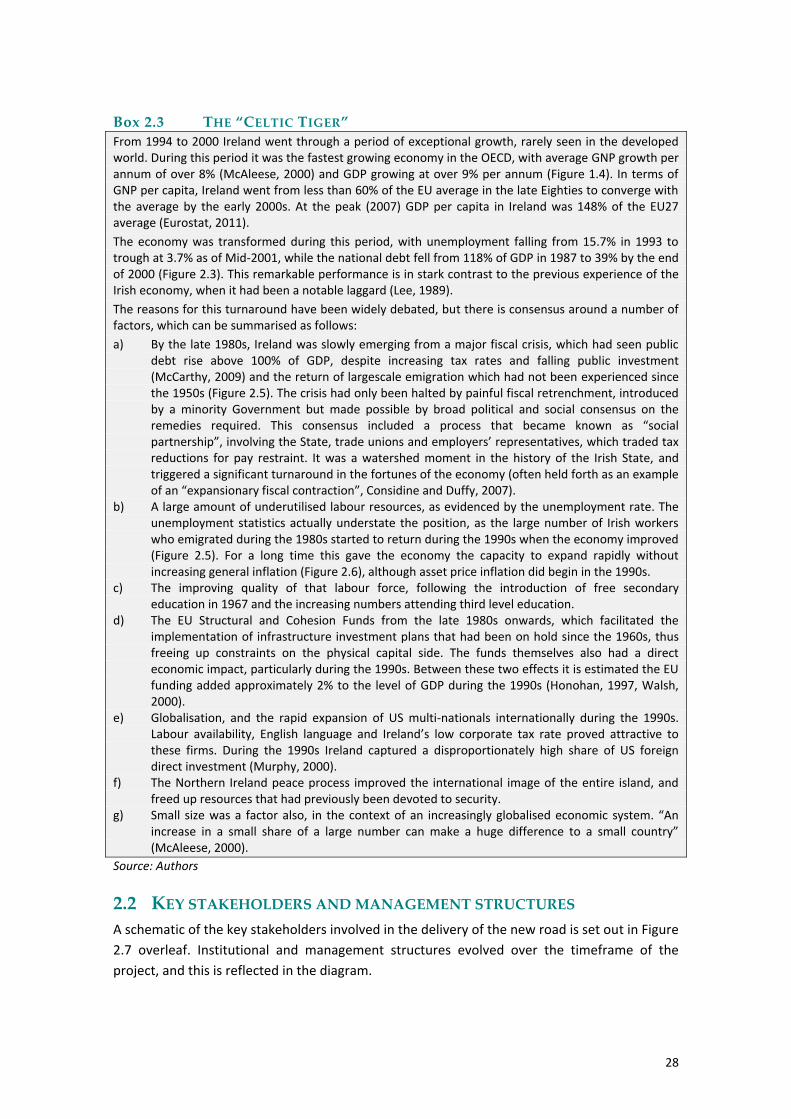
Box 2.3 THE “CELTIC TIGER”
From 1994 to 2000 Ireland went through a period of exceptional growth, rarely seen in the developed world. During this period it was the fastest growing economy in the OECD, with average GNP growth per annum of over 8% (McAleese, 2000) and GDP growing at over 9% per annum (Figure 1.4). In terms of GNP per capita, Ireland went from less than 60% of the EU average in the late Eighties to converge with the average by the early 2000s. At the peak (2007) GDP per capita in Ireland was 148% of the EU27 average (Eurostat, 2011).
The economy was transformed during this period, with unemployment falling from 15.7% in 1993 to trough at 3.7% as of Mid-2001, while the national debt fell from 118% of GDP in 1987 to 39% by the end of 2000 (Figure 2.3). This remarkable performance is in stark contrast to the previous experience of the Irish economy, when it had been a notable laggard (Lee, 1989).
The reasons for this turnaround have been widely debated, but there is consensus around a number of factors, which can be summarised as follows:
a) By the late 1980s, Ireland was slowly emerging from a major fiscal crisis, which had seen public debt rise above 100% of GDP, despite increasing tax rates and falling public investment (McCarthy, 2009) and the return of largescale emigration which had not been experienced since the 1950s (Figure 2.5). The crisis had only been halted by painful fiscal retrenchment, introduced by a minority Government but made possible by broad political and social consensus on the remedies required. This consensus included a process that became known as “social partnership”, involving the State, trade unions and employers’ representatives, which traded tax reductions for pay restraint. It was a watershed moment in the history of the Irish State, and triggered a significant turnaround in the fortunes of the economy (often held forth as an example of an “expansionary fiscal contraction”, Considine and Duffy, 2007).
b) A large amount of underutilised labour resources, as evidenced by the unemployment rate. The unemployment statistics actually understate the position, as the large number of Irish workers who emigrated during the 1980s started to return during the 1990s when the economy improved (Figure 2.5). For a long time this gave the economy the capacity to expand rapidly without increasing general inflation (Figure 2.6), although asset price inflation did begin in the 1990s.
c) The improving quality of that labour force, following the introduction of free secondary education in 1967 and the increasing numbers attending third level education.
d) The EU Structural and Cohesion Funds from the late 1980s onwards, which facilitated the implementation of infrastructure investment plans that had been on hold since the 1960s, thus freeing up constraints on the physical capital side. The funds themselves also had a direct economic impact, particularly during the 1990s. Between these two effects it is estimated the EU funding added approximately 2% to the level of GDP during the 1990s (Honohan, 1997, Walsh, 2000).
e) Globalisation, and the rapid expansion of US multi-nationals internationally during the 1990s. Labour availability, English language and Ireland’s low corporate tax rate proved attractive to these firms. During the 1990s Ireland captured a disproportionately high share of US foreign direct investment (Murphy, 2000).
f) The Northern Ireland peace process improved the international image of the entire island, and freed up resources that had previously been devoted to security.
g) Small size was a factor also, in the context of an increasingly globalised economic system. “An increase in a small share of a large number can make a huge difference to a small country” (McAleese, 2000).
Source: Authors
2.2 KEY STAKEHOLDERS AND MANAGEMENT STRUCTURES
A schematic of the key stakeholders involved in the delivery of the new road is set out in Figure
2.7 overleaf. Institutional and management structures evolved over the timeframe of the
project, and this is reflected in the diagram.

29
The EU Commission with the Irish Government are the providers and controllers of funding, via
the Department of Finance. Under them are the Department of Transport (DoT) and the
Department of the Environment, Community and Local Government (DECLG)20, who were
jointly in charge of delivery of the Operational Programmes.
Underneath them were the Local Authorities, who are the road authorities in Ireland (as well
as the planning authorities), and are responsible for building and maintaining all the roads
within their territories. The relevant Local Authorities were Dublin (later Fingal21), Meath and
Louth county councils.
Figure 2.7 CHART OF STAKEHOLDERS
Key: Contractual Relationships Redundant relationships (discontinued in 2001, 2002) Provides judicial recourse and oversight Disperses funds, provides policy guidance Principal stakeholders in planning approval process
Source: Authors
20
Over the years this government department has undergone numerous name changes. Pre 1977 it was the “Department of Local Government”. In 1977 it was renamed the “Department of the Environment”, in 1997 it was renamed the “Department of the Environment and Local Government, in 2003 it was renamed the “Department of the Environment, Heritage and Local Government, and finally in 2011 it was renamed the “Department of the Environment, Community and Local Government”. 21
In 1994 Dublin County Council was split into Fingal, Dun Laoghaire-Rathdown and South Dublin County Councils. The route runs through the territory of Fingal County Council.

30
During the implementation of the CF programme, these government and EU stakeholders met
every six months to review and assess the progress made on the various infrastructure
projects approved for EU funding. Representatives for the local authorities and semi – state
transport agencies were also present.
As well as being the roads authorities, the Local Authorities were also the planning authorities,
and so were responsible for the planning processes for the delivery of the various sections of
the new motorway. Individuals and organisations could make observations and objections as
part of the planning process. Prior to 2001 the principle stakeholders in the planning approval
process were the citizens/organisations concerned, the local authority advocating the scheme
and the Department of Local Government.
The local authority would publish plans for a motorway and concerned citizens could submit
objections to the Minister for the Environment and Local Government, who would order a
public enquiry by appointing an inspector22 to hear the case for and against the motorway by
the local authorities and any objecting parties23. Subject to the public enquiry advocating
construction of the road, official approval by the Minister of Local Government would still be
required, and it was often the case that this approval was not immediately forthcoming24. In
200125 the Planning Appeals Board (ABP26) replaced the Minister regarding this approval role,
and the local authorities and citizens now appeal road projects to the board. The board is an
independent body and its mission statement27 states that development takes place in an
“efficient, fair and open manner”. In both the new and the old system, the decision of ABP or
the Minister can be appealed to the courts through the process of judicial review. Here the
citizens can challenge only the legality (i.e. that the correct statutory procedures were
followed) of the decision made by ABP or the Minister. This process had the potential to delay
the planning approval process, but in general it proved more problematic in delaying the
approval of other motorway schemes (e.g. the M50) undergoing construction during the
period.
Perhaps the most significant institutional change over the timeframe of the development of
the road was the establishment of the National Roads Authority (NRA), under the Roads Act
199328. The Authority evolved out of and was staffed by engineers of the Roads Section of the
Department of Environment and Local Government.
22
Typically a roads engineer with no vested interests in the scheme 23
This was the procedure followed for the Dunleer bypass for example, see http://www.irishtimes.com/newspaper/archive/1985/0221/Pg017.html when the Minister ordered a public enquiry in 1984 24
For example, in the case of the Cloghran – Lissenhall road, the Minister approved the road three years after the public enquiry
http://www.irishtimes.com/newspaper/ireland/1998/0401/98040100047.html 25
Statutory powers given in the Planning and Development Act, 2000 http://www.irishstatutebook.ie/2000/en/act/pub/0030/index.html and http://www.irishstatutebook.ie/2000/en/act/pub/0030/sec0215.html#sec215 26
An Bord Pleanála. 27
http://www.pleanala.ie/about/missionstatement.htm 28
http://www.irishstatutebook.ie/1993/en/act/pub/0014/index.html

31
The Act gives the Authority “overall responsibility for the planning and supervision of works for
the construction and maintenance of national roads”, as well as powers to enter into tolling
arrangements with private operators.
Despite the NRA’s name, the Local Authorities remain the legally designated road authorities,
i.e. they are responsible for the actual building and maintenance of the roads, albeit under the
direction of and through funding by the NRA. The one exception is in the case of Public private
Partnerships (PPP), where the NRA is the road authority.
The NRA was effectively formed out of the Roads Unit of the Department of the Environment
& Local Government (DELG). Until 2002, it remained under the control of the DELG, at which
point it was transferred to the Department of Transport. Since 2002, the DELG has had no role
in the formation of national roads policy.
Other important developments related to the decision to offer a toll concession on the road,
which was awarded to Celtic Roads Group (CRG)29. This also saw the National Development
Finance Agency (NDFA) having a role. The NDFA was established in 2003 to provide financial
advice to State Authorities undertaking major infrastructure projects, whether by means of
Public Private Partnership (PPP) or traditional procurement, albeit with a focus on the former.
More recently there has been a change in the planning process with respect to major
infrastructure such as motorways. Under the Planning and Development (Strategic
Infrastructure) Act 2006, planning applications for “strategic infrastructure”30 are made
directly to ABP, thus removing the planning authority role of the Local Authorities. However,
this change post-dated the completion of the M1 motorway, and hence was not relevant to its
delivery.
2.3 MAIN DEVELOPMENTS SINCE COMPLETION
Developments since completion of the final section of the M1 motorway in 2005 can be seen
along two dimensions:
i. Sections of the road north of Dundalk have also been upgraded. In late 2008, a dual
carriageway (designated the N1) linking the northern end of the M1 to Newry in
Northern Ireland was opened. In mid-2010, a new dual carriageway (the A1) linking
Newry with the Northern Ireland M1 south of Belfast was opened. These
developments could potentially see further growth in traffic on the M1, possibly due in
part to some modal shift from rail.
29
For details of toll concession see http://www.engineersireland.ie/media/engineersireland/community/whitepapers/Dundalk%20Western%20Bypass-%20PPP%20Scheme.PDF and http://www.nra.ie/PublicPrivatePartnership/ProjectTracker/N1M1DundalkWesternBy-Pass/ 30
“Strategic infrastructure development can generally be described as development which is of strategic economic or social importance to the State or a region. It also includes development which will contribute significantly to the fulfilment of any of the objectives of the National Spatial Strategy or any regional planning Guidelines for an area, or which would have a significant effects on the area of more than one planning authority.” http://www.pleanala.ie/sid/sidpp.htm

32
ii. Since completion of the M1 there has been a very severe recession in Ireland, which
commenced in 2008 and continues to this day. This has been reflected in the
reductions in traffic volumes recorded on many sections of the route in recent years
(see Figure 1.5).
2.4 HAS THE PROJECT STABILISED?
The most recently completed section of the motorway (Dundalk Western Bypass) was
completed in 2005, while the first section (Dunleer Bypass) has been in place since 1993. On
this basis, it is reasonable to expect that the project should have stabilised.
However, the two post-completion developments mentioned above – the severe economic
downturn and improvements to the N1 north of Dundalk and to the A1 in Northern Ireland –
have potential to impact significantly on project performance.
While the Irish economy appears to have stabilised and be slowly emerging from recession,
growth expectations for the foreseeable future are muted31, given the ongoing requirement
for fiscal consolidation, deleveraging of private and public balance sheets, and generally weak
domestic confidence.
There is therefore some uncertainty with regard to future traffic volumes on the route. Traffic
volumes during the 2000s have matched or exceeded levels not forecast to be achieved until
2019 (Table 2.6). However, it may be that volumes in the coming years will come more back
into line with those forecasts. That said, recent regional traffic forecasts generated by the NRA
in 2011 do point to growing volumes over time (Table 2.7).
Table 2.6 TRAFFIC VOLUMES - ACTUAL VS. FORECAST
Section Actual AADTs Forecast AADTs per National Road Needs Study
1977 1995 2010 2019 “Saturation”
Swords-Balbriggan
7,000 24,000 - 42,000 50,524-81,516 52,500-93,500 55,500-98,500
Balbriggan-Drogheda
6,400 12,000 26,205 26,500 28,000
Drogheda-Dunleer
4,800 9,500 31,032 21,000 22,000
Dunleer-Dundalk
5,500-5,800 11,000-21,000 26,201-33,045 24,000-47,000 25,000-49,500
Note: Saturation represents the “maximum traffic level having regard to demographic factors, car ownership and utilisation”; however “the growth of traffic on an individual route linking major growth centres, compared with present traffic flow, is not limited to the saturation ratio”.
Source: Government of Ireland (1979); NRA (1998).
31
Official statistics indicate that the economy GDP fell by 0.4% while GNP grew by 0.3% in 2010. In Q1 2011 GDP grew by 1.3% while GNP fell 4.3% seasonally adjusted (CSO [2011b]). ESRI (2011) expects that GDP will grow by 2% and 3% respectively in 2011 and 2012, and that GNP will grow by 0.5% and 2% in the same years.

33
Table 2.7 NRA FORECASTS OF ANNUAL TRAFFIC GROWTH 2006-2025
Base High Low
Fingal
Light Vehicles 0.5% 1.6% 0.2%
Heavy Vehicles 0.4% 1.4% 0.1%
Louth and Meath
Light Vehicles 1.1% 2% 0.9%%
Heavy Vehicles 0.8% 1.7% 0.5%
Source: NRA (2011)
With respect to improvements to the road north of the border, discussions with CRG personnel
indicate that, while they have experienced no increase in volumes at the toll plaza as a result
of these improvements, they have seen some increased peaking in the traffic flow. This they
ascribe to a reduction in uncertainty with regard to journey time for cross-border traffic32.
From discussion with the NRA, a third possible destabilising factor would be if the nearby M2
motorway was subjected to tolling at some point in the future. While there is no definite plan
to do this, recent newspaper reports indicate that the Government is investigating extension
of road tolling33. Anecdotally, the tolling of the M1 causes some traffic to divert to the untolled
M2, and some of this may revert to the M1 if the M2 is also tolled34.
32
Interview CRG, 18th
August 2011. Increased peaking could be expected when capacity constraints on a route are removed, as a route with capacity constraints will often experience peak spreading as road users seek to avoid the worst peaks by travelling in the shoulder or off-peak periods. 33
http://www.irishtimes.com/newspaper/breaking/2011/0718/breaking44.html 34
Interview Michael Kennedy, NRA.

34

35
3 LONG-TERM DEVELOPMENT
EFFECTS
3.1 KEY FINDINGS
This chapter describes the main long-term development effects provided by the project. In
accordance with the guidance set out in the First Interim Report, seven categories of effects
(listed below) are considered and for each of them an assessment of the contribution of the
project to that specific effect is given. On the most relevant effects, either positive or negative,
descriptions of the timing of their materialisation and evolution are presented. The seven
categories of effects are:
Direct economic growth
Endogenous dynamics
Social cohesion
Environmental effects
Territorial cohesion
Institutional quality
Social happiness.
As discussed earlier, these categories are analysed using two broad methodological
approaches – quantitative (i.e. Cost Benefit Analysis) and qualitative. As a starting point, we
can summarise the nature and strength of the long term impacts of the investment across the
above categories, as well as the degree to which these impacts have been identified and
analysed quantitatively or qualitatively (Table 3.1 overleaf). We also consider the degree to
which short term as well as long term impacts arise (Table 3.2 overleaf). The criteria
considered to assign the scores shown in these Tables are presented in Annex I.
In broad terms, the direct economic impact is identified quantitatively in the CBA, while the
other categories are largely identified qualitatively. However, elements of these other
categories are captured to some extent in the quantitative analysis also.
A complication is that the M1 motorway was one of a number of motorways constructed in
Ireland over the last two decades, albeit it was one of the first. With many of the wider
impacts, it is not straightforward to isolate the impact of the M1. However, given its relative
size and chronology, it can be concluded that it had some substantial influence on the
developments in question.

36
Table 3.1 NATURE, STRENGTH AND EVOLUTION OF LONG TERM IMPACTS
Strength* (-5 to +5)
Level Identified and Analysed
Quantitatively (CBA)
Qualitatively
1. Direct economic growth +5 Regional, national √
2. Endogenous dynamics +4 Regional, national √ √
3. Social cohesion +2 Regional √ √
4. Environmental effects -2 Local, regional, national
√ √
5. Territorial cohesion +3 Regional, national √ √
6. Institutional quality +3 National √
7. Social happiness +2 Local, regional √
*-5 = net highly negative effect; 0 = net neutral effect; +5 = net highly positive effect.
Table 3.2 TEMPORAL DYNAMICS OF THE EFFECTS
Short run (years 1-5)
Long run (years 6- 10)
Future years Comments
1. Direct economic growth
+ ++ ++ Immediate positive effect, improved over time as new sections of the road, and the road extending across the border improved. Stabilised to a large degree
2. Endogenous dynamics
+ ++ ++ Positive effect stabilised in the long-run.
3. Social cohesion + ++ ++ Slightly positive effect stabilised in the long-run.
4. Environmental effects
- -- -- Net negative effect; stabilised in the long-term.
5. Territorial cohesion + ++ ++ Slightly positive effect stabilised in the long-term.
6. Institutional quality + ++ ++ Positive effect stabilised over the long-term.
7. Social happiness + ++ ++ Net positive effect stabilised in the long-run.
Note: + or - Positive or negative effect; ++ or -- Positive of negatively effects reinforced (in positive or negative direction) with respect to the previous stage; +++ or --- Positive of negatively effects further reinforced (in positive or negative direction) with respect to the previous stage; +/- Mixed effect, it is not possible to assess whether the net impact was positive or negative (see Annex I).
Regarding the evolution of impacts, for a long-lived infrastructure project such as a motorway,
the long term impacts are clearly paramount. However, short term impacts do also arise, and
how they interact is of interest.
The primary short term impacts are in terms of direct economic growth, as well as social
happiness. There is an immediate economic impact when a major new motorway addressing a
pre-existing capacity constraint is opened: road users immediately experience the time savings
and other benefits. There is also a well-established pattern of usage with a new road, with an
initial ramp-up period where traffic growth is exceptionally strong. This reflects the period
during which road users are getting used to the new road, and starting to factor it into their

37
travel plans. Eventually volumes stabilise (or growth stabilises at a more modest rate), as the
new road is fully “integrated” into the overall transport network35.
There is a complication with the M1, in that it was built in seven sections over 16 years, so
there was a significant overlap between the ramp-up periods of certain sections and the
stabilised periods of earlier sections. Indeed, given the strong network impacts, it is clear that
as new sections opened they generated fresh impacts on the earlier sections, thus extending
the ramp-up periods considerably (or alternatively generating new ramp-ups).
The other short term direct economic impact relates to the economic activity generated by the
construction of the road, and the technology transfer and building up of technical and
managerial expertise and experience in this process. Some short term impacts are also likely to
arise under the social happiness heading, in terms of civic pride in the new road.
Most of the other impacts are long term in nature, and have arisen over time as a result not
only of the M1 itself but the wider road development programme undertaken in Ireland in the
1990s and 2000s.
As to the relationship between the short and long term impacts, the short term direct
economic road usage related impacts can be seen as having evolved into the longer term
impacts, but it is not clear that the relationship could not be considered causal. The short term
impacts related to the building of the road are likely to have helped to generate some of the
longer term impacts, particularly under the endogenous dynamics and institutional quality
headings. The short term impacts are likely to have had an enduring impact on social
happiness, including the fact that a section of the road was tolled. The long term direct
economic impacts are likely to have helped generate many of the other long term impacts,
notably endogenous dynamics, and social and territorial cohesion.
We can also consider who experiences the various impacts, as set out in Table 3.2 overleaf.
Road users and the toll concessionaire are the main beneficiaries of the direct economic
impacts. The benefits that the road users experience flow through to the wider economy, to
employers, suppliers, consumers and the Exchequer, to the degree that travel is work-related.
The NRA indicates that the proportion of traffic that is work-related varies from 16% for cars (a
further 27% is commuting), to approximately 90% for light goods vehicles to 100% for heavy
goods vehicles36. Direct economic benefits are also experienced by road builders/designers,
and landowners (to the degree that they are over-compensated for land compulsorily
acquired).
Road designers/builders and the NRA are the main beneficiaries of the endogenous dynamics
impacts, and the NRA is also a beneficiary of institutional quality impacts. The other impacts
are spread among local, national and EU Governments and citizens.
35
See for example Kriger et al. (2006). Ramp-up is a particular issue with toll roads, in terms of forecasting future revenues, but also because the “toll culture” in a particular country or region has an impact on the level of resistance to tolls and therefore road usage and revenues. 36
http://www.nra.ie/Publications/DownloadableDocumentation/ProjectAppraisal/file,14148,en.pdf

38
Other modes of transport are also impacted. The competing rail route which is parallel to the
M1 is likely to have suffered from the improvement in the road. Seaports and airports on the
island of Ireland, but particularly in Dublin, are likely to have benefited from improved
connectivity, with increased competition between ports in Dublin and Belfast also occurring37.
37
In recognition of competition pressures from Dublin airport, the UK Government recently reduced airport departure tax for long haul flights from Belfast airports. http://www.ittn.ie/news-features/uk-government-reduces-ex-ni-apd-2/

39
Table 3.3 DISTRIBUTION OF IMPACTS ACROSS STAKEHOLDERS
Stakeholders
Road
Users
Concession Operators
Road Designers,
Builders, etc.
Land-owners
NRA Government & Citizens Other Modes
Local/
Regional
National Neighbouring Member States
EU Rail Air, Sea
1. Direct economic growth +5 +5 +3 +2 +1 +1
2. Endogenous dynamics +4 +4 +1
3. Social cohesion +2 +2
4. Environmental effects -3 +1 -2 -1 -2
5. Territorial cohesion +3 +3 +1
6. Institutional quality +3 +3
7. Social happiness +1 +2

40
Impacts on neighbouring Member State are also relevant, given the proximity of the northern
end of the M1 to Northern Ireland, and its connection with the A1 and M1 routes in Northern
Ireland. As mentioned already, connectivity is improved, but there is also increased
competition within and between transport modes in the two jurisdictions, which benefits users
and the wider economy but potentially damages operators. Economic operators in Britain and
other Member States who do business in Ireland would also be positively impacted by the M1
and the other road improvements in Ireland, as they would benefit from time savings on the
route.
Project impacts are expanded upon and justified in the detailed discussion in the rest of this
chapter, under the seven categories listed above.
3.2 DIRECT ECONOMIC GROWTH
One would expect a major infrastructure investment such as the M1 to contribute to Irish
economic growth, most directly through cutting journey times (Table 3.3) and thus reducing
transport costs. Other direct impacts that could be expected to contribute to economic growth
include reduced accidents as a result of safer road types and reductions in vehicle operating
costs38 39.
Table 3.4 TRAVEL TIME SAVED PER VEHICLE ON OPENING OF EACH SECTION OF M1,
AND 2010 TRAFFIC VOLUMES
Sections Time saving per vehicle (minutes) AADT 2010
Cloghran Lissenhall 1.28 81,516
Lissenhall Balbriggan 3.70 50,524
Balbriggan Bypass 9.55 27,705
Drogheda Bypass 6.08 27,001
Dunleer Bypass 5.03 31,032
Dunleer- Dundalk 4.04 26,456
Dundalk Western Bypass 5.40 20,050
Source: Various ex-post CBAs of road sections, NRA, DKM Estimates.
Values can be placed on the time savings by reference to:
traffic volumes and vehicle type (per NRA traffic counts40);
purpose of journey (per traffic counts and NRA [2008]) and
related value of time, as per guidance in the First Interim Report.
Values can similarly be placed on reduced accidents and changes in vehicle operating costs.
These, along with the capital and operating cost of the road, and the indirect impacts capable
38
EU Commission (2008); NRA (2008); 39
It is unclear prima facie whether there is a net benefit with respect to vehicle operating costs. Vehicles can be used more efficiently, and time-related maintenance costs are reduced, but speeds will be higher, implying more fuel usage, and new road sections may be shorter or longer than the sections they replace. 40
http://www.nra.ie/NetworkManagement/TrafficCounts/

41
of valuation, are used to undertake a Cost Benefit Analysis (CBA) of the project, as set out in
detail in Annex II.
The Annex describes the methodology of the CBA, and presents the financial and economic
Net Present Value (NPV), Internal Rate of Return (IRR) and discounted Benefit Cost Ratio (BCR)
generated by the project, for a project timeframe of thirty years. The financial results relate to
the cash impacts on the road provider/operator, and for the most part could be expected to be
negative (except in respect of the tolled section of the road). The economic results take into
account the various impacts on road users and others affected indirectly by the road.
Note these benefits accrue to all users of the road, regardless of origin. While the majority are
residents of Ireland, a proportion of users are residents of Northern Ireland and further afield.
The CBA is undertaken from the perspective of the EU, and hence does not differentiate
between benefits and costs accruing to Irish as opposed to other stakeholders. See also
discussion of “Territorial Cohesion” later on.
The CBA indicates that the financial NPV of the project amounts to -EUR 0.65 billion, while the
economic NPV amounts to EUR 6.15 billion (2011 prices)41. The results are summarised in
Table 3.5 overleaf. Every section of the road generated a positive economic return, varying
between 12% and 30%42. Only the Drogheda Bypass generated a positive financial return,
because of the related toll revenue43.
That said, our analysis also tentatively indicated that an alternative project with dual
carriageway rather than motorway from the Balbriggan Bypass northwards would have cost
less and generated a somewhat higher NPV. However, the difference in socio-economic NPV is
not large, given the overall values and the timeframe involved, and it may be considered that
the option value of the additional capacity and the avoidance of the risk of an expensive
subsequent upgrade to motorway standard, is worth the extra cost.
41
These results are robust to a range of alternative scenarios. Risk analysis indicated an even higher mean economic NPV, of EUR 6.226 billion. 42
There is some artificiality in the split of benefits by section, based on the AADTs for each section, as there are strong network effects at play. The opening of each new section (particularly at the southern end of the road) generated significant traffic increases on the other sections. However, it would be a difficult task to isolate the true traffic impacts of each section on all the other sections. 43
This is also somewhat artificial, since the toll agreement requires the concessionaire to maintain the north-most four sections of the road (to the northern end of the Balbriggan Bypass) and the toll rates are set partly by reference to this requirement.

42
Table 3.5 SUMMARY OF COST BENEFIT ANALYSIS RESULTS – BASE CASE
Section Length (km)
Capex (EUR million 2011 prices)
capex per km (EUR million 2011 prices)
Year
Opened
AADT 2010
Financial Socio-Economic
NPV (EUR m)
IRR BCR (discounted)
NPV (EUR m)
IRR BCR (discounted)
Cloghran Lissenhall 6.5 149.0 22.8 2003 81,516 -158 -2.2% 0.0 839 23.8% 3.7
Lissenhall Balbriggan 9.9 64.5 6.5 2003 50,524 -70 -2.6% 0.0 343 25.0% 3.7
Balbriggan Bypass 12.5 71.2 5.7 1998 29,918 -113 -2.9% 0.0 1,329 30.9% 6.4
Drogheda Bypass 21.4 181.7 8.5 2003 27,001 132 8.6% 1.8 781 19.6% 3.1
Dunleer Bypass 7.0 59.2 8.5 1993 31,032 -130 -3.0% 0.0 2,415 27.2% 9.4
Dunleer- Dundalk 16.7 145.5 8.7 2001 26,456 -203 -2.6% 0.0 245 11.8% 1.6
Dundalk Western Bypass
11.0 115.5 10.5 2005 20,050 -105 -2.5% 0.0 197 16.3% 2.3
Total 85.0 786.6 9.3 -646 0.6% 0.3 6,150 23.8% 4.2

43
With regard to the impact of the road on Ireland’s endowment of capital, the road represents
a direct addition to the country’s fixed capital endowment. It incorporated an investment of
approximately EUR 790 million in 2011 money, of which approximately 38% was funded by the
EU, i.e. the net cost to Ireland (including private sector cost) was approximately EUR 490
million. Since Table 3.5 indicates that the project generated a highly positive economic NPV,
Ireland’s capital endowment was increased by at least EUR 790 million as a result of the
project.
Significant direct employment would have been created in the construction phase itself. Total
capital cost (2011 prices) was EUR 790 million. Construction Industry Council (2009) estimates
that for every EUR 10 million of expenditure, some 80 work years44 of employment are
generated. On this basis, some 6,300 work years of employment would have been generated
over the 16 years of construction, between the firms building the road and their suppliers in
Ireland. The degree to which this employment was additional, or simply constituted
displacement, is difficult to ascertain.
The unemployment rate in Ireland fell rapidly during the 1990s, and the economy was at or
close to full employment by the end of the decade (Figure 3.1). Moreover, given the boom in
the construction sector, particularly in the early 2000s, the unemployment rate may have been
lower in the construction sector than in the general economy45. On this basis it is reasonable to
assume at least some displacement element in the employment generated by the construction
of the road.
Figure 3.1 UNEMPLOYMENT RATE IRELAND (ILO DEFINITION), 1989-2011
Source: CSO
44
In 2009 money, including direct (those working on the road) and indirect (those working in Irish firms supplying goods and services to the project Ireland) employment. NRA statistics indicate a 10% deflation in road construction prices between 2009 and 2011, so the above estimates of employment generated are conservative. 45
Sectoral unemployment rates in Ireland are not available.

44
With regard to whether the new road attracted new investments to or created new business
opportunities in its hinterland, we know from Table 1.1 that counties Meath and Louth
experienced higher than average population growth between 2006 and 2011. This however,
could be due to a spreading of economic activity or urban sprawl or a combination of both. To
gain some insight we can consider journey to work data from recent Censuses, in Co. Louth, as
follows:
Table 3.6 TOTAL IN WORK AND DISTANCE TRAVELLED TO WORK IN CO. LOUTH,
1996 - 2006
%age Traveling
Census Year
Total in Work
0 km 1 km 2-4 km
5-9 km
10-14 km
15-24 km
25-49 km
50 km + Avg Distance km
1996 31,224 9% 26% 16% 9% 5% 15% 7% 14% 15.9
2006 47,759 1% 10% 24% 16% 10% 11% 14% 14% 18.9
Source: CSO, Census of Population, 1996, 2006
The number of residents of Co. Louth in employment grew by 53% between 1996 and 2006
(compared to 46% growth for the State as a whole). At the same time, distance travelled to
work increased substantially, from an average of 15.9 km to 18.9 km. So while some economic
development certainly occurred, some of the increase in employment was due to residents
travelling further to work. It is reasonable to assume that the road facilitated the latter effect,
but difficult to ascertain the degree to which it directly generated new employment46.
Physical observation of possible economic developments facilitated by the new road does not
indicate an obvious significant increase in economic activity/employment. We are aware of
two large new retail parks on the western edge of Drogheda town, bordering the motorway,
while a significant amount of retail park type activity has also arisen on the old Dundalk Inner
Relief Road and the old Swords Bypass over the last decade or so. How much of this is new
rather than displaced is open to question, however, and there have been some reduction in
this activity in recent years with the economic downturn (a number of units in the respective
parks have closed).
A key element of Irish industrial development policy is the attraction of Foreign Direct
Investment (FDI)47. A number of foreign companies are based in the towns of Drogheda and
Dundalk48. IDA Ireland is the public body with responsibility for attracting FDI to Ireland, and it
built a new industrial park on the western fringe of Drogheda, beside the motorway, which
opened in 200549. It currently has one tenant which employs approximately 250 people50.
46
European Environmental Agency (2006) highlights issues with urban sprawl in Dublin and its hinterland. 47
The significance of the FDI sector in Ireland is reflected in the gap between GDP (national output) and GNP (national income). In 2010 there was a 20% gap between the two reflecting net repatriated profits (CSO [2011b]). 48
http://www.idaireland.com/locations/regions-of-ireland/north-east/ 49
http://www.idaireland.com/locations/business-technology-parks/drogheda/

45
Dundalk has also gained FDI employment in recent years51, although both towns have also lost
significant industrial employment over the last decade52.
In summary, while additional local employment has been generated since the new road
opened, it is not straightforward to identify to what degree the new road contributed to this.
The degree to which activity has been displaced from elsewhere in the State (or in the EU) is
also difficult to say, but prima facie it is unlikely to be significant.
3.3 ENDOGENOUS DYNAMICS
The three main headings under which endogenous dynamics are considered to positively
impact on long term economic growth in the context of infrastructural investment are:
Human capital (including health improvements);
Technological progress (including R&D investments); and
Organisational development.
The M1 was a major infrastructure project, costing over EUR 700 million (2011 money) and
delivered over 16 years. It was also one of the first motorways built in Ireland (the M50 ring
Road around Dublin commenced in 1987, only two years before the M1), and included a
number of innovative engineering elements, as discussed in Chapter 2.
There would have been an increase of knowledge and expertise in the institutions and firms
involved in the management and delivery of the new road, thus improving Irish human capital
and driving organisational development (see later discussion of institutional quality). This
increased knowledge and expertise could be expected to overflow into the building of
subsequent motorways, and possibly into other areas of civil engineering.
The health of the workforce may have been improved at a local level in the by-passed towns
(see later discussion of environmental effects), although the overall impact on human capital
from this would be indirect and limited.
While technological progress per se was not driven by the project, some of the structures on
the M1, notably the bridges, were complex and had requirements to minimise impacts on the
ground. Specialist international firms were utilised in their construction, and there would have
been some transfer of technology to local firms in the process53.
50
Because the park is located just inside the Co. Meath Border and is thus in the Mid-East NUTS 3 region as opposed to the less developed Border region, it is claimed locally that the park is at a disadvantage vis à vis competing locations such as Dundalk, because it can offer less generous incentives to companies. See for example http://www.drogheda-independent.ie/news/ida-business-park-blunder-2194878.html 51
http://www.idaireland.com/locations/regions-of-ireland/north-east/ 52
http://www.independent.ie/national-news/fresh-cutbacks-by-multinational-firms-bring-job-losses-total-to-650-342131.html and http://www.drogheda-independent.ie/Temp/further-job-losses-hit-local-workers-2001421.html 53
See for example O’ Donovan et al. (2003), Dwyer (2009) and http://www.rte.ie/radio1/engineerseye/1160760.html

46
3.4 SOCIAL COHESION
It is open to question the degree to which the M1 motorway contributed to social cohesion per
se. At one level, the cost of transport in the north east of the country was reduced and
connectivity between the region and Dublin, the main economic centre in Ireland54, was
increased. Prima facie it would have opened up more employment opportunities, which the
travel to work data indicate the workforce of Co. Louth succeeded in accessing (see Table 3.5).
On the other hand, it may be that those who were already better off were in a stronger
position to avail of these opportunities.
Ireland went through a period of exceptional economic growth over the last two decades, and
as is the case in many countries in similar circumstances, there was an increase in income
inequality over that period. As recently as 2006, a Government-sponsored report indicated
that Ireland was one of the most unequal societies in the developed world55.
That said, unemployment fell very rapidly between 1994 and 2008 (from approximately 17% to
4.6%) and this had a very significant impact on incomes across the population. It facilitated a
very significant expansion of public and social services, which helped to improve social
inclusion56, including increases in health expenditure, which is partly credited with significantly
increasing life expectancy57. EU funding of this and other roads may have allowed the
Government to redirect expenditure to areas of social spending.
Social cohesion in a society is driven by a wide range of policies, and thus it is difficult to
measure how much of these impacts are attributable to the M1 as such. On balance, it is likely
that the M1 had a mildly positive effect in terms of reducing transport costs and increasing
connectivity, but this must remain a tentative conclusion.
3.5 ENVIRONMENTAL EFFECTS
The M1 motorway has had positive and negative environmental impacts.
On the positive side, the environment for humans in the by-passed towns improved as a result
of the road. However, there are a number of environmental negatives, including:
i. Our CBA (Annex II) has indicated that the new road led to an increase in fuel usage and
consequently in Greenhouse gas (GHG) emissions. A carbon tax of EUR 15 per tonne of
CO2 equivalent was introduced in Ireland in 2010, and to this degree the damage cost
is internalised.
54
Dublin is the economic powerhouse of Ireland. While it is home to approximately 28% of the population (2011 Census preliminary results), some 40% of GDP is generated within its borders. By contrast, the Mid-East and the Border regions generate 9% and 8% respectively of national GDP (CSO [2011a]). Divergence is also seen at the regional (NUTS 2) level. Eurostat (2011) indicates that in 2008, when Ireland’s GDP per capita was 133% of the EU27 average, the value for the Southern & Eastern region was 148% while for the Border Midland West region it was 98%. 55
National Social & Economic Forum (2006), Creating a More Inclusive Labour Market, report No.33. http://www.nesf.ie/dynamic/pdfs/No-33-Creating-a-More-Inclusive-Labour-Market.pdf 56
Whether all of the progress made under this heading will survive the current requirement for fiscal rebalancing is a moot point. 57
Walsh (2008).

47
ii. Localised emissions (notably particulate matter) also increased because of increased
fuel usage. However, since traffic was diverted out of urban areas, the environmental
damage caused by these emissions fell58.
iii. Likewise, increased noise would be generated as a result of the increase traffic
volumes and speeds. As indicated in Annex II however, only a small number of people
are impacted by noise levels above standard thresholds on either the new or old
routes.
iv. The new route would have caused severance in the rural areas through which it
passed. However, the price paid for land compulsorily acquired to build roads in
Ireland specifically includes elements for severance and “injurious affection”59, and as
such the cost of this damage is internalised in the capital cost of the road (albeit the
users do not pay directly for it).
v. The new road passed through a number of sensitive environmental and historic areas,
although significant costs and efforts were expended in (a) minimising the impact on
sensitive environmental areas, including the Boyne Bridge and the Broadmeadow
estuary crossing (see Section 2), and (b) dealing with the archaeology.
vi. The development of the M1 and the resultant reduction in journey times by road may
have reduced the attractiveness of travel by rail along the same corridor, whether the
Dublin-Belfast or the north Dublin outer suburban service. Significant investment has
also been made on these rail services over the last two decades, and the return on this
investment may have been undermined to some degree by the M160, as well as by
improvements in roads in Northern Ireland. The Dublin-Belfast rail link has been losing
market share over the last decade or so61, and this was not helped by the collapse of a
bridge on the line just north of Dublin in 2009, which saw the line out of service for a
number of months62.
Thus there are a number of negative environmental impacts from the road, albeit many are at
least partially internalised in operator or user costs. Given this, we conclude that the overall
environmental impact was mildly negative.
58
Pollution measurements in affected towns were below threshold standards before the bypass was put in place (Annex I). 59
“Severance is defined as the taking of the land acquired from the land retained. It is not just the separation of an area of land from the dwellinghouse, farmyard and the larger area of the holding. Injurious Affection is defined as the damage done to the retained land by the works carried out on and use to be made of these works into the future.” http://www.ipav.ie/Documents/Industry/Magazines/Property_Professional_Sum09.pdf 60
Notwithstanding the investment in rail over the last two decades, we note that there has been no reduction in journey time between Dublin and Belfast since the early 1990s, albeit capacity has increased significantly. Given the reduction in journey time by road on foot of the M1 and of the road developments in Northern Ireland, this would also have undermined the relative attractiveness of rail. 61
http://www.jointbusinesscouncil.com/infrastructure/position_on_dub-bel.aspx 62
http://www.independent.ie/breaking-news/national-news/belfastdublin-rail-passenger-numbers-down-60-1918783.html

48
3.6 TERRITORIAL COHESION
We can define territorial cohesion narrowly in terms of the territory of the Irish State, or more
widely in terms of the island of Ireland or the EU as a whole. The bulk of the benefits of this
project as discussed in the earlier section of this chapter accrue to Ireland, but Northern
Ireland and other Member States also benefit.
For instance, the CSO’s 2010 Road Freight Traffic Survey63 indicates that 2% of the tonne
kilometres on Irish roads in 2010 with a Dublin destination originated in Northern Ireland.
Likewise, 4.1% of the tonnes kilometres that originated in Dublin had a destination in Northern
Ireland. It is reasonable to assume that a large proportion of both these flows used the M1.
These flows would also benefit from improvements to the A1 and M1 roads in Northern
Ireland.
Closer to the border, the importance of Northern Ireland traffic increases, as one would
expect. An Origin-Destination survey of the old N1 in 1990 indicated that 30% of the traffic
travelling south from Dundalk on the N1 originated in Northern Ireland, while 23% of traffic
travelling north from Dundalk had a destination in Northern Ireland64.
The M1 has had a positive impact on territorial cohesion, purely by cutting an estimated 37
minutes off the journey time from Dundalk to the M50 in north Dublin.
While in overall terms the territory through which the M1 goes is not especially peripheral, it is
true that the further north one goes the greater the degree of economic dislocation that
occurred in previous decades due to the civil strife in Northern Ireland.
Dundalk especially suffered in this regard, and being close to the border it was also vulnerable
to losing business to Northern Ireland, when there were differences in prices due to tax
differences (especially on alcohol, tobacco and fuel). Areas just north of the border, especially
the town of Newry, would have had similar but more severe experiences, albeit over time it
has gained more than lost in terms of the impact of tax differences65. A number of studies in
recent years have examined the shared problems of these two towns and how best to solve
them66.
In summary, the M1 as well as the new N1 to the border and improvements to the A1 north of
the border are likely to have positive impacts on territorial cohesion in the broadest sense, on
reducing the peripherality of the border areas, and of improving the linkages between the two
main cities on the island of Ireland – Dublin and Belfast.
63
http://www.cso.ie/releasespublications/documents/transport/2010/roadfreight10.pdf 64
Louth County Council Road Design Department (1993). 65
See for example Fitzgerald et al. (1998). Also http://www.independent.ie/business/personal-finance/crossborder-shopping-can-keep-the-euro-in-your-pocket-1558352.html and http://www.irishtimes.com/blogs/pricewatch/2010/07/19/northern-aisles-begin-to-empty-as-republics-shoppers-stay-home/ 66
For example Colin Buchanon & Partners (2005) and International Centre for Local & Regional Development (2009)

49
3.7 INSTITUTIONAL QUALITY
Institutional structures and capacity changed significantly over the course of the building of
the M1 motorway. Much of this was driven by the requirements of the large and
unprecedented investment in Ireland’s infrastructure, rather than by individual projects.
However, as the M1 was one for the first motorways to be built in Ireland, it was so to speak
something of a “pioneer”, and it is reasonable to conclude that the lessons and experiences of
delivering the M1 were influential in the institutional developments that occurred. The most
relevant developments were:
i. Establishment of the NRA, and developments in its capacity and evolution of its
functions, which facilitated a more coordinated approach to planning the road
network, and the build-up of a critical mass of skills;
ii. Replacement of the standard “remeasurement” contract67 with “design & build”
contracts, which allowed builders more leeway in how to deliver the infrastructure,
played an important role in controlling costs and encouraging overseas civil
engineering firms to enter the Irish market68;
iii. Definition of “strategic infrastructure” and the new role of the Planning Appeals Board
(ABP) in the planning process for roads infrastructure, which is designed to reduce the
cost of and time taken for the infrastructure planning process.
To these we would add one potentially negative impact of the road investment programme:
iv. The National Roads Agreement negotiated between the Irish Farmers’ Association
(IFA), the NRA and the DEHLG in 200169, which gave landowners very favourable terms
for land bought under Compulsory Purchase Orders (CPOs) for development of new
roads, and added significantly to the financial cost of roads built thereafter.
These are discussed in greater detail below. We also consider briefly the role of the EU
Commission.
3.7.1 The NRA The NRA was established in 1993 as the body with overall national responsibility for managing
and funding the procurement and maintenance of new national roads. This was in response to
the unprecedented level of investment in the road infrastructure underway as part of the OPP
and OPTRANS programmes, as well as the perceived lack of coordination and accumulation of
critical skills in the individual Local Authorities. The NRA was granted significant powers under
the 1993 Roads Act70, and these have been developed in the intervening period.
67
http://www.constructiondb.com/wiki/re_measurement_contract 68
Interview NRA personnel, 29th July 2011. 69
http://www.ifa.ie/LinkClick.aspx?fileticket=QZ4BLHfkeRI%3d&tabid=807 70
http://www.irishstatutebook.ie/1993/en/act/pub/0014/print.html
50
NRA is an important conduit through which the lessons learned from each major project are
retained, built on and applied to subsequent projects. Over time, the NRA has established
internal land acquisition, archaeological and environmental sections, to advise the Local
Authorities on these issues.
From examining the original ex-post and ex-ante CBAs it is clear that over the construction
lifetime of the M1 motorway they have become more sophisticated. The NRA also has
developed detailed guidance notes regarding how CBA methodology is to be used during the
various stages of a proposed project’s appraisal71.
One important factor is the NRA’s role in promoting “design & build” contracts (see below),
and the encouragement of overseas contractors into the Irish market in response to price
inflation in the domestic market.
3.7.2 Adoption of “Design & Build” Contracts An important issue in relation to the delivery of the M1 and other major civil engineering
works in Ireland is the type of contract used. As elsewhere, standardised contracts are used for
major categories of works. The standard remeasurement contract was traditionally the type
used in all “Common Law” countries72, which tightly specified the work to be undertaken,
leaving little flexibility for the contractor in how the infrastructure was to be delivered.
However, the other side of this lack of flexibility was that the contracts also allowed the
contractor significant scope to claim additional payment for unexpected costs, since he was
not allowed to adapt the design to best cater for conditions as he found them on the ground.
Over time the NRA concluded that these contracts were driving costs up, directly via the
leeway given to contractors for price variation, and indirectly by constraining overseas
competition. In countries outside Ireland and the UK, “design & build” is the standard
contractual form, and Continental firms were not prepared to bid for work on a different
contractual basis. Indeed, UK firms were also discouraged from bidding for Irish works,
(although they would have been familiar with the contractual form, due to the similar legal
framework) because of lack of familiarity with “conditions on the ground” 73.
The Department of Environment, Heritage and Local Government and the NRA concluded that
there would be significant advantages in moving to the “design & build” format, and in then
encouraging overseas firms to bid for Irish contracts. They convinced the Department of
Finance, which had overall control with regard to contract types used for public works, and
then undertook a marketing campaign to increase awareness among international
construction firms of the opportunities in Ireland. Subsequently a number of these firms bid
for and won contracts in Ireland. The NRA maintains that this has led to a significant reduction
in cost inflation in Irish road contracts over the last decade.
71
http://www.nra.ie/Publications/DownloadableDocumentation/ProjectAppraisal/file,14167,en.pdf 72
http://www.lawlibrary.ie/viewdoc.asp?m=&fn=/documents/aboutus/introduction.htm 73
Interview NRA personnel, 29th July 2011.

51
In order to validate this, we can examine the new road construction price index, compiled by
the NRA (excluding land), compared to the new residential construction price index, as
presented in Figure 3.2.
Figure 3.2 NEW ROAD CONSTRUCTION PRICE INDEX (1989 = 100)
Source: NRA, DKM
It is clear that road price inflation accelerated rapidly in the late 1990s, but inflation did
moderate from the early 2000s, before decelerating sharply in the late 2000s as a result of the
“bust” in the general construction sector. Discussions with NRA personnel responsible for this
index indicate that the series is bedevilled with comparability difficulties from one project to
the next, and therefore needs to be treated with some caution. We include the inflation index
for new residential construction (again excluding land), for comparison. It is clear that there
was no moderation in inflation in this index in the early 2000s, quite the contrary. Subject to
the provisos mentioned, therefore, there does appear to have been some moderating impact
on inflation in the early 2000s, which might point to a positive effect from changes in the
contract.
This would not have had a direct impact on most of the construction stages of the M1 (only the
Dundalk Western Bypass was built using “design & build”, and was built by the CRG
consortium). However, NRA personnel indicate that the experience the construction of the M1
(including difficulties with construction of the Boyne Bridge) contributed to the move to
“design & build” contracts74.
74
Interview NRA personnel, 29th July 2011. The lack of flexibility in the design of the bridge combined with unexpected difficulties on the ground added significantly to the costs of delivering this section of the road.

52
3.7.3 Strategic Infrastructure Planning and the new role of the Planning
Appeals Board (ABP) In Ireland the Local Authorities are the planning authorities. The Irish planning system tends to
be unwieldy, slow-moving and expensive. More recently there have been changes in the
planning process with respect to major infrastructure such as motorways, which have given
the Planning Appeals Board a greater role in the process. Up to 2001, the power to grant final
approval of a motorway scheme rested with the Minister of the Environment, Heritage & Local
Government. Under the Planning and Development Act, 2000, this power was transferred to
ABP75, a move that depoliticised the process.
Under the Planning and Development (Strategic Infrastructure) Act 200676, planning
applications for “strategic infrastructure”77 are made directly to ABP, thus removing the
planning authority role of the Local Authorities in respect of this infrastructure. The rationale
was that it was found in practice that planning applications for such infrastructure were
invariably appealed78 to ABP by those objecting to some aspect of the development (in the
case of a road, usually the route or how it dealt with particular environmental impacts), adding
considerably to the time and expense of the planning process.
This change post-dated the completion of the M1 motorway, and hence was not relevant to its
delivery. However, experience with the M1 may have played a contributory role in the
evolution of the planning system in this regard.
3.7.4 National Roads Agreement The one potential retrograde development that may have been encouraged by the level of
road investment (including the M1) in Ireland in the 1990s and 2000s was the National Roads
Agreement, negotiated between the Irish Farmers’ Association (IFA), the NRA and the DEHLG
in 2001.
This was negotiated in the context of ongoing difficulties with valuing land subject to CPOs to
accommodate new roads, partly because of the volume of such land being acquired, as well as
rapidly increasing land prices as the Irish property boom started to take off79.
The result was a very favourable deal for landowners, at the expense of the taxpayer. As a
result, land costs for new roads in Ireland rose very rapidly during the 2000s80, well in excess of
what might have been expected even given the property boom underway at the time.
75
http://www.irishstatutebook.ie/2000/en/act/pub/0030/sec0215.html#sec215 76
http://www.irishstatutebook.ie/pdf/2006/en.act.2006.0027.pdf 77
“Strategic infrastructure development can generally be described as development which is of strategic economic or social importance to the State or a region. It also includes development which will contribute significantly to the fulfilment of any of the objectives of the National Spatial Strategy or any regional planning Guidelines for an area, or which would have a significant effects on the area of more than one planning authority.” http://www.pleanala.ie/sid/sidpp.htm 78
Any person physical or legal, is entitled to lodge an objection to a planning application, and having objected to the original application can appeal the subsequent planning decision to ABP. 79
Anecdotally, the Government’s desire to curry favour with a politically strong group (farmers) and the very benign fiscal situation at the time may also have played a role. 80
One contact in the EU Commission indicated that this was causing concern at Commission level, and influenced funding decisions for some later road projects.

53
However, Figures 3.3 and 3.4 overleaf confirm that land costs on Irish motorway schemes from
the mid-2000s onwards were well out of line both with earlier costs in Ireland, and with costs
in other countries.
Figure 3.3 KEY PROJECT ELEMENT COSTS AS % OF TOTAL SCHEME COST (ALL
NATIONAL ROADS)
Source: Barry (2006)
Figure 3.4 LAND AS A PROPORTION OF SCHEME COST FOR 2006, VARIOUS
COUNTRIES
Source: Barry (2006)
0,00%
10,00%
20,00%
30,00%
40,00%
50,00%
60,00%
70,00%
80,00%
90,00%
2001 2002 2003 2004 2005 2006 2007
Construction Cost andSupervision
Land and Property
Planning & Design andOther Costs
0%
5%
10%
15%
20%
25%
Iceland Norway Germany Greece Denmark England Ireland

54
Such was the public and political concern regarding increasing costs on the national roads
programme, that the Comptroller and Auditor General of Ireland was commissioned to carry
out an investigation of the matter in 200481. He concluded:
“The cost of acquiring land for road improvement is now estimated to represent 14% of programme costs. A December 2001 agreement, between the Department of the Environment, Heritage and Local Government, the NRA and the Irish Farmers’ Association, covering the compulsory acquisition of agricultural land and the escalating cost of land in urban areas have been instrumental in this proportional increase.” (p.9/10)
With regard to the M1, our interviews with NRA personnel indicate that this phenomenon was
important only for the later stages of the motorway. We have calculated land costs as a
percentage of total scheme costs in Table II.9 of Annex II. It does not appear from this that
land for the Dundalk Western Bypass (the last section to be built) was particularly expensive. A
notable feature is the low figure for the Dunleer Bypass reflecting a less buoyant economy
during that section’s construction. Land costs for the Cloghran–Lissenhall road are higher, but
this part of the road was constructed largely on brownfield land near Dublin city, where land
costs would have been intrinsically higher.
3.7.5 Role of the EU Commission The Commission played a key role in the institutional structures that developed to manage and
deliver the National Development Plans and specifically the M1, through its role as funder and
on the various monitoring and steering committees. The formal reporting, appraisal and
management requirements and structures were a step-change from previous arrangements in
Ireland, and it is likely that they were a significant catalyst for the other institutional changes
that occurred, particularly during the 1990s.
During the 2000s, as the proportion of infrastructure investment funding that came from the
EU funds fell, it is likely that the leverage that the Commission had also weakened somewhat.
This is highlighted for instance by the issue of land prices, as discussed above. The Commission
expressed concerns over the increasing cost of land in road projects as the 2000s progressed,
and eventually decided to discontinue funding of this cost element. However, this was not
sufficient to constrain the escalation in payments made to landowners, as the above
demonstrates. Whether this would have been the case had the Irish Exchequer not been in
such a strong position, is open to question.
3.7.6 Conclusions Overall, we would conclude that the M1, as part of a wider investment programme, had a
positive impact on institutional capacity in Ireland, and through this had a positive impact on
economic growth via endogenous dynamics. More specifically, experience with the M1 did
have a direct impact on the decision to adopt “design & build” contracts, according to NRA
personnel we interviewed.
81
Comptroller & Auditor General (2004).

55
3.8 SOCIAL HAPPINESS
The M1 has had a number of positive impacts, as discussed in the previous sections of this
chapter. Social happiness impacts are to do with perceptions, over and above the impacts
already considered. Issues that might arise, not fully covered elsewhere include:
Improved capacity to enjoy leisure activities, which might not be fully covered by the
value of time saved on journeys (either on leisure-based journeys themselves or in
terms of providing greater leisure time through reducing business or commuting travel
time). The area around the northern end of the motorway (north Co. Louth, south Co.
Armagh in Northern Ireland) is one of significant natural beauty and history, and would
normally be a centre for tourism and leisure. However, it suffered greatly during the
period of civil strife in Northern Ireland82. This has been reversed in recent years, and
its greater accessibility due to the presence of the M1 is likely to have contributed to
this.
The Boyne Bridge has become something of an iconic image for Drogheda and Co.
Louth83, including appearing on sports logos84. Such iconic images may have a positive
civic pride impact. In a similar vein, the presence of the M1 itself may be a source of
regional pride, which may have a positive impact not included in other headings.
Ireland’s current economic crisis has inevitably impacted the population’s view of
economic prospects in general and contributed to a general atmosphere of
pessimism85. In this context the roads investment programme is seen as one of the few
positive legacies of the “Celtic Tiger” era (for instance, see White, 2010).
As a possible negative, there was considerable resistance at the time of construction to the
decision to toll the motorway at Drogheda86, including calls for a boycott of the bypass,
particularly by road hauliers87. The tolling of roads has always been controversial in Ireland88
and it has invariably aroused public opposition (for example the M50 ring road around
Dublin89).
82
South Armagh became known as “bandit country” at the time, due to both terrorist activity and illegal smuggling (http://www.independent.ie/opinion/analysis/the-good-republican-who-has-become-lord-of-bandit-country-1503201.html). Similarly Dundalk was known locally as “El Paso” (http://www.dundalk.ie/history.php). 83
See for example http://www.louthheritage.ie/content/files/LouthLandscapeCharacterAssessment.pdf 84
Although this turned out to be a cause of controversy due to the location of the bridge (http://www.drogheda-independent.ie/lifestyle/review-of-the-year-november-cable-bridge-gets-the-boot-from-louth-county-crest-2001430.html). 85
For instance, see http://www.tradingeconomics.com/ireland/consumer-confidence. 86
The tolling became something of an issue in the 2002 General Election (http://www.drogheda-independent.ie/news/toll-poll-we-put-louth-candidates-under-the-spotlight-761413.html). 87
See for example http://debates.oireachtas.ie/seanad/2003/06/24/00004.asp and http://www.irishtrucker.com/news/2002/april/0204026.asp. 88
Irish Times 27th June 2000 “NRA proposals for toll schemes attract strong criticism”. http://www.irishtimes.com/newspaper/archive/2000/0627/Pg009.html. 89
Irish Times 23rd
September 1995 “Overtaxed city motorists ask for whom the road tolls”.
http://www.irishtimes.com/newspaper/archive/1995/0923/Pg007.html.

56
Dissatisfaction with the presence of tolls on the M1 has persisted90, most recently manifesting
itself in a campaign to have the tolls on accessing Drogheda town removed91. During our
research we contacted the Drogheda Chamber of Commerce, which still maintains that the
tolling of the road offsets any positive affect the bypass may have had on the town. The
Chamber is lobbying both CRG and the NRA to have the toll removed. The situation has
perhaps not been helped by the fact that the NRA recently won a court case forcing the toll
concessionaire to reduce its toll rates in line with consumer price deflation92.
That said, while dissatisfaction with the tolls is often voiced, it is difficult to ascertain to what
degree it has a substantial impact on public perceptions of the road in general, or on
behaviour. It is worthy of note that the Drogheda Bypass was the first section of the M1 to
register a reduction in traffic as the economy slowed down (in 2008), perhaps reflecting
heightened sensitivity to tolls.
90
For example http://www.drogheda-independent.ie/frontpage/m1-toll-hiked-up-for-second-year-in-a-row-1271041.html and http://www.drogheda-independent.ie/opinion/letters/remove-toll-on-our-town-602486.html 91
http://www.drogheda-independent.ie/news/councillor-carries-on-the-fight-to-abolish-local-toll-2857426.html 92
http://www.rte.ie/news/2011/0222/nra-business.html

57
4 DETERMINANTS OF PROJECT
OUTCOMES
4.1 KEY FINDINGS
The assessment of the key determinant factors of project performance is presented in this Section and the degree to which they affected the M1 project is synthesised in the following Table.
Table 4.1 IMPACT OF KEY DETERMINANTS ON PROJECT’S PERFORMANCE
Strength*
1. Appropriateness to the context +4
2. Project design +2
3. Forecasting capacity -4
4. Project governance +4
5. Managerial response -1
*-5 = very strong negative effect; 0 = no effect; 5 = very strong positive effect (see in Annex I the criteria adopted to assign these scores).
4.2 APPROPRIATENESS TO THE CONTEXT
It is appropriate to consider first the context for this project, whether it was positive or
negative, and whether the project itself had an impact on the context (was it a trait taker or a
trait maker?)
In many ways the context for this project was highly positive. As discussed in Chapter 2, it had
been well-established (as far back as the 1960s) that there was a requirement for increased
capacity and safety on the N1 route. The first section of the road to be upgraded opened in
1994, as both the “Celtic Tiger” era (see Box 2.3) and the Northern Ireland peace process were
beginning, so the road received a very “fair wind” in terms of external circumstances.
The M1 was part of an unprecedented body of infrastructure improvements in Ireland, co-
funded to a high degree (particularly in the early stages) by the EU. It was clear at the time that
Ireland’s infrastructure was inadequate, particularly in terms of roads. The CSF was seen as
kick-starting a programme of investments, which in the pre-Celtic Tiger era might have
appeared too daunting for the Government93. As a result, the public mood was
overwhelmingly in favour of the investment programme.
To some degree as well the M1 motorway could be seen as a trait-maker, as the earlier
investment plans tended to favour single carriageway by-passes rather than motorway. It is
93
Indeed, the Irish Government made great play domestically of succeeding in obtaining large amounts of EU funding under the 1989-1993 and 1994-1999 funding rounds (see for example http://www.independent.ie/business/irish/after-30-years-our-eu-structural-funds-are-leaving-us-72891.html, and http://mrq.ie/mrq_MOS%20art.html).

58
arguable whether, pre-Celtic Tiger, the Irish Government would have been in a position to fund
a motorway along the entirety of the route.
4.3 PROJECT DESIGN
As described in Section 3, the traditional civil engineering contract in Ireland tended to tightly
define the design to be used, albeit it is also vulnerable to cost overruns. This did cause
problems with the building of some sections, notably some of the bridges (see Section 3)
where innovative approaches had to be used to deal with environmental, historic and
operational issues. In more recent years a “design & build” contract has been used, which the
NRA indicates has succeeded in controlling costs. The “design & build” approach also
facilitated the partial tolling of the road, and it was used in the case of Dundalk Western
Bypass which was built by the toll concessionaire.
The decision to toll a section of the road, after the design and planning process was already
underway, was a significant complicating factor in the design of the M1. Government policy
flip-flopped on this issue, but eventually decided in favour of tolling94, in view of the escalating
cost of the roads investment programme, and the prospect of reduced EU funding post 1999.
At the simplest level, the road had to be redesigned to accommodate the toll plaza and smaller
toll booths at the Boyne Bridge. Then the tolling concession had to be put out to tender, which
involved significant delay.
A further issue is that the affected section of the road - the Drogheda Bypass - attracted a
significantly lower rate of EU Co-financing because of the toll. In general the Irish authorities
did not present PPP projects for EU co-funding. An exception arose in this case, however,
because part of the Drogheda project was already in the EU-funding process when the toll
arrangement was decided. An exercise was undertaken by the European Investment Bank (EIB)
whereby the NPV of the expected stream of future toll income for the Exchequer was
calculated and deducted from the expected capital cost of the entire Drogheda section. The EU
aid rate was recalculated taking into account the financing gap and this rate was then applied
to the eligible costs95.
More generally, tolling will discourage some usage of the road, and in the long run may end up
being more expensive, in terms of the net toll revenues paid to the concessionaire over its
lifetime.
94
http://debates.oireachtas.ie/dail/2001/05/16/00027.asp; http://debates.oireachtas.ie/dail/1999/10/05/00071.asp 95
We understand that while EU aid for the tolled section of the road was reduced, the aid in question was diverted to other projects in Ireland.

59
On the positive side, the concession terms have provided for the maintenance of a large
section of the road (south as far as the start of the Balbriggan bypass) going forward, which is
important in the current difficult fiscal times96.
In general, the design and building processes for the M1 were facilitated by the fact that most
of the alignment was greenfield, the exception being the southern-most section which went
through or near already developed land. This is reflected in the relative costs of the various
sections (Annex II).
With respect to the timing of the various sections of the road, the first section of the road to
be upgraded (the Dunleer Bypass) replaced the poorest quality section of the old road, and the
only section that had not received any improvements in the previous decades. It was a noted
accident “black-spot”97, and the village of Dunleer had become a serious traffic bottleneck. The
Dunleer bypass was at the time the largest road project undertaken by Louth County Council
(the NRA was not in place at that time), but it was also a reasonably straightforward section of
the road to upgrade, with relatively little complexity involved98. It is notable that in all the road
development plans produced over the years, the Dunleer section was identified as the first
section to be improved.
The most southerly sections of the road were the busiest, but some improvement works had
already been undertaken on these sections and an at-grade (“Type 2”) dual carriageway was
already in place, so the case for upgrading was not as urgent. This fact influenced the decision
to build the Balbriggan bypass next. The town had no relief roads for traffic, and the
subsequent time savings were very large in comparison with other sections of the road.
Archaeology proved to be an issue that added to costs on a number of sections. The nature of
most archaeological remains in Ireland is such that their whereabouts are difficult to predict in
advance. A greater than expected volume of finds on the Drogheda Bypass and Dunleer –
Dundalk Road sections added significantly to the cost of delivery of these routes.
A final issue with design is whether it was justified to build the entire road to motorway
standard. Most of the road is two-lane motorway, with the exception of parts of the Cloghran-
Lissenhall section which are three-lane. The National Road Needs Study (1998) undertook a
detailed analysis of future traffic volumes on all sections of the national road network, and
recommended a road type on that basis. Their methodology was based on the USA Highway
Capacity Manual (HCM), by reference to a minimum level of service D (LOS D), which
prescribes an average speed of 80kph (i.e. this level of service would trigger an upgrade in the
road).
96
The NRA has informed us that their annual road maintenance budget is well below the “standard” level of maintenance expenditure prescribed in the COBA model (see Annex I), and has been cut further in recent years. We also understand that the standard of maintenance on the toll concession is significantly higher than on other sections of the road, due to the terms of the concession contract. 97
Carroll (1992). 98
The planning system requires more than one alignment for the route (usually three) to be considered. The Environmental Impact Statement and other planning documents present these as well as the rationale for choosing the preferred alignment.

60
This LOS would be reached with AADTs of 55,500 for a rural two lane motorway (72,200 under
“commuter” conditions), 44,100 for a rural standard “Type 1” dual carriageway (57,400 for
commuter conditions) and 26,500 for a rural reduced standard at-grade “Type 2” dual
carriageway (34,400 for commuter conditions).
By reference to Table 2.1, for all but the Cloghran-Lissenhall and Lissenhall-Balbriggan sections
of the M1, dual carriageway rather than motorway would have been an adequate road
standard99. The decision to build to motorway standard throughout added to the cost of
construction, for little benefit in terms of time savings, albeit some additional safety benefits
would have accrued100. This is discussed in more detail in the CBA in Annex II.
4.4 FORECASTING CAPACITY
Forecasting capacity is key in minimising risk factors and uncertainty in the delivery of major
infrastructure projects. Such risk factors can include over- or under-design in terms of capacity
delivered, failure to anticipate difficult geology or the presence of archaeology, poor
estimation of costs, under-anticipated inflation, etc.
As the previous paragraphs might indicate, forecasting capacity with regard to the demand
side (traffic volumes) was somewhat redundant in the case of the M1, as it had been decided
in the OPP in 1989 and the subsequent OPTRANS to build the road to motorway standard
throughout.
Data in the subsequent National Road Needs Study in 1998 indicated that this standard of road
was in fact not required for most of the length of the M1.
With regard to the supply side, previous sections have also indicated that there was a failure to
adequately anticipate the level of archaeological remains discovered, but the nature of these
remains does make their presence difficult to accurately predict. Unexpected geological issues
were also a problem for keeping within the agreed budget. NRA personnel have indicated that
this is a problem particular to Ireland, which has a varied geology compared with other
countries in Europe. This variation means that preliminary surveys of the sites may not
accurately predict the geological challenges which need to be overcome.
The nature of the traditional civil engineering contract in Ireland places a strong onus on
designers to predict accurately conditions on the ground, and the inclusion of Price Variation
Clauses (PVCs) in these contracts increases the risk for the funder that costs will escalate. The
decision to migrate to “design & build” contracts mostly came too late for the M1 motorway,
but was informed by the experience with the M1, among others.
99
While the Road Needs Study was charged with recommending a road type and level of priority for each section of the National road network, it simply states with respect to the N1: “This route has been determined as motorway standard in the Operational Programme for Transport (OPT) (1994-1999).” This issue was highlighted in a report by DKM as part of the Operational Programme for Transport (DKM [1999]), which also funded the Road Needs Study. 100
Reference to the Road Needs Study indicates that the subsequent decision by the Government to build all major inter-urban routes (N2 to N8) to motorway standard (effectively ignoring the Road Needs Study) involved a much greater level of over-design than was the case for the N1.

61
Finally, forecasting capacity as a mechanism to reduce risk came into sharp focus with the
decision to offer a toll concession for part of the route. Traffic forecasts would have been key
to negotiations and bidding for the toll concession, although we are not privy to these
forecasts and how accurate they proved to be. The decision to use PPP to fund infrastructure is
fundamentally a risk-transfer exercise, and a “design & build” contract was used for the
construction of the Dundalk Western Bypass. Maintenance costs for the route as far south as
the start of the Balbriggan bypass were also passed over to the toll concessionaire.
4.5 PROJECT GOVERNANCE
Governance structures for the delivery of the M1 (and the roads construction programme in
general) were novel in an Irish context, and evolved over time. The over-arching Community
Support Frameworks (CSF) 1989-1993 and 1994-1999 had a Monitoring Committee, as did the
Operational Programmes for Peripherality and Transport. These committees included
representatives from:
the Departments of Environment, Transport and Finance,
Local Authorities,
State bodies such as the NRA and those in charge of public transport, airports and
seaports,
external evaluators (usually economic consultants who undertook appraisals of
proposed investments), and
the EU Commission.
These committees as well as the Commission itself had regular reporting requirements with
regard to physical and financial delivery of the various investment programmes. The discipline
of complying with these reporting and other requirements added to the quality of the
governance and decision-making process in the course of the delivery of the programme. Our
examination of the Irish files confirms for instance that more detailed reports were kept for
infrastructure which was eligible for EU funding.
The establishment of the NRA and its expanding role, the adoption of “design & build”
contracts and the encouragement of international competition for contracts, as well as the
changing role for the Planning Appeals Board over time are all positive examples of the
strength of governance and its ability to cope with changes.
Prior to the 1989-1993 Programme, infrastructure investment decisions tended to be made on
an ad hoc (and often political) basis, and were severely constrained by budgetary limitations101.
As a result the capacity and quality of the road network in Ireland over the 1970s and 1980s
failed to keep up with demand.
101
http://www.independent.ie/business/irish/after-30-years-our-eu-structural-funds-are-leaving-us-72891.html

62
Unfortunately, there are signs of a return to the politicised approach to infrastructure
development subsequent to 1999 and the significant reduction in EU funding. Possible
examples include the decision to build all the major inter-urban routes to motorway standard,
well in excess of the standard recommended in the Road needs Study, and the system for
compensating landowners for land acquisition, agreed with the Irish Farmers’ Association in
2001. The EU Commission raised concerns about this issue, and eventually decided to stop
funding land purchases as part of road funding. However, such was the strength of the
Exchequer position at the time that the removal of EU funding for land purchase did not
constrain the very high prices paid to landowners.
Fiscal difficulties have returned in recent years, and have re-established their traditional
constraining role on public infrastructure budgets102.
4.6 MANAGERIAL RESPONSE
We are concerned here with the adaptability /flexibility of project management to unforeseen
events. At the wider level of public policy (e.g. evolution of the role of the NRA, the planning
system, of contract design and the National Roads Agreement with farmers) there was a
significant degree of evolution and adaptation to circumstances.
However, at the project management level for the M1 itself, there is limited evidence of
adaptation to unforeseen events. The main category of such events would be unexpected on-
site conditions experience in the building of the road, and the contract structures prescribed in
large degree how these would be dealt with.
4.7 INFLUENCE OF AND INTERPLAY BETWEEN DRIVERS
We can now consider which of these five drivers of performance were the most influential in
the success of this project, and the interplay between them.
It appears to us that context was the most important driver, especially in terms of meeting
already identified additional capacity and needs. Both design and governance had strong
interplay with context.
Design is an important issue, which had an ambiguous impact. Our analysis indicates that
much of the new road may have been over-designed, and the type of contracts used for most
of the road probably added to costs. However, the context, in terms of the level of EU funding,
may have had an influence here.
Governance was an important driver, in terms of the Operational Programme Steering
committees, the evolving role of the NRA, the change in contract design over time and the
decision to toll part of the road.
102
http://www.breakingnews.ie/ireland/metro-north-and-dart-projects-unlikely-to-go-ahead-varadkar-502111.html

63
Forecasting capacity was perhaps less important than the other drivers, given that the need for
increased capacity on the route was already established ex ante, and the road design did not
take into account future demand forecasts per se. Capacity on the supply-side forecasting had
some more influence, given the nature of contracts, but there were limitations on the scope to
forecast in this regard.
Finally, as the M1 was somewhat of a “pioneer” project in an Irish context, many of the
benefits of lessons learnt and governance would have been felt on subsequent projects, rather
than on the M1 itself. Unfortunately, there is also evidence of some deterioration in the
“political” governance of subsequent projects, during the early 2000s (for instance the decision
to upgrade all major inter-urban routes to motorway).

64

65
5 CONCLUSIONS
Here we present the results and lessons learnt from our quantitative and qualitative analysis of
the M1 project. Impacts have been considered under seven headings, as summarised in Table
5.1:
Table 5.1 NATURE, STRENGTH AND EVOLUTION OF IMPACTS
Strength*
(-5 to +5)
Identified and Analysed Evolution of Impacts
Quantitatively (CBA)
Qualitatively Short term Long term
1. Direct economic growth +5 √ √ √
2. Endogenous dynamics +3 √ √ √
3. Social cohesion +2 √ √ √
4. Environmental effects -2.5 √ √ √
5. Territorial cohesion +2.5 √ √ √
6. Institutional quality +2.5 √ √
7. Social happiness +1.5 √ √ √
*-5 = net highly negative effect; 0 = net neutral effect; +5 = net highly positive effect.
This project was highly worthwhile. Costing EUR 787 million (2011 money), it had a socio-
economic NPV of EUR 6.15 billion103, and an IRR of 24%. These results are highly robust: the
project has already generated (as of end 2011) sufficient benefits to justify itself (see Annex II).
This is important, given the reduced traffic volumes on most sections of the road in recent
years, and economic uncertainty about the future.
That said, our analysis also tentatively indicated that an alternative project with dual
carriageway rather than motorway from the Balbriggan Bypass northwards would have cost
less and generated a somewhat higher NPV. However, the difference in socio-economic NPV is
not large, given the overall values and the timeframe involved, and it may be considered that
the option value of the additional capacity and the avoidance of the risk of an expensive
subsequent upgrade to motorway standard, is worth the extra cost.
The road’s success is hardly surprising given the context, whereby capacity and safety
problems had been identified on the old route as early as the 1960s, and the emergence of the
Celtic Tiger (see Box 2.3) and the Northern Ireland peace process during the 1990s just as the
first section of the M1 opened.
EU funding was highly important in the successful delivery of the road, providing over 40% of
the cost of the entire motorway, and up to 85% on the early sections. From a starting point of
1989, Exchequer finances were still recovering from the fiscal difficulties of the 1980s, and the
103
Risk analysis indicated an even higher mean economic NPV, of EUR 6.226 billion.

66
level of need for road investment might have been daunting if not overwhelming for an Irish
Government working only with its own resources.
Governance and institutional structures (including contractual design) showed considerable
evolution over time, partly thanks to the imposition of EU requirements. The establishment of
the NRA and the evolution of its role are particularly important. Not all of the beneficial
institutional impacts of EU participation survived the reduction in EU funding and the
strengthening of the Exchequer position during the 2000s, notably with respect to the price
paid for land.
Social and territorial cohesion would have benefited from the new road, in terms of access to
employment opportunities, and given the impacts of the civil strife in Northern Ireland on the
areas near to the border.
Environment was probably negatively impacted overall, due to increases in fuel usage,
pollution, and increases in road-based commuting. Some rural severance would have occurred,
although the environment in by-passed towns would have improved considerably. That said,
both rural severance and GHG emissions costs are at least partially internalised. The viability of
competing rail services on the same route may also have been negatively impacted.
The major lesson to be gleaned from the experience of the M1 - and it applies to the wider
body of road infrastructure investment in Ireland over the last two decades - is: “context is
king”.
Ireland’s road infrastructure was severely inadequate by the late 1980s, a fact that had been
recognised by the Government as early as the mid-1960s. Institutional inadequacies had also
been accepted and the solution (in the form of a single national roads body) identified. Several
road needs studies and investment plans had been drawn up, but little action had followed,
mainly for fiscal reasons (public infrastructure investment was invariably the first victim of
economic downturns in Ireland), but also possibly because of lack of political and social
consensus on where and how to invest the State’s scarce resources.
Also, by the late 1980s, Ireland was slowly emerging from a major fiscal crisis, which had seen
public debt rise above 100% of GDP (despite increasing tax rates and falling public investment)
and the return of largescale emigration which had not been seen since the 1950s. The crisis
had only been halted by painful fiscal retrenchment, introduced by a minority Government but
made possible by broad political and social consensus on the remedies required104. This
consensus included what became known as “social partnership”, involving the State, trade
unions and employers’ representatives, which traded tax reductions for pay restraint. It was a
watershed moment in the history of the Irish State, triggered a significant turnaround in the
fortunes of the economy, and is generally seen as a key element in the emergence of the Celtic
Tiger.
104
http://www.examiner.ie/ireland/politics/historys-verdict-on-merit-of-tallaght-strategy-remains-inconclusive-133090.html

67
Thus, as the 1980s were coming to an end, two out of three key requirements were in place:
(1) knowledge of what needed to be done (physically and institutionally), and (2) a level of
socio-political consensus that might have facilitated a focussed programme of investment. The
missing factor was money, and borrowing was problematic because of the overhang of public
debt.
At this point the expanded ERDF and Cohesion Funds came on the scene. Ireland drew up
National Development Plans and succeeded in gaining a disproportionately large share of
these funds in the 1989-1993 and 1994-1999 rounds. This became a virtuous circle. The EU
funds made the National Development Plans feasible and thus created a strong incentive to
“do it right” (put together a good plan and implement it properly), in order to make sure that
no funding was lost. Numerous plans and studies had been undertaken over the years, so
there was consensus over what needed to be done, and the National Plans could be drawn up
and institutional structures put in place relatively quickly.
At the same time, because so much money was coming from the EU, there was less internal
dissent as to where in the country the money was being spent (hard choices were less
necessary, as there was “enough for everybody”). Significant progress was made on delivering
new infrastructure, and the benefits were demonstrable, which itself generated positivity for
the overall programme.
As the 1990s progressed, the Celtic Tiger began to emerge, and the process of ending decades
of civil strife in Northern Ireland (particularly relevant for the M1) began to bear fruit.
Infrastructure investment was one of the catalysts for economic growth and in turn was
justified by it.
As Ireland entered the 2000s, EU funding reduced, but the economy continued to grow and
the Exchequer was in a sufficiently strong position to take over the funding of even more
ambitious investment programmes, including the completion of the M1 and the M50 (and its
subsequent expansion) as well as the Northern Port Access Tunnel which linked the M1 and
M50 to Dublin port. In a period of little more than two decades, Ireland went from having no
motorways at all to a network of over 700km, with all the major urban centres linked by
motorways. While arguments can be made that the level of investment was excessive, it is
likely that important network benefits have been generated.
This then is the context for the success of the M1 as an investment. It caught a fair wind from
many directions, which helped its delivery and provided the subsequent growing demand for
its services. It started as the conditions for the “Celtic Tiger” were being put in place, and was
completed shortly before its demise, and sufficient demand was present ex ante to justify
major investment. It was built during the most benign period of Ireland’s fiscal and economic
history. Institutional developments at a national level had a positive impact.
Would it have been built without the Structural and Cohesion Funds, or the emergence of the
Celtic Tiger? A major improvement on the route was certainly justified, as was its prioritisation

68
vis à vis other routes in Ireland, but it might have been a less ambitious project, delivered over
a longer period of time.
The EU Commission’s role was notably positive in the Irish experience, particularly in the
1990s, and points to the scope the Commission has to leverage positive change through
infrastructure funding. This highlights the potential for the use of conditionality by the
Commission in funding decision, but the exact scope will vary from case to case.
During the 2000s, the level of EU funding fell and the Exchequer was in an exceptionally strong
position. In these circumstances the Commission’s leverage reduced, and for instance its
decision to cease funding of land purchases did not constrain the overpayment for land during
the 2000s.
The degree to which the lessons learnt are transferable to other countries and circumstances is
beyond the scope of this study. It may prove difficult to reproduce a similar combination of
positive circumstances. On the other hand the positive leverage the Commission can apply
institutionally and in terms of management is likely to be stronger in most other countries than
it was in Ireland during the 2000s.

69
ANNEX I. METHODOLOGY OF
EVALUATION
The present Annex summarises the methodological approach undertaken for carrying out the
project case studies and presented in the First Intermediate Report of this evaluation study.
Moreover, the Annex further elaborates on and specifies the definition of long-term effects
considered throughout the case study and the typology of determinant mechanisms analysed
in interpreting the project outcomes. The main objective is to provide the reader with a set of
information describing how the project evaluation was conducted and to enable him/her to
replicate this methodology.105
The Annex is divided into three parts: in the first one, the overall conceptual framework of the
evaluation study is recalled and the definition of long-terms effects and project determinants
are laid out; in the second one, the methodology of analysis followed to implement the ex-post
evaluation is discussed; finally, the structure of the case study reports and the tools used to
standardise them is described in the third part.
CONCEPTUAL BASIS
The Conceptual Framework of this evaluation study is based on three dimensions of analysis:
the object of the evaluation (the ‘What’), the timing of the long-term effects (the ‘When) and
the determinants of the project’s outcomes (the ‘How’).
The ‘What’ dimension
The Team developed a classification of long-term effects, with the aim of identifying all the
possible impacts of public investments on social welfare. A broad distinction of project effects
is among effects on ‘Economic development’ or ‘Quality of life’. Investment projects can foster
economic development, which is generally quantifiable by aggregate indicators, such as the
Gross Domestic Product; although economic development is not disconnected from the
wellbeing of society, it is acknowledged that there are a number of other factors that may
affect public welfare, that are not captured by the traditional economic indicators106. For the
purpose of this study, the notion of quality of life107 refer to the factors that affect social
development, the level of social satisfaction, the perception of social reality and other
dimensions which are outside the conventional economic dimension. Under these two broad
categories, a taxonomy of more specific long-term development effects of investment projects
has been developed. The definition of each type of effect is provided in Table I.1.
105
Specific recommendations which may enable application of the same evaluation methodology to future projects are discussed in the Final Report of this evaluation study. 106
Dasgupta, 2011 and Stiglitz et al., 2009. 107
Used also as synonymous with wellbeing, as mentioned in the ToR.

70
Table I.1 TAXONOMY OF LONG-TERM DEVELOPMENT EFFECTS
Effects Definition Checklist
Economic development
Direct economic growth
Following the traditional growth theory108
, both public and private investment contribute to increasing the stock of capital and thus economic growth. The direct contribution of a project to economic growth, in terms not only of real growth of GDP, but also, more generally, on economic welfare is discussed within this category of effect.
Did the project have effects on the endowment of labour or capital production factors? Did it contribute to employment creation? Did it attract new investments? Did it create new business opportunities? Did it produce time savings for business trips? Did it produce decreases in travel costs?
Endogenous dynamics
Endogenous dynamics comprise all the factors that have an indirect effect on economic growth, by improving the productivity of inputs: the increase of the stock of competences and knowledge of human capital
109, the introduction of a more advanced
technology110
and changes in the organisational model of economic actors, making them more efficient
111,
are analysed insofar they contribute to increasing the production function.
Did the project contribute to the improvement of the productivity of the economic system? Have social behaviours changed as a result of the project? Did the project provide new/improved skills, R&D investment, organisational changes that translated into an increase in labour productivity?
Quality of life
Social cohesion Public investment can affect social cohesion, by minimising disparities, avoiding social marginalisation and reducing income inequalities across different socio-economic, gender or ethnic groups.
Did the project promote social inclusion? Did it improve the conditions of specific segments of the population (e.g. elderly, migrants)? Did it improve the affordability of services?
Environmental effects
Polluting emissions, biodiversity loss and depletion of natural resources caused by large infrastructural projects can affect social wellbeing of both the present and future generations.
Did the project improve the quality of the natural environment? Did it alter wildlife habitats? Did it affect the ecosystem? Were there any environmental issues related to project implementation?
Territorial cohesion
The project can contribute to reducing welfare disparities caused by unequal distribution of resources and opportunities among regions and their population. The focus, in particular, is on core-periphery and urban/rural differences.
Did the project improve the territorial cohesion of the region/country? Did it play any role in urban-rural or core/periphery or cross-border dynamics? Did it expand the territorial coverage of the delivery of a basic service?
Institutional learning
Investment projects can bring wide spill-over effects to the quality of Public Administration and other institutions at national, regional or local level. Institutional quality is strongly related to economic growth
112, but it can also affect the quality of life of
people, because of the intrinsic value that individuals can attribute to a well-ordered society
113.
Did the project induce any institutional learning at regional administrative level? Did it raise political awareness regarding a specific theme? Did it have effects on the level of corruption?
Social happiness This category encompasses all those variables which may affect the subjective perception of people’s wellbeing, and have to do with their psychology, family context, religion and cultural traits.
Are the project beneficiaries overall satisfied with the project’s implementation and outcomes? Did the project have any effect on the perception of quality of life? Did it affect the sense of security of the target population?
In researching all the possible long-term effects of project investments, it is acknowledged that
there is a risk of duplication and double-counting: for example, a project for water treatment
clearly has effects on environment, which may contribute to the development of new
economic activities that foster economic growth.
108
Solow, 1956. 109
Becker, 1962. 110
Griliches, 1992 and Griffith, 2000. 111
Tomer, 1982 and Martinez, 2009. 112
See, for instance, Easterly et al., 2006. 113
Sen, 1987.

71
The ‘When’ dimension
The temporal dimension of analysis relates to the point in the project’s lifetime at which the
effects materialise for the first time, how they develop over time and whether they have
already stabilised or are still evolving. A clear distinction emerges between short-term and
long-term effects, with the former being the first contributions made by the project and
enjoyed by society after a relatively short time following project completion (about 1-5 years);
the latter, on the other hand, become visible after a longer period of time and tend to stabilise
over many years. It is acknowledged that, given the varying timeframe for different effects to
appear and stabilise, the choice of the time horizon and the timeframe at which the ex-post
evaluation is carried out can significantly affect the results of the evaluation.
The ‘How’ dimension
Project outcomes, i.e. the way projects affect the generation of certain effects and the varying
timeframe for effects to appear and stabilise, are not certain, but result from a non-
deterministic combination of different and interrelated factors. Five stylised determinants of
project outcomes have been identified: appropriateness to the context, project design,
forecasting capacity, project governance and managerial response. Five Working Hypotheses
are related to these dimensions and explain how each of them can influence the generation of
the project’s short or long-term effects (see Table I.2).
The three dimension of analysis are logically interconnected and by combining the ‘What’,
‘When’ and ‘How’ dimensions the evaluator can disentangle the causal chain between the
project’s inputs and the outputs.
METHODOLOGY OF ANALYSIS
The methodology developed to answer the evaluation questions consists of a combination of
quantitative (Cost Benefit Analysis) and qualitative (personal interviews, surveys, searches of
government and newspaper archives, etc.) techniques. Qualitative techniques are probably
better at determining why certain effects are generated, along what dimensions, and
underlying causes and courses of action of the delivery process. The media (including websites
or blogs), in particular, have proved to be an excellent source of evidence identifying or
revealing both objective information and perceptions about the project, thus concurring to
assess the project’s impact on social happiness. At the same time, quantitative data can
provide an important support to test and validate certain findings derived from interviews and
other sources. The most important contribution of the CBA exercise is to provide a framework
of analysis to identify the most crucial aspects of the projects’ ex-post performance and final
outcome114.
114
More details on the approach adopted to carry out the ex-post CBA exercise and, in particular, indications on project identification, time horizon, conversion factors and other features are extensively described in the First Intermediate Report of this evaluation study.
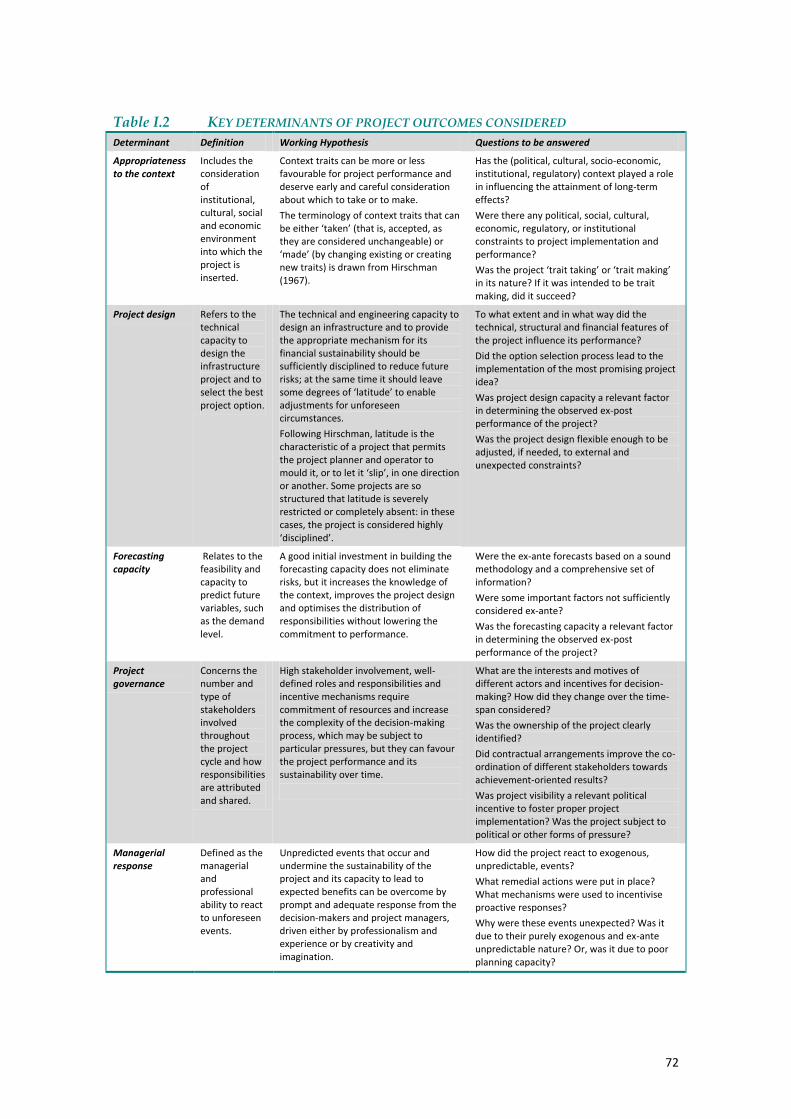
72
Table I.2 KEY DETERMINANTS OF PROJECT OUTCOMES CONSIDERED
Determinant Definition Working Hypothesis Questions to be answered
Appropriateness to the context
Includes the consideration of institutional, cultural, social and economic environment into which the project is inserted.
Context traits can be more or less favourable for project performance and deserve early and careful consideration about which to take or to make.
The terminology of context traits that can be either ‘taken’ (that is, accepted, as they are considered unchangeable) or ‘made’ (by changing existing or creating new traits) is drawn from Hirschman (1967).
Has the (political, cultural, socio-economic, institutional, regulatory) context played a role in influencing the attainment of long-term effects?
Were there any political, social, cultural, economic, regulatory, or institutional constraints to project implementation and performance?
Was the project ‘trait taking’ or ‘trait making’ in its nature? If it was intended to be trait making, did it succeed?
Project design Refers to the technical capacity to design the infrastructure project and to select the best project option.
The technical and engineering capacity to design an infrastructure and to provide the appropriate mechanism for its financial sustainability should be sufficiently disciplined to reduce future risks; at the same time it should leave some degrees of ‘latitude’ to enable adjustments for unforeseen circumstances.
Following Hirschman, latitude is the characteristic of a project that permits the project planner and operator to mould it, or to let it ‘slip’, in one direction or another. Some projects are so structured that latitude is severely restricted or completely absent: in these cases, the project is considered highly ‘disciplined’.
To what extent and in what way did the technical, structural and financial features of the project influence its performance?
Did the option selection process lead to the implementation of the most promising project idea?
Was project design capacity a relevant factor in determining the observed ex-post performance of the project?
Was the project design flexible enough to be adjusted, if needed, to external and unexpected constraints?
Forecasting capacity
Relates to the feasibility and capacity to predict future variables, such as the demand level.
A good initial investment in building the forecasting capacity does not eliminate risks, but it increases the knowledge of the context, improves the project design and optimises the distribution of responsibilities without lowering the commitment to performance.
Were the ex-ante forecasts based on a sound methodology and a comprehensive set of information?
Were some important factors not sufficiently considered ex-ante?
Was the forecasting capacity a relevant factor in determining the observed ex-post performance of the project?
Project governance
Concerns the number and type of stakeholders involved throughout the project cycle and how responsibilities are attributed and shared.
High stakeholder involvement, well-defined roles and responsibilities and incentive mechanisms require commitment of resources and increase the complexity of the decision-making process, which may be subject to particular pressures, but they can favour the project performance and its sustainability over time.
What are the interests and motives of different actors and incentives for decision-making? How did they change over the time-span considered?
Was the ownership of the project clearly identified?
Did contractual arrangements improve the co-ordination of different stakeholders towards achievement-oriented results?
Was project visibility a relevant political incentive to foster proper project implementation? Was the project subject to political or other forms of pressure?
Managerial response
Defined as the managerial and professional ability to react to unforeseen events.
Unpredicted events that occur and undermine the sustainability of the project and its capacity to lead to expected benefits can be overcome by prompt and adequate response from the decision-makers and project managers, driven either by professionalism and experience or by creativity and imagination.
How did the project react to exogenous, unpredictable, events?
What remedial actions were put in place? What mechanisms were used to incentivise proactive responses?
Why were these events unexpected? Was it due to their purely exogenous and ex-ante unpredictable nature? Or, was it due to poor planning capacity?

73
STRUCTURE OF CASE STUDIES AND STANDARD TABLES OF RESULTS
Qualitative and quantitative findings are integrated in a narrative way, in order to develop ten
project ‘histories’ and to isolate and depict the main aspects behind their long-term
performance. All case study reports share the same outline, presented in the following Table:
Table I.3 OUTLINE OF THE CASE STUDY REPORT
SECTION CONTENT
Projects description
The first section provides a brief sketch of the unit of analysis. It describes the key structural features of the infrastructure and the service delivered, the context in which it takes place, the target population and the current performance of the project.
Origin and history This section describes the background in which the decision to initiate the project was taken, the need and objectives expected be met and the key stakeholders involved and their role. The section should present a brief chronicle of the main developments after the construction phase and the most recent facts.
Description of long-term development effects
This section should describe the main long-term development effects provided by the project. The seven categories of effects should be considered and for each of them an assessment of the contribution of the project to that specific effect, and the timing of their materialisation and evolution, should be given.
Determinants of project outcomes
The main drivers influencing the performance observed are described and elaborated here. The evaluators should provide their own assessment for each of the five key determinants of project outcomes identified in the conceptual framework.
Conclusions The key messages in terms of lessons learnt are developed here.
Annexes Ex-post cost-benefit analysis report, list of interviewees, other ad hoc analysis if relevant (such as stakeholder mapping).
In order to maintain the structure of all the case study reports as similar as possible, and
facilitate the cross-project analysis of findings, a set of standard tables is used to summarise
the main evaluation results related to three dimensions of analysis (‘What’, ‘When’ and ‘How’).
Section 3 and 4 of each case study include standardised tables in which scores are assigned to
each type of long-term effect and each determinant. Scores ranging from -5 to +5 are given in
order to intuitively highlight which are the most important effects generated for each case
study and which are the most relevant determinants explaining the project outcomes. In other
words, scores are used to rank the effects and determinants, showing which ones are the most
relevant. Moreover, the plus or minus signs indicate the nature of the effects produced by the
project (was the impact positive or negative?) and of the determinant of project performance
(did the determinant positively or negatively contribute to the project outcome?).
The same scores are used to disentangle the project’s impacts on different stakeholders. This
table allows one to better interpret the aggregated score given to each effect, by
understanding on which actor the project impacted the most: for example, a +3 score to
“Direct economic growth” may be reflected by a very high positive effect on the infrastructure
operator (valued, for instance, +5) and a slightly negative effect on other actors (valued -2). As
shown by this example, the aggregate score of each effect and the scores related to different
stakeholders should be consistent with each other and should results from a sort of weighted
average of the impacts on individual stakeholders: an aggregate positive score is inconsistent
with negative impact scores on all the different stakeholders involved.

74
Table I.4 SCORES ON PROJECT’S IMPACT AND DETERMINANTS OF PROJECT OUTCOMES
Score Meaning
+5 Given the existing constraints, the highest positive effects have been generated.
+4 Given the existing constraints, high positive effects have been generated, but more could have been achieved under certain conditions.
+3 Moderate positive effects have been generated, with large scope for further improvement.
+2 Some positive effects have been produced.
+1 Very little, almost negligible, positive effects have been generated.
0 No effects have been generated.
-1 Very little, almost negligible, negative effects have been generated.
-2 Minor negative effects have been produced.
-3 Moderate negative effects have been generated, but they could have been worse.
-4 Highly negative effects have been generated.
-5 The highest negative effects have been generated.
Note: The same scores have been used for assessing both the project’s impacts and determinants. In the first case, they have to be interpreted as the nature and strength of effect generated by the project; in the latter, they indicate the strength of each determinant factor in influencing the project outcomes.
The ‘When’ dimensions results are synthetically presented by means of another table: for each
kind of effect, a score is given to explain how the nature and strength of the impact evolved
over the years, by focusing in particular, on the short-run (approximately 1-5 years after the
project’s completion), the long-run (6-10 years after the project’s completion) and the future
period. The Table contains information that allows the reader to immediately understand
whether the project impacts have already stabilised or not. The meaning of the symbols used
and an example of their application is presented in the following two Tables.
Table I.5 SYMBOLS USED TO DESCRIBE THE TEMPORAL DYNAMICS OF THE EFFECTS
Symbol Meaning
+ or - Positive or negative effect.
++ or -- Positive or negative effects reinforced (in positive or negative direction) with respect to the previous stage.
+++ or --- Positive or negative effects further reinforced (in positive or negative direction) with respect to the previous stage.
+/- Mixed effect, it is not possible to assess whether the impact was positive or negative.
Source:
Table I.6 EXAMPLES OF TEMPORAL DYNAMICS OF THE EFFECTS
Short run (years 1-5)
Long run (years 6- 10)
Future years
Comments
+ + + The positive effect stabilised in the short-run.
+ ++ ++ The positive effect stabilised in the long-run.
+ ++ +++ The effect has grown over the years and is expected to increase also in the future.
- + ++ The effect was at first negative; after some years it turned positive and it is still not stabilised yet.
+/- + ++ Effects have been mixed in the initial stage, became positive in the long-run and are expected to further increase in the future.

75
ANNEX II. COST-BENEFIT ANALYSIS
INTRODUCTION
This annex presents the results of the ex post Cost-Benefit Analysis (CBA) performed on the
M1 motorway, as described in Sections 1 and 2 of the main report. We describe first the
methodology used, which is in accordance with the methodology set out in the 1st Interim
Report presented to the Commission in July 2011. We then summarise the results generated.
METHODOLOGY
Project Definition and Counterfactual
CBA in the first instance requires a definition of the project to be analysed. This “Do Project”
option is then compared against a counterfactual, what would have happened in the absence
of the project, usually a “Do Nothing” or “Do Minimum” option.
It is the norm also to consider at least one other alternative option, usually described as a “Do
Something” option, which is also compared against “Do Nothing” or “Do Minimum”. The
results of “Do Project” and “Do Something” are then compared, to determine whether in fact
“Do Project” was the optimal choice.
The “Do Project” option is the M1 motorway stretching from just south of Dublin airport to
north of Dundalk, as defined in Sections 1 and 2 of this report. The counterfactual “Do
Nothing” option, is defined as the old road with no improvements other than those that have
actually been made.
In defining a “Do Something” option, we are guided by the findings of the National Road Needs
Study (NRA [1998]), as discussed already in Section 4.2. The forecasts in the Needs Study
indicate that, with the exception of the Cloghran-Lissenhall and Lissenhall-Balbriggan sections,
standard “Type 1” grade-separated dual carriageway would have been adequate for the
route115. Actual traffic volumes in the meantime have confirmed this.
Another potential alternative scenario would be to invest in an alternative transport mode, i.e.
rail, as the M1 is closely paralleled by the Dublin-Belfast rail route, which also carries the
Dublin Northern Commuter route116. Indeed, there has been significant investment in this rail
route over the past two decades, in track renewal, rolling stock and signalling117. However, it is
115
In fact, for the Drogheda- Dunleer section, at-grade “Type 2” dual carriageway would have been adequate, but for simplicity we use Type 1 dual carriageway for all sections from Balbriggan northwards. The National Road Needs Study indicates that standard dual carriageway is only 13% more expensive to build than at-grade dual carriageway, while speeds would be reduced. One would also expect that safety would be compromised to some degree, although NRA (2008) indicates the same accident rate for Type 1 and Type 2 dual carriageways. 116
As per EU Commission Guide (2008), rail could be considered a “global alternative” option to the motorway, whereas the dual carriageway could be characterised as a “technical Alternative”. 117
http://tentea.ec.europa.eu/en/ten-t_projects/30_priority_projects/priority_project_9/

76
difficult to see how further investment in the rail service might have acted as a viable
alternative to upgrading the N1 road, for two reasons:
(i) Ireland’s low population density and dispersed settlement pattern, even in the Greater
Dublin Area, and the size of urban centres, do not lend themselves to the type of high
capacity rail services that would have been necessary in order to obviate the need for
road investment118. Indeed, public transport in Ireland is dominated by bus, i.e. road-
based services119.
(ii) As discussed in the main body of this report, such was the inadequacy of the pre-
existing road, in terms of capacity and safety, that significant investment would have
been required even if traffic volumes had been reduced.
In view of this, we did not consider rail investment as an alternative to the development of the
M1 motorway.
Thus to summarise the definition of the project, the counterfactual and the alternative
options:
Table II.1 CONFIGURATION OF ROUTE UNDER “DO NOTHING” (COUNTERFACTUAL),
“DO PROJECT” AND “DO SOMETHING”
Section “Do Nothing”* “Do Project” “Do Something”
Cloghran Lissenhall Type 2 dual carriageway Motorway Motorway
Lissenhall Balbriggan 2 lane single carriageway Motorway Motorway
Balbriggan Bypass 2 lane single carriageway Motorway Type 1 dual carriageway
Drogheda Bypass 2 lane single carriageway Motorway Type 1 dual carriageway
Dunleer Bypass 2 lane single carriageway Motorway Type 1 dual carriageway
Dunleer- Dundalk 2 lane single carriageway Motorway Type 1 dual carriageway
Dundalk Western Bypass 2 lane single carriageway Motorway Type 1 dual carriageway
*Type 2 dual carriageway for part of road going through Drogheda and Dundalk towns.
Identifying cost and benefit details for “Do Something” is not straightforward, as the option of
building dual carriageway as opposed to motorway on the route was not analysed in detail by
the NRA. Therefore in many cases we are forced to use estimates and benchmarks. Comparing
“Do Something” with “Do Project”:
Capital cost per km of road will be lower. The National Road Needs Study (1998)
indicates that standard dual carriageway costs approximately 78% of the cost of
motorway on a per kilometre basis (including land purchase, planning and other costs,
based on 1996 values).
Maintenance costs per km are the same for the two road types, per NRA (2008).
118
For a general discussion see for example Amos et al. (2010) 119
Central Statistics Office (2011c) indicates that bus journeys constituted 4% of all journeys undertaken in the State in 2009, compared to 1% for rail/tram and 73% for car; in Dublin the equivalent ratios were 9%, 4% and 63% respectively.

77
Traffic volumes, vehicle proportions, speeds, journey purposes and vehicle operating
costs are taken to be the same, given that capacity constraints do not apply with either
option except on the south-most sections.
Accident rates on dual carriageways are approximately 2.5 times the rate on
motorways, and the severity of accidents is slightly higher, per NRA (2008).
Ideally also we would like to consider the road without a toll in our “Do Something” scenario,
but we lack the detailed information (i.e. the level of diversion back onto the old road) to
undertake this. Therefore, our “Do Something” option includes the same toll scenario (toll
rates, locations, revenues, costs) as in “Do Project”.
Perspective
It is also important to define from whose perspective the project appraisal is undertaken. This
is because project costs and benefits accrue to different stakeholders at different geographic
and political levels, and there are often trade-offs between them120. Given that:
(i) The M1 forms part of the TEN-T United Kingdom-Ireland-Benelux Road Axis (Priority
Axis No.13), which links the three main cities on the island of Ireland with Great Britain
and Continental Europe, and
(ii) The project received very considerable funding from the EU Structural and Cohesion
Funds, and the cross-national objectives of these funds,
it is appropriate to consider the project from an EU perspective. That is, all costs and benefits
that accrue to the EU as a whole are relevant121.
Timeframe
The M1 motorway was delivered in a number of sections over a period of 16 years (1989-
2005). The earliest completed section, the Dunleer Bypass, opened in 1993 while the most
recently completed section, the Dundalk Western Bypass, opened in 2005, and thus has been
operational for six years.
To cater for this, we have performed a CBA for each section of the road separately, and then
combined them to generate an amalgamated CBA (taking care not to double count any costs
or benefits). We are considering a project timeframe of 30 years from the first year of
expenditure, and our timeframe stretches from Year 0 (1989) to Year 30 (2019).
Direct Impacts (Operator)
The main direct operator costs122 are:
120
See also discussion on “Who has standing?” in the EU Commission Guide (2008). 121
We also consider the impact of the project on Greenhouse Gas emissions, which has a global impact. 122
All values are stated net of VAT in the model.

78
Investment costs, i.e. capital expenditure (actual incurred by year, Table II.2), and
Operational costs, made up of:
- annual maintenance costs,
- costs related to operating the toll concession123, and
- major repaving costs after twenty years of operations.
We have used standardised annual maintenance expenditure levels of EUR 21,600 per
km per annum in 2011 money124.
The main direct operator benefit is toll income (see below).
Table II.2 CAPITAL EXPENDITURE BY YEAR, EUR MILLION (2011 MONEY)
Cloghran Lissenhall
Lissenhall Balbriggan
Balbriggan Bypass
Drogheda Bypass
Dunleer Bypass
Dunleer- Dundalk
Dundalk Western Bypass
Total
1989 0.0 0.0 0.0 0.0 2.4 0.0 0.0 2.4
1990 0.0 0.0 0.0 0.0 1.2 0.0 0.0 1.2
1991 0.0 0.0 0.0 0.0 15.4 0.0 0.0 15.4
1992 0.0 0.0 0.0 0.0 17.2 0.0 0.0 17.2
1993 0.0 0.0 1.8 0.0 17.9 2.6 0.0 22.4
1994 0.0 0.0 2.0 0.0 5.1 1.3 0.0 8.3
1995 0.0 0.0 3.0 0.0 0.0 1.5 0.0 4.4
1996 0.0 0.0 10.4 0.0 0.0 8.2 0.0 18.7
1997 0.0 0.0 20.8 0.0 0.0 10.2 0.0 31.0
1998 2.9 0.5 28.4 0.0 0.0 30.9 0.0 62.8
1999 2.9 0.5 4.8 17.4 0.0 35.9 1.2 62.8
2000 12.0 1.2 0.0 19.5 0.0 44.9 2.4 80.0
2001 40.5 13.1 0.0 50.1 0.0 10.0 3.7 117.4
2002 46.2 23.0 0.0 70.8 0.0 0.0 2.6 142.7
2003 42.9 24.3 0.0 23.8 0.0 0.0 1.8 92.7
2004 1.4 1.9 0.0 0.0 0.0 0.0 48.7 52.1
2005 0.0 0.0 0.0 0.0 0.0 0.0 55.1 55.1
Total 149.0 64.5 71.2 181.7 59.2 145.5 115.5 786.6
123
The capital costs of the toll booths and related infrastructure is included in the investment costs. 124
Per NRA (2008). Actual annual maintenance and repaving expenditure will vary from these standardise levels. NRA personnel indicate that its maintenance budget has been cut in recent years, and the actual levels of expenditure are not as high as the standard level. Actual repaving costs will be driven by road condition, rather than the expiry of twenty years (no section of the M1 has been in place for twenty years as yet). However, under-expenditure under these headings in the short term is likely to necessitate increased expenditure in the future, so we work on the basis that the two will cancel out on a discounted basis. NRA personnel indicate that in fact postponed expenditure in the short run will lead to greater than proportional expenditure in the future to bring road quality back to the desired level (interview with NRA personnel, 29
th July 2011).

79
Direct Impacts (user)
The main direct user impacts are:
Time savings based on recorded AADTs and actual or modelled time savings,
Reduced accidents, based on expected accident and severity rates for the respective
road types, and
Changes in vehicle operating costs, based on NRA models for net-of-tax fuel and non-
fuel costs; the key independent variable is speed, and observed or expected speeds
were used.
The sum of these represent additional consumer surplus experienced by the users of the
route, in the context of a free motorway. For the tolled section of the motorway (see
discussion below), consumer surplus is the above less toll revenues.
Users of the route fall into three groups:
i. Those diverted from the old road to the new road;
ii. Those who remain on the old road, and benefit from the improved driving conditions
there;
iii. Additional “induced” traffic on the route, attracted by the improved driving conditions
on both the old and new roads; some of which will constitute additional trips that
would not otherwise have arisen, while some may be diverted to other nearby
routes125.
Table II.3 SOURCES OF FUNDING FOR THE ROAD’S CONSTRUCTION
Sections Exchequer EU Private Sector Total
Cloghran Lissenhall 47.6% 52.4% 0.0% 100.0%
Lissenhall Balbriggan 36.0% 64.0% 0.0% 100.0%
Balbriggan Bypass 37.1% 62.9% 0.0% 100.0%
Drogheda Bypass 73.9% 26.1% 0.0% 100.0%
Dunleer Bypass* 15.0% 85.0% 0.0% 100.0%
Dunleer- Dundalk 51.3% 48.7% 0.0% 100.0%
Dundalk Western Bypass 19.5% 1.1% 79.4% 100.0%
Total 48.6% 38.2% 13.2% 100.0%
*we could not ascertain the actual EU co-funding rate for this section of the road, so we have assumed the standard co-funding rate that applied in the 1989-1993 round.
125
The N/M1, N/M2 and N/M3 are all routes radiating from Dublin northwards, and are the main links to Northern Ireland and the north-west of Ireland. As the M1 was upgraded first, some traffic would have diverted from the N2 and N3. On the other hand, as the N2 has now been upgraded and is not tolled, traffic may now be diverting to it from the M1.

80
The key information required to calculate the time savings are “before” and “after” AADTs and
journey times on both the old and new roads. We have been unable to obtain the “after”
AADTs and journey times for the old road, as in most cases the NRA ceased measuring traffic
volumes on this road when the new motorway opened, and we are forced to leave the related
benefits unvalued126.
Data for the new road are set out in Table II.4127.
Table II.4 TRAVEL TIME SAVING ON OPENING OF NEW ROAD SECTION, AND AADT ON
OPENING AND IN 2010
Sections Time saving per vehicle (minutes)
Year of Opening
AADT
Year After Opening
2010 %age growth since opening
Annual Avg %age
growth
Cloghran Lissenhall 3.81 2003 65,915 81,516 24% 3.6%
Lissenhall Balbriggan 1.36 2003 41,869 50,524 21% 3.2%
Balbriggan Bypass 8.05 1998 20,600 27,705 34% 2.7%
Drogheda Bypass 9.48 2003 23,169 27,001 17% 2.6%
Dunleer Bypass 5.03 1993 7,733 31,032 301% 9.1%
Dunleer- Dundalk 4.04 2001 16,671 26,456 59% 5.9%
Dundalk Western Bypass 5.40 2005 18,702 20,050 7% 1.8%
For forecasts of future AADTs we use the NRA’s regional forecasts as set out in Table 2.7 in the
main body of the report.
These new road sections for the most part replaced standard two-lane roads, the main
exception being Cloghran-Lissenhall, which had been an at-grade (“Type 2”) dual carriageway.
Given the substantial increases in traffic since opening, it is reasonable to conclude that the
time savings vis à vis the old road have grown since opening.
In order to estimate this we are guided by the 1998 National Road Needs Study. This provides
the following indicators of Level Of Service (LOS) and speeds for the relevant road types:
126
A further issue with regard to time savings is that the actual benefit relates not only to the average time saving, but also to the reduction in variability in journey time. This would be particularly pertinent to traffic that needs to connect with ferry sailings or flights. Where a fleet manager places a high value on being on time, reductions in variability can be at least as valuable as reductions in average journey times. Consider a circumstance were the fleet manager requires 95% certainty of arriving on time. He/she will have to leave two standard deviations on top of the average journey time in order to achieve this (assuming a normal distribution of journey times). If this standard deviation can be reduced (and on an uncongested motorway it can be virtually eliminated), the benefit can be substantial. It is not straightforward to incorporate this into a CBA model, however, partly because the value placed on reliability of journey time is likely to vary considerably by economic sector (see for example McKinnon et al., 2008). In view of this, we do not include it in our calculations, and to this degree, the benefits of the new road are understated. 127
There will of course be network benefits observable at a sectional level, as each new section comes on stream, in terms of increased AADTs. One might argue that the increased AADT on Section X as a result of the opening of Section Y should properly accrue to the latter. However, to isolate the true impact of each section over the chronology of the road would be an onerous task, and we have taken the simplistic approach of measuring the benefits of each section by reference to the actual observed AADT on that section over time.

81
Table II.5 SPEED AND AADTS FOR LEVELS OF SERVICE (LOS) FOR VARIOUS ROAD
TYPES
LOS
C D E
Average Speed (kph) 84 80 72
AADTs
Standard Two-Lane Road 8,400 15,000 26,800
Type 2/Reduced (at-grade) Dual Carriageway 27,000 34,400 41,800
Type 1/Standard Dual Carriageway 45,000 57,400 69,600
Two-lane Motorway 56,500 72,200 81,200
Notes: 1. AADTS relate to ex-urban routes. Different AADTs are quoted for rural and commuter roads in the Road Needs Study, with the latter being higher. To be conservative, we have presented the commuter values here. 2. LOS D is the recommended trigger for up-grading the road section, in the Road Needs Study. Source: National Road Needs Study (1998)
Traffic volumes currently being experienced on the new road significantly exceed (i) volumes
when the road was opened, and (ii) volumes that the old road would have been capable of
handling, keeping in mind that the old road still caters for its own traffic volumes not included
in the above numbers.
In the absence of the new road, the level of congestion on the old road would now be very
serious, and at peak times would likely be reaching gridlock, with severe consequences for
journey times. To reflect this, we work on the basis that time savings will grow in line with
traffic volume growth. This is a conservative approach: in practice journey times can be
expected to grow more rapidly than traffic volumes as capacity is approached128.
With respect to accidents costs, we use the NRA’s Project Appraisal Guidelines (2008) as our
source for accident rates for different types of roads, as follows:
128
For a discussion see Nash & Sansom (1999). In practice, when roads experience serious levels of congestion, drivers tend to react in three possible ways: (i) making the journey earlier or later to avoid the peak, leading to peak-spreading, where the road is at peak for a greater proportion of the day, (ii) making the journey on an alternative route, or (iii) foregoing the journey altogether. Because of option (ii) spillover effects can be seen on nearby roads. Congestion itself can also cause serious spillover effects, as delays accessing the congested route cause back-ups on feeder routes at peak times. All three phenomena entail costs; they would have been present to some degree on the old N1, would have been relieved to a greater or lesser extent by the new road, and hence would be reflected to some extent in the new road’s AADTs. The related costs are difficult to measure however and we work on the basis that our methodology of growing time savings in line with AADTs captures the elimination of these costs.

82
Table II.6 STANDARDISED ACCIDENT RATES BY SEVERITY PER ROAD TYPE PER MVKM
Fatal Serious Slight Total
Motorway
rate 0.00222 0.004921 0.029859 0.037
proportions 6.0% 13.3% 80.7% 100.0%
Dual carriageway (>=80kph)
rate 0.006392 0.014006 0.073602 0.094
proportions 6.8% 14.9% 78.3% 100.0%
Single carriageway (>=80kph)
rate 0.013774 0.034932 0.093294 0.142
proportions 9.7% 24.6% 65.7% 100.0%
Single carriageway (<60kph)
rate 0.02151 0.082694 0.374274 0.478
proportions 4.5% 17.3% 78.2% 100.0%
Source: NRA
Actual data confirm that substantial reductions in fatal accidents have been achieved on the
road. Between 1996 and 2003 there were 30 fatalities on the unimproved sections of the road,
while between 1998 and 2004 there were 2 fatalities on the improved sections. Between 1985
and 1993 inclusive there were 18 fatal accidents on the section of the old road that was
replaced by the Cloghran-Lissenhall and Lissenhall-Balbriggan sections129. Box 2.1 in the main
body of the report has highlighted the accident reductions achieved on the Dunleer Bypass in
particular.
The NRA guideline rates appear to match actual fatality rates on motorways in the period
1998-2002, but may be too high for dual carriageways and single carriageways. However,
these were small sample sizes for motorways and dual carriageways and for the purposes of a
long term evaluation including a future period, it is more appropriate to use standardised
rather than actual observed historic accident rates.
Toll Income
A complication of this CBA is that one section of this road (south of Drogheda) is tolled, and
the question arises as to how to treat the toll income. We have taken the view that toll income
effectively captures part of the consumer surplus generated by the direct benefits, and
converts it to producer surplus130.
In that sense, the toll income represents a transfer from road users to the toll concessionaire,
and therefore while it affects the financial return on the project it does not affect the
economic return.
129
Fingal Co. Co. (1995), EuroRAP (2005), RSA (2007). 130
Producer surplus is actually toll income less the cost of operating the toll concession, which is included under financial costs in the CBA.

83
The presence of the toll almost definitely diverts some traffic back onto the old road, and may
discourage some trips altogether131, but this is reflected in the actual AADT data.
There are two complications with the toll concession:
i. A certain proportion of the toll income collected is transferred to the Exchequer, based
on traffic volumes above a certain level, under the toll agreement (see Table II.7). This
reduces the financial cost to the Exchequer of the project, and as the shadow price of
public funds is greater than one it also reduces economic cost.
ii. The tolls are collected on the Drogheda Bypass, at a point just south of Drogheda.
However, the NRA built and paid for this section of the road (including the toll plaza
and booths themselves). The toll concessionaire built the Dundalk Western Bypass and
is responsible for maintaining the motorway as far south as the start of the Balbriggan
Bypass, for a period of 30 years. We have taken the view that functionally the toll
relates to the Drogheda Bypass and we have included the revenues and costs with this
section of the motorway.
Table II.7 M1 TOLL INCOME TO DATE (EUR MILLION)
Year Toll Revenue Including VAT
Toll Revenue Ex VAT
Toll Revenue Retained by State (ex VAT)
NRA Operator Costs
2003 7.0 5.8 4.7 0.8
2004 15.0 12.4 11.3 0.6
2005 20.4 16.9 11.7 -
2006 21.1 17.5 1.6 -
2007 24.7 20.4 1.3 -
2008 26.8 22.2 1.5 -
2009 27.0 22.2 0.7 -
2010 25.6 21.1 0.0 -
Note: The toll concession commenced operations in June 2003. As part of the toll agreement, the concessionaire was responsible for building the Dundalk Western Bypass, and until it was completed the concessionaire was obliged to hand over 95% of collected tolls net of collection costs to the NRA. The Dundalk Western Bypass was completed in September 2005. See fuller discussion in the body of the report.
Source: NRA
131
On the basis that the additional WTP for some trips on the tolled section of the motorway compared with the alternative free route will be less than the toll rate. Physical toll barriers also slow down traffic, which reduces time savings, thus further reducing benefits vis a vis an untolled situation.
By and large, the economically efficient toll on an unconstrained motorway (ignoring pollution and road damage) is NIL. Because of the break-even constraint on the toll operator, a positive toll must be charged, which distorts the economy away from its optimum (because some trips are discouraged or diverted). Therefore, the imposition of a toll does not simply result in a splitting of the consumer surplus into consumer and producer surplus: some surplus is irrevocably lost.
One can also consider the question of how best to design tolls so as to minimise this loss (i.e. minimise the distortion or the degree to which trips are discouraged or diverted). In the context of a multi-product monopolist, this “second best pricing” problem is addressed by Ramsey prices, which indicates that the mark-up charged should be the inverse of the price elasticity of demand (i.e. the more price sensitive the customer, the lower the price). We are not in a position to know whether this is actually the case with the tolls being charged on the Drogheda Bypass, but the differentiation between customers, into motorbikes, cars, vans, buses and trucks may not be sufficient to fully capture variances in price elasticity of demand (at a minimum, work-related and non-work related car journeys are unlikely to exhibit the same elasticity). Furthermore, the Drogheda Bypass is not a monopoly, as there are alternative road and rail routes.

84
Residual Value
We have assumed that the useful life of each section of the road is 50 years, starting in the
year of completion. Given that this is greater than the 30 year timeframe we are considering in
the CBA, there is a requirement to consider residual value as of Year 30 (2019). Two
approaches are suggested in the methodological guidance in the 1st Interim Report:
The discounted value of future net revenues after Year 30; or
A value based on the estimated net undepreciated construction cost of the road.
The first of these is relevant where financial benefits arise, i.e. in the current context, toll
revenue. Tolls are being collected on the Drogheda Bypass from the period 2003 to 2032
inclusive, a period of 30 years. So there will be a further 20 years of useful life for this section
during which no toll income will arise (assuming the concession is not renewed).
Our approach to calculating residual value for the Drogheda Bypass is to use the discounted
value of net toll income less toll operating costs and road maintenance plus the discounted
value of the remaining useful life at the end of the toll concession. For the other sections of
the road we use the undepreciated construction cost as at 2019.
Conversion to 2011 Prices and Values
All observed prices are current, and need to be converted to 2011 prices and values. The first
step is to convert to 2011 prices, and then to convert the resultant figures to 2011 values,
reflecting the increased real values (net of inflationary changes) over time. The following
approach was taken, for the relevant value streams:
Table II.8 CONVERSION OF COST AND BENEFIT STREAMS TO 2011 PRICES AND VALUES
Cost/Benefit Stream Conversion to 2011 Prices Conversion to 2011 Values
Road Construction and maintenance costs
DKM construction price deflator
(based on NRA data);
n/a
Value of Time for passengers GDP deflator real GDP growth per Capita
Value of time for freight GDP deflator real GDP growth
Value of accidents avoided GDP deflator real GDP growth per Capita
Fuel costs Irish Consumer Price Index (CPI) fuel sub-index
n/a
Non-fuel vehicle operating costs CPI transport maintenance and repair sub-index
n/a
Source: CSO, DKM, NRA
GDP growth must be forecast, to generate values for future years. We generate a base, high
and low value. The base and low values are taken from the IMF World Economic Outlook
(WEO) for April 2011132 and the Irish Central Bank’s Financial Measures Programme report of
132
http://www.imf.org/external/pubs/ft/weo/2011/01/pdf/text.pdf

85
March 2011133. The high case is 1% higher than the base case each year. We generate scenario
analysis for each of these cases.
Indirect/External Impacts
The first external impact we consider is changes in emissions of greenhouse gases (GHGs),
mainly CO2, as a result of changes in fuel usage. NRA (2008) gives the expected increase in fuel
usage for changes in speed and distance travelled. The Sustainable Energy Authority of Ireland
(SEAI) indicates that 0.002630369 tonnes of CO2 are released for every litre of diesel burned.
We then apply values to these emissions, based on guidance in the 1st Interim Report, to all
emissions post 2010. Ireland currently has a carbon tax on fossil fuels equivalent to EUR 15 per
tonne of CO2, and this is netted off, for the purpose of calculating the uninternalised cost of
these emissions.
The guidance in the 1st Interim Report presents medium, high and low future values of CO2,
and we use these to generate alternative scenarios134.
The second important set of indirect/external impacts refers to the impacts on the by-passed
towns. These can be further sub-divided into (i) environmental and (ii) commercial. The local
environment will have improved, due to:
reduced localised airborne pollutants,
less noise (see below),
less congestion (already partly counted under the time savings heading), and possibly
greater safety (already counted under the accidents cost heading).
These impacts will to some degree have transferred onto the route of the new road, but are
likely to be considerably less intense on the latter.
The main localised pollutants that impact on human health are Particulate Matter (PMs),
Carbon Monoxide (CO), and Oxides of Sulphur and Nitrogen (SOx and NOx). Most of these are
also regional or global pollutants, with the exception of PMs, whose impact is primarily local135.
The installation of catalytic converters in vehicles and the ever more stringent requirements of
133
http://www.centralbank.ie/regulation/industry-sectors/credit-institutions/Documents/The%20Financial%20Measures%20Programme%20Report.pdf 134
The low scenario value is less than the current Irish carbon tax until the latter years of this decade, and for these years we place a NIL value on the uninternalised cost of emissions. 135
Low level ozone is another localised pollutant that can form from uncombusted hydrocarbons under certain atmospheric conditions. These conditions are relatively rare in Ireland however, and catalytic converters have reduced the amount of uncombusted HCs emitted.

86
the EURO emissions standards136 are having a substantial impact on the level of emissions over
time.
Before and after data on transport-generated pollutants in the by-passed towns are not
available. However, the Environmental Protection Agency (EPA) did monitor air quality in
Drogheda and Dundalk in the early 2000s, before these towns were by-passed. The data
indicated that only PMs were above threshold levels137, and on this basis we consider only this
pollutant.
The SEAI indicates that an average of 0.55g of PMs are generated per litre of diesel burned,
and it publishes pollution damage costs for 2011, for PMs in an urban and ex-urban
environment, of EUR 28,555 and EUR 5,804/tonne respectively138. These values point to a
substantial benefit from diverting traffic out of urban areas, notwithstanding additional fuel
usage. However, even on the old road, the majority of the journey was in an ex-urban
environment. We estimate that perhaps 10% of the route was in an urban environment, so the
net benefit is modest.
Commercially, the direction of impact is prima facie ambiguous. The improved physical
environment may encourage more economic activity, including re-establishing the town’s
place as the local retail and services centre. On the other hand some businesses, especially
those related to transport, may lose as a result of the by-pass.
Most of the literature on the net economic impact of by-passing a town relates to North
America. For instance, Comer & Finchum (2001) find that the direction of commercial impact is
dependent on the size of the town. Small towns (less than 2,500 inhabitants) tend to already
be in economic decline, a process which the by-pass accelerates. However:
“in contrast, larger towns […] continue to prosper and even thrive, due to their greater diversity of business and other activities, and their lesser dependence on the bypassed routes”.
Larger towns cited in the paper have populations of 13,000-17,000. Swords, Balbriggan,
Drogheda and Dundalk are all at least this size. The implication is that Dunleer, Julianstown
and Castlebellingham would be vulnerable to being by-passed. These findings are echoed in
other papers, for example Leong & Weisbrod (2001).
These papers also confirm that transport-related businesses (filling stations, fast-food
restaurants, etc.) tend to lose sales while other businesses can benefit, although one
econometric study (Srinivasan & Kockelman [2002]) found that negative impacts were felt
across a wider set of sectors.
136
EURO V came into force in September 2009. EURO VI, which will deliver a further substantial cut in emissions, comes into force for new vehicles from January 2013. http://ec.europa.eu/environment/air/transport/road.htm. 137
http://www.epa.ie/downloads/pubs/air/monitoring/EPA_air_assessment_Drogheda.pdf; http://www.epa.ie/downloads/pubs/air/monitoring/EPA_air_assessment_Dundalk.pdf. 138
http://www.seai.ie/Publications/Renewables_Publications/ “Hybrid & Electric Vehicle Cost Calculator”.

87
A 2003 study of the longer term impacts of by-passes by Comer & Finchum concluded that the
long term economic growth rates in by-passed towns was lower than in non-by-passed towns.
Other studies (e.g. Thompson et al., 2001) have found a negative impact on retail sales, even in
towns that benefited overall from being by-passed.
Most studies we found considered only small urban areas (less than 20,000 inhabitants).
However, a study of larger urban areas (70,000 to 1,000,000) found broadly similar (and
overall positive) results to the studies looking at the smaller towns139.
That said, much if not most of these commercial impacts are likely to be displacements rather
than additional, the most obvious being petrol and diesel sales, and since the overall impact
does not appear to be strongly positive or negative, we leave these commercial impacts
unvalued in our CBA.
Finally, we consider noise impacts, which could be expected to affect the new route negatively
and the old route positively. One would expect that the positive effects on the old route
should exceed the negative effects on the new route, as the former passes through a number
of urban areas.
Noise Action Plans for County Meath140, Louth141 and the “Dublin agglomeration”142 provide
data on noise levels along both the new and old routes. In accordance with the Environmental
Noise Directive (2002/49/EC)143, and working on the basis of threshold noise levels of 75
decibels (day-evening-night) and 57 decibels (night), they find that only small numbers of
residents along the either route experience above-threshold noise levels. Noise level data on
the old route pre-motorway are not available, however. Thus, we do not place a monetary
value on noise impacts of the new route.
Shadow Prices
The main shadow prices to consider relate to construction labour, public funds, and land.
As per the guidance in the 1st Interim Report, the factor for converting to the shadow price of
labour in the Southern and Eastern region of Ireland, which includes Fingal and Meath, is 1.00.
For the Border region, which includes Louth (most of the Drogheda bypass and all sections
north of it), the factor is 0.95.
The shadow price of public funds is relevant to actual Exchequer expenditure (net of EU
funding and toll revenue returned to the Exchequer, to reflect the distortionary impact of non-
optimal taxes raised to fund public expenditure on the road as well as crowding out of private
139
Collins & Weisbrod (2000). 140
http://www.meath.ie/LocalAuthorities/Publications/RoadsPublications/NoiseActionPlanforRoads/File,33183,en.pdf 141
http://www.louthcoco.ie/en/Services/Environment/Forms/Noise-action-Plan.pdf 142
http://www.dublincity.ie/WaterWasteEnvironment/NoiseMapsandActionPlans/Documents/DublinAgglomerationAction%20Planning10pageSummary.pdf 143
http://eur-lex.europa.eu/LexUriServ/LexUriServ.do?uri=CELEX:32002L0049:EN:NOT

88
expenditure. The EU Commission 2008 Guide to CBA indicates that “If there are no national
guidelines on this issue, MCPF (marginal cost of public funds) = 1 is the default rule suggested
in this Guide” (p.54).
National guidelines do exist for Ireland. CSF evaluation Unit (1999) states: “we recommend
that a shadow price of 150% be applied to Exchequer cash flows (taxes, subsidies and grants)
to take account of the distortionary effect of taxation”(p.15). This is in line with the
recommendations in Honohan (1998), who noted that the appropriate figure in the mid-1980s
would have been in excess of 200%, the reduction over time reflecting lower marginal income
tax rates.
More recently, Murphy et al. (2003) in a report to the State enterprise promotion authority,
have recommended using 1.25, reflecting further reductions in marginal income tax rates.
On this basis, we apply a rate of 1.5 for expenditure in the 1980s and 1990s, and 1.25 for
expenditure in the 2000s and the current decade144.
The correct valuation of land is important in the current context, as the project is land
intensive. The correct value to use is economic opportunity cost, but there is a number of
reasons why this would not equate to market price, including restrictive zoning in certain
areas, and the various market distortions in the agriculture sector. Furthermore, as land for
road projects is often compulsorily acquired, there is a further possibility of distortion in
pricing (Section 3.7 of the main body of the report discusses further). Table II.9 summarises the
percentage of the cost of each section of the road represented by land purchases. Overall, it
does not appear that land costs for the M1 were excessive. They were high for the Cloghran-
Lissenhall section, but this partly reflects closeness to Dublin city and the fact that much of the
section was built on brownfield land.
Table II.9 LAND COSTS AS A PERCENTAGE OF TOTAL SCHEME COSTS
Cloghran - Lissenhall
Lissenhall Balbriggan
Balbriggan Bypass
Drogheda Bypass
Dunleer Bypass
Dunleer- Dundalk
Dundalk Western Bypass
18.16% 8.02% 7.79% 5.02% 2.29% 7.32% 5.58%
For the purposes of this CBA, we have decided to include the cost of land at the price actually
paid. This may overstate the cost somewhat, but to do so is to err on the conservative side.
Social Discount Rate
In accordance with the guidance in the 1st Interim Report, for the purposes of financial analysis
we will use a discount rate of 5% real.
144
Irish marginal income tax rates have risen again in the current decade, with the prospect of further increases. On this basis one might argue that a shadow price in excess of 1.25 should be used for the current decade. However for simplicity we leave the rate unchanged.

89
For the economic analysis we use a real rate of 9.1% up to and including 2010, and a rate of 4%
for future years.
RESULTS
The results presented in Table II.10 overleaf are generated by our base case forecasts in
respect of “Do Project” compared to “Do Nothing”.
On a financial basis, the Net Present Value (NPV) of the project is negative to the tune of EUR
646 million, with an internal rate of return of 0.6%. This is unsurprising, since the only financial
revenue relates to the tolls collected at Drogheda. It can be seen that the Drogheda Bypass is
the only section that generates a positive return, of 8.6%, but this is somewhat artificial, as the
toll on this section is designed to fund the construction of the Dundalk Western Bypass and the
maintenance the Drogheda Bypass and all the sections north of it.
On a socioeconomic basis, the NPV is highly positive at EUR 6.15 billion, with an IRR of 24%.
This is reflective of the inadequacy of the old road and the strong growth in traffic on the new
road since opening.
We can compare these results with those of the various ex ante and ex post CBAs undertaken
heretofore (Table II.11). It is clear that the ex post CBAs show significant inflation, both in costs
and in anticipated benefits compared to the ex ante CBAs, which were far more modest on
both. The ex post CBAs value the benefits, and hence the NPVs, significantly more highly than
in the present study. The main reason for this is that they did not anticipate the severe
economic downturn that commenced in 2008. They foresaw a continuation of strong albeit
moderating growth over the course of the current decade.

90
Table II.10 SUMMARY OF COST BENEFIT ANALYSIS RESULTS- BASE CASE
Section Length (km)*
Capex (EUR million 2011 prices)
capex per km (EUR million 2011 prices)
Year Opened
AADT 2010 Financial Socio-Economic
NPV (EUR m)
IRR BCR (discounted)
NPV (EUR m)
IRR BCR (discounted)
Cloghran Lissenhall 6.5 149.0 22.8 2003 81,516 -158 -2.2% 0.0 839 23.8% 3.7
Lissenhall Balbriggan 9.9 64.5 6.5 2003 50,524 -70 -2.6% 0.0 343 25.0% 3.7
Balbriggan Bypass 12.5 71.2 5.7 1998 29,918 -113 -2.9% 0.0 1,329 30.9% 6.4
Drogheda Bypass 21.4 181.7 8.5 2003 27,001 132 8.6% 1.8 781 19.6% 3.1
Dunleer Bypass 7.0 59.2 8.5 1993 31,032 -130 -3.0% 0.0 2,415 27.2% 9.4
Dunleer- Dundalk 16.7 145.5 8.7 2001 26,456 -203 -2.6% 0.0 245 11.8% 1.6
Dundalk Western Bypass 11.0 115.5 10.5 2005 20,050 -105 -2.5% 0.0 197 16.3% 2.3
Total 85.0 786.6 9.3 -646 0.6% 0.3 6,150 23.8% 4.2
* The route was constructed in sections, which when they were opened had to link to as yet uncompleted sections, and in all some 85km of motorway were constructed, as well as a number of stretches of non-motorway link roads. However, when completed the entire length of the motorway is 83 km.

91
Table II.11 PREVIOUS EX ANTE AND EX POST CBAS ON M1 MOTORWAY
Section Author Purpose and Date ex ante or ex post
Scheme Cost (million excl.
VAT)
NPV million
IRR B/C Ratio
Cloghran Lissenhall NRA Submitted with Cohesion Funds Application Feb 2000
ex ante £50 £126 20% 3.52
Cloghran Lissenhall NRA Submitted to Department of Finance Sept 2000 ex ante £76 £100 14% 2.31
Cloghran Lissenhall Roughan and O' Donovan for NRA
Closing of Account June 2004 ex post EUR 163 EUR 2,807-3,063 47-48 15-16
Cloghran Lissenhall Frontier Economics, Atkins, ITS
EU Commission 5 year ex-post CBA October 2010 ex post EUR 163 EUR 3,082-3,162 56% 20
Lissenhall Balbriggan NRA Submitted with Cohesion Funs Application Jan 2000 ex ante £39 £14 7.70% 1.35
Lissenhall Balbriggan NRA Submitted to Department of Finance Sept 2000 ex ante £47 £6 6.10% 1.13
Lissenhall Balbriggan Roughan and O' Donovan for NRA
Closing of Account June 2004 ex post EUR 69 EUR 689-776 33-35% 9-10
Lissenhall Balbriggan Frontier Economics, Atkins, ITS
EU Commission 5 year ex-post CBA October 2010 ex post EUR 69 EUR 722-745 42% 11-12
Balbriggan Bypass NRA Submitted with cohesion fund application 1993 ex-ante £36 not given 11% not given
Balbriggan Bypass NRA Final report for Cohesion Fund 1999 ex-post £48 £132 21% 3.75
Drogheda Bypass NRA Submitted to Cohesion Fund 2000 ex-ante £102 £59 9.40% 1.58
Drogheda Bypass Kerry County Council for NRA
Final report for Cohesion Fund 2004 ex-post EUR 209 EUR 1,193 21% 5.301
Drogheda Bypass Kerry County Council for NRA
Final report for Cohesion Fund 2005 ex-post EUR 209 EUR 961 19% 4.462
Dunleer Dundalk Road NRA Reference made in Cohesion Fund Application 1992 ex-ante 2%
Dunleer Dundalk Road NRA Submitted to Cohesion Fund Final Report 2001 ex-post £94 £21 6.70% 1.22
Source: NRA.

92
SCENARIO ANALYSIS
A number of scenarios can be tested, based on alternative forecasts, namely:
Higher and Lower economic growth, which will translate into higher and lower future
traffic volumes and value of time savings;
Higher and lower value of CO2; and
As an alternative to the base case social discount rates, we also test a rate equivalent
to the social opportunity cost of capital, i.e. the return that can be generated on the
marginal project in the private sector145. The EU Commission Guide to CBA (2008)
recommends 5% real as a benchmark figure, and this is what we use.
As an alternative to the shadow price of public funds equal to 1.25 or 1.5, we can test a
rate of 1.
Highly negative scenarios of zero future growth and zero future traffic were also
tested. The latter effectively tests whether, based solely on benefits generated to date,
the project has been worthwhile.
Finally, we also evaluate the “Do Something” option compared to “Do Nothing” (with all else
as per the base case). The results of this analysis are compared with those from the “Do
Project” base case, to ascertain whether “Do Project” was in fact the optimal option.
These scenarios were tested, and the results are presented in Tables I12 to I18 at the end of
this Annex.
In the High Growth scenario (Table II.12), financial NPV improves marginally, while socio-
economic NPV rises to EUR 6.48 billion.
In the Low Growth scenario (Table II.13), financial NPV disimproves marginally, while socio-
economic NPV is EUR 5.89 billion.
The differences between the base, high and low growth scenarios are not great, but this
reflects the fact that the base case growth scenario foresees modest traffic and economic
growth over the coming decade, and the high and low scenarios do not vary greatly around the
base case.
Considering the high and low values of CO2, the difference in fuel usage and hence in GHG
emissions is modest, and whether a high or low value is placed on these emissions, it makes a
very small difference to the return on the project. In other words, the results are effectively
the same as presented in Table II.10, regardless of the value placed on GHG emissions.
145
In a closed economy with perfect information, no distortions and no externalities the social discount rate and the social opportunity cost of capital are equivalent.

93
We have tested a scenario where we use the social opportunity cost of 5% real throughout
the evaluation period for the socioeconomic analysis. This affects the historic period in
particular, where we have used a social discount rate of 9.1% in the base scenario. The impact
is to reduce the return on the project slightly (Table II.14). The socio-economic NPV falls to EUR
6.07 billion.
We also test a scenario where the shadow price of public funds equals 1 (Table II.15). This
sees NPV increase significantly, to EUR 6.56 billion.
As a further test, we analyse a scenario where there is zero traffic and economic growth going
forward. The results of the scenario are presented in Table II.16. Financial NPV falls to -EUR
0.67 billion and socio-economic NPV falls to EUR 5.91 billion. Again, under this pessimistic
scenario, the project remains viable. This would tend to suggest that the road has already
generated sufficient benefits to justify the investment.
As an even more stringent test, we can consider only the benefits generated to date, i.e. to
end 2011 (Table II.17). Under this “super negative” scenario, while the financial NPV falls to -
EUR 1.14 billion, the road still returns a positive socio-economic NPV, of EUR 2.5 billion, as
does each section with the exception of Dunleer-Dundalk and Dundalk Western Bypass. This
confirms that in effect the road has already generated sufficient benefits to justify the
investment, even if no further net benefits accrue for the rest of its economic life.
It can be seen that the results generated for the project are robust across a range of scenarios,
and therefore the project’s success or failure is not sensitive to the assumptions made about
the future. The key variable to monitor going forward in terms of evaluating the project is
traffic volumes.
As a final test, we can analyse the financial and economic returns of the “Do Something Else”
option, i.e. where the road had been built as a standard type 1 dual carriageway for all the
sections from the Balbriggan bypass northwards.
The results are represented in Table II.18. As can be seen, this scenario returns a substantially
better financial NPV (-EUR 480 million on the basis that the road still attracts the same toll
revenue), and a slightly better socio-economic NPV of EUR 6.22 billion. The two major changes
vis a vis “Do Project” are lower capital costs and higher accident costs. These move in opposite
directions, and our analysis indicates that the additional safety benefits are not such as to
justify the additional capital costs of building the entire route to motorway standard.
However, this can only be viewed as a tentative conclusion, given that we were forced to use
standardised capital cost and accident cost data for the respective road types. Furthermore,
the difference in socio-economic NPV is not large, given the overall values and the timeframe
involved, and it may be considered that the option value of the additional capacity and the
avoidance of the risk of an expensive subsequent upgrade to motorway standard, is worth the
extra cost.

94
Table II.12 SUMMARY OF COST BENEFIT ANALYSIS RESULTS SCENARIO ANALYSIS – HIGH GROWTH
Section Length (km)
Capex (EUR million 2011 prices)
capex per km (EUR million 2011 prices)
Year Opened
AADT 2010
Financial Socio-Economic
NPV (EUR m)
IRR BCR (discounted)
NPV (EUR m)
IRR BCR (discounted)
Cloghran Lissenhall 6.5 149.0 22.8 2003 81,516 -158 -2.2% 0.0 938 24.3% 4.0
Lissenhall Balbriggan 9.9 64.5 6.5 2003 50,524 -70 -2.6% 0.0 371 25.3% 3.9
Balbriggan Bypass 12.5 71.2 5.7 1998 29,918 -113 -2.9% 0.0 1,424 31.1% 6.8
Drogheda Bypass 21.4 181.7 8.5 2003 27,001 138 8.7% 1.8 812 19.7% 3.2
Dunleer Bypass 7.0 59.2 8.5 1993 31,032 -130 -3.0% 0.0 2,465 27.2% 9.6
Dunleer- Dundalk 16.7 145.5 8.7 2001 26,456 -203 -2.6% 0.0 260 11.9% 1.6
Dundalk Western Bypass 11.0 115.5 10.5 2005 20,050 -105 -2.5% 0.0 207 16.6% 2.3
Total 85.0 786.6 9.3 -640 0.6% 0.3 6,477 24.0% 4.3
Table II.13 SUMMARY OF COST BENEFIT ANALYSIS RESULTS SCENARIO ANALYSIS – LOW GROWTH
Section Length (km)
Capex (EUR million 2011 prices)
capex per km (EUR million 2011 prices)
Year Opened
AADT 2010
Financial Socio-Economic
NPV (EUR m)
IRR BCR (discounted)
NPV (EUR m)
IRR BCR (discounted)
Cloghran Lissenhall 6.5 149.0 22.8 2003 81,516 -158 -2.2% 0.0 789 23.5% 3.5
Lissenhall Balbriggan 9.9 64.5 6.5 2003 50,524 -70 -2.6% 0.0 328 24.8% 3.6
Balbriggan Bypass 12.5 71.2 5.7 1998 29,918 -113 -2.9% 0.0 1,282 30.8% 6.2
Drogheda Bypass 21.4 181.7 8.5 2003 27,001 127 8.5% 1.7 738 19.3% 2.9
Dunleer Bypass 7.0 59.2 8.5 1993 31,032 -130 -3.0% 0.0 2,343 27.1% 9.2
Dunleer- Dundalk 16.7 145.5 8.7 2001 26,456 -203 -2.6% 0.0 224 11.6% 1.5
Dundalk Western Bypass 11.0 115.5 10.5 2005 20,050 -105 -2.5% 0.0 182 15.9% 2.2
Total 85.0 786.6 9.3 -651 0.5% 0.3 5,886 23.7% 4.0

95
Table II.14 SUMMARY OF COST BENEFIT ANALYSIS RESULTS SCENARIO ANALYSIS – SOCIAL OPPORTUNITY COST OF 5%
Section Length (km)
Capex (EUR million 2011 prices)
capex per km (EUR million 2011 prices)
Year Opened
AADT 2010
Financial Socio-Economic
NPV (EUR m)
IRR BCR (discounted)
NPV (EUR m)
IRR BCR (discounted)
Cloghran Lissenhall 6.5 149.0 22.8 2003 81,516 -158 -2.2% 0.0 851 23.8% 5.0
Lissenhall Balbriggan 9.9 64.5 6.5 2003 50,524 -70 -2.6% 0.0 346 25.0% 4.8
Balbriggan Bypass 12.5 71.2 5.7 1998 29,918 -113 -2.9% 0.0 1,250 30.9% 9.8
Drogheda Bypass 21.4 181.7 8.5 2003 27,001 132 8.6% 1.8 820 19.6% 4.3
Dunleer Bypass 7.0 59.2 8.5 1993 31,032 -130 -3.0% 0.0 2,234 27.2% 17.2
Dunleer- Dundalk 16.7 145.5 8.7 2001 26,456 -203 -2.6% 0.0 353 11.8% 2.3
Dundalk Western Bypass 11.0 115.5 10.5 2005 20,050 -105 -2.5% 0.0 214 16.3% 2.8
Total 85.0 786.6 9.3
-646 0.6% 0.3 6,067 23.8% 6.0
Table II.15 SUMMARY OF COST BENEFIT ANALYSIS RESULTS SCENARIO ANALYSIS – SHADOW PRICE OF PUBLIC FUNDS = 1
Section Length (km)
Capex (EUR million 2011 prices)
capex per km (EUR million 2011 prices)
Year Opened
AADT 2010
Financial Socio-Economic
NPV (EUR m)
IRR BCR (discounted)
NPV (EUR m)
IRR BCR (discounted)
Cloghran Lissenhall 6.5 149.0 22.8 2003 81,516 -158 -2.2% 0.0 913 27.7% 4.8
Lissenhall Balbriggan 9.9 64.5 6.5 2003 50,524 -70 -2.6% 0.0 368 28.3% 4.5
Balbriggan Bypass 12.5 71.2 5.7 1998 29,918 -113 -2.9% 0.0 1,374 34.1% 7.9
Drogheda Bypass 21.4 181.7 8.5 2003 27,001 132 8.6% 1.8 899 24.2% 4.4
Dunleer Bypass 7.0 59.2 8.5 1993 31,032 -130 -3.0% 0.0 2,438 28.1% 10.2
Dunleer- Dundalk 16.7 145.5 8.7 2001 26,456 -203 -2.6% 0.0 346 14.1% 2.0
Dundalk Western Bypass 11.0 115.5 10.5 2005 20,050 -105 -2.5% 0.0 216 17.9% 2.6
Total 85.0 786.6 9.3 -646 0.6% 0.3 6,555 26.3% 5.3
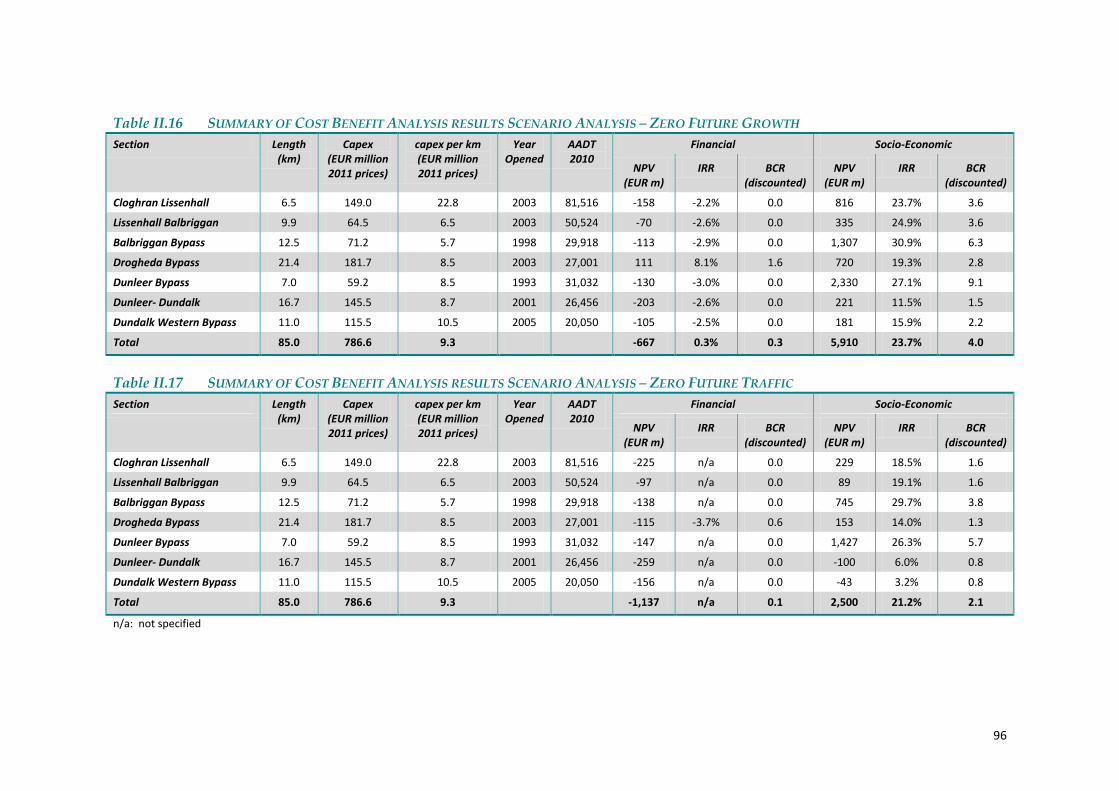
96
Table II.16 SUMMARY OF COST BENEFIT ANALYSIS RESULTS SCENARIO ANALYSIS – ZERO FUTURE GROWTH
Section Length (km)
Capex (EUR million 2011 prices)
capex per km (EUR million 2011 prices)
Year Opened
AADT 2010
Financial Socio-Economic
NPV (EUR m)
IRR BCR (discounted)
NPV (EUR m)
IRR BCR (discounted)
Cloghran Lissenhall 6.5 149.0 22.8 2003 81,516 -158 -2.2% 0.0 816 23.7% 3.6
Lissenhall Balbriggan 9.9 64.5 6.5 2003 50,524 -70 -2.6% 0.0 335 24.9% 3.6
Balbriggan Bypass 12.5 71.2 5.7 1998 29,918 -113 -2.9% 0.0 1,307 30.9% 6.3
Drogheda Bypass 21.4 181.7 8.5 2003 27,001 111 8.1% 1.6 720 19.3% 2.8
Dunleer Bypass 7.0 59.2 8.5 1993 31,032 -130 -3.0% 0.0 2,330 27.1% 9.1
Dunleer- Dundalk 16.7 145.5 8.7 2001 26,456 -203 -2.6% 0.0 221 11.5% 1.5
Dundalk Western Bypass 11.0 115.5 10.5 2005 20,050 -105 -2.5% 0.0 181 15.9% 2.2
Total 85.0 786.6 9.3
-667 0.3% 0.3 5,910 23.7% 4.0
Table II.17 SUMMARY OF COST BENEFIT ANALYSIS RESULTS SCENARIO ANALYSIS – ZERO FUTURE TRAFFIC
Section Length (km)
Capex (EUR million 2011 prices)
capex per km (EUR million 2011 prices)
Year Opened
AADT 2010
Financial Socio-Economic
NPV (EUR m)
IRR BCR (discounted)
NPV (EUR m)
IRR BCR (discounted)
Cloghran Lissenhall 6.5 149.0 22.8 2003 81,516 -225 n/a 0.0 229 18.5% 1.6
Lissenhall Balbriggan 9.9 64.5 6.5 2003 50,524 -97 n/a 0.0 89 19.1% 1.6
Balbriggan Bypass 12.5 71.2 5.7 1998 29,918 -138 n/a 0.0 745 29.7% 3.8
Drogheda Bypass 21.4 181.7 8.5 2003 27,001 -115 -3.7% 0.6 153 14.0% 1.3
Dunleer Bypass 7.0 59.2 8.5 1993 31,032 -147 n/a 0.0 1,427 26.3% 5.7
Dunleer- Dundalk 16.7 145.5 8.7 2001 26,456 -259 n/a 0.0 -100 6.0% 0.8
Dundalk Western Bypass 11.0 115.5 10.5 2005 20,050 -156 n/a 0.0 -43 3.2% 0.8
Total 85.0 786.6 9.3
-1,137 n/a 0.1 2,500 21.2% 2.1
n/a: not specified

97
Table II.18 SUMMARY OF COST BENEFIT ANALYSIS RESULTS SCENARIO ANALYSIS – “DO SOMETHING” (DUAL CARRIAGEWAY)
Section Length (km)
Capex (EUR million 2011 prices)
capex per km (EUR million 2011 prices)
Year Opened
AADT 2010
Financial Socio-Economic
NPV (EUR m)
IRR BCR (discounted)
NPV (EUR m)
IRR BCR (discounted)
Cloghran Lissenhall 6.5 149.0 22.8 2003 81,516 -158 -2.2% 0.0 839 23.8% 3.7
Lissenhall Balbriggan 9.9 64.5 6.5 2003 50,524 -70 -2.6% 0.0 343 25.0% 3.7
Balbriggan Bypass 12.5 55.5 4.4 1998 29,918 -90 -3.1% 0.0 1,318 34.6% 7.8
Drogheda Bypass 21.4 141.7 6.6 2003 27,001 183 10.9% 2.6 805 22.5% 3.9
Dunleer Bypass 7.0 46.2 6.6 1993 31,032 -102 -3.2% 0.0 2,436 29.8% 11.8
Dunleer- Dundalk 16.7 113.5 6.8 2001 26,456 -160 -2.7% 0.0 272 13.1% 1.8
Dundalk Western Bypass 11.0 90.1 8.2 2005 20,050 -83 -2.6% 0.0 205 19.0% 2.7
Total 85.0 660.5 7.8
-480 1.1% 0.4 6,218 26.4% 4.9

98
RISK ANALYSIS
Monte Carlo Analysis was also performed on our CBA model that assigned a triangular
distribution to five input variables, to simulate the future uncertainty associated with these
variables. The peak of the distributions and their upper and lower bounds (at which points
their probabilities fall to zero) are outlined in Table II.19.
Table II.19 PARAMETERS FOR PROBABILITY DISTRIBUTIONS FOR MODEL INPUTS
Input Variable (Annual Growth Rates)
Peak (Baseline Scenario) Value
Lower Bound (Probability=0)
Upper Bound (Probability=0)
Future Irish GDP 3.1% 0.3% 5.1%
Fingal Light Vehicles 0.5% -1.0% 2.5%
Fingal Heavy Vehicles 0.4% -1.0% 2.5%
Louth/Meath Light Vehicles 1.1% -0.5% 3.0%
Louth/Meath Heavy Vehicles 0.8% -0.5% 3.0%
The results (Table II.20) confirm a very strong economic NPV and internal rate of return for the
project. The simulations were run a thousand times. The mean ENPV generated was EUR 6.226
billion and the mean ERR was 23.86% (compared to the base case of EUR 6.15 billion and
23.8% respectively). The lowest ENPV obtained was EUR 5.69 billion, indicating that there is a
100% probability (based on the above risk parameters) of obtaining at least this economic
return.
Table II.20 OUTPUT STATISTICS OF MONTE CARLO SIMULATIONS
Economic Net Present Value (EUR million)
Economic Internal Rate of Return
Computed Base Value 6,150 23.80%
Mean 6,226 23.86%
Median 6,213 23.86%
Standard deviation 209 0.10%
Minimum value 5,687 23.60%
Central value 6,275 23.88%
Maximum value 6,863 24.16%
Probability of being not higher than the reference value 38.0% 26.1%
Probability of being higher than the reference value 62.0% 73.9%
Probability of being lower than EUR NIL (ENPV) and 4% (EIRR)
0% 0%
Source: Authors
The results are further elaborated in the charts overleaf.

99
Figure II.1 PROBABILISTIC DISTRIBUTION OF ECONOMIC NET PRESENT VALUE (EUR
MILLION)
Source: Authors
Figure II.2 PROBABILISTIC DISTRIBUTION OF THE ECONOMIC NET PRESENT VALUE
(EUR MILLION)
Source: Authors

100
Figure II.3 PROBABILISTIC DISTRIBUTION OF ECONOMIC INTERNAL RATE OF RETURN
Source: Authors
Figure II.4 PROBABILISTIC DISTRIBUTION OF ECONOMIC INTERNAL RATE OF RETURN
Source: Authors

101
ANNEX III. GLOSSARY OF TERMS
AND ABBREVIATIONS
TERM DEFINITION
AADT Annual Average Daily Traffic – Number of cars passing a point during a year divided by 365, to get a daily average
ABP An Bord Pleanála (the Planning Appeals Board) (www.abp.ie)
AFF An Foras Forbartha (The National Institute for Physical Planning and Construction Research)
An Foras Forbartha The National Institute for Physical Planning and Construction Research
At-grade dual carriageway A two or three-lane dual carriageway with at-grade junctions, with direct entry and exit controlled by traffic lights and/or roundabouts. Hard shoulders and central reserves are often narrower than on a standard dual carriageway. The usual speed limit on these roads in Ireland is 100km/hour.
CSO Central Statistics Office, Dublin (www.cso.ie)
DoLG Department of Local Government
DoE Department of the Environment
DELG Department of the Environment and Local Government
DEHLG Department of the Environment, Heritage and Local Government
DECLG Department of the Environment, Community and Local Government
Dual Carriageway A dual carriageway is defined by the Road Traffic (Compulsory Insurance) Regulations, 1962 (S.I. No. 14/1962) as “a road the roadway of which is divided centrally so as to provide two separate carriageways, on each of which traffic is required by a road regulation to proceed in one direction only”. General speed limit may be 100kph or 120kph.
ESRI Economic and Social Research Institute (www.esri.ie)
Grade-separated dual carriageway
A two or three-lane dual carriageway with grade-separated junctions, i.e. overpasses, underpasses and access via slip roads. General speed limit may be 100kph or 120kph.
Motorway Legally, a motorway in Ireland is a national primary road designated as a motorway by the Minister for Transport under the Roads Act 1993. In practice, a motorway is a two or three-lane grade-separated dual carriageway with restricted access for users (e.g. learner drivers, vehicles not exceeding 50 cc in engine capacity, vehicles not capable of a speed of 50 kph, pedestrians, and pedal cyclists.) as well as to and from adjoining land, a general speed limit of 120kph, and an alternative parallel route. Prior to designation as such, motorways are often referred to as “high quality dual carriageways” (i.e. motorways in all but name).
NRA National Roads Authority (www.nra.ie)
Reduced standard dual carriageway
As defined in the Road Needs Study (1998), a two lane (generally at-grade) dual carriageway, with narrower hard shoulders and median than a standard dual carriageway. May or may not have restricted frontage access. Speed limit is generally 100kph.
Standard dual carriageway
A grade-separated dual carriageway. Speed limit is generally 100kph.
Type 1 dual carriageway A grade-separated dual carriageway General speed limit may be 100kph or 120kph.
Type 2 Dual carriageway An at-grade dual carriageway. Speed limit is generally 100kph.
Source: Authors

102

103
ANNEX IV. LIST OF INTERVIEWEES
Interviews and correspondence were undertaken with the following individuals. We would like
to thank them for their assistance in compiling our report.
Interviewee Affiliation Position Date Mr John Walsh DG Regio Deputy Head of Unit
DG REGIO/D2 - Thematic development, innovation (Former Desk Officer, Ireland)
4th February, 2011, plus telephone conversations and e-mail correspondence
Mr Stephen Langley
DG Regio DG REGIO/E/4 Desk Officer, UK and Ireland
4th February, 2011, plus telephone conversations and e-mail correspondence
Mr Noel Farrell DG Regio DG REGIO/E/4 , UK and Ireland 4th February, 2011 Mr Michael Kennedy
National Roads Authority
Public Private Partnership Unit Various, telephone conversations and e-mail correspondence
Mr René-Laurent Ballaguy
European Investment Bank
Senior Evaluator IG/EV (Inspectorate General / Operations Evaluation)
3rd May 2011, e-mail correspondence
Mr Eavan Crehan National Development Finance Agency
9th May 2011, telephone conversation and e-mail correspondence
Mr Frank Burke Louth County Council (retired)
Roads engineer 13th July 2011 telephone
Mr Richard Evers Mr Tim Ahern Mr Gerry O’Brien Mr Michael Nolan
National Roads Authority
Assistant Corporate Affairs Manager Head of Engineering Standards Senior Project Manager Senior Project Manager
29th July 2011, plus telephone conversations and e-mail correspondence
Mr Obey Mhondera
National Roads Authority
Statistician 11th August 2011, telephone conversation and e-mail correspondence
Mr Lorcan Wood Mr Declan Cahill
Celtic Roads Group
General Manager Operations and Maintenance Manager
18th August 2011, plus telephone conversations and e-mail correspondence
Mr Pat Maher NRA Head of Network Operations 22nd August 2011, telephone conversation
Mr John Iliff NRA Senior Project Manager (Structures)
24th August 2011, telephone conversation
Mr Simon McCormack
Drogheda Chamber of Commerce
24th August, Telephone conversation , Email correspondence
Mr James Cleary Fingal County Council
Senior Engineer, Transportation 26th August 2011, telephone conversation
Mr Liam Hennessy
Department of Finance
EU (Structural Funds) Section Various, interviews, telephone conversations and email correspondence
Ms Angela Muckian
Louth County council
Senior Staff Officer Transportation Various, e-mail correspondence
Ms Elaine Brick AECOM Principal, Transportation Various, e-mail correspondence Mr Dominic Mullaney
Department of Transport
Principle Advisor Various, telephone interviews and email correspondence
Ms Martina Sheeran
Drogheda Borough Council
Senior Executive Engineer Various telephone conversations and email correspondence

104

105
ANNEX V. REFERENCES
Amos, P., Bullock, D., & Sondh, J., 2010, High-Speed Rail: The Fast Track to Economic
Development? The World Bank.
An Foras Forbartha, 1982, Road Development: Opportunities for private sector investment,
proceedings of seminar, Dublin November 1982.
Barrett, S., 1975, The Economic Evaluation Of Road Investment In The Republic Of Ireland.
Statistical and Social Inquiry Society of Ireland, read before the Society, October 23, 1975.
http://www.tara.tcd.ie/bitstream/2262/5194/1/jssisiVolXXIIIPartIII_0136.pdf.
Barry, F., 2006, Delivering the National Road Network Value for Money? Presentation to
Engineers Ireland by Chief Executive Officer National Roads Authority, November 2006.
http://www.engineersireland.ie/media/engineersireland/community/whitepapers/Delivering
%20the%20National%20Road%20Network%20Value%20for%20Money.pdf.
Becker G.S., 1962, Investment in Human Capital: A Theoretical Analysis, The Journal of Political
Economy, Vol. 70, No. 5, Part 2: Investment in Human Beings (Oct., 1962), pp. 9-49.
Buchanan, Colin & Partners, 2005, Newry / Dundalk Twin City Region Interim Report August
2005. http://borderireland.info/pubs/BI-01808.pdf.
Buchanan, Colin & Partners, in association with Economic Consultants Ltd, 1968, Regional
Studies in Ireland (“The Buchanan Report”), Commissioned by the United Nations on behalf of
the Government of Ireland.
Caffrey J., Burton T., Higgins J., 2003 “Broadmeadow Estuary Bridge: Integration of Design and
Construction” Paper Presented to the Institution of Engineers of Ireland, Dublin 3 Nov ‘03
http://www.engineersireland.ie/media/engineersireland/community/whitepapers/Broadmead
ow%20Estuary%20Bridge-%20Integration%20of%20Design%20and%20Construction.pdf.
Carroll, M., 1992, Case Study on Dunleer Bypass. Civil engineering Technician/Diploma, Dublin
Institute of Technology, May 1992 (unpublished thesis).
Central Statistics Office, 2009, Transport 2008
http://www.cso.ie/releasespublications/documents/transport/2008/transport08.pdf.
Central Statistics Office, 2011a, County Incomes and Regional GDP 2008
http://www.cso.ie/releasespublications/documents/economy/current/regincome.pdf.
Central Statistics Office, 2011b, Quarterly National Accounts Quarter 1 2011
http://www.cso.ie/releasespublications/documents/economy/current/qna.pdf.
Central Statistics Office, 2011c, National Transport Survey 2009
http://www.cso.ie/releasespublications/documents/transport/2009/nattravel09.pdf.

106
Collins, M. and Weisbrod, G., 2000, Economic Impact of Freeway Bypass Routes in Medium Size
Cities, Economic Development Research Group, September 2000.
Comer, J.C. and Finchum, G.A., 2001, “Business Impacts of Highway Bypasses”, in Papers and
Proceedings of the Applied Geography Conferences, Vol. 24, Copyright November, 2001.
Comer, J.C. and Finchum, G.A., 2003, “Socioeconomic Impacts of Highway Bypasses in
Oklahoma”, in Tobin, G.A., and Montz, B.E., (Ed’s), 2003, Papers of the Applied Geography
Conferences, Vol. 26, November 2003. Colorado: University of Colorado at Colorado Springs.
http://www.ocgi.okstate.edu/otc2003/agc_03.pdf.
Comptroller and Auditor General, 2004, National Roads Authority National Routes
Improvement Programme. Comptroller and Auditor General Special Report, April 2004.
http://audgen.gov.ie/documents/specialreports/06_NationalRoadsAuthority.pdf.
Considine, J., and Duffy, D., 2007, Tales of Expansionary Fiscal Contractions in Two European
Countries: Hindsight and Foresight. Working Paper 0120, July 2007, Department of Economics
National University of Ireland, Galway.
http://aran.library.nuigalway.ie/xmlui/bitstream/handle/10379/1012/paper_0120.pdf?sequen
ce=1.
Construction Industry Council, 2009, Submission to the Government by Construction Industry
Council: Jobs and Infrastructure – A Plan for National Recovery.
http://www.scsi.ie/publications/submissions_files/29-04-09-CIC-Submission-to-
Government.pdf.
Cooney, F., 2008, “Ballynahattin Bridge”, in Journal of the Irish Railway Record Society, Number
165, February 2008. http://www.irrs.ie/Journal%20165/165%20Ballynahattin.htm
CSF Evaluation Unit, 1999, Proposed Working Rules for cost-Benefit Analysis. Dublin. June
1999.
Dasgupta P., 2001, Human Well-Being and the Natural Environment, Oxford University Press.
Department of Local Government, 1966 Arterial Roads Needs Study.
Department of the Environment, 1985 Policy and Planning Framework for Roads.
DKM Economic Consultants, 1999, Review of Transport Infrastructure Investment Needs.
Republic of Ireland Operational Programme for Transport EE Report 34. February 1999.
Dublin City Council, 2008, Dublin Agglomeration Action Plan Relating to the Assessment and
Management of Environmental Noise July 2008- November 2013.
http://www.dublincity.ie/WaterWasteEnvironment/NoiseMapsandActionPlans/Documents/D
ublinAgglomerationAction%20Planning10pageSummary.pdf.
Dublin County Council, 1983, Dublin County Development Plan 1983.

107
Dwyer, D, 2009, “A Critical Analysis of the Design and Construction of Boyne Bridge, Ireland”.
Proceedings of Bridge Engineering 2 Conference 2009 April 2009, University of Bath,
UK.http://www.bath.ac.uk/ace/uploads/StudentProjects/Bridgeconference2009/Papers/DWY
ER.pdf.
Easterly W., Ritzen J. and Woolcock M., 2006, Social Cohesion, Institutions, and Growth,
Economics and Politics Vol. 18 (2), pp. 103-120.
Economic and Social Research institute, 2011, Quarterly Economic Commentary, Spring 2011.
EU Commission, 2005, Trans-European Transport Network - TEN-T priority axes and Projects
2005. http://ec.europa.eu/ten/transport/projects/doc/2005_ten_t_en.pdf.
EUI Working Papers, RSC 2000/16. http://www.eui.eu/RSCAS/WP-Texts/00_16.pdf.
European Commission, 2008, Guide to Cost Benefit Analysis of Investment Projects,
http://ec.europa.eu/regional_policy/sources/docgener/guides/cost/guide2008_en.pdf.
European Environmental Agency, 2006, Urban sprawl in Europe The ignored challenge. EEA
Report No 10/2006.
http://www.eea.europa.eu/publications/eea_report_2006_10/eea_report_10_2006.pdf.
EuroRAP, European Road Assessment Programme, 2005, EuroRAP 2005: Ireland Results – Risk
Rating of Ireland’s Major Roads. http://www.eurorap.org/library/pdfs/results_ireland.pdf.
Eurostat, 2011, Regional GDP per inhabitant in 2008. Eurostat Press Release 24th February
2011. http://epp.eurostat.ec.europa.eu/cache/ITY_PUBLIC/1-24022011-AP/EN/1-24022011-
AP-EN.PDF.
Feeney B.P. (1982) RT. 235 Road Infrastructure Development An Foras Forbartha.
Fingal county Council, 1995, Northern Motorway Airport to Balbriggan Bypass – Summary of
Environmental Impact Statement.
Fitzgerald, J., Quinn, T.P., Whelan, B.J., and Williams, J.A., 1998, An Analysis of Cross Border
Shopping. ESRI Paper 137, March 1998.
http://www.esri.ie/UserFiles/publications/jacb201060/GRS137.pdf.
Flyvbjerg B. Bruzelius, N. and Rothengatter, W., 2003. Megaprojects and risk. An anatomy of
ambition, Cambridge U.P., Cambridge, Great Britain.
Goodbody Economic Consultants, 2004, Cost Benefit Parameters and Application Rules for
Transport Project Appraisal August 2004 in Association with Atkins.
http://www.dttas.ie/upload/general/5830-1.pdf.
Government of Ireland, 1962, Road Traffic (Compulsory Insurance) Regulations, 1962 (S.I. No.
14/1962). http://www.irishstatutebook.ie/1962/en/si/0014.html.

108
Government of Ireland, 1964, Second Programme for Economic Expansion (Part II).
Government of Ireland, 1979, Road Development Plan for the 1980s.
Government of Ireland, 1989, National Development Plan (NDP) 1989-1993,
Government of Ireland, 1989, Operational Programme on Peripherality 1989 – 1993 (OPP),
Government of Ireland, 1993, Roads Act 1993.
http://www.irishstatutebook.ie/1993/en/act/pub/0014/print.html#sec49
Government of Ireland, 1994, National Development Plan 1994-1999.
Government of Ireland, 1994, Operational Programme for Transport 1994-1999 (OPTRANS).
Government of Ireland, 2000, Economic and Social Infrastructure Operational Programme
2000-2006.
http://eustructuralfunds.gov.ie/files/Documents/EconomicandSocialInfrastrucutreOP.pdf.
Government of Ireland, 2000, Ireland Community Support Framework 2000 – 2006.
http://eustructuralfunds.gov.ie/files/Documents/CommunitySupportFramework2000-06.pdf
Government of Ireland, 2000, National Development Plan 2000-2006.
Government of Ireland, 2007, National Development Plan 2007-2013.
http://www.socialinclusion.ie/documents/NationalDevelopmentPlan2007-2013.pdf.
Government of Ireland, various years, Public Capital Programme.
Griffith R., 2000, How important is Business R&D for Economic Growth and should the
Government subsidise it?, The Institute for Fiscal Studies, Briefing Note No. 12.
Griliches Z., 1992, The search for R&D spillovers, Scandinavian Journal of Economics, vol.94, pp.
29-47.
Hayes, R.N. and Sheedy, J.P.M., 1966, RT.29 Report on Administration of the Arterial Road
Programme, Prepared for The Department of Local Government. An Foras Forbartha.
Hirschman A.O., 1967, Development Projects Observed, The Brookings Institution, Washington,
D.C.
Hirschman, A.O. 1967, Development Projects Observed, the Brookings Institution, Washington,
D.C.
Honohan P, and Walsh B, 2002 Catching up with the leaders: The Irish Hare Brookings Papers
on Economic Activity, Part 1, pages 1-57.
Honohan P., (ed.), 1997, EU Structural Funds in Ireland: A Midterm Evaluation of the CSF 1994-
99, Policy Research Series no. 31, Dublin: ESRI.

109
Honohan, P., 1998. Key Issues of Cost-Benefit Methodology for Irish Industrial Policy. Dublin:
ESRI, General Research series, September 1998
http://homepage.eircom.net/~phonohan/costbenefit.pdf.
http://www.brookings.edu/~/media/Files/Programs/ES/BPEA/2002_1_bpea_papers/2002a_b
pea_honohan.pdf.
http://www.esri.ie/publications/search_for_a_publication/search_results/view/index.xml?id=
3246.
http://www-
wds.worldbank.org/external/default/WDSContentServer/WDSP/IB/2010/07/26/000334955_2
0100726032714/Rendered/PDF/558560WP0Box341SR1v08121jul101final.pdf.
International Centre for Local and Regional Development, 2009, The Newry-Dundalk Twin-City
Region.
http://www.intertradeireland.com/media/intertradeirelandcom/researchandstatistics/publica
tions/infrastructure/The%20Newry-
Dundalk%20Twin%20City%20Region%20Supporting%20the%20Implementation%20of%20Cros
s-Border%20Collaborative.pdf.
Keogan J.F. and Callanan, J.F., 2003, Local Government in Ireland: Inside Out. Institute of Public
Administration, Dublin.
Kriger, D.S., Shiu, S. & Naylor, S, 2006, Estimating Toll Road Demand and Revenue, National
Cooperative Highway Research Program, Volume 364 of Synthesis of highway practice,
Washington DC: Transportation Research Board.
Lee, J.J., 1989, Ireland 1912-1985: Politics and Society. Cambridge University Press, 1989.
Leong, D., and Weisbrod, G., 2000, “Summary of Highway Bypass Studies”, Economic
Development Research Group - Reprint Series December 2000.
Louth County Council Road Design Department, 1993, Dunleer-Dundalk Motorway Project
Environmental Impact Study Report No.3 Traffic.
Louth County Council, 1983, County Development Plan Review.
Louth County Council, 1985. Submission to Minister for the Environment & Local Government,
requesting the Minister to confirm the Dunleer Bypass Scheme as Detailed and Without
Modification (unpublished).
Louth Local Authorities, 2008, Noise Action Plan.
http://www.louthcoco.ie/en/Services/Environment/Forms/Noise-action-Plan.pdf.
Martinez M., 2009, “Il management delle aziende di Public Utilities tra cambiamento
istituzionale e compliance”, in Modelli di governance e processi di cambiamento nelle Public
Utilities, edited by Mercurio R. and Martinez M., Franco Angeli, 2009.

110
McAleese, D., 2000, “The Celtic Tiger: Origins and Prospects”, in Political Options, July-August
2000. http://www.irpp.org/po/archive/jul00/mcaleese.pdf.
McCarthy, C., 2009, “Fiscal Consolidation II: Lessons from the Last Time”. Paper presented at
Dublin Economics Workshop, Kenmare, 18th October 2009.
http://www.irisheconomy.ie/Notes/IrishEconomyNote8.pdf.
McIlraith D., 1972, “Dublin Transportation Study Technical Report 18” An Foras Forbartha.
McKinnon, A, Palmer, A., Edwards, J., and Piecyk, M., 2008, Reliability of Road Transport from
the Perspective of Logistics Managers and Freight Operators. Report for the Joint Transport
Research Centre of the OECD and the International Transport Forum. Logistics Research Centre
Heriot-Watt University.
http://www.internationaltransportforum.org/jtrc/infrastructure/networks/08HeriotWatt.pdf.
Meath County Council and Navan Town Council, 2008, Noise Action Plan.
http://www.meath.ie/LocalAuthorities/Publications/RoadsPublications/NoiseActionPlanforRoa
ds/File,33183,en.pdf.
Murphy, A., 2000, The ’Celtic Tiger’ – An Analysis of Ireland’s Economic Growth Performance.
Murphy, A., Walsh, B.M. and Barry, F., 2003, The economic appraisal system for projects
seeking support from the industrial development agencies. Dublin: Forfás.
http://irserver.ucd.ie/dspace/bitstream/10197/1600/3/walshb_report_pub_016.pdf.
Nash, C., and Sansom, T., 1999. Calculating Transport Congestion And Scarcity Costs. Final
Report Of The Expert Advisors To The High Level Group on Infrastructure Charging, Working
Group 2, May 7 1999. http://ec.europa.eu/transport/infrastructure/doc/congestion-cost.pdf.
National Roads Authority, 1996, Traffic Station Counts and Road Travel for 1995.
National Roads Authority, 1998, National Road needs Study.
National Roads Authority, 2003, Future traffic Forecasts 2002-2040.
http://www.nra.ie/Publications/DownloadableDocumentation/Transportation/file,3674,en.PD
F.
National Roads Authority, 2008, Project Appraisal Guidelines, Appendix 6 – National
Parameters Value Sheet.
http://www.nra.ie/Publications/DownloadableDocumentation/ProjectAppraisal/file,14148,en.
pdf.
National Roads Authority, 2011, Project Appraisal Guidelines Unit 5.5 Link-Based Traffic
Growth Forecasting, January 2011.
http://www.nra.ie/NetworkManagement/ProjectAppraisalGuidelines/FileContentforPAG/file,1
7857,en.pdf.

111
O’ Donovan, J., Wilson, K. and Maher, J., 2003, “The Design and construction of the Boyne
Bridge”. Paper presented to: The Institution of Engineers of Ireland Dublin: March 4th 2003.
http://www.rod.ie/images/assets/pub001.pdf.
Road Safety Authority, 2007, Road Safety Strategy 2007-2011.
http://www.rsa.ie/Documents/Road%20Safety/RSA_Strategy_ENG_s.pdf.
Sen A.K., 1987, On Ethics and Economics, Basil Backwell eds., Oxford.
Solow R.M., 1956, A Contribution to the Theory of Economic Growth, The Quarterly Journal of
Economics, Vol.70, No. 1 (Feb. 1956), pp. 65-94.
Srinivasan, S. and Kockelman, K.M., 2002, The Impacts of Bypasses on Small- and Medium-
Sized Communities: An Econometric Analysis, Journal of Transportation and Statistics Vol. 5,
No. 1, 2002, pp.57-69.
Stiglitz J.E., Sen A., Fitoussi J.P, 2009, Report by the Commission on the Measurement of
Economic Performance and Social Progress. Available at: http://www.stiglitz-sen-
fitoussi.fr/documents/rapport_anglais.pdf.
Thompson, E., Miller, J. and Roenker, J., 2001, The Impacts of a New Bypass Route on the Local
Economy and Quality and Quality of Life. University of Kentucky, Center for Business and
Economic Research.
Tomer J., 1981, Organizational Change, Organization Capital and Economic Growth, Eastern
Economic Journal Vol. VII, No. 1.
Walsh B.M., 2008, “Wealthier and healthier: Ireland’s demographic catch-up”, in Journal of the
Statistical and Social Inquiry Society of Ireland, Vol. 37, pp. 95-112.
Walsh, J., 2000, Ireland and the Structural Funds and Cohesion Fund. Presentation to IPA -
Louvain/Leuven. 16 August 2000.
Walsh, S, 1982 “The Road Development Plan”, paper presented at Road Development:
Opportunities for private sector investment Seminar, Dublin November 1982, An Foras
Forbartha.
White, Rossa, 2010 Years of High Income Largely Wasted, Davy Stockbrokers Macro comment.
http://www.davy.ie/content/pubarticles/economy20100219.pdf.


![Smart motorway design guide - Roads and Maritime Services · 2017-04-21 · Smart [1]Motorway Technical Direction and the Smart Motorway Guidelines[2]. 1.2 Smart motorway document](https://img.dokumen.tips/doc/110x75/5e764c607cf5f006800a1c9a/smart-motorway-design-guide-roads-and-maritime-services-2017-04-21-smart-1motorway.jpg)