Embed Size (px)
Citation preview

ResultsQ2 2017
17 August 2017
ww
w.h
elio
sto
wers
afr
ica.c
om

Agenda
ww
w.h
elio
sto
wers
afr
ica.c
om
1________Executive Summary
2________Financial Results
3________Q&A

© Copyright Helios Towers Africa Ltd 2017, All rights reserved
Today’s Team
Kash PandyaChief Executive Officer
Tom GreenwoodChief Financial Officer
Jeffrey KriekHead of Corporate Finance and Investor Relations
Alex LeighDirector of Sales & Marketing
Team from Helios Towers Africa (“HTA”)
3

Executive Summary
ww
w.h
elio
sto
wers
afr
ica.c
om
© Copyright Helios Towers Africa Ltd 2017, All rights reserved
Group Q2 2017 Key Highlights
Y-o-Y +989 sites (+18%) and +1,239 colocations (+26%) added
Y-o-Y growth driven by organic demand, Airtel DRC acquisition and Business/Operational Excellence Program
Colo Ratio increased to 1.92x
Q-o-Q -6 sites (0%) and +90 colocations (+2%) added during Q2 17
Revenue: +41% Y-o-Y / +4% Q-o-Q
Adj. EBITDA: +72% Y-o-Y / +5% Q-o-Q
Adj. EBITDA margin: +6% Y-o-Y
Results Snapshot Operational Summary
Financial Summary
(1) Adjusted EBITDA is defined as loss for the year, adjusted for loss for the year from discontinued operations, additional tax, income tax, finance costs, other gains and losses, investment income, loss on disposal of property, plant and equipment, amortization and impairment of intangible assets, depreciation and impairment of property, plant and equipment, deal costs relating to unsuccessful tower acquisition transactional and exceptional items
(2) Excluding unamortised financing costs and derivative financial instruments
5
Q1 17 Q2 17%
changeH1 16 H1 17
% change
In US$m, unless otherwise stated
Q-o-Q Y-o-Y
Sites (#) 6,507 6,501 0% 5,512 6,501 18%
Colocations (#) 5,876 5,966 2% 4,727 5,966 26%
Colo Ratio (x) 1.90x 1.92x 1.86x 1.92x
Revenue 83 86 4% 120 169 41%
Adj. EBITDA(1) 28 29 5% 33 56 72%
Annualised adj. EBITDA 110 115 5% 65 113 72%
Adj. EBITDA margin (%) 33% 33% 27% 33%
Capex 18 45 150% 68 63 -8%
Gross Debt(2) 612 611 0% 401 611 52%

© Copyright Helios Towers Africa Ltd 2017, All rights reserved
Recent Developments
Vodacom Buy-out
$62m option for Vodacom’s shares in Tanzania
Awaiting Fair Competition Commission (FCC) approval
Tanzania listing
Recent Tanzanian law for network facilities licenses (incl. HTA) requires 25% listing of shares locally
1 February 2017 HTT interim prospectus submitted
Final prospectus to be submitted during H2 2017 (subject to regulatory approval)
Tigo and Airtel Ghana JV
3 March 2017 JV announced and pending NCA approval
Will create stronger combined customer
Power saving initiatives
Solar and hybrid roll out progressing well and to plan
Phase 2 underway
400 DRC solar systems planned by Q1 2018
On schedule for 400 hybrid sites in 2017
Completed grid connections to c.200 sites with a further 100 sites planned during 2017
Zantel acquisition
Helios Towers Tanzania Ltd (“HTT”) to acquire all mainland unique telecoms tower sites from Zantel
Acquisition grows HTT’s telecom tower sites in Tanzania by 185 sites
6

Financial Results
ww
w.h
elio
sto
wers
afr
ica.c
om

© Copyright Helios Towers Africa Ltd 2017, All rights reserved
8 13 15
9
11 12
2
2 2
2
4 4
17
28 29
-4 -3 -5
Q2 16 Q1 17 Q2 17
Historical Performance of KPIs
Evolution of Tower Portfolio Evolution of Tenants
835 1,852 1,836
3,496
3,472 3,475
393
387 384 788
796 806 5,512
6,507 6,501
Q2 16 Q1 17 Q2 17
1,686 3,222 3,280
6,554
7,086 7,089
510
522 524 1,489
1,553 1,574 10,239
12,383 12,467
Q2 16 Q1 17 Q2 17
ColoRatio
1.86x 1.92x
17 34 36
30
34 34 5
5 6
8
10 10
60
83 86
Q2 16 Q1 17 Q2 17
Revenue Growth ($m) Adjusted EBITDA Growth ($m)
DRC Tanzania Congo Brazzaville Holdco costsGhana
Y-o-Y +18%Y-o-Y +22%
Y-o-Y +42% Y-o-Y +73%
8
1.90x

© Copyright Helios Towers Africa Ltd 2017, All rights reserved
H1 2017 Revenue Breakdown
H1 17 Revenue Breakdown by Customer H1 17 Revenue Breakdown by FX
H1 17 Revenue Breakdown by Country Commentary
87% of H1 17 revenues from Investment Grade (IG) or near IG customers
59% of revenues in USD or XAF (which is pegged to the Euro)
USD 55%
XAF / EUR4%
Power LCY14%
LCY 27%
IG or near IG87%
Other13%
9
Ghana12%
Tanzania40%
DRC41%
Congo B7%

© Copyright Helios Towers Africa Ltd 2017, All rights reserved
25%
24%
11%
9%
31%
Tanzania
DRC
Ghana
Congo B
HoldCo
33
56
H1 16 H1 17
55%45%
Power Non Power
1,709
2,069
H1 16 H1 17
Costs and Margin Analysis
Monthly Cash Flow per Tower ($) (1) Y-o-Y Adjusted EBITDA Growth ($m)
H1 17 Costs Breakdown ($m) (2) Commentary
Strong growth in Tower Cash Flow and EBITDA
Organic demand
Airtel DRC tower acquisition
Business/Operational excellence program
Total Cost of Sales: $88m Total SG&A: $24m
Margin 27% 33%
(1) Tower Cash Flow calculated as Reported Gross Profit + Site Depreciation(2) Costs breakdown excludes depreciation, amortisation, one-off restructuring costs and
aborted deal costs
+21%
+72%
10
© Copyright Helios Towers Africa Ltd 2017, All rights reserved
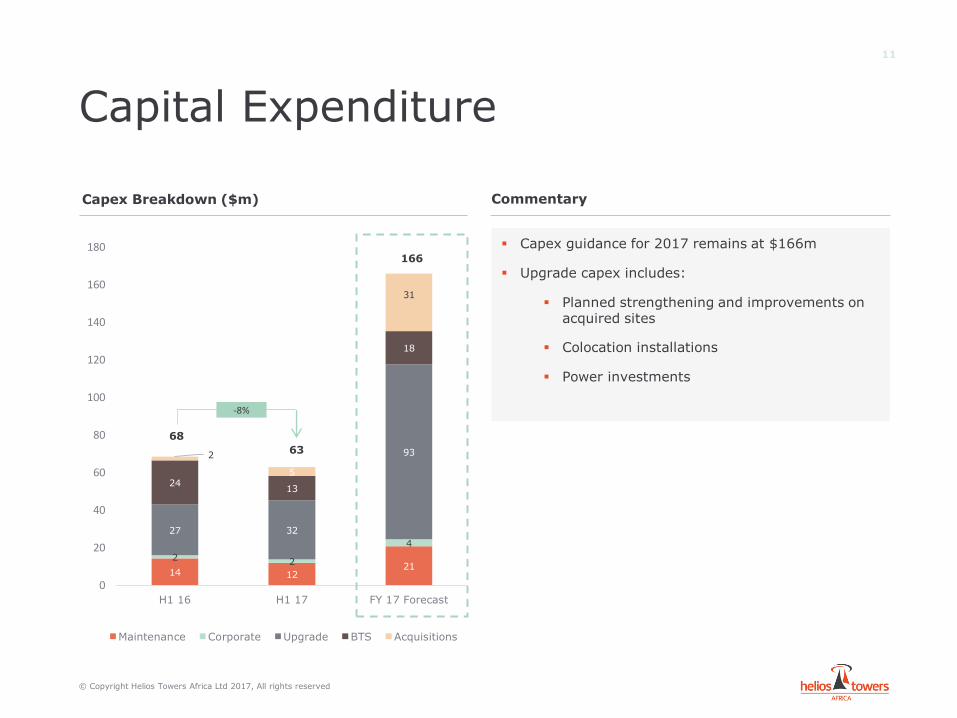
14 1221
2 2
4
27 32
93
2413
18
2
5
31
0
20
40
60
80
100
120
140
160
180
H1 16 H1 17 FY 17 Forecast
Maintenance Corporate Upgrade BTS Acquisitions
Capital Expenditure
Capex Breakdown ($m) Commentary
Capex guidance for 2017 remains at $166m
Upgrade capex includes:
Planned strengthening and improvements on acquired sites
Colocation installations
Power investments
-8%
11
68
63
166

© Copyright Helios Towers Africa Ltd 2017, All rights reserved
5.9x 5.6x5.3x
Q4 16 (Pf) Q1 17 Q2 17Q2 17
Summary of Financial Debt
Gross Leverage
Commentary
Continued deleveraging supported by q-o-q growth in EBITDA
(1) Including Shareholder Loans(2) Excluding unamortised loan issue costs and derivative financial instruments(3) Proforma for $600m bond refinancing
In US$m, unless otherwise stated Q1 17 Q2 17
Cash & cash equivalents 289 268
Debt (Principal)
Loans(1) 12 11
HTA Senior Notes 600 600
Gross Debt(2) 612 611
Net Debt 323 343
L3MA EBITDA 110 115
Leverage
Gross Debt / L3MA EBITDA 5.6x 5.3x
Net Debt / L3MA EBITDA 2.9x 3.0x
12
Debt KPIs
Q1 17
-0.3x
Q4 16 (Pf)(3)

© Copyright Helios Towers Africa Ltd 2017, All rights reserved
Outlook for 2017Q
3 a
nd 2
017 P
erf
orm
ance O
utlook
Opex saving capex initiatives on track to deliver Q3 margin expansion
2017 performance is in line with management forecasts
13
Customer expansion continues in line with expectations
Q&A
ww
w.h
elio
sto
wers
afr
ica.c
om

Appendix
ww
w.h
elio
sto
wers
afr
ica.c
om

© Copyright Helios Towers Africa Ltd 2017, All rights reserved
Income Statement
($m) H1 17 H1 16
Turnover 169.0 119.8
% Growth 41.1% 39.9%
Less: Cost of sales -141.5 -99.8
Gross profit 27.5 20.0
% Margin 16.3% 16.7%
Less: Operating expenses -48.1 -28.2
Operating profit (loss) -20.6 -8.2
% Margin -12.2% -6.8%
Plus: D&A 72.4 38.0
Plus: Other adjustments -0.2 -0.1
Plus: Exceptional Items 4.7 3.0
Adj. EBITDA Post Exceptional Items 56.3 32.7
% Margin 33.3% 27.3%
Operating profit (loss) -20.6 8.2
Plus: Investment income 0.1 0.1
Plus / (Less): Other gains and loss 0.0 0.0
Less: Finance costs -56.7 -26.2
Profit / (Loss) before taxation -77.3 -34.3
Less: Taxation -1.1 -0.6
Less: Discontinued operations 0.0 0.0
Profit / (Loss) for the year -78.3 -35.0
16

© Copyright Helios Towers Africa Ltd 2017, All rights reserved
Balance Sheet
($m) 2015 H1 17 Q4 16
Assets
Inventories 11.1 19.5
Trade and other receivables 124.8 126.9
Prepayments 36.5 34.8
Cash and bank balances 267.7 133.7
Total Current Assets 440.0 314.9
Intangible assets 19.9 35.6
PP&E 656.7 655.1
Investments in subsidiaries 0.1 0.1
Derivative financial assets 2.5 1.4
Total Non Current Assets 679.2 692.2
Total Assets 1,119.2 1,007.1
Liabilities & Shareholders Equity
Trade and other payables 146.4 166.7
Minority interest buy-out liabilities 8.8 60.5
Loans 58.5 57.9
Total Current Liabilities 213.7 285.1
Loans 598.5 340.6
Derivatives financial liabilities - -
Provisions - -
Total Non Current Liabilities 598.5 340.6
Equity attributable to owners 352.5 417.7
Non controlling interest -45.5 -36.3
Total Equity 307.0 381.4
Total Liabilities & Shareholders Equity 1,119.2 1,007.1
17

© Copyright Helios Towers Africa Ltd 2017, All rights reserved
Cash Flow Statement
($m) H1 17 H1 16
Cash Flows from Operating Activities
EBITDA before loss on disposal 56.3 32.7
Exceptional costs -5.3 -3.7
Changes in Working Capital -19.2 -19.2
Interest paid -10.2 -10.8
Finance costs - -
Tax paid -1.0 -0.6
Net Cash from Operating Activities 20.6 -1.6
Cash Flows from Investing Activities
Payments to acquire PP&E -57.9 -72.1
Payments to acquire subsidiaries 0.0 0.0
Payments to acquire intangible assets -1.9 -1.4
Proceeds on disposal on assets 0.2 0.1
Interest received 0.1 0.1
Net Cash from Investing Activities -59.5 -73.3
Cash Flows from Financing Activities
Gross proceeds from issue of equity share capital 0.0 174.3
Loan financing costs -24.1 0.0
Equity issuance costs 0.0 0.0
Net proceeds from drawn down loan 600.0 47.1
Loan repayments -402.9 -9.8
Net Cash from Financing Activities 173.1 211.5
FX on translation movement -0.2 -0.3
Net Increase / (Decrease) in Cash and Cash Equivalents 134.0 136.3
18

© Copyright Helios Towers Africa Ltd 2017, All rights reserved
Disclaimer
This presentation (the “Presentation”) is provided on a strictly private and confidential basis for information purposes only. By attending or reading this Presentation, you will be deemed to have agreed to the obligations and restrictions set out below. Without the express prior written consent of the Company, the Presentation and any information contained within it may not be (i) reproduced (in whole or in part), (ii) copied at any time, (iii) used for any purpose other than your evaluation of the Company or (iv) provided to any other person, except your employees and advisors with a need to know who are advised of the confidentiality of the information.
This Presentation does not constitute or form part of, and should not be construed as, an offer, invitation or inducement to purchase or subscribe for securities nor shall it or any part of it form the basis of, or be relied on in connection with, any contract or commitment whatsoever. This Presentation does not constitute either advice or a recommendation regarding any securities.
The communication of this Presentation is restricted by law; it is not intended for distribution to, or use by any person in, any jurisdiction where such distribution or use would be contrary to local law or regulation.
This communication is exempt from the restriction in section 21 of the Financial Services and Markets Act 2000 on the communication of invitations and inducements to engage in investment activity on the grounds that this Presentation is being directed only at (a) persons outside the United Kingdom, (b) existing holders of securities of the Company who fall within Article 43 of the Financial Services and Markets Act 2000 (Financial Promotion) Order 2005 (the “Order”), (c) persons who have professional experience in matters relating to investments who fall within Article 19 of the Order or (d) other persons to whom it may be lawfully communicated, falling within Article 49 (high net worth companies) of the Order or otherwise.
No representations or warranties, express or implied are given in, or in respect of, this Presentation. To the fullest extent permitted by law in no circumstances will the Company, or any of its respective subsidiaries, shareholders, affiliates, representatives, partners, directors, officers, employees, advisers or agents be responsible or
liable for any direct, indirect or consequential loss or loss of profit arising from the use of this Presentation, its contents (including the internal economic models), its omissions, reliance on the information containedwithin it, or on opinions communicated in relation thereto or otherwise arising in connection therewith. The information contained in this Presentation has not been independently verified.
Recipients of this Presentation are not to construe its contents, or any prior or subsequent communications from or with the Company or its representatives as investment, legal or tax advice. In addition, this Presentation does not purport to be all-inclusive or to contain all of the information that may be required to make a full analysis of the Company. Recipients of this Presentation should each make their own evaluation of the Company and of the relevance and adequacy of the information and should make such other investigations as they deem necessary.
This Presentation contains illustrative returns, projections, estimates and beliefs and similar information (“Forward Looking Information”). Forward Looking Information is subject to inherent uncertainties and qualifications and is based on numerous assumptions, in each case whether or not identified in the Presentation. Forward Looking Information is provided for illustrative purposes only and is not intended to serve as, and must not be relied on by any investor as, a guarantee, an assurance, a prediction or a definitive statement of fact or probability. Nothing in this Presentation should be construed as a profit forecast. Actual events and circumstances are difficult or impossible to predict and will differ from assumptions. Many actual events and circumstances are beyond the control of the Company. Some important factors that could cause actual results to differ materially from those in any Forward Looking Information could include changes in domestic and foreign business, market, financial, political and legal conditions. There can be no assurance that any particular Forward Looking Information will be realised, and the performance of the Company may be materially and adversely different from the Forward Looking Information. The Forward Looking Information speaks only as of the date of this Presentation. The Company expressly disclaims any obligation or undertaking to release any updates or revisions to any Forward Looking Information to reflect any change in the Company’s expectations with regard thereto or any changes in events, conditions or circumstances on which any Forward Looking Information is based. Accordingly, undue reliance should not be placed upon the Forward Looking Information.