Embed Size (px)
Citation preview

PII S0360-3016(02)02803-1
CLINICAL INVESTIGATION Lung
PRECISE AND REAL-TIME MEASUREMENT OF 3D TUMOR MOTION INLUNG DUE TO BREATHING AND HEARTBEAT, MEASURED
DURING RADIOTHERAPY
YVETTE SEPPENWOOLDE, M.SC.,* HIROKI SHIRATO, M.D., PH.D.,† KEI KITAMURA, M.D., PH.D.,†
SHINICHI SHIMIZU, M.D., PH.D.,† MARCEL VAN HERK, PH.D.,* JOOS V. LEBESQUE, M.D., PH.D.,* AND
KAZUO MIYASAKA, M.D., PH.D.†
*Department of Radiotherapy, The Netherlands Cancer Institute, Antoni van Leeuwenhoek Hospital, Amsterdam, The Netherlands;†Department of Radiation Medicine, Hokkaido University School of Medicine, Sapporo, Japan
Purpose: In this work, three-dimensional (3D) motion of lung tumors during radiotherapy in real time wasinvestigated. Understanding the behavior of tumor motion in lung tissue to model tumor movement is necessaryfor accurate (gated or breath-hold) radiotherapy or CT scanning.Methods: Twenty patients were included in this study. Before treatment, a 2-mm gold marker was implanted inor near the tumor. A real-time tumor tracking system using two fluoroscopy image processor units was installedin the treatment room. The 3D position of the implanted gold marker was determined by using real-time patternrecognition and a calibrated projection geometry. The linear accelerator was triggered to irradiate the tumoronly when the gold marker was located within a certain volume. The system provided the coordinates of the goldmarker during beam-on and beam-off time in all directions simultaneously, at a sample rate of 30 images per second.The recorded tumor motion was analyzed in terms of the amplitude and curvature of the tumor motion in threedirections, the differences in breathing level during treatment, hysteresis (the difference between the inhalation andexhalation trajectory of the tumor), and the amplitude of tumor motion induced by cardiac motion.Results: The average amplitude of the tumor motion was greatest (12 � 2 mm [SD]) in the cranial-caudaldirection for tumors situated in the lower lobes and not attached to rigid structures such as the chest wall orvertebrae. For the lateral and anterior-posterior directions, tumor motion was small both for upper- andlower-lobe tumors (2 � 1 mm). The time-averaged tumor position was closer to the exhale position, because thetumor spent more time in the exhalation than in the inhalation phase. The tumor motion was modeled as asinusoidal movement with varying asymmetry. The tumor position in the exhale phase was more stable than thetumor position in the inhale phase during individual treatment fields. However, in many patients, shifts in theexhale tumor position were observed intra- and interfractionally. These shifts are the result of patient relaxation,gravity (posterior direction), setup errors, and/or patient movement.The 3D trajectory of the tumor showed hysteresis for 10 of the 21 tumors, which ranged from 1 to 5 mm. Theextent of hysteresis and the amplitude of the tumor motion remained fairly constant during the entire treatment.Changes in shape of the trajectory of the tumor were observed between subsequent treatment days for only onepatient. Fourier analysis revealed that for 7 of the 21 tumors, a measurable motion in the range 1–4 mm wascaused by the cardiac beat. These tumors were located near the heart or attached to the aortic arch. The motiondue to the heartbeat was greatest in the lateral direction. Tumor motion due to hysteresis and heartbeat can lowertreatment efficiency in real-time tumor tracking–gated treatments or lead to a geographic miss in conventionalor active breathing controlled treatments.Conclusion: The real-time tumor tracking system measured the tumor position in all three directions simulta-neously, at a sampling rate that enabled detection of tumor motion due to heartbeat as well as hysteresis. Tumormotion and hysteresis could be modeled with an asymmetric function with varying asymmetry. Tumor motiondue to breathing was greatest in the cranial-caudal direction for lower-lobe unfixed tumors. © 2002 ElsevierScience Inc.
Respiratory movement, Lung, Radiotherapy, Heartbeat.
INTRODUCTION
Recent developments in radiotherapy such as intensity-modulated radiotherapy, noncoplanar conformal radiother-
apy (1–5), and active breathing controlled–gated treatments(6) are all aimed at increasing the tumor dose and reducingthe dose to normal tissue. Discrepancies in tumor positionbetween treatment and a planning computed tomography
Reprint requests to: Hiroki Shirato, M.D., Department of RadiationMedicine, Hokkaido University School of Medicine, North-15West-7, Sapporo, Japan. E-mail: [email protected]
Received Aug 21, 2001, and in revised form Feb 25, 2002.Accepted for publication Mar 4, 2002.
Int. J. Radiation Oncology Biol. Phys., Vol. 53, No. 4, pp. 822–834, 2002Copyright © 2002 Elsevier Science Inc.Printed in the USA. All rights reserved
0360-3016/02/$–see front matter
822

(CT) scan can be caused by setup errors and organ motion(7–9). To account for these errors, a safety margin is addedto the clinical target volume to obtain the planning targetvolume. Reducing setup error and understanding organ mo-tion are essential in designing the tightest possible safetymargin without compromising the tumor coverage. To ex-amine the motion of lung tumors during respiration, Ekberget al. (10) used fluoroscopy at the time of simulation. Theydemonstrated an average movement of 3.9 mm (range:0–12 mm) in the cranial-caudal direction, 2.4 mm (range:0–5 mm) in the mediolateral direction, and 2.4 mm (range:0–5 mm) in the dorsoventral direction. Breath-hold (6, 11)or gated (12, 13) radiotherapy is designed to reduce tumormotion due to breathing. A novel method of accurate dosedelivery to moving tumors with small margins is the real-time tumor tracking radiotherapy (RTRT) system (14–16).
Three-dimensional (3D) treatment planning is oftenperformed on a CT scan made while the patient breathesfreely, under the assumption that the CT image representsthe average position of the tumor. However, breathingmotion can cause misdetection of the tumor during CTscanning, especially for small tumors, resulting in asmaller planning volume or a distorted tumor shape (17).To obtain an accurate tumor image, a breath-hold CT ispreferable. The ideal breathing phase in which the breath-hold CT is taken must correspond to the average tumorposition. When the breathing motion of the tumor is notsymmetric, the average tumor location is no longer mid-way between the inhale and exhale tumor position.
In this study, precise 3D recordings of tumor positionwere made during RTRT treatment, both beam-on andbeam-off periods, at a high sampling rate to determine and
model tumor motion due to breathing, heartbeat, and patientmotion.
PATIENTS AND METHODS
Twenty patients with tumors at different sites in the lung(One patient had two tumors) were included in the analysis(Table 1). Seventeen patients had non–small-cell primarylung cancer, and three had metastatic lung tumors. A typicaltreatment schedule consisted of 4 � 10 Gy with a four-fieldnoncoplanar conformal technique using multiple staticbeams (4 MV) shaped with a multileaf collimator.
A 2.0-mm gold marker was implanted into or near thetumor mass using bronchial endoscopy or, when thetumor was situated near the thoracic wall, percutaneousneedle insertion. Free-breathing CT scans were taken ofthe entire lung volume using a 5-mm slice thickness anda 5-mm slice interval. At the level of the tumor and theinserted marker, the slice thickness and slice intervalwere 1 mm or, if the tumor was large, 3 mm. Addition-ally, voluntary breath-hold CT scans were made at theinhalation and exhalation phases of tidal breathing, withthe same slice thickness as for the free-breathing scan. Aphysician delineated the gold marker and the clinicaltarget volume in each slice, and the position of themarker relative to the tumor was determined. Of the threeCT scans, the scan that yielded the best possibility forirradiating the tumor (concerning normal tissue damage,tumor coverage, and treatment efficiency) was chosen asthe planning CT scan. Three-dimensional treatment plan-ning was performed using the Focus system (CMS, St.Louis, MO).
Table 1. Patient characteristics
Patientno. Age KI* Pathology
Markerlocation
Tstage
Dose(Gy)
Tumorsize (cm3)
1 77 70 Squamous cell Near 2 40 142 52 80 Squamous cell Near 1 35 853 72 80 Squamous cell In 4 40 224 70 80 Adenocarcinoma Near 2 40 205 70 50 Squamous cell In 3 40 106 72 80 Squamous cell In 3 40 367 77 70 Squamous cell Near 1 40 608 76 70 Adenocarcinoma In 1 40 169a 83 80 Squamous cell Near 1 40 109b Adenocarcinoma Near 1 40 14
10 43 90 Adenocystic carcinoma, metastatic Near – 40 811 69 90 Squamous cell In 2 35 19212 55 70 Adenocarcinoma Near 2 35 313 68 40 Squamous cell Near 2 40 13514 57 70 Squamous cell, metastatic In – 35 2315 84 80 Squamous cell Near 1 40 1416 41 80 Renal cell carcinoma, metastatic In – 40 16817 81 80 Adenocarcinoma In 3 35 25718 67 90 Bronchioalveolar In 3 35 219 81 80 Adenocarcinoma Near 2 40 920 70 90 Squamous cell In 1 40 25
*Karnofsky index.
8233D tumor motion due to breathing and heartbeat ● Y. SEPPENWOOLDE et al.
The fluoroscopic real-time tumor tracking radiotherapysystem consists of four sets of diagnostic fluoroscopy, im-age processor units, a trigger control unit, an image displayunit, and a conventional linear accelerator with multileafcollimators (15). Using two of the four fluoroscopy imageprocessor units, the system determines the 3D position ofthe gold marker 30 times a second by using real-time patternrecognition and calibrated projection geometry. To avoidthe blocking of the fluoroscopic images by the gantry of thelinear accelerator, any two of the four X-ray systems may beselected. During the setup stage of each treatment fraction,the patient is positioned with skin markers. The physicianjudges both tumor position and motion based on two fluo-roscopy images. The position of the treatment couch isadjusted when the gold marker is not found within theplanned region. The zero tumor position is set by the phy-sician at the position that best corresponds to the intendedtreatment breathing phase, based on the planning CT (Inmost cases, this was the exhale phase). Because the place-ment of the zero position may differ slightly from day to
day, the error made in this position is described as the“residual setup error”.
During treatment, the linear accelerator was triggered toirradiate the tumor only when the gold marker was locatedwithin a specified region of the planned coordinates relativeto the isocenter. The delay between recognition of themarker and the start of irradiation was 0.09 s. Radiationoncologists defined the distance of the permitted dislocationof the tumor in the lateral (LR), cranial-caudal (CC), andventral-dorsal (AP) directions, resulting in a box around theisocenter. The permitted displacement for each patient wastypically 3 � 3 � 3 mm3.
The LR, CC, and AP coordinates of the internal markerwere recorded 30 times per second during the treatment.Analog video images of the two fluoroscopic imageswere recorded simultaneously. All available data sets(each fraction and each beam direction) were analyzedfor each patient; on average, there were 16 sets of 300 sper patient. The raw data of the RTRT system werefiltered with a 30-point median filter to reduce system
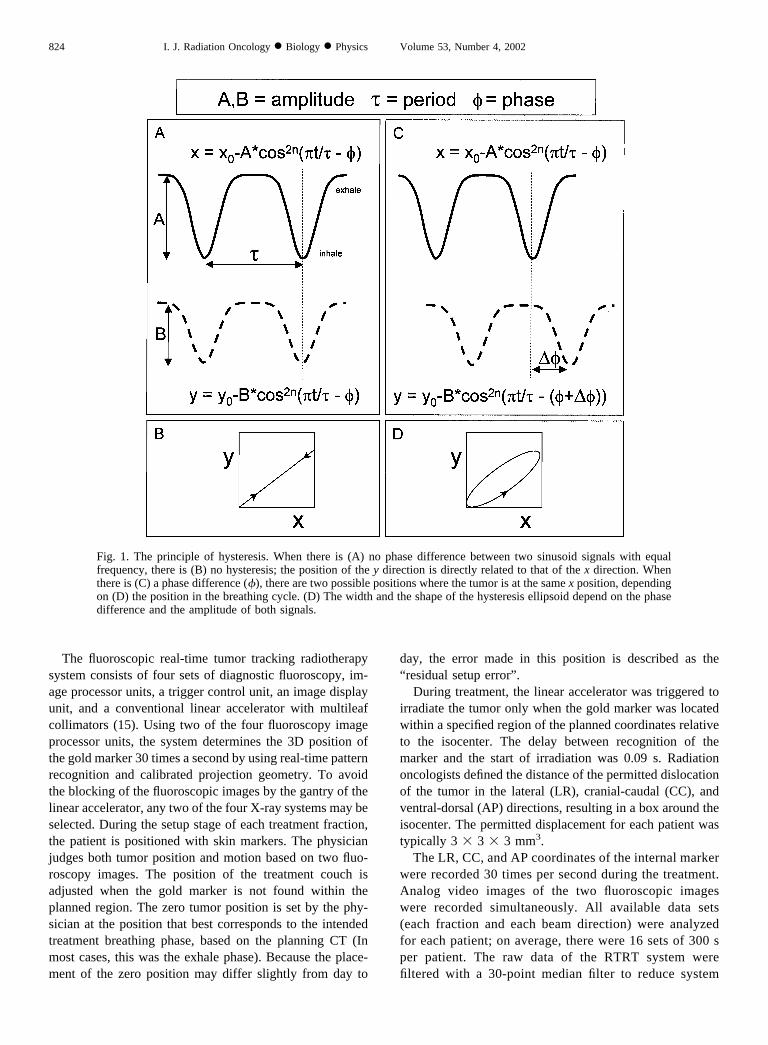
Fig. 1. The principle of hysteresis. When there is (A) no phase difference between two sinusoid signals with equalfrequency, there is (B) no hysteresis; the position of the y direction is directly related to that of the x direction. Whenthere is (C) a phase difference (�), there are two possible positions where the tumor is at the same x position, dependingon (D) the position in the breathing cycle. (D) The width and the shape of the hysteresis ellipsoid depend on the phasedifference and the amplitude of both signals.
824 I. J. Radiation Oncology ● Biology ● Physics Volume 53, Number 4, 2002

noise. For each data set, the individual breathing cycleswere detected automatically by thresholding, after incon-sistent readings of the inferred position of the markerwere manually removed. These inconsistent readings oc-curred during about 1% of the treatment time, dependingon the visibility of the gold marker on the fluoroscopicimages. Different parameters were measured during theindividual breathing cycles: the amplitude, the position ofthe tumor in the inhale and exhale phases, the averagetumor position, and the length of the breathing cycle. Allthe individual breathing cycles recorded during one beamdirection were averaged.
The position s of the tumor as a function of time t can bedefined as follows (18):
s�t� � s0 � S cos2n��t/� � �� (1)
where s0 is the position of the tumor at exhalation, S is theamplitude, and hence s0 � S is the position at inhalation; � isthe period of the breathing cycle in seconds, and � is thestarting phase. This parameterized breathing curve was fitted(using a least-squares method) through each average breathingcycle. Hysteresis was assessed by the phase difference in theaverage breathing curves from two directions (Fig. 1). Theamount of clinically relevant hysteresis was determined as themaximum distance between the different trajectories that thetumor followed during inhalation and exhalation.
To separate tumor motion caused by heartbeat and breath-ing, the discrete Fourier transform of the unfiltered data were
determined, resulting in the power spectrum of the signal.Fourier analysis breaks down a signal into constituent sinu-soids of different frequencies. The power of a certain fre-quency represents the strength of this frequency in the timesignal. Typical breathing in this data set has a frequency0.2–0.3 Hz (a 3–5-s cycle). The heart beats with a frequency ofaround 1 Hz (60 bpm). The breathing frequency and thecardiac frequency do not overlap. When a peak of around 1 Hzwas detected in the order of the power of the breathing signal,the raw signal was filtered with different settings (a high-passdigital filter with a cutoff of 0.5 Hz to eliminate the breathingfrequency) to determine the amplitude of the motion due toheartbeat in all three directions.
RESULTS
AmplitudeFor each patient, the average amplitude of the tumor
motion was assessed in all three directions (Table 2). Inthe cranial-caudal (y) direction, tumors situated in thelower lobes and not attached to rigid structures, such asthe chest wall or vertebrae, move more than upper-lobetumors or tumors attached to rigid structures: 12 � 6 and2 � 2 mm (SD), respectively, (p � 0.005, two-tailed,unequal variances). For tumors attached to rigid struc-tures and for the LR and AP directions, there was nodifference in amplitude between upper- and lower-lobetumors; the motion was small in these directions: 1.2 �0.9 mm (SD) for the LR direction and 2.2 � 1.9 mm (SD)for the AP direction. Two patients showed tumor motion
Table 2. The mean amplitude of tumor motion, related to tumor location and attachment, the value of n for the fitted breathing curve,and the length of the breathing period
Patientno.
Mean amplitude* (mm � 1 SD)
Lobe Tumor attached to: nBreathing period
(s � 1 SD)LR CC AP
20 1.8 (0.4) 24.6 (3.8) 1.9 (0.4) Lower 1 3.8 (0.6)9a 1 (0.3) 13.1 (2.7) 3.6 (0.5) Lower 2 3.6 (0.4)
10 1.4 (0.3) 11.8 (0.9) 2.6 (0.5) Lower 1–2 4 (0.3)3 0.5 (0.4) 10 (0.8) 1.7 (0.5) Lower 2 3 (0.3)7 2.5 (0.3) 7.7 (0.9) 0.9 (0.1) Lower Aorta 2 3.3 (0.8)
18 2 (0.4) 5.4 (1.0) 0.9 (0.2) Lower 3–9 6.6 (1.5)17 0.4 (0.1) 1 (0.3) 1.7 (0.5) Lower Anterior chest wall 1 3.8 (0.6)16 0.5 (0.1) 0.2 (0.1) 0.2 (0.1) Lower Posterior chest wall 1 4.9 (0.8)19 1.1 (0.3) 11.1 (2) 5.8 (0.7) Middle 2 3.2 (0.3)
6 0.2 (0.1) 0.7 (0.1) 1.2 (0.1) Middle Lateral chest wall 2 4.8 (0.5)8 0.6 (0.1) 8.7 (0.8) 8.2 (0.5) Upper 2–3 3.8 (0.3)
12 1.3 (0.2) 4.2 (0.6) 4.1 (0.5) Upper 2 3.2 (0.4)9b 2.8 (0.6) 3 (0.5) 2.5 (0.5) Upper Vertebra and aortic arch 1 3.5 (0.3)1 2.8 (0.3) 2.8 (0.4) 1.5 (0.2) Upper 2 2.8 (0.2)5 0.4 (0.1) 2.8 (0.6) 0.8 (0.3) Upper Bronchial 2 2.7 (0.4)
11 1.7 (0.3) 2.5 (0.4) 1.4 (0.2) Upper Aorta 1 3.2 (0.4)15 0.7 (0.1) 2 (0.4) 2.7 (0.2) Upper 1 3.2 (0.3)14 0.6 (0.1) 1.5 (0.2) 1.4 (0.2) Upper 1–2 3.7 (0.4)4 0.6 (0.1) 1.2 (0.2) 2 (0.4) Upper Lateral chest wall 1 3.2 (0.4)2 2.4 (0.4) 1 (0.2) 1.2 (0.1) Upper Aorta 1 3.3 (0.3)
13 0.5 (0.1) 0.7 (0.1) 0.6 (0.1) Upper Aortic arch 1 3.7 (0.5)
*Tumor motion of more than 5 mm is underlined.
8253D tumor motion due to breathing and heartbeat ● Y. SEPPENWOOLDE et al.

of more than 5 mm in the AP direction; both tumors werelocated anterior and in the middle of the thorax (Patients8 and 19). The average efficiency (total treatment time/total irradiation time) of the RTRT system is 59% for this
patient group. The efficiency depends on the amplitude ofthe breathing motion and the size of the box representingthe permitted displacement. When the tumor motion waslarge, the relative amount of time that the tumor spent
Fig. 2. (a) Position of inhalation and exhalation phase of Patient 3 during the treatment: I, LR direction; II, CC direction;and III, AP direction. The numbers represent the days and the beam directions; for example, 21 is the first beam on Day2. The variation in the inhale position is larger than in the exhale position. Between the days and between the beams,a systematic shift in the average tumor position can be present (thick arrow). In the AP and LR directions, a gradual shiftis present in the course of one treatment day (thin arrows). (The treatment efficiency of beam 15 and beam 31 was toolow, and this beam was delivered without using the RTRT system with a larger margin.) (b) The different variations intumor position that were given in Table 3 (The numbers in the figure correspond to the numbers used in Table 3) areas follows: (1) The average tumor position represents the difference between the planned zero-position and the actualtumor position during the treatment averaged over all patients. The systematic deviation from 0 is because the plannedzero-position was normally the exhale and not the average tumor position. (2) The variation in the average tumorposition contains variation in residual setup errors, breathing, patient movement during and between treatment days, andchanges in breathing level and intensity. (3) The variation in the average inhale tumor position contains variation inresidual setup errors, breathing, patient movement during and between treatment days, and changes in breathing leveland intensity. (4) The variation in the average exhale tumor position, variation in residual setup errors, breathing, patientmovement during and between treatment days, and changes in breathing level. (6) The variation in the inhale tumorposition, corrected for its average, contains variation in patient movement during treatment, and changes in breathinglevel and intensity. (7) The variation in the exhale tumor position, corrected for its average, contains variation in patientmovement during treatment and changes in breathing level.
826 I. J. Radiation Oncology ● Biology ● Physics Volume 53, Number 4, 2002

outside the permitted displacement region was large, andthe treatment efficiency was low. When the treatmentefficiency dropped below 10%, the RTRT treatment wasabandoned, and the patient was treated using a conven-tional treatment technique.
Average tumor positionSix patients showed a time trend in tumor position during
one beam direction or during one treatment day, mostly inthe posterior direction. Between the beams, shifts in thetumor position were frequently observed in all three direc-tions (for example, Patient 3 [Fig. 2A]). Between subse-quent days, the average tumor position could also shift. Thetrends and the shifts during one treatment day may havebeen caused by patient motion or internal tumor motion(change in breathing level), whereas for the shifts betweensubsequent days, the “residual setup error” would haveplayed a role, as well.
The average tumor position and the variations in averagetumor position, amplitude, and inhale and exhale tumorpositions, averaged for each treatment beam or corrected forits average (Fig. 2B), are given in Table 3. The variations inthe averages of the exhale and inhale tumor positions werecomparable to the corresponding values of the averagetumor position.
For the CC and AP directions, the variation in theinhale and exhale tumor positions, corrected for the av-erage values (and thus corrected for the shifts betweenthe beams and between the days), was smaller (p value �0.001, paired t test) than the variation in the inhaleposition.
3D path of the tumorVisualization of the 3D path of the tumor (Fig. 3A)
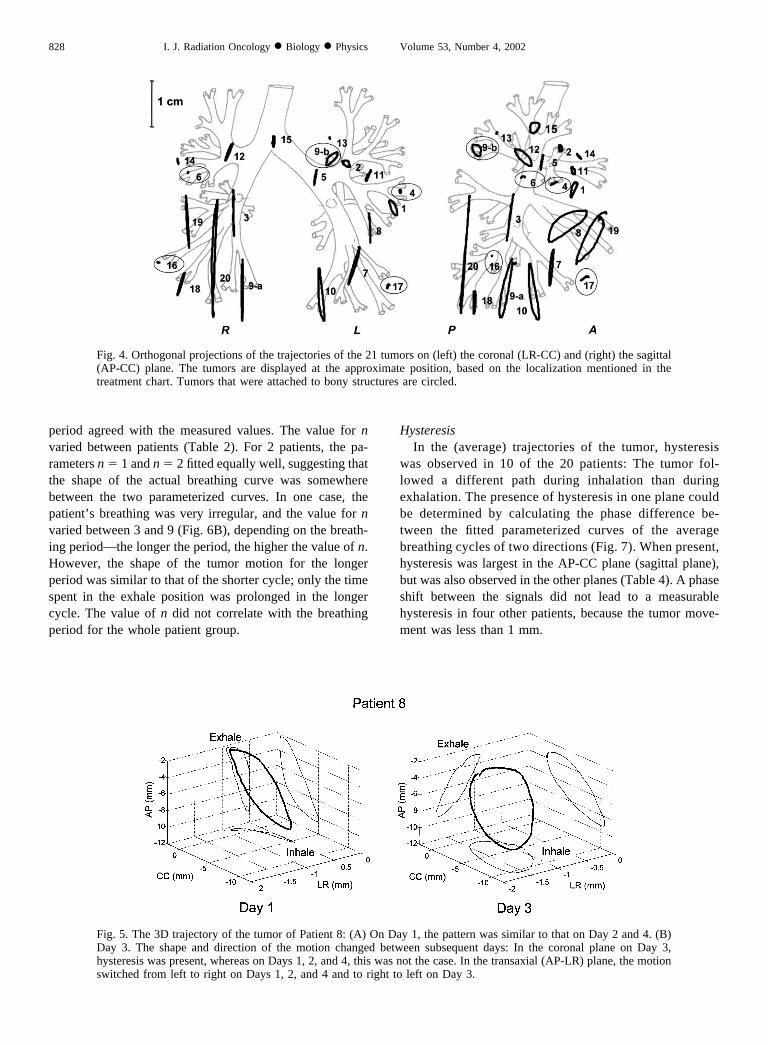
gave an impression of the hysteresis and the relation ofthe tumor motion to the permitted displacement (gaterange). The shape of the average 3D curve (Fig. 3B) wasfairly constant in time; differences were mainly becauseof shifts in average tumor position and changes in am-plitude. The projections of the trajectories of the tumorson the coronal and sagittal plane were calculated for eachpatient (Fig. 4). The tumors attached to rigid structuresare encircled. A change in the shape of the 3D path wasobserved between subsequent days in only 1 patient (Fig. 5).
Shape and length of the breathing cycleFor the patient group in this study, the average length of
one breathing cycle was 3.6 � 0.8 s (SD). The individualbreathing periods and the variation during treatment aregiven in Table 2.
For each patient, the parameters of the sinusoid (Eq. 1)were determined. Equation 1 fitted well for the majority ofthe patients (Fig. 6A); the fitted values for the amplitude and
Table 3. Summary statistics of tumor positions (in mm): seealso Fig. 2B
LR CC AP
1. Average tumor position �0.4 �1.5 �1.62. SD in average tumor position 0.8 1.2 1.13. SD in average inhale tumor position 0.9 1.3 1.14. SD in average exhale tumor position 0.8 1.2 1.15. SD in amplitude 0.2 0.8 0.36. SD in inhale tumor position* 0.2 0.8 0.47. SD in exhale tumor position* 0.2 0.4 0.3
Abbreviations: SD � standard deviation; LR � lateral; CC �cranial-caudal; AP � ventral-dorsal.
*Corrected for changes in average ex- or inhale position.
Fig. 3. (A) The 3D path of the tumor of Patient 10 during one treatment portal: The gray dots represent the tumorposition throughout the treatment, and the black dots represent the tumor position as the tumor is detected to be insidethe RTRT range (transparent box). The asterisk represents the planned zero position. (B) The average 3D curve of thetumor: The projections on the coronal, sagittal, and axial planes are drawn in thin black lines. Note that the tumorfollows a different path during inhalation than during exhalation (hysteresis).
8273D tumor motion due to breathing and heartbeat ● Y. SEPPENWOOLDE et al.
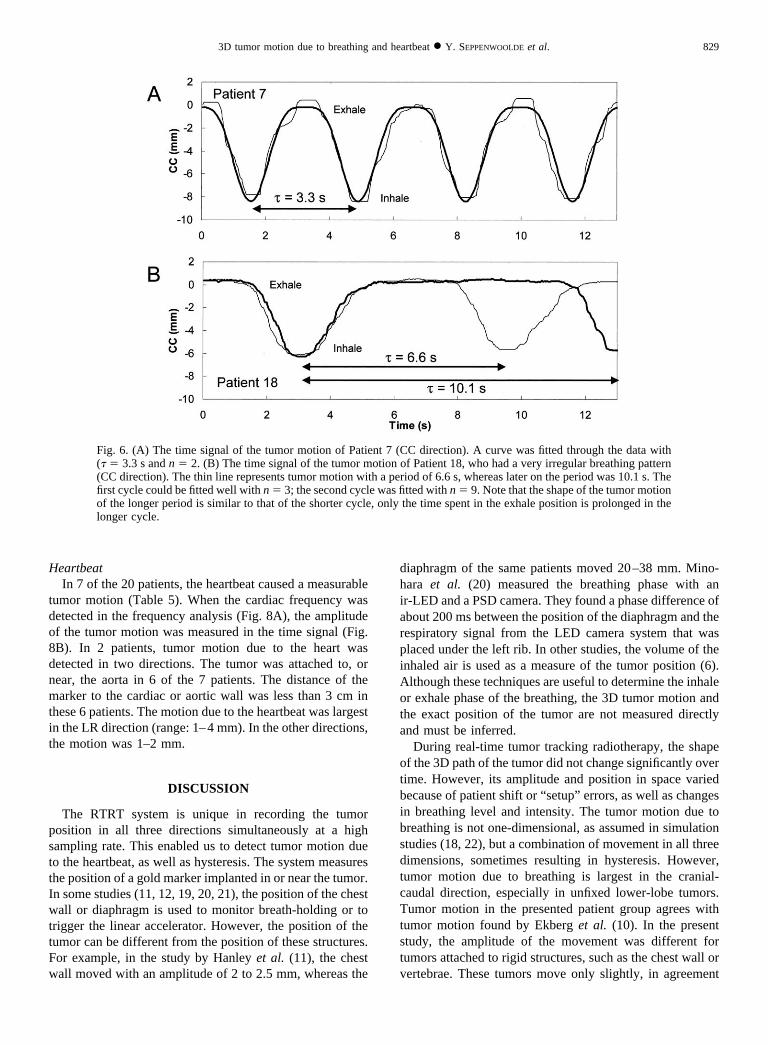
period agreed with the measured values. The value for nvaried between patients (Table 2). For 2 patients, the pa-rameters n � 1 and n � 2 fitted equally well, suggesting thatthe shape of the actual breathing curve was somewherebetween the two parameterized curves. In one case, thepatient’s breathing was very irregular, and the value for nvaried between 3 and 9 (Fig. 6B), depending on the breath-ing period—the longer the period, the higher the value of n.However, the shape of the tumor motion for the longerperiod was similar to that of the shorter cycle; only the timespent in the exhale position was prolonged in the longercycle. The value of n did not correlate with the breathingperiod for the whole patient group.
HysteresisIn the (average) trajectories of the tumor, hysteresis
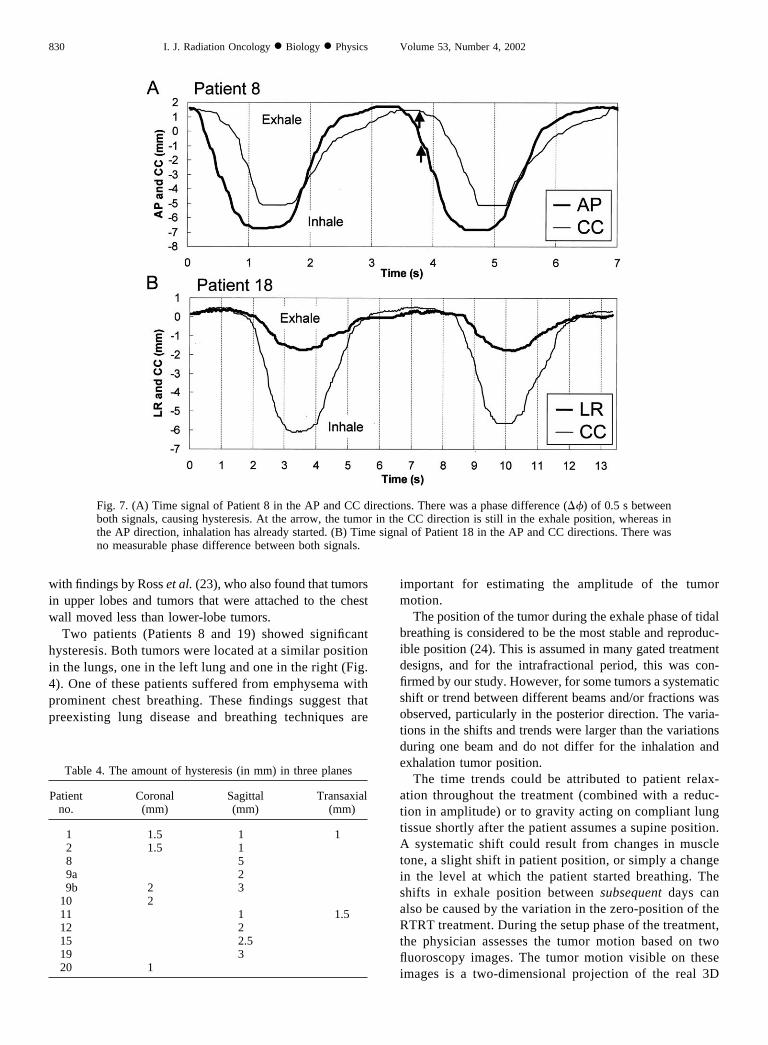
was observed in 10 of the 20 patients: The tumor fol-lowed a different path during inhalation than duringexhalation. The presence of hysteresis in one plane couldbe determined by calculating the phase difference be-tween the fitted parameterized curves of the averagebreathing cycles of two directions (Fig. 7). When present,hysteresis was largest in the AP-CC plane (sagittal plane),but was also observed in the other planes (Table 4). A phaseshift between the signals did not lead to a measurablehysteresis in four other patients, because the tumor move-ment was less than 1 mm.
Fig. 4. Orthogonal projections of the trajectories of the 21 tumors on (left) the coronal (LR-CC) and (right) the sagittal(AP-CC) plane. The tumors are displayed at the approximate position, based on the localization mentioned in thetreatment chart. Tumors that were attached to bony structures are circled.
Fig. 5. The 3D trajectory of the tumor of Patient 8: (A) On Day 1, the pattern was similar to that on Day 2 and 4. (B)Day 3. The shape and direction of the motion changed between subsequent days: In the coronal plane on Day 3,hysteresis was present, whereas on Days 1, 2, and 4, this was not the case. In the transaxial (AP-LR) plane, the motionswitched from left to right on Days 1, 2, and 4 and to right to left on Day 3.
828 I. J. Radiation Oncology ● Biology ● Physics Volume 53, Number 4, 2002
HeartbeatIn 7 of the 20 patients, the heartbeat caused a measurable
tumor motion (Table 5). When the cardiac frequency wasdetected in the frequency analysis (Fig. 8A), the amplitudeof the tumor motion was measured in the time signal (Fig.8B). In 2 patients, tumor motion due to the heart wasdetected in two directions. The tumor was attached to, ornear, the aorta in 6 of the 7 patients. The distance of themarker to the cardiac or aortic wall was less than 3 cm inthese 6 patients. The motion due to the heartbeat was largestin the LR direction (range: 1–4 mm). In the other directions,the motion was 1–2 mm.
DISCUSSION
The RTRT system is unique in recording the tumorposition in all three directions simultaneously at a highsampling rate. This enabled us to detect tumor motion dueto the heartbeat, as well as hysteresis. The system measuresthe position of a gold marker implanted in or near the tumor.In some studies (11, 12, 19, 20, 21), the position of the chestwall or diaphragm is used to monitor breath-holding or totrigger the linear accelerator. However, the position of thetumor can be different from the position of these structures.For example, in the study by Hanley et al. (11), the chestwall moved with an amplitude of 2 to 2.5 mm, whereas the
diaphragm of the same patients moved 20–38 mm. Mino-hara et al. (20) measured the breathing phase with anir-LED and a PSD camera. They found a phase difference ofabout 200 ms between the position of the diaphragm and therespiratory signal from the LED camera system that wasplaced under the left rib. In other studies, the volume of theinhaled air is used as a measure of the tumor position (6).Although these techniques are useful to determine the inhaleor exhale phase of the breathing, the 3D tumor motion andthe exact position of the tumor are not measured directlyand must be inferred.
During real-time tumor tracking radiotherapy, the shapeof the 3D path of the tumor did not change significantly overtime. However, its amplitude and position in space variedbecause of patient shift or “setup” errors, as well as changesin breathing level and intensity. The tumor motion due tobreathing is not one-dimensional, as assumed in simulationstudies (18, 22), but a combination of movement in all threedimensions, sometimes resulting in hysteresis. However,tumor motion due to breathing is largest in the cranial-caudal direction, especially in unfixed lower-lobe tumors.Tumor motion in the presented patient group agrees withtumor motion found by Ekberg et al. (10). In the presentstudy, the amplitude of the movement was different fortumors attached to rigid structures, such as the chest wall orvertebrae. These tumors move only slightly, in agreement
Fig. 6. (A) The time signal of the tumor motion of Patient 7 (CC direction). A curve was fitted through the data with(� � 3.3 s and n � 2. (B) The time signal of the tumor motion of Patient 18, who had a very irregular breathing pattern(CC direction). The thin line represents tumor motion with a period of 6.6 s, whereas later on the period was 10.1 s. Thefirst cycle could be fitted well with n � 3; the second cycle was fitted with n � 9. Note that the shape of the tumor motionof the longer period is similar to that of the shorter cycle, only the time spent in the exhale position is prolonged in thelonger cycle.
8293D tumor motion due to breathing and heartbeat ● Y. SEPPENWOOLDE et al.
with findings by Ross et al. (23), who also found that tumorsin upper lobes and tumors that were attached to the chestwall moved less than lower-lobe tumors.
Two patients (Patients 8 and 19) showed significanthysteresis. Both tumors were located at a similar positionin the lungs, one in the left lung and one in the right (Fig.4). One of these patients suffered from emphysema withprominent chest breathing. These findings suggest thatpreexisting lung disease and breathing techniques are
important for estimating the amplitude of the tumormotion.
The position of the tumor during the exhale phase of tidalbreathing is considered to be the most stable and reproduc-ible position (24). This is assumed in many gated treatmentdesigns, and for the intrafractional period, this was con-firmed by our study. However, for some tumors a systematicshift or trend between different beams and/or fractions wasobserved, particularly in the posterior direction. The varia-tions in the shifts and trends were larger than the variationsduring one beam and do not differ for the inhalation andexhalation tumor position.
The time trends could be attributed to patient relax-ation throughout the treatment (combined with a reduc-tion in amplitude) or to gravity acting on compliant lungtissue shortly after the patient assumes a supine position.A systematic shift could result from changes in muscletone, a slight shift in patient position, or simply a changein the level at which the patient started breathing. Theshifts in exhale position between subsequent days canalso be caused by the variation in the zero-position of theRTRT treatment. During the setup phase of the treatment,the physician assesses the tumor motion based on twofluoroscopy images. The tumor motion visible on theseimages is a two-dimensional projection of the real 3D
Table 4. The amount of hysteresis (in mm) in three planes
Patientno.
Coronal(mm)
Sagittal(mm)
Transaxial(mm)
1 1.5 1 12 1.5 18 59a 29b 2 3
10 211 1 1.512 215 2.519 320 1
Fig. 7. (A) Time signal of Patient 8 in the AP and CC directions. There was a phase difference (��) of 0.5 s betweenboth signals, causing hysteresis. At the arrow, the tumor in the CC direction is still in the exhale position, whereas inthe AP direction, inhalation has already started. (B) Time signal of Patient 18 in the AP and CC directions. There wasno measurable phase difference between both signals.
830 I. J. Radiation Oncology ● Biology ● Physics Volume 53, Number 4, 2002

motion. It is possible that the zero-position is chosencorrectly along one direction, but not necessarily alongthe other directions. Additionally, it is not possible to putthe zero-position at exactly the same position in thebreathing cycle each day. Thus, the combination of theplacement of zero-position, patient shifts, and changes inbreathing level can cause a variation in the order of 1 to1.5 mm. Improvement in the placement of the zero-position is required for improved accuracy. This can beaccomplished by automatically determining the averagetumor position relative to the exhale tumor position bymeans of a short real-time tumor tracking session beforethe actual treatment. However, interfraction changes inbreathing level cannot be monitored with this technique.
To obtain the best treatment efficiency for RTRT treat-ments, as well as to determine the ideal tumor position forgated or breath-hold radiotherapy or CT, the phase of thebreathing cycle representative of the average tumor positionmust be identified. The tumor motion can be modeled usinga periodic but asymmetric function (more time spent atexhale vs. inhale [Eq. 1]). The amount of time the tumorspent in the exhale position differed per patient. The tumormotion was more asymmetric for a patient with a relativelylong breathing cycle.
The 3D analysis of the tumor motion revealed also thatin some patients, the trajectory of the tumor duringinhalation is different from the trajectory during exhala-tion. This hysteresis can, for example, be induced by thebreathing technique, especially when diaphragm andchest breathing are combined asymmetrically. Anotherpossible explanation for hysteresis is the lung’s dynamicproperties. Because of the elasticity of the lung tissue, thetumor motion may be delayed compared to the motion ofthe chest wall and/or the diaphragm. It can take a whilebefore the tumor occupies a stationary position (This isreached during the relatively long “rest” periods duringthe inhalation and especially the exhalation phase). Lungdiseases such as emphysema, bullae, or fibrosis can in-fluence the elasticity of lung tissue anisotropically andcause hysteresis. When hysteresis in tumor motion is
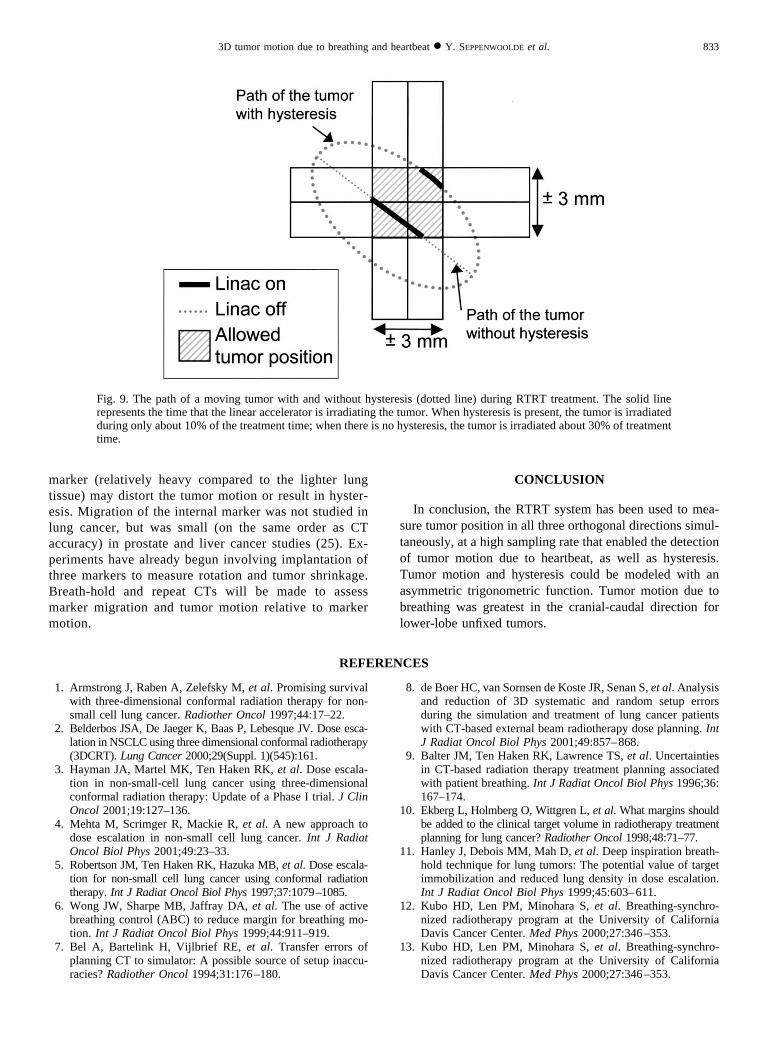
caused by the dynamic properties of lung tissue, breath-hold scans will not give the representative position of thetumor. During normal breathing, there is hysteresis; dur-ing a long breath hold, however, the tumor occupies itsstationary position. Hysteresis can seriously affect theaccuracy in radiotherapy, which uses the position of skin,diaphragm, or physiologic parameters for respiration gat-ing without considering the respiration phase. Duringreal-time tumor tracking, the tumor may be inside thepermitted range for inhalation, but outside for exhalation(Fig. 9). When this occurs in two or three directions,hysteresis can increase the irradiation time considerably.The cause of hysteresis and its effect on treatment accu-racy will require further study in the future.
Using discrete Fourier analysis, tumor motion due toheartbeat was detected in 7 of the 20 patients. Theamplitude of this motion was 1– 4 mm, mostly in the LRdirection. Tumor movement with heartbeat was mostsignificant for tumors attached to the aorta. In the fluo-roscopy study by Ekberg et al. (10), it was observed thatfor tumors located close to the heart, cardiac movementwas a major contributor to tumor motion. In a 20-patientstudy by Ross et al. (23) using an ultra-fast CT scanner,tumor motion of 9 � 6 mm in the LR and AP directionswas measured that was attributed to aortic pulsation,cardiac contraction, and respiration. Neither author dis-tinguished between tumor motion caused by breathing orcardiac motion.
Although real-time tumor tracking using an implantedgold marker resulted in precise information regarding thetumor position, the technique has inherent limitations. Thegold marker is not always inserted exactly into the tumor, sothe motion measured with the RTRT system may not cor-respond exactly with the real tumor motion. Measuringmarker motion relative to tumor motion during treatment ishampered because of the poor visibility of the tumor in thefluoroscopic images. When the tumor is large, some parts ofthe tumor may not move as a fixed, rigid structure. Tumorrotation and deformation cannot be detected using a singleinserted marker. Furthermore, the presence of the gold
Table 5. Tumor motion due to heartbeat
Patientno.
Frequency(bpm)
Amplitude (mm)
Lobe Tumor attached to:
Distance from thecardiac or aortic wallto the marker (mm)LR CC AP
2 66 1 Upper Aorta 30*5 70 1 1.5 Upper Bronchus 107 62 1 Lower Aorta 25*8 60 2 Upper Free 309b 63 2 Upper Vertebra and aortic arch 15*
11 60 4 Upper Aorta 27†
15 72 1.5 1 Upper Free 65*
The discrepancies between the tumor attachment and the distance from the cardiac or the aortic wall to the marker can be explained by:*The marker was positioned near and not in the tumor.†The tumor volume was large.Abbreviations: LR � lateral; CC � cranial-caudal; AP � ventral-dorsal.
8313D tumor motion due to breathing and heartbeat ● Y. SEPPENWOOLDE et al.

Fig. 8. (a) The frequency spectrum of the LR and CC coordinates of Patient 11. Two frequency peaks are present in theregistration, one at 0.3 Hz as a result of breathing and one at 1.05 Hz as a result of the heartbeat. In the CC direction,the power of the heartbeat signal is weak compared to the power of the breathing signal; in the LR direction, theheartbeat has the largest power. (b) The time signals of the LR (solid line) and CC (dotted line) tumor positions. In theLR direction, tumor motion due to heartbeat is visible. In the CC direction, only the breathing is visible.
832 I. J. Radiation Oncology ● Biology ● Physics Volume 53, Number 4, 2002
marker (relatively heavy compared to the lighter lungtissue) may distort the tumor motion or result in hyster-esis. Migration of the internal marker was not studied inlung cancer, but was small (on the same order as CTaccuracy) in prostate and liver cancer studies (25). Ex-periments have already begun involving implantation ofthree markers to measure rotation and tumor shrinkage.Breath-hold and repeat CTs will be made to assessmarker migration and tumor motion relative to markermotion.
CONCLUSION
In conclusion, the RTRT system has been used to mea-sure tumor position in all three orthogonal directions simul-taneously, at a high sampling rate that enabled the detectionof tumor motion due to heartbeat, as well as hysteresis.Tumor motion and hysteresis could be modeled with anasymmetric trigonometric function. Tumor motion due tobreathing was greatest in the cranial-caudal direction forlower-lobe unfixed tumors.
REFERENCES
1. Armstrong J, Raben A, Zelefsky M, et al. Promising survivalwith three-dimensional conformal radiation therapy for non-small cell lung cancer. Radiother Oncol 1997;44:17–22.
2. Belderbos JSA, De Jaeger K, Baas P, Lebesque JV. Dose esca-lation in NSCLC using three dimensional conformal radiotherapy(3DCRT). Lung Cancer 2000;29(Suppl. 1)(545):161.
3. Hayman JA, Martel MK, Ten Haken RK, et al. Dose escala-tion in non-small-cell lung cancer using three-dimensionalconformal radiation therapy: Update of a Phase I trial. J ClinOncol 2001;19:127–136.
4. Mehta M, Scrimger R, Mackie R, et al. A new approach todose escalation in non-small cell lung cancer. Int J RadiatOncol Biol Phys 2001;49:23–33.
5. Robertson JM, Ten Haken RK, Hazuka MB, et al. Dose escala-tion for non-small cell lung cancer using conformal radiationtherapy. Int J Radiat Oncol Biol Phys 1997;37:1079–1085.
6. Wong JW, Sharpe MB, Jaffray DA, et al. The use of activebreathing control (ABC) to reduce margin for breathing mo-tion. Int J Radiat Oncol Biol Phys 1999;44:911–919.
7. Bel A, Bartelink H, Vijlbrief RE, et al. Transfer errors ofplanning CT to simulator: A possible source of setup inaccu-racies? Radiother Oncol 1994;31:176–180.
8. de Boer HC, van Sornsen de Koste JR, Senan S, et al. Analysisand reduction of 3D systematic and random setup errorsduring the simulation and treatment of lung cancer patientswith CT-based external beam radiotherapy dose planning. IntJ Radiat Oncol Biol Phys 2001;49:857–868.
9. Balter JM, Ten Haken RK, Lawrence TS, et al. Uncertaintiesin CT-based radiation therapy treatment planning associatedwith patient breathing. Int J Radiat Oncol Biol Phys 1996;36:167–174.
10. Ekberg L, Holmberg O, Wittgren L, et al. What margins shouldbe added to the clinical target volume in radiotherapy treatmentplanning for lung cancer? Radiother Oncol 1998;48:71–77.
11. Hanley J, Debois MM, Mah D, et al. Deep inspiration breath-hold technique for lung tumors: The potential value of targetimmobilization and reduced lung density in dose escalation.Int J Radiat Oncol Biol Phys 1999;45:603–611.
12. Kubo HD, Len PM, Minohara S, et al. Breathing-synchro-nized radiotherapy program at the University of CaliforniaDavis Cancer Center. Med Phys 2000;27:346–353.
13. Kubo HD, Len PM, Minohara S, et al. Breathing-synchro-nized radiotherapy program at the University of CaliforniaDavis Cancer Center. Med Phys 2000;27:346–353.
Fig. 9. The path of a moving tumor with and without hysteresis (dotted line) during RTRT treatment. The solid linerepresents the time that the linear accelerator is irradiating the tumor. When hysteresis is present, the tumor is irradiatedduring only about 10% of the treatment time; when there is no hysteresis, the tumor is irradiated about 30% of treatmenttime.
8333D tumor motion due to breathing and heartbeat ● Y. SEPPENWOOLDE et al.

14. Shirato H, Shimizu S, Shimizu T, et al. Real-time tumour-tracking radiotherapy. Lancet 1999;353:1331–1332.
15. Shirato H, Shimizu S, Kunieda T, et al. Physical aspects of areal-time tumor-tracking system for gated radiotherapy. Int JRadiat Oncol Biol Phys 2000;48:1187–1195.
16. Shirato H, Shimizu S, Kitamura K, et al. Four-dimensionaltreatment planning and fluoroscopic real-time tumor trackingradiotherapy for moving tumor. Int J Radiat Oncol Biol Phys2000;48:435–442.
17. Shimizu S, Shirato H, Kagei K, et al. Impact of respiratorymovement on the computed tomographic images of small lungtumors in three-dimensional (3D) radiotherapy. Int J RadiatOncol Biol Phys 2000;46:1127–1133.
18. Lujan AE, Larsen EW, Balter JM, et al. A method for incor-porating organ motion due to breathing into 3D dose calcula-tions. Med Phys 1999;26:715–720.
19. Rosenzweig KE, Hanley J, Mah D, et al. The deep inspirationbreath-hold technique in the treatment of inoperable non-small-cell lung cancer. Int J Radiat Oncol Biol Phys 2000;48:81–87.
20. Minohara S, Kanai T, Endo M, et al. Respiratory gated irra-
diation system for heavy-ion radiotherapy. Int J Radiat OncolBiol Phys 2000;47:1097–1103.
21. Mah D, Hanley J, Rosenzweig KE, et al. Technical aspects ofthe deep inspiration breath-hold technique in the treatment ofthoracic cancer. Int J Radiat Oncol Biol Phys 2000;48:1175–1185.
22. Engelsman M, Damen EMF, De Jaeger K, et al. The effect ofbreathing and set-up errors on the cumulative dose to a lungtumor. Radiother Oncol 2001;60:95–105.
23. Ross CS, Hussey DH, Pennington EC, et al. Analysis ofmovement of intrathoracic neoplasms using ultrafast comput-erized tomography. Int J Radiat Oncol Biol Phys 1990;18:671–677.
24. Balter JM, Lam KL, McGinn CJ, et al. Improvement ofCT-based treatment-planning models of abdominal targetsusing static exhale imaging. Int J Radiat Oncol Biol Phys1998;41:939–943.
25. Kitamura K, Shirato H, Shimizu S. Migration of the internalfiducial gold marker implanted into prostate and liver treatedwith real-time tumor-tracking radiation treatment (RTRT). IntJ Radiat Oncol Biol Phys 2000;48(3S):343–344.
834 I. J. Radiation Oncology ● Biology ● Physics Volume 53, Number 4, 2002