Embed Size (px)
Citation preview
Lubricant Market Report
2012
Public Utilities Commission of Sri Lanka
27th August 2013

Lubricant Market Report 2012
As the shadow regulator of the lubricant market,
Public Utilities Commission of Sri Lanka,
Collects and records operational information of the market.
This report provides an
Overview of lubricant market
and
Summarizes the operational information.
Lubricant Market Report 2012
Contents
1. Role of PUCSL as the Shadow Regulator ......................................................................................... 1
2. Authorized Parties/Brands .............................................................................................................. 2
3. Sales and Market Share .................................................................................................................. 3
4. Imports ............................................................................................................................................ 7
5. Exports ............................................................................................................................................ 8
6. Production ....................................................................................................................................... 8
7. Lubricant Standards ........................................................................................................................ 8
8. Government Revenue ..................................................................................................................... 9
1
Lubricant Market Report 2012
1. Role of PUCSL as the Shadow Regulator
The Public Utilities Commission of Sri Lanka (PUCSL) provide assistant to the Ministry of Petroleum
Industries to regulate the downstream petroleum products. The regulation of the downstream
petroleum industry is to be assigned to the Commission under PUCSL Act, No. 35 of 2002. Schedule
of Act, No. 35 of 2002 was amended in July 2006 by way of a resolution passed in Parliament to
include the Petroleum industry in the list of public utilities to be regulated by the Commission. The
Petroleum Products (Special Provisions) (Amendment) Bill and Ceylon Petroleum Corporation
(Amendment) Bill, which would empower the Commission to regulate economic, technical,
competition and safety aspects of the petroleum industry, is to be presented to the parliament for
enactment.
The downstream petroleum industry comprises of importing and exporting petroleum products or
petroleum resources, refining and blending of petroleum resources or producing petroleum
products, storing, distributing and transporting petroleum products or petroleum resources and
wholesale and retailing of petroleum products. Petroleum products include petrol, diesel, kerosene,
aviation fuel, marine fuel, furnace oil, liquefied petroleum gas and lubricants.
At present PUCSL is acting as the shadow regulator for the lubricant sector by way of advising and
assisting the Ministry of Petroleum Industries on policy and regulatory matters. This includes
following aspects.
Providing advice on renewal of licenses of importers of lubricant products.
Engage in the process of preparing tender documents for issuing licenses to lubricant
importers.
Participate in the preparation of standards for lubricant products at the Sri Lanka Standard
Institute.
Look into the unauthorized activities in lubricant market and advice Ministry of Petroleum
Industries on such activities.
Launch customer awareness/ education programs on lubricant products.

2 Lubricant Market Report 2012
2. Authorized Parties/Brands
As at end of year 2012, there were thirteen (13) parties authorized to import, export, sell, supply and
distribute lubricants (Activity 1) and two(2) parties authorized to import, export, sell, supply,
distribute and blend lubricants (Activity 2) under following authorized brands in Sri Lanka.
Table below shows that list of authorized parties/brands and activities.
Brand(s) Company Nominee Activity
(Caltex, Chevron, Texaco,
Lanka)
Chevron Ceylon Limited Chevron Lubricants Lanka PLC
Activity 2
(Servo)
Indian Oil Corporation Limited Lanka IOC PLC Activity 2
(ExxonMobil, Esso, Mobil,
Cat)
ExxonMobil Asia Pacific Pte. Ltd.
McLarens Lubricants Limited
Activity 1
(Valvoline)
Ashland Inc. United Motors Lanka Limited Activity 1
(Shell)
Shell Markets (Middle East) Limited
N. M. Distributors (Pvt) Limited Activity 1
(BP, Castrol)
BP France S.A. Associated Motorways Limited Activity 1
(Laugfs)
Laugfs Holdings Limited Laugfs Lubricants Limited Activity1
(MAK)
Bharat Petroleum Corporation Limited
TVS Lanka (Pvt) Limited Activity 1
(Motul)
Motul Dynamic Motors (Pvt) Limited Activity 1
(Greatwall, Sinopec)
Lubricant Company Sinopec Corporation
Interocean Lubricants Limited Activity 1
(Toyota)
Toyota Tsusho Corporation Toyota Lanka (Pvt) Limited Activity 1
(Total, Elf)
Total Oil India Private Ltd Navaloka ABC Lubricants (Pvt) Limited
Activity 1
(Hyrax)
Ceylon Petroleum Corporation Activity 1

3 Lubricant Market Report 2012
3. Sales and Market Share
A total of 56,334 KL of lubricants worth of LKR 20.85 billion were sold during the year 2012, out of
which 69% of total sales were automotive products while industrial, marine and greases accounted
for 18%, 6% and 4% respectively. Following table gives the summery of sales figures.
Lubricants - Total Sales Annual Increase
Year Quantity (KL) LKR (Mil.) Quantity %
Revenue %
2012 56,334 20,854 -3.8 11.1
2011 58,554 18,775 7.7 33.8
2010 54,369 14,035 21.0 27.1
2009 44,945 11,039
Market leader held a share of 55% (reduced from 57% in 2011) and the nearest competitor has got a
market share of 11%. The market share of remaining participants has increased to 34% (from 32% in
2011). This is a result of several parties who entered the market upon full liberalization in 2006,
consolidating their positions in the market.
The sales and the market share are given in the table and graphs below
Company Sales
Quantity (KL) Market
Share (%)
Chevron Ceylon Limited 31,029 55.1
Indian Oil Corporation Limited 6,231 11.1
Ceylon Petroleum Corporation 5,590 9.9
ExxonMobil Asia Pacific Pte. Limited 4,302 7.6
Laugfs Holdings Limited 1,910 3.4
Lubricant Company Sinopec Corporation 1,566 2.8
Bharat Petroleum Corporation Limited 1,565 2.8
BP France S.A. 1,335 2.4
Shell Markets (Middle East) Limited 1,148 2.0
Ashland Inc. 711 1.3
Toyota Tsusho Corporation 729 1.3
Total Oil India Private Ltd 161 0.3
Motul 56 0.1
Total 56,334

4 Lubricant Market Report 2012
0 5,000 10,000 15,000 20,000 25,000 30,000 35,000
Chevron Ceylon Limited
Indian Oil Corporation Limited
Ceylon Petroleum Corporation
ExxonMobil Asia Pacific Pte. Limited
Laugfs Holdings Limited
Lubricant Company Sinopec Corporation
Bharat Petroleum Corporation Limited
BP France S.A.
Shell Markets (Middle East) Limited
Ashland Inc.
Toyota Tsusho Corporation
Total Oil India Private Ltd
Motul
Lubricant Sales (KL) by Company
2012
2011
2010
2009
0 2000 4000 6000 8000 10000 12000
Chevron Ceylon Limited
Ceylon Petroleum Corporation
ExxonMobil Asia Pacific Pte. Limited
Indian Oil Corporation Limited
Laugfs Holdings Limited
BP France S.A.
Bharat Petroleum Corporation Limited
Toyota Tsusho Corporation
Lubricant Company Sinopec Corporation
Shell Markets (Middle East) Limited
Ashland Inc.
Total Oil India Private Ltd
Motul
Lubricant Sales Revenue (LKR Million) by Company
2012
2011
2010
2009

5 Lubricant Market Report 2012
Lubricant sales figures of each type are depicted in following graph.
05,000
10,00015,00020,00025,00030,00035,00040,00045,000
kilo
Lit
ers
Type
Lubricant Sales (Quantity)
2009
2010
2011
2012
Automotive 69%
Industrial 18%
Marine 6%
Greases 4%
Other 3%
Lubricant Sales (Quantity) - Year 2012
Automotive 71%
Industrial 17%
Marine 5%
Greases 6%
Other 1%
Lubricant Sales (Revenue) - Year 2012

6 Lubricant Market Report 2012
Following table and pie charts depicts sales quantities and revenue of Automotive Lubricants.
Automotive Lubricant Category
Quantity (KL)
Gasoline - Multi 2,314
Gasoline - Mono 1,455
Diesel - Multi 7,785
Diesel - Mono 13,840
4S Motor Cycle 5,472
2T 4,798
Gear Oils 2,265
ATF 712
Gasoline - Multi 6%
Gasoline - Mono 4% Diesel - Multi
20%
Diesel - Mono 36%
4S Motor Cycle 14%
2T 12%
Gear Oils 6%
ATF 2%
Automotive Lubricant Sales (Quantity) Breakdown - Year 2012
Gasoline - Multi 8%
Gasoline - Mono 4% Diesel - Multi
22%
Diesel - Mono 31%
4S Motor Cycle 15%
2T 10%
Gear Oils 7%
ATF 3%
Automotive Lubricant Sales (Revenue) Breakdown - Year 2012
7 Lubricant Market Report 2012
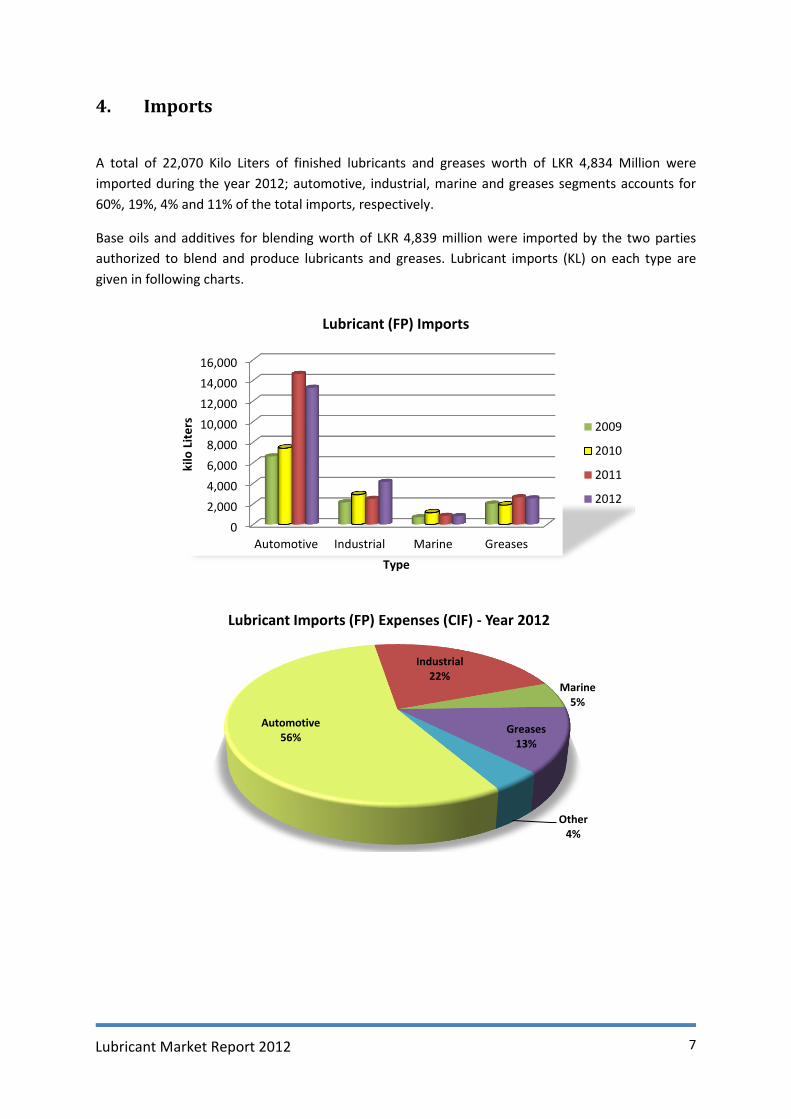
4. Imports
A total of 22,070 Kilo Liters of finished lubricants and greases worth of LKR 4,834 Million were
imported during the year 2012; automotive, industrial, marine and greases segments accounts for
60%, 19%, 4% and 11% of the total imports, respectively.
Base oils and additives for blending worth of LKR 4,839 million were imported by the two parties
authorized to blend and produce lubricants and greases. Lubricant imports (KL) on each type are
given in following charts.
0
2,000
4,000
6,000
8,000
10,000
12,000
14,000
16,000
Automotive Industrial Marine Greases
kilo
Lit
ers
Type
Lubricant (FP) Imports
2009
2010
2011
2012
Automotive 56%
Industrial 22%
Marine 5%
Greases 13%
Other 4%
Lubricant Imports (FP) Expenses (CIF) - Year 2012

8 Lubricant Market Report 2012
Expenditure for lubricant imports is given in following chart.
5. Exports
During the year 3,020 Kilo Liters of Lubricants were exported to regional markets. This is 42%
decrease with respect to year 2011. Whereas there was a 63% increase in 2011 with respect to year
2010.
6. Production The two authorized parties to blend and produce lubricants in Sri Lanka. During the year 2012,
around 65 % (36,779 KL) of the lubricant requirement was produced (blended) locally. Around 87%
(32,135 KL) of the blending was carried out at the lube blending plant of Chevron located at
Kolonnawa while the balance 13% (4,644 KL) was produced at lube blending plant belonging to IOC
located at China Bay. Local blending is done, mainly to gain the advantage from the prevailing import
tariff differential between raw materials and finished lubricants.
7. Lubricant Standards
The mandatory minimum quality standards for imported and blended lubricants and greases
stipulated by the GOSL, have been based on standards published by international organizations such
as American Petroleum Institute (API), Japanese Automobile Standards Organization (JASO) etc.
Recently, Sri Lanka Standards Institute (SLSI) has published Sri Lanka standards for Gasoline Engine
Lubricating Oil, Diesel Engine Lubricating Oil, Automotive Gear Oil, Four Stroke Motorcycle and
Automotive 56%
Industrial 22%
Marine 5%
Greases 13%
Other 4%
Lubricant Imports (FP) Expenses (CIF) - Year 2012

9 Lubricant Market Report 2012
general purpose Greases and these are used as the currently applicable minimum standards. Sri
Lankan Standards may be obtained from SLSI. Currently applicable minimum standards are given
below.
Type of Lubricant Minimum Standard
Equivalent International Standard
Other Standards Above Minimum Standard
Gasoline Engine Oil SLS 1374/2009 API SJ API SL, API SM
Diesel Engine Oil SLS 1373/2009 API CF API CF-2, API CG-4, API CH-4, API CL-4, API CJ-4
Two Stroke Engine Oil SLS 1446/2012 JASO FC JASO FD
Four Stroke Motorcycle Engine Oil
SLS 1409/2011 API SG and JASO MA API SL and JASO MA , API SM and JASO MA, API SL and JASO MA
Automotive Gear Oil SLS 1396/2010 API GL 4 API GL 5, API GL 6
Automatic Transmission Oil
DEXRON IID, DEXRON III MERCON, ALLISON C4, JASO M315 Type Group A
DEXRON IID, DEXRON III MERCON, ALLISON C4, JASO M315 Type Group A
OEM Recommended Oils
Grease SLS 1424/2011 NLGI LA NLGI LB, NLGI GA, NLGI GB NLGI GC
8. Government Revenue
The GOSL receives income from the authorized parties by way of a bi-annual fixed and in some cases
a variable registration fee, which is equivalent to 1 million Rupees or 0.5% of total invoiced sales for
that period, whichever is higher, subject to a maximum of five million Rupees. In 2012 the total
attributed registration fee to the Government is LKR 61.22 million.