Embed Size (px)
Citation preview

September Investment Newsletter THE LTI WEBSITE LAUNCH
On Monday August 20th I had the pleasure of launching the LTI
website featuring a blog, resources, investing tips and more. There are
many more features and content I plan to add in the future but I am
very pleased with what we have created thus far. The website will be an
evolutionary process, continually improving and growing over time.
As of Sept 8th, the LTI website has had 294 visitors and 1132
page views. The blog and newsletter sections of the website are by far
the most popular. I highly recommend bookmarking the blog
(http://ltinvesting.com/blog/) under your favorites as I will continuously
post economic data and various other information that will help you
make an informed decision on the global economic conditions and your
investing strategy.
September Newsletter
Written by Alain Roy
CEO LTI – Long Term Investing
September 11, 2012
www.ltinvesting.com
In this issue: • The Website Launch
• Dollar Cost Averaging – A Bad
Strategy
• Stock Screening – The LTI
Macroscreening Tool
• Aaron’s RESP - Summary
• Stock Market Update
• Global Economy Update
• Summary
“Printing money has never
solved anyone’s problems.
Maybe sometimes in the
short term..but anyone who
has studied history or
economics knows that
printing money in the longer
term doesn’t work. Maybe
this time it’s different, but I
doubt it”
Jim Rogers Legendary Investor Millionaire

DOLLAR COST AVERAGING – A BAD STRATEGY
I decided to put another nail in the coffin of mutual funds and test the theory of
dollar cost averaging which is ever so popular with financial advisors. Most folks will invest
a certain amount of money, every month, in mutual funds via their financial planner. The
monthly contributions are then immediately used to purchase more mutual funds shares
ignoring all market conditions. This approach is often called Dollar Cost Averaging. For
example, you invest $500 per month, continuously over time, and your money is then
invested into your mutual fund holdings. Because you are buying in equal periods, every
month, you are dollar cost averaging, meaning you are buying high, buying low and buying
in the middle.
I completed a 10 year scenario where you would invest $500 every month into the
S&P 500, the benchmark for all investments, using SPY exchange traded fund prices. If you
started investing in 2000, using dollar cost averaging, your total return after 12 years would
be a whopping 3.3% after dividends and paying the Management Expense Ratio.
Cummulative Inevstment Returns in a Mutual Fund using Dollar Cost Averaging
(S&P 500 was the model, dividends and MER included)
-3.9%
-6.7%
-9.0%
0.8%
2.2%
3.2%
4.9%
3.5%
-2.2%
0.2%
2.3%2.6%
3.3%
-10%
-8%
-6%
-4%
-2%
0%
2%
4%
6%
2000 2001 2002 2003 2004 2005 2006 2007 2008 2009 2010 2011 2012
Date
Return (%)

3.3% return after 10 years of being invested! I would be outraged. You often hear of the
lost decade and in reality this is true for most folks. If you would have used a dollar cost
averaging approach where you invested $500 per month every month since 2000, in the US
stock markets (using the S&P 500 as the benchmark), you would only have a return of
3.3% after all dividends and after paying the mutual fund company and your financial
planner 2.25% along the way. Here is the actual breakdown of the graph above in a table.
The next question is why? Just by the definition you are ensuring AVERAGE results because
of DOLLAR COST AVERAGING. Then on top of that tack on -2.25% due to the management
expense ratio. Even in the years that you lost money such as 2000-2002 and 2008 your
financial planner still received around 1% and the mutual fund company received the other
1.5% (roughly).
How do you ever expect to achieve great results if you are buying at market highs?
It is nearly impossible to buy low and sell high, when you are buying high, average and low.
Sometimes you are buying low when a crash occurs but as I have shown in past
newsletters, crashes only last a short period of time. The number of days that a market
crash lasts is 33 days, using the average from historical crashes. Yet market tops tend to
roll along like small mountains. Therefore you are likely buying high and average way more
than buying low and the end result is horrible returns.
Year Cummulative Return MER Div. YieldTotal Cummulative Return, after MER and Dividends
2000 -2.9% -2.25% 1.3% -3.9%2001 -5.7% -2.25% 1.3% -6.7%2002 -8.3% -2.25% 1.6% -9.0%2003 1.3% -2.25% 1.8% 0.8%2004 2.1% -2.25% 2.4% 2.2%2005 3.1% -2.25% 2.3% 3.2%2006 4.7% -2.25% 2.5% 4.9%2007 3.1% -2.25% 2.7% 3.5%2008 -2.6% -2.25% 2.7% -2.2%2009 0.3% -2.25% 2.2% 0.2%2010 2.2% -2.25% 2.3% 2.3%2011 2.3% -2.25% 2.5% 2.6%2012 2.90% -2.25% 2.7% 3.3%

Here is the graph showing the daily prices of the SPY which is an ETF mirroring the S&P
500. You can see how quick crashes occur and how much longer increases and tops occur
versus a crash. Therefore, with Dollar Cost Averaging, you never get the chance to buy low
that often. You are doomed to average, if not below average returns.
If you are currently investing in mutual funds you will achieve below average results
due to:
• the management expense ratio
• level of diversification (diworsification!!) leading to average results
• not participating in the dividend growth the same way you would owning the
most solid companies in that mutual fund but as individual stock
On top of the three reasons above, if you are invested in a mutual fund AND are using a
Dollar Cost Averaging approach, well good luck with that. You’re doomed to the poor
house!! Next I will show you an example of the results that you could have achieved
following the Market Buying Opportunity Indicators and the LTI Investing Rules.

In the last newsletter, I summarized the main Buying Opportunity Indicators I use to help
guide the timing of my stock purchases. Here is a brief summary from the last newsletter
as a reminder:
There are dozens of indicators I use to help me determine when to buy stocks. One
category of indicators I use is Market Indicators available from StockCharts.com. The table
below summarizes the main Market Indicators I use, which can be obtained by entering the
ticker symbols at: http://stockcharts.com/h-sc/ui
Note: Never use one indictor alone. Look at all of the above indicators prior to buying
equities, in addition to other indicators such as Put to Call Ratio, Rydex ratio, AAII
Investors, Sentiment, etc.
My favorite of the group is the $OEXA200r, the % of S&P 100 stocks above their 200 day
moving average. Here is a trend of this indicator since 2002.
Ticker
Potential
Buying
Opportunity
Great
Buying
Opportunity
Index Name
$OEXA200r <30 <15 % of S&P 100 Stocks above their 200 day
moving average
$BPCOMPQ <45 <30 NASDAQ Composite Bullish Percent Index
$RHNYA <15 <5 NYSE High-Low Index
$NYSI <-300 < - 600 McClellan NASDAQ Summation Index
$NAHL < -200 < -600 NASDAQ New High - New Lows Ratio
$SPXHILO <25 <10 S&P500 High-Low Index

Using these indicators great buying opportunities occurred in:
• Sept-Oct 2002
• March 2009
Potentially great buying opportunities occurred in:
• Oct-Nov 2008
• July 2010
• Aug 2012
I did not buy any equities in Oct-Nov 2008 as I felt that the wheels were just starting to fall
off. However, I did buy in March 2009, July 2010 and Aug 2012 and if I would have been
managing my money, like today, I would have bought in Sept-Oct 2002.
Now let’s go back to the original example and assume since 2000 we would want to invest
$500 per month in the S&P 500. But instead of buying into a mutual fund we would place
that money into our self-directed investing account and buy the SPY, S&P 500 ETF, where
we can buy and sell stocks at our leisure. For this example I assumed the monthly money
was sitting in the account receiving 0%, building up, until the buying opportunity occurred.
In reality you would have invested in something like xcb.to paying you monthly dividends
but since xcb.to was not around back then I ignored the 4% annual yield and assumed you
let it sit there getting 0%. Here are the results you would have achieved if you would have
followed the Market Buying Opportunities and the LTI Investing Rules and bought in 2002,
2009, 2010 and 2011 at the above-mentioned opportune times:
• Total return of 26.8% as of Sept 2012
• Dividend yield of 3.5% is included in the
26.8%
• Dollar cost Averaging in a Mutual Fund
Return: 3.3%
It is truly alarming how pitiful the results are in
the mutual fund with the dollar cost averaging approach. My cumulative weighted portfolio
average return was roughly 26% at the start of 2012 therefore I am proof that it is possible.
Return from each
buying opportunity2,002 9.2%2,009 29.6%
2,010 21.3%2,011 23.8%
Weighted Average
Cummulative Return
(dividends included)
26.8%

STOCK SCREENING – THE LTI MACROSCREENING TOOL
Choosing a company to invest your money in is a very difficult task. In my
experience most individual investors need a strong mechanical, non-emotional, system
when it comes time to choosing the companies to invest their hard earned money in. Your
first step is to determine your investment goals. However, regardless of your goals, you
should be investing in the best companies in the given sector, not the 5th best or 6th best.
My investment goals are fairly simple:
1. Invest in the best companies in their respective sector with strong fundamentals and
a strong dividend growth rate
2. Buy the company stock at a reasonable price; usually a low price
3. If the company continues to be financially strong then hold for the long term and
allow the dividends to continue growing over time. This will result in double digit
dividend yields over time and likely a very handsome stock price appreciation.
After screening over 7500 companies, I noticed over and over again there were certain
parameters consistent amongst the very best companies. That was when the LTI
Macroscreening Tool was born and simplified into four screening criteria as shown below:

The four screening parameters are:
1. Earning per share growth over time
2. Return on Equity > 12%
3. Consistent Net Profit Margins and/or increasing over time
4. Retained Earnings growth over time
Earnings per share growth over time
1. Go to http://money.msn.com/
2. Type in the stock ticker symbol or name in the top left box and hit enter
3. On the left hand side click on “10-Year Summary”
Look for EPS growth over time. Also look for share buybacks by looking at “Shares
Outstanding” in the bottom right. Share buybacks are another sign of strength.
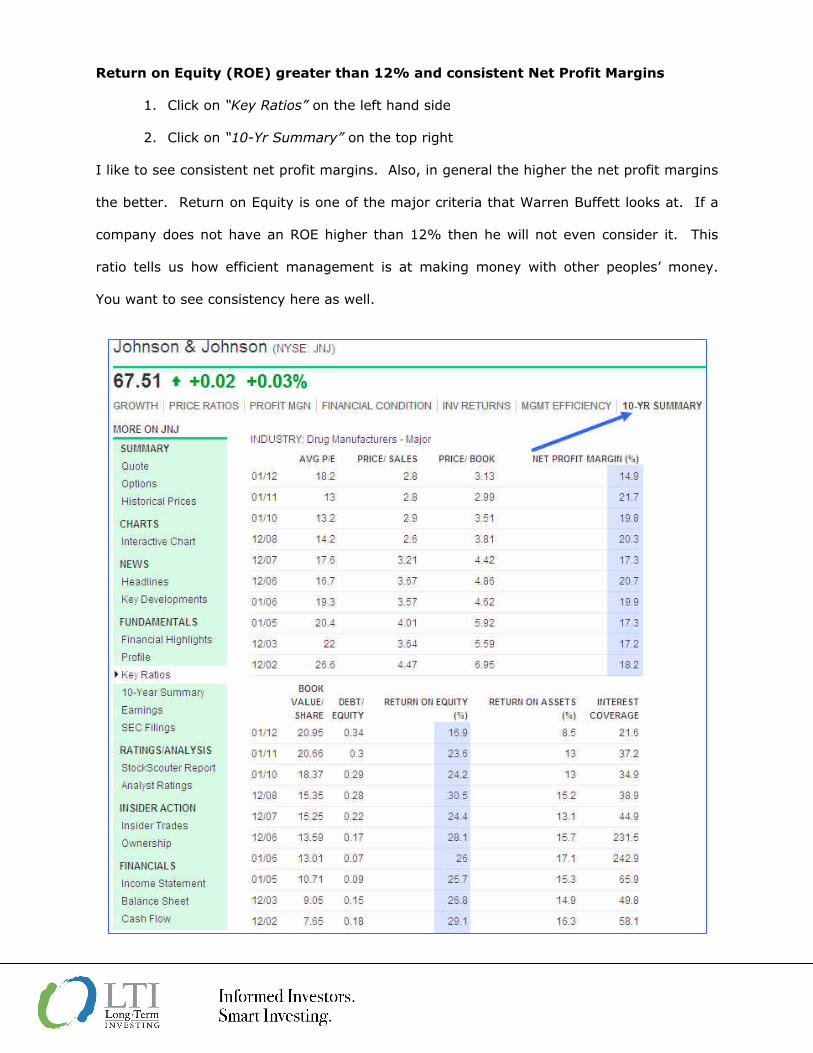
Return on Equity (ROE) greater than 12% and consistent Net Profit Margins
1. Click on “Key Ratios” on the left hand side
2. Click on “10-Yr Summary” on the top right
I like to see consistent net profit margins. Also, in general the higher the net profit margins
the better. Return on Equity is one of the major criteria that Warren Buffett looks at. If a
company does not have an ROE higher than 12% then he will not even consider it. This
ratio tells us how efficient management is at making money with other peoples’ money.
You want to see consistency here as well.

Retained Earnings Growth over time
1. Click on “Balance Sheet” on the left hand side near the bottom
2. Click the “Annual” button near the top
3. Retained earnings are shown near the bottom of the page.
In my opinion, Retained earnings growth is the single most useful measure of the strength
of a company. If I was told to invest millions of dollars into a company but I had only one
item to look at, it would be historical retained earnings.

Let’s go through some examples:
Bank of Nova Scotia (BNS) versus Manulife Financial
• EPS for BNS is much more consistent
• ROE is above 12% for BNS and higher than Manulife
• Net Profit Margins for Manulife is negative recently, a sign that they cannot withstand
tough economic difficulties unlike BNS who continue to produce high net profit margins.
Even in the good years BNS had higher net profit margins than Manulife.
• BNS has growing retained earnings and Manulife has decreasing retained earnings.
When retained earnings are not growing this is a warning sign.
Bank of Nova Scotia is the clear winner here. This is a clear case of a great company to
invest (BNS) versus a company that does not even make my Watch List (Manulife). If you
see a company with no retained earnings growth this is a sign of weakness in my mind. If
a company passes the above mentioned 4 criteria they proceed to the Financial Statement
Analysis step: http://ltinvesting.com/financial-statement-analysis/
With these four simple parameters you are able to very effectively and efficiently
weed out the good from the bad and be left with the best of the best. The Financial
Statement Analysis further refines the search until you are left with the very best, cream of
the crop type companies in your watch list. This is part of Risk Management: invest in the
BEST companies.
•
Manulife Financial Bank of Nova Scotia
EPS
Return on
Equity
(%)
Net Profit
Margin
(%)
Retained
Earnings EPS
Return on
Equity
(%)
Net Profit
Margin
(%)
Retained
Earnings
2011 -0.02 0.9 0.1 2501 2011 4.65 15.8 26.7 24662
2010 -1 -6.5 -4.7 3393 2010 3.87 15.1 23.7 21932
2009 1.89 10.9 7.7 15870 2009 2.97 12.8 15.9 19916
2008 -0.54 -2.9 -2.5 12796 2008 3.1 14.6 13.8 18549
2007 2.15 13.3 9.3 14388 2007 4.01 21.4 19 17460
2006 2.03 12.4 9.3 2006 3.56 20.3 20.1
2005 2.15 14.5 10.6 2005 3.23 20.3 23.7
2004 1.88 11.4 9.8 2004 2.97 20.3 25
2003 1.69 16.9 9.6 2003 2.64 18.8 20.5
2002 1.03 11.1 6 2002 1.16 8.6 8.3

Sometimes it is not as clear and you need to do some more digging. Let’s have a
look at Coke vs. Pepsi:
• Both have increasing Earnings per Share over time
• Coke seems to have a more stable Return on Equity
• Coke has higher net profit margins
• Both companies have strong retained earnings
• Both companies are buying back shares
In this case both companies would pass onto the Financial Statement Analysis step for
further analysis. As it turns out Coke made my ‘A’ list and Pepsi made my ‘B’ list.
Therefore I would invest in Coke before investing in Pepsi as Coke is the more
fundamentally solid company. However, should Pepsi fall to a low enough price, I would be
happy buying their shares but I would first look at Coke.
Sometimes the company looks good but one item of the four is not good. The two most
important items in my experience are retained earnings growth and Return on Equity. If a
company has good EPS growth and good net profit margins but does not have growing
retained earnings right away they are off my list. It’s that simple. I only want the best of
the best in my list. Walmart vs. Target is a good example of keeping only the best.
Coke Pepsi
EPS
Return on
Equity
(%)
Net Profit
Margin
(%)
Retained
Earnings EPS
Return on
Equity
(%)
Net Profit
Margin
(%)
Retained
Earnings
2011 1.85 27.1 18.4 53,550 2011 4.03 31.3 9.7 40,316
2010 2.53 38.1 33.6 49,278 2010 3.92 29.9 10.9 37,090
2009 1.47 27.5 22 41,537 2009 3.77 35.4 13.7 33,805
2008 1.24 28.4 18.2 38,513 2008 3.21 42.5 11.9 30,638
2007 1.28 27.5 20.7 36,235 2007 3.43 33 14.4 28,184
2006 1.08 30 21.1 2006 3.34 26.7 16
2005 1.02 29.8 21.1 2005 2.39 28.6 12.5
2004 1 30.4 22.3 2004 2.41 30.9 14.2
2003 0.88 30.9 20.8 2003 2.04 30 13.2
2002 0.8 33.7 20.3 2002 1.67 31.5 11.8

Walmart vs. Target
• Both have increasing EPS, good ROE and consistent net profit margins
• However Target has no retained earnings growth whereas Walmart does
• After performing a Financial Statement Analysis on each company, guess which
company made my ‘A’ Watch List: Walmart. The retained earnings growth over time in
my experience of analyzing thousands of companies has been one of the best measures
of how fundamentally strong the company is. After further analysis, Target did not even
make my list. If retained earnings are not growing or are decreasing, I do not consider
them for investment.
Another example is Translalta. The stock price has dropped big time lately making their
dividend yield attractive. However their EPS are stagnant, the ROE is under 12% and
erratic and their retained earnings are going down. Contrast this to Canadian Utilities.
Walmart Target
EPS
Return on
Equity
(%)
Net Profit
Margin
(%)
Retained
Earnings EPS
Return on
Equity
(%)
Net Profit
Margin
(%)
Retained
Earnings
2011 4.54 22.1 3.5 68,691 2011 4.28 18.5 4.2 12,959
2010 4.18 22.4 3.6 63,967 2010 4 18.9 4.3 12,6982009 3.73 20.5 3.5 66,357 2009 3.3 16.2 3.8 12,947
2008 3.35 20.3 3.3 63,660 2008 2.86 16.1 3.4 11,4432007 3.16 19.9 3.4 57,319 2007 3.35 18.6 4.5 12,7612006 2.92 19.8 3.5 2006 3.21 17.8 4.7
2005 2.72 21.5 3.7 2005 2.71 17 4.62004 2.46 21.2 3.7 2004 2.07 14.5 4
2003 2.03 20.3 3.4 2003 1.76 14.5 3.92002 1.76 19.8 3.4 2002 1.5 14.5 3.7
Transalta Canadian Utilities
EPS
Return on
Equity
(%)
Net Profit
Margin
(%)
Retained
Earnings EPS
Return on
Equity
(%)
Net Profit
Margin
(%)
Retained
Earnings
2011 1.33 9.3 11.1 527 2011 3.72 12.3 15.8 2,507
2010 1.19 8.2 9.7 431 2010 3.28 12 15.3 2,3662009 0.66 4.5 4.8 634 2009 3.78 13.2 18.4 2,568
2008 1.18 9.2 7.5 688 2008 3.36 13.3 15.2 2,2792007 1.53 13.2 11.2 763 2007 3.13 13.4 16.4 2,0362006 0.21 1.7 1.6 2006 2.61 12.1 13.6
2005 0.93 7.2 6.9 2005 2.12 10.5 10.82004 0.79 6 6.4 2004 2.47 12.5 10.5
2003 1.55 11.5 12.4 2003 2.07 11.3 7.12002 1.06 8.5 10.5 2002 2.44 14 10.4

AARON’S RESP PORTFOLIO SUMMARY
The RESP is truly a great way to save for your child’s education. The government
will give you 20% of whatever you put into the RESP to a max of $500 per year. This
means you can invest $2500 in an RESP and the government will give you $500; in a
calendar year. Therefore, without placing the money in any investment you are achieving a
20% risk free return. I say risk free because you can have this money invested in nothing
inside the RESP but the government will still give you 20%. How amazing is that? Try
getting a 20% return on your investment risk free...doesn’t exist other than this. Naturally
it makes sense to do everything we can as parents to ensure we max out the RESP every
year in order receive $500 of free money from the government. In June 2012, I bought
Santander Preferred shares which pay quarterly dividends at an annual yield of 10.2% (at
my purchase price of $25.09). In addition, I also bought some xcb.to shares which have a
4.2% annual yield in the form of monthly dividends. So Aaron’s RESP looks like this so far:
• Total Portfolio yield of 7.2% per annum
• Weighted Portfolio return in 2012 (as of Sept 7): 12.6% (not including gov. match )
• This is a solid and very safe portfolio for the little guy so far.
Aaron's RESP Portfolio Summary
Santander
Preferred Share
10% Div. Yield
Xcb.to
(Corp Bond ETF,
4.2% Div. Yield)
Santander Preferred Share
Xcb.to (Corp Bond ETF)

For any parents or grandparents reading this newsletter I highly encourage you to open an
RESP for your child or children and do your very best to put away $2500 per year per child
in order to receive $500 per year of free money from the government. You can put more
than $2500 away in a given year, you just won’t get any more money from the government.
The most they will give you per year is $500, hence why it makes the most sense for most
parents to put $2500 per year.
STOCK MARKET UPDATE
The stock markets have been advancing lately on various central bank
announcements such as the ECB bond buying program, some Chinese easing and other
easing strategies. This has helped to lift stock markets to a 3 year high. The future
direction of the markets is always unknown. However, there are some indicators an
investor can use to determine what position the markets are in: overbought, oversold or
neutral.
Last week I posted, http://ltinvesting.com/markets/rydex-bulls-to-bear-ratio-continues-
its-ascent/, that the Rydex ratio was showing signs of the equity market either at a top or in
the topping process.

The volatility index is currently very low versus the last five years. Periods of calm in the
markets may go on for some time but at some point something occurs to jolt the markets,
fear and uncertainty rises and volatility increases. Therefore when the waters are too calm,
especially in today’s economy I tend to get cautious: http://ltinvesting.com/markets/the-
volatility-index-vix/
The ratio of utility stocks to the S&P 500 is a good indicator I like to use to determine
whether equities are in the oversold, neutral or overbought category. The graph below
shows that equities are entering the overbought stage.

The surge in equities has caused the xcb.to bond fund to drop in price and fall below its 50
day moving average recently. I took this opportunity to put roughly 50% of my cash into
xcb.to. This is a great place to store your cash while you wait for a buying opportunity. It
pays roughly 4.2% in yield via monthly dividends. In addition, when markets drop, the
value of xcb.to goes up. This ETF is a great way to achieve a decent return while you wait
for an equity buying opportunity in a relatively safe manner. You can make this strategy
even safer by implementing a Stop Limit close to your purchase price to protect yourself
further from any unforeseen events. The graph below shows where I bought xcb.to. If it
drops under its 50 day moving average again I will continue to buy more. There were many
folks in the LTI network who moved some of their cash into this fund via my direction. I
estimate that the LTI network invested between $125K and $200K in xcb.to during the
period highlighted in green. I am hoping it drops below this level again so I can move
another large chunk of my cash into this fund.

GLOBAL ECONOMIC UPDATE
Fundamentally the global economy is weak and is slowing in many parts of the
world. Central banks continue to print more money, buy bonds in order to back stop major
risks and continue to kick the can down the road further. Meanwhile stock markets continue
to climb.
France continues to struggle
according to their Total Production
Index.
France’s Producer Price Index year
over year is on the decline.
Germany’s business
climate is deteriorating.

Germany’s production is
starting to stagnate and the
year over year is turning
negative.
China’s economy is
showing continued
signs of weakness.
US Velocity of M2 Money Stock has
been decelerating; a sign of
economic weakness.
US Velocity of M2 Money Stock
1.5
1.6
1.7
1.8
1.9
2.0
2.1
2.2
Jan-
70
Jan-
73
Jan-
76
Jan-
79
Jan-
82
Jan-
85
Jan-
88
Jan-
91
Jan-
94
Jan-
97
Jan-
00
Jan-
03
Jan-
06
Jan-
09
Jan-
12
Ratio
Source: FREDltinvesting.com

Velocity of M1 Money
Supply is also showing the
same trend as the larger
M2 money supply.
As part of my research I have hundreds of economic indicators from the major
economies around the world. The general 30,000 foot view shows a global economy that is
slowing down. Some areas are in a recession, others are contracting and others, such as
the US are growing very mildly. This is a natural cycle so we should not be too worried. In
fact, I get excited when I see global economic weakness because this means a potential
buying opportunity in equities may occur in the medium term. From a longer term
perspective this is not a time to be buying into equities. You should be moving your
portfolio to a more defensive strategy and protecting any gains that you have achieved.
Here are LTI blog links to more information, data and graphs for the areas mentioned
above:
http://ltinvesting.com/france-economy/france-economy-ppi-retail-trade-and-production/
http://ltinvesting.com/us-economy/us-velocity-of-money-not-looking-good/
http://ltinvesting.com/us-economy/us-government-social-benefits-above-historical-average/
http://ltinvesting.com/us-economy/us-yield-curve-showing-slight-sign-of-economic-weakness/
http://ltinvesting.com/markets/update-on-germany-production-inflation-and-business-climate-index/
http://ltinvesting.com/china-economy/chinas-economy-continues-to-cool-off-and-contract/
http://ltinvesting.com/uncategorized/world-exports-index-shows-signs-contraction/
US Velocity of M1 Money Stock
4
5
6
7
8
9
10
11
Jan-
70
Jan-
73
Jan-
76
Jan-
79
Jan-
82
Jan-
85
Jan-
88
Jan-
91
Jan-
94
Jan-
97
Jan-
00
Jan-
03
Jan-
06
Jan-
09
Jan-
12
Ratio
Source: FREDltinvesting.com

SUMMARY
Here are the key takeaways from this month’s newsletter:
1. The LTI MacroScreening Tool is an easy and efficient way to help in deciding whether a
company is worth investing in. Remember these rules:
o Do not invest in a company that does not have retained earnings growth
o Do not invest in a company that has a Return on Equity < 12%
o Do not invest in a company with erratic net profit margins
o Do not invest in a company with flat or declining EPS growth
2. Dollar Cost Averaging is an extremely bad investment strategy doomed to average or
below average returns. Combine this with investing in a Mutual Fund and you have the
worst investment strategy out there. Since 2000, using a Dollar Cost Averaging
approach investing in mutual funds (a typical strategy of many people), you would have
a return of 3.3% as of September 2012. Pitiful. Meanwhile I have enjoyed a 26%
return employing a patient and disciplined strategy of buying the best companies at low
prices and basking in the glory of increasing dividends over time and capital
appreciation.
3. An RESP for your child’s education is one of the best savings tools available to
Canadians. If you put $2500 per year away in an RESP you will receive $500 from the
government for a return of 20%. Truly amazing! If you have kids you should be doing
everything in your power to put $2500 in an RESP per child. Make the necessary
sacrifices for the future of your children. It will pay off in a huge way down the road.
4. Stock markets are climbing on irrational exuberance and are starting to show signs of
overbought and topping conditions. I would not be buying any equities at this time.
5. The global economy continues to remain weak. Investing in equities at this time is not
recommended. A more defensive portfolio is required in order to protect your capital
from future risks. Placing Stop Limits on any stocks of companies you do not plan to
own forever is prudent. Moving money over into the xcb.to bond fund as it drops below
its 50 day moving average is a good place to store your cash while you wait for the next
buying opportunity.

LTI BOOK OF THE MONTH
Mary Buffett’s book Interpretation of Financial Statements is very good supporting
material for the section on stock screening and what to look for in a company which I wrote
about early in this newsletter. I highly recommend this book for any individual investor
interested in taking their knowledge one step further. This is a fairly simplified book on this
subject and one I highly recommend.
• Warren Buffet and the Interpretation of Financial Statements
• $18.17 on Amazon.com
• http://www.amazon.ca/Warren-Buffett-Interpretation-Financial-
Statements/dp/1416573186
Alain Roy, P.Eng, MBA Candidate CEO of LTI – Long Term Investing www.ltinvesting.com
Disclaimer: The content of this newsletter is to increase your financial intelligence and is
intended as general information only. Any action that you take as a result of this
information and analysis is ultimately your responsibility. I will not be held responsible for
any negative outcomes of any kind as a result of this information. Please use this
information responsibly. Consult your financial advisor before making any investment
decisions.