Embed Size (px)
DESCRIPTION
LSRCP Hatchery Steelhead Salmon River. LSRCP Steelhead Program Review July 20-21, 2012 Clarkston ,WA. Brian Leth and Carl Stiefel. Acknowledgments. Hatchery staffs Sawtooth Magic Valley Hagerman National Pahsimeroi Clearwater Dworshak IDFG M&E staff IDFG Regional staffs - PowerPoint PPT Presentation
Citation preview
LSRCP Hatchery Steelhead Salmon River
Brian Leth and Carl Stiefel
LSRCP Steelhead Program Review July 20-21, 2012
Clarkston ,WA
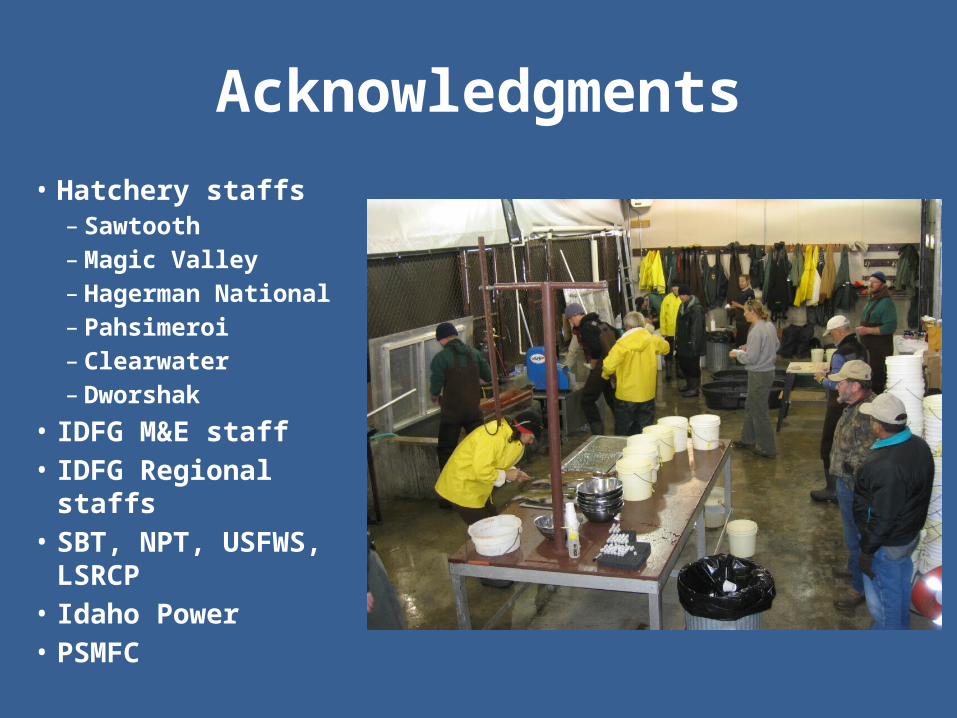
Acknowledgments
• Hatchery staffs– Sawtooth – Magic Valley– Hagerman National– Pahsimeroi– Clearwater– Dworshak
• IDFG M&E staff• IDFG Regional staffs• SBT, NPT, USFWS,
LSRCP • Idaho Power• PSMFC
ADD a PIC
Today’s Presentation
• IDFG Management Objectives • Status of Natural Populations• Management Framework - Salmon River• Mitigation Goals and Implementation • Broodstock History and Hatchery Program
Description• Production/Productivity and Harvest Data• Summary

IDFG Management Objectives for the Salmon River
–Restore and maintain natural populations in the Salmon River–Restore and maintain recreational and
tribal fisheries–Achieve LSRCP adult mitigation goals–Minimize impact of hatchery program on
natural populations
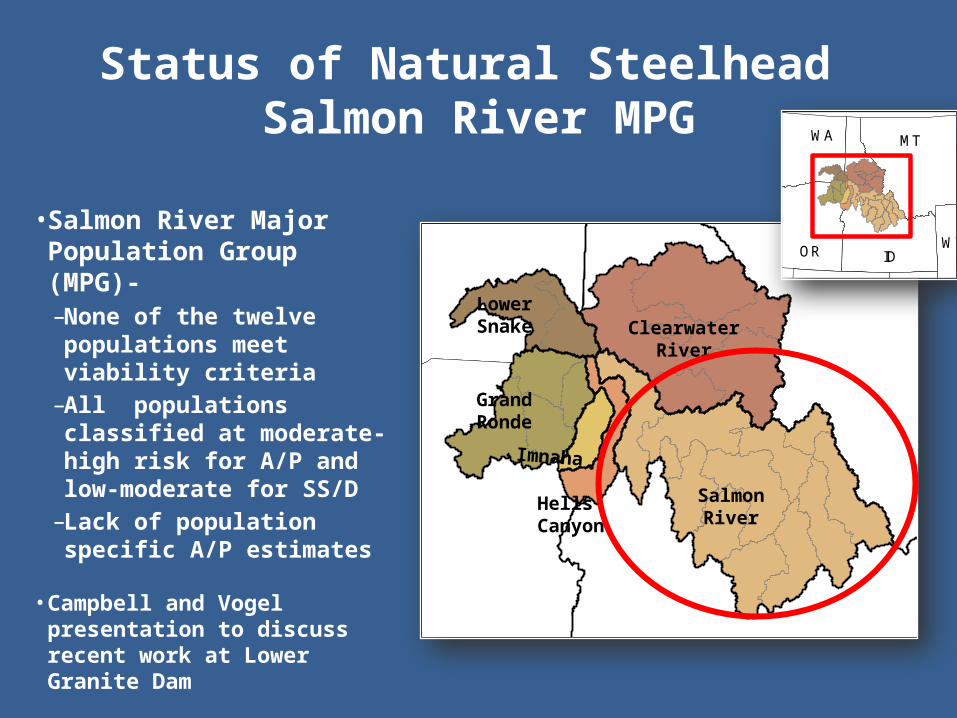
• Salmon River Major Population Group (MPG)- – None of the twelve
populations meet viability criteria
– All populations classified at moderate-high risk for A/P and low-moderate for SS/D
– Lack of population specific A/P estimates
• Campbell and Vogel presentation to discuss recent work at Lower Granite Dam
Status of Natural Steelhead Salmon River MPG
Add map of Snake River DPS and Highlight the -Salmon River MPG
!(!(
!(
!(
!(
!(
!(
!(
!(
!(!(
!(
!(
!(
!(
!(!(
!(!(
!(!(
!(!(
!(
!(!(
!(
!(
!(
!(
!(
!(
!(
!(!(
!(!(
!(
!(
!(
!(!(!(!(
!( !(!(
!(
!(
!(
!(
!( !(!(
!(
!(
!(!(
!(
!(
!(
!(!(
!(
!(
!(!(!(!(!(
Clearwater River
Grand Ronde
Lower Snake
Hells Canyon
Salmon River
MT
ID
NV
ORWY
WA
Imnaha
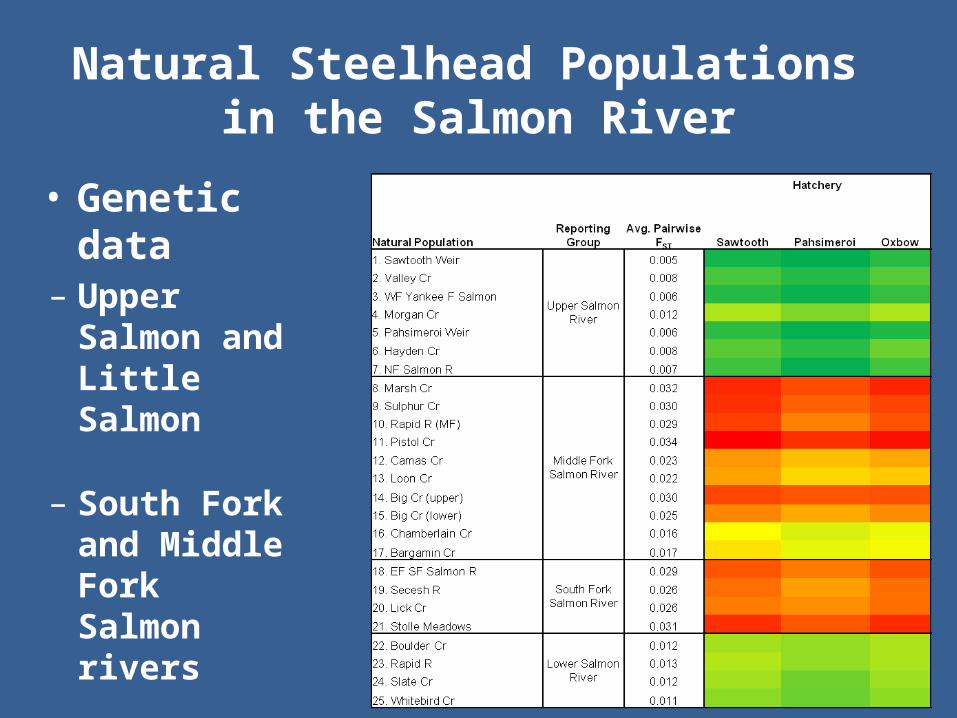
Natural Steelhead Populations in the Salmon River
• Genetic data– Upper Salmon
and Little Salmon
– South Fork and Middle Fork Salmon rivers
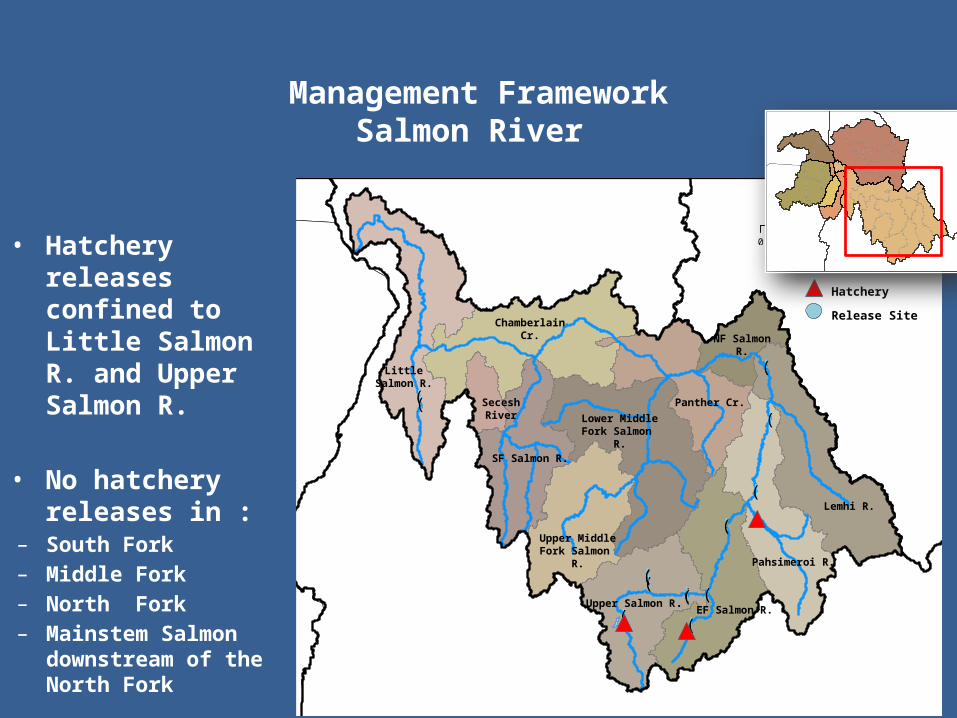
Management Framework
Salmon River
• Hatchery releases confined to Little Salmon R. and Upper Salmon R.
• No hatchery releases in :
– South Fork– Middle Fork– North Fork– Mainstem Salmon
downstream of the North Fork
Upper Middle Fork Salmon
!(!(
!(
!(
!(
!(
!(!(!(
!(
!(
!(
!(!(!(
²0 5025 Miles
Little Salmon R.
SF Salmon R.
Upper Salmon R.EF Salmon R.
Pahsimeroi R.
Lemhi R.
Lower Middle Fork Salmon R.
Panther Cr.
NF Salmon R.
Chamberlain Cr.
Secesh River
Hatchery
Release Site
!(!(
!(
!(
!(
!(
!(
!(
!(
!(!(
!(
!(
!(
!(
!(!(
!(!(
!(!(
!(!(
!(
!(!(
!(
!(
!(
!(
!(
!(
!(
!(!(
!(!(
!(
!(
!(
!(!(!(!(
!( !(!(
!(
!(
!(
!(
!( !(!(
!(
!(
!(!(
!(
!(
!(
!(!(
!(
!(
!(!(!(!(!(
Upper Middle Fork Salmon R.

Management Framework
Salmon River
• Hatchery releases confined to Little Salmon R. and Upper Salmon R.– both LSRCP and IPC
• No hatchery releases in :– South Fork– Middle Fork– North Fork– Mainstem Salmon
downstream of the North Fork
Upper Middle Fork Salmon
!(!(
!(
!(
!(
!(
!(!(!(
!(
!(
!(
!(!(!(
²0 5025 Miles
Little Salmon R.
SF Salmon R.
Upper Salmon R.EF Salmon R.
Pahsimeroi R.
Lemhi R.
Lower Middle Fork Salmon R.
Panther Cr.
NF Salmon R.
Chamberlain Cr.
Secesh River
Hatchery
Release Site
!(!(
!(
!(
!(
!(
!(
!(
!(
!(!(
!(
!(
!(
!(
!(!(
!(!(
!(!(
!(!(
!(
!(!(
!(
!(
!(
!(
!(
!(
!(
!(!(
!(!(
!(
!(
!(
!(!(!(!(
!( !(!(
!(
!(
!(
!(
!( !(!(
!(
!(
!(!(
!(
!(
!(
!(!(
!(
!(
!(!(!(!(!(
Upper Middle Fork Salmon R.
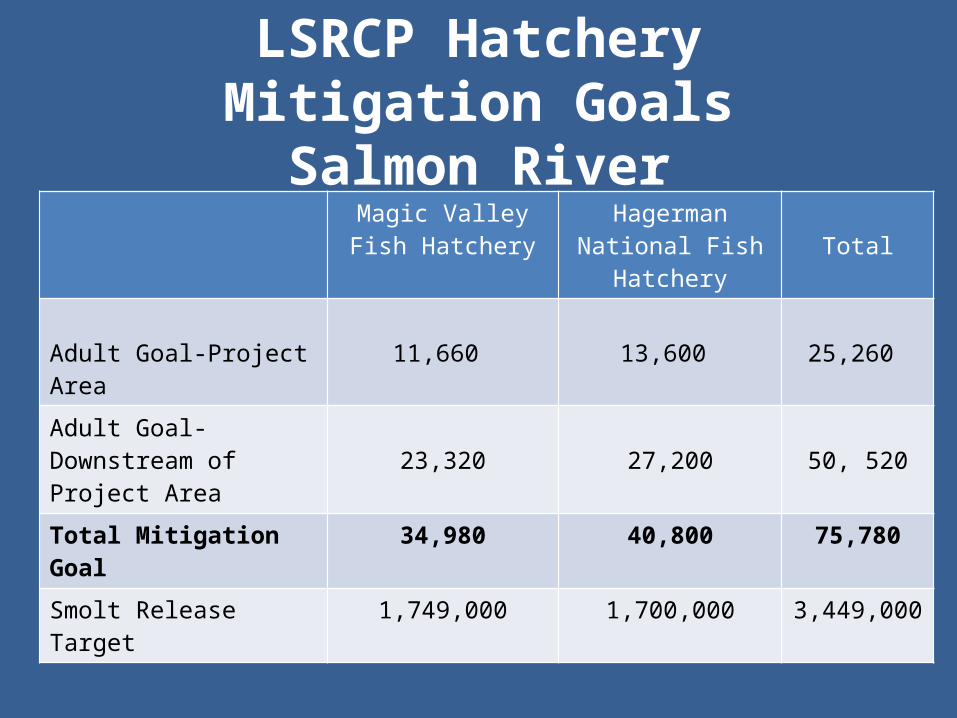
LSRCP Hatchery Mitigation GoalsSalmon River
Magic Valley Fish Hatchery
Hagerman National Fish Hatchery Total
Adult Goal-Project Area 11,660 13,600 25,260
Adult Goal-Downstream of Project Area 23,320 27,200 50, 520
Total Mitigation Goal 34,980 40,800 75,780
Smolt Release Target 1,749,000 1,700,000 3,449,000
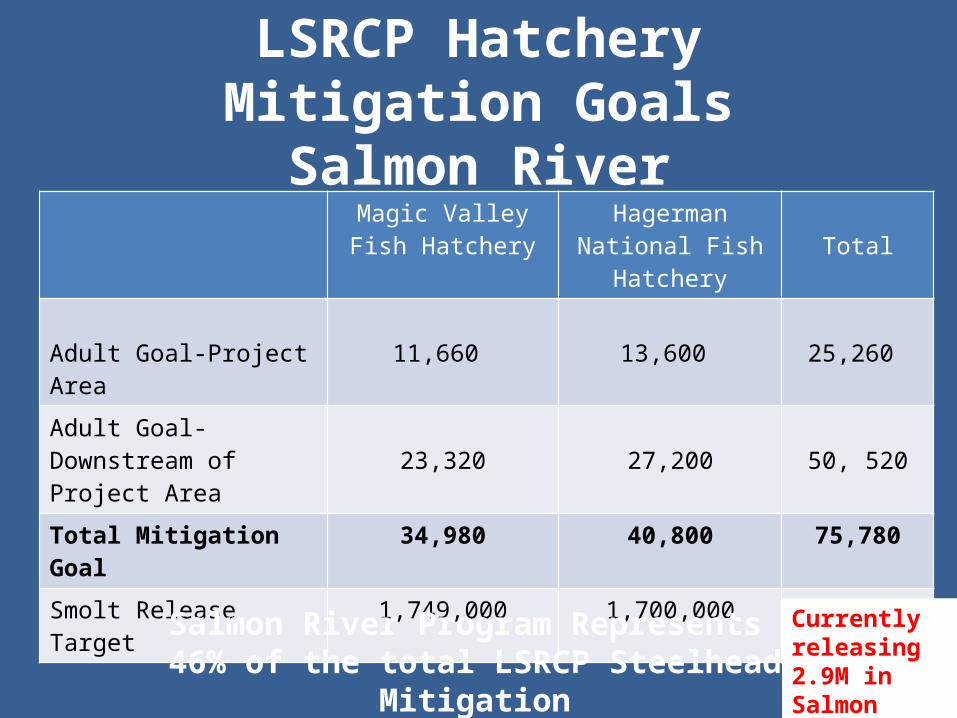
Salmon River Program Represents 46% of the total LSRCP Steelhead Mitigation
Currently releasing 2.9M in Salmon River
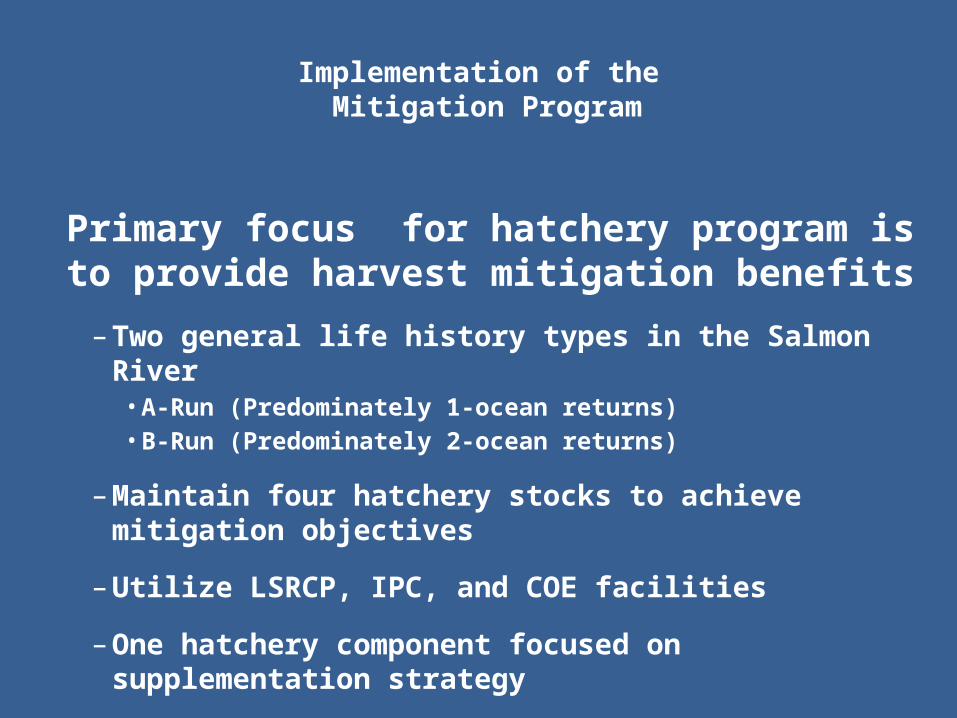
Implementation of the Mitigation Program
Primary focus for hatchery program is to provide harvest mitigation benefits
– Two general life history types in the Salmon River• A-Run (Predominately 1-ocean returns)• B-Run (Predominately 2-ocean returns)
– Maintain four hatchery stocks to achieve mitigation objectives
– Utilize LSRCP, IPC, and COE facilities
– One hatchery component focused on supplementation strategy

Salmon River Hatchery Broodstock History
• Snake River steelhead (Hells Canyon Dam) were transferred to Salmon River in 1966 at Pahsimeroi Fish Hatchery (PFH)- the PahA stock
• The locally adapted stock at PFH was extended to Sawtooth Fish Hatchery in 1984- the SawA stock
• B-run steelhead brought into the upper Salmon River (at PFH) from Dworshak Fish Hatchery in 1973- the DworB stock. – Transitioning to locally adapted B-run stock- the USRB stock
• East Fork Salmon River (EFSR)- the East Fork integrated stock. A history of both DworB and PahA hatchery releases in the EFSR

Description of Salmon River LSRCP Hatchery Steelhead Program
• Little Salmon A&B
• Upper Salmon A– Yankee Fork
• Upper Salmon B
• East Fork Salmon
415,000
1,580,00
0
735,000
170,000 Little Salmon R.
Upper Salmon A
Upper Salmon B
East Fork Salmon
HNFH- 1,360,000MVFH- 1,540,000LSRCP Total- 2,900,000
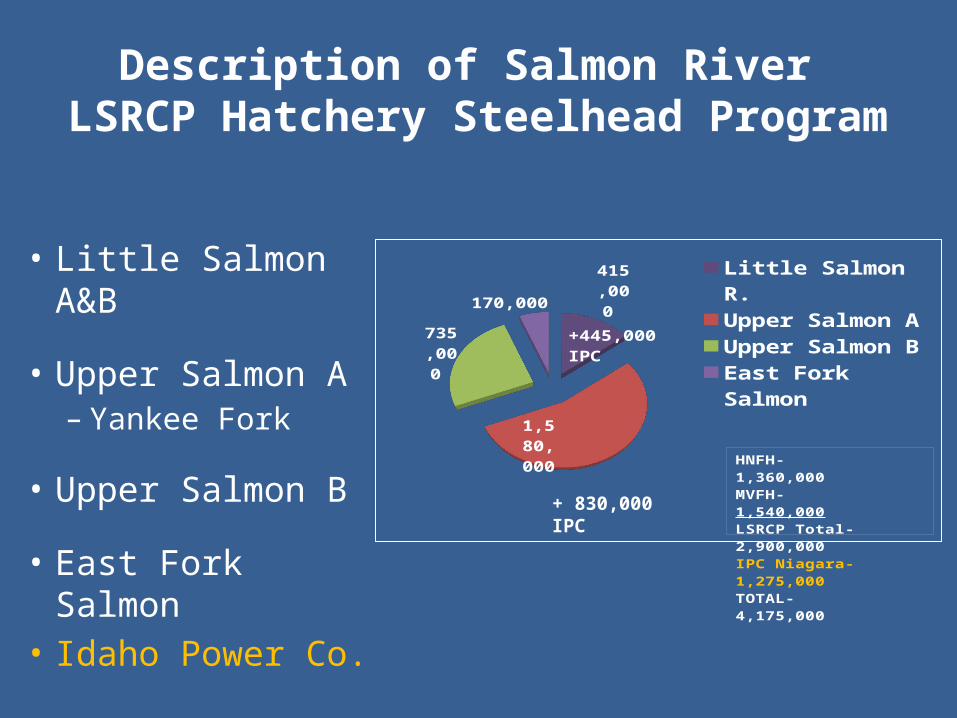
Description of Salmon River LSRCP Hatchery Steelhead Program
• Little Salmon A&B
• Upper Salmon A– Yankee Fork
• Upper Salmon B
• East Fork Salmon • Idaho Power Co.
415,000
1,580,00
0
735,000
170,000 Little Salmon R.
Upper Salmon A
Upper Salmon B
East Fork Salmon
HNFH- 1,360,000MVFH- 1,540,000LSRCP Total- 2,900,000IPC Niagara- 1,275,000TOTAL- 4,175,000
+445,000 IPC
+ 830,000 IPC
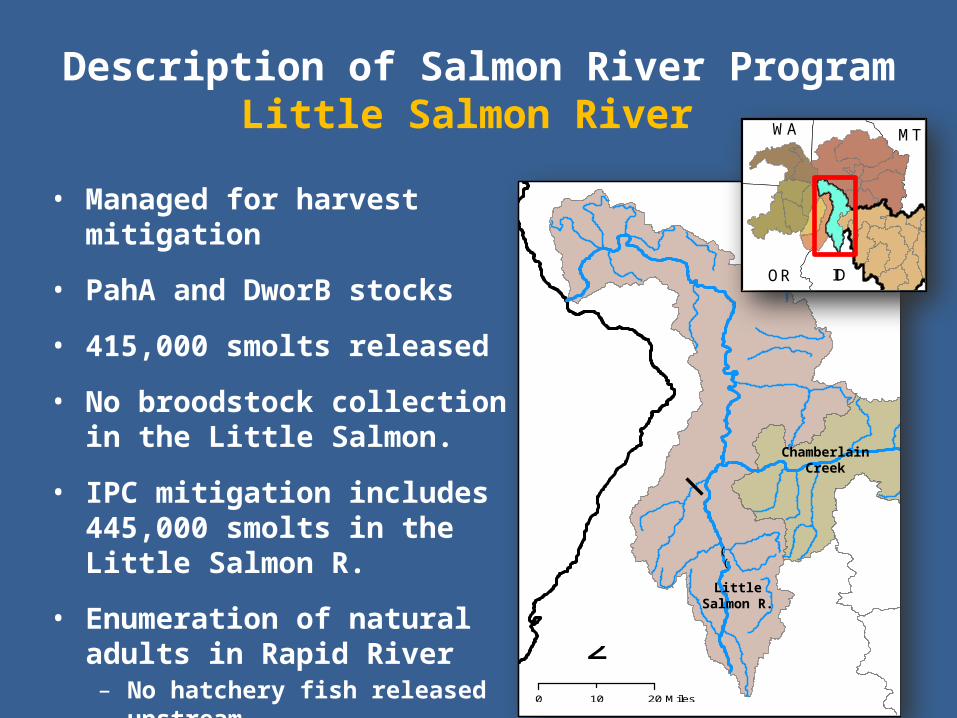
Description of Salmon River ProgramLittle Salmon River
• Managed for harvest mitigation
• PahA and DworB stocks
• 415,000 smolts released
• No broodstock collection in the Little Salmon.
• IPC mitigation includes 445,000 smolts in the Little Salmon R.
• Enumeration of natural adults in Rapid River– No hatchery fish released upstream
Show a map of releases
!(!(
0 2010 Miles
²
Little Salmon R.
Chamberlain Creek
OR ID
MTWA

Hatchery
Release Site
Description of Salmon River ProgramUpper Salmon A-Run
• Managed for harvest mitigation
• Includes both SawA and PahA stocks
• All broodstock is collected at Pahsimeroi and Sawtooth fish hatcheries
• 1,140,000 smolts in USR 440,000 smolts in Yankee Fork 1,580,000
• IPC Mitigation includes 830,000 PahA smolts
OR ID
MTWA
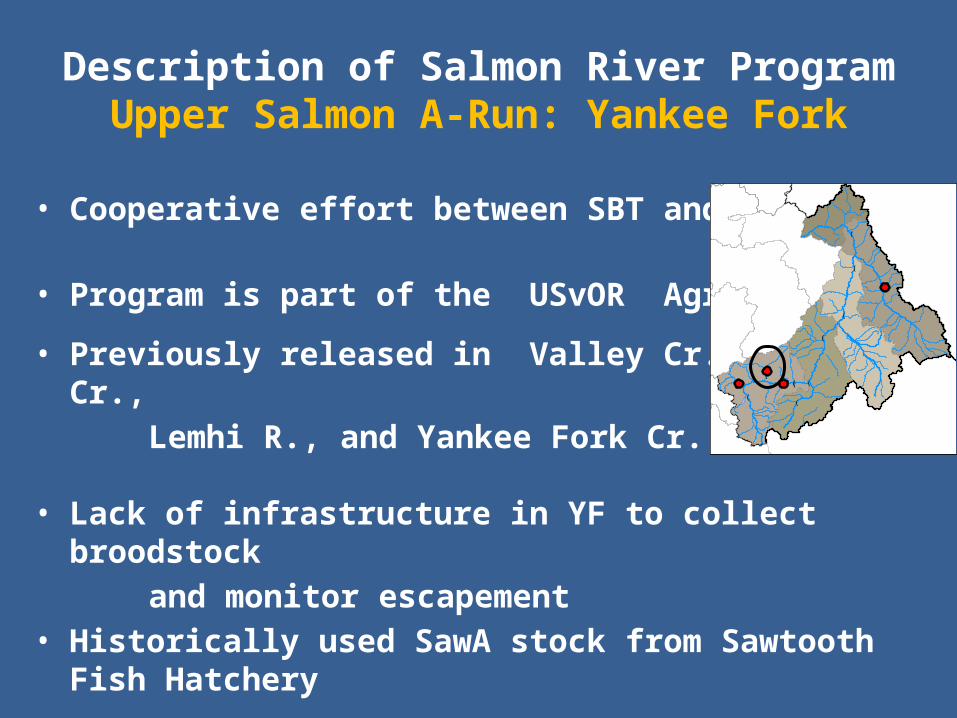
Description of Salmon River Program Upper Salmon A-Run: Yankee Fork
• Cooperative effort between SBT and IDFG
• Program is part of the USvOR Agreement
• Previously released in Valley Cr., Slate Cr., Lemhi R., and Yankee Fork Cr.
• Lack of infrastructure in YF to collect broodstock and monitor escapement• Historically used SawA stock from Sawtooth Fish Hatchery
!(
!(
!(
!(
!(!(
!(
!(
!(
!(
!(!(!(
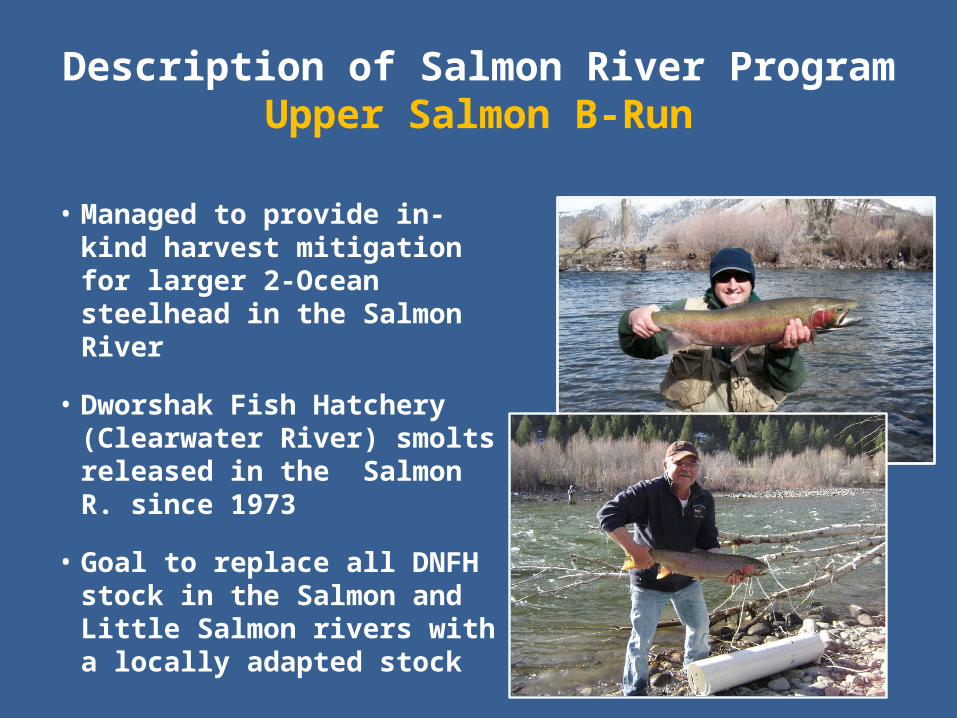
• Managed to provide in-kind harvest mitigation for larger 2-Ocean steelhead in the Salmon River
• Dworshak Fish Hatchery (Clearwater River) smolts released in the Salmon R. since 1973
• Goal to replace all DNFH stock in the Salmon and Little Salmon rivers with a locally adapted stock
Description of Salmon River ProgramUpper Salmon B-Run
Description of Salmon River ProgramUpper Salmon B-Run
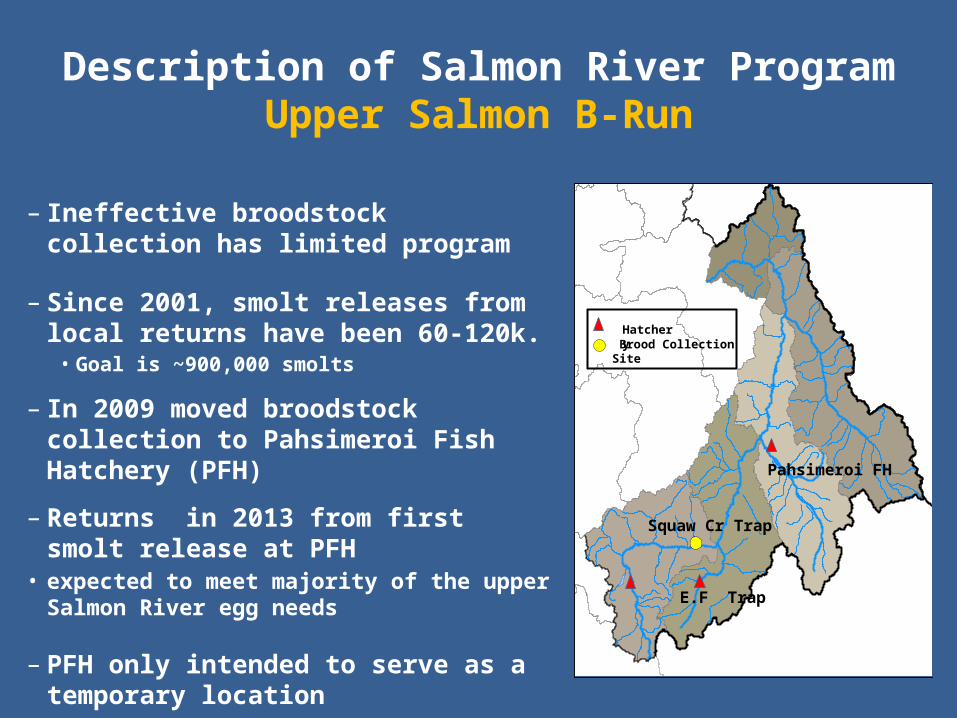
– Ineffective broodstock collection has limited program
– Since 2001, smolt releases from local returns have been 60-120k.• Goal is ~900,000 smolts
– In 2009 moved broodstock collection to Pahsimeroi Fish Hatchery (PFH)
– Returns in 2013 from first smolt release at PFH
• expected to meet majority of the upper Salmon River egg needs
– PFH only intended to serve as a temporary location
Hatchery Brood Collection Site
Pahsimeroi FH
Squaw Cr Trap
E.F Trap
Description of Salmon River ProgramUpper Salmon B-Run
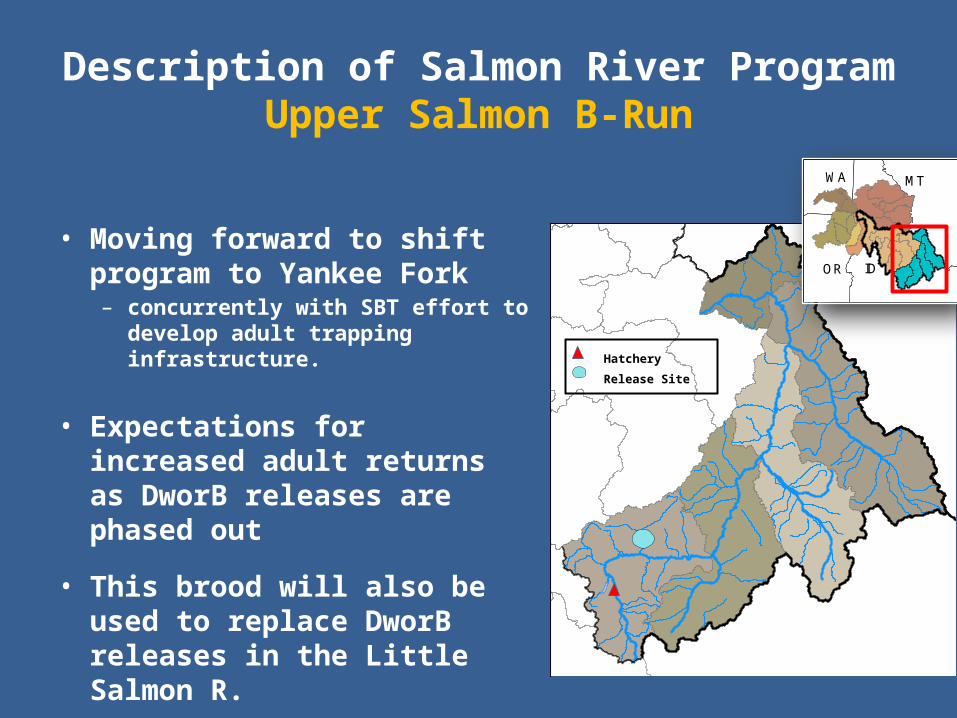
• Moving forward to shift program to Yankee Fork– concurrently with SBT effort to develop
adult trapping infrastructure.
• Expectations for increased adult returns as DworB releases are phased out
• This brood will also be used to replace DworB releases in the Little Salmon R.
Hatchery
Release Site
OR ID
MTWA

Description of Salmon River ProgramsEast Fork Salmon River
• Operated as a conservation program– initiated in 2001, with the intent to increase
natural returns.
• Integrated broodstock
• 170,000 smolt release
• Spawning and rearing habitat in EF downstream of the EF weir.
• Currently limited to monitoring adult escapement at EF weir.
• Identified need to develop trapping site lower in the system (FCRPS Biop RPA 42; HSRG, HRT, and HGMP)
Put in EF Map
OR ID
MTWA
Hatchery Release Site
East Fork Salmon River
Upper Salmon River Mainstem
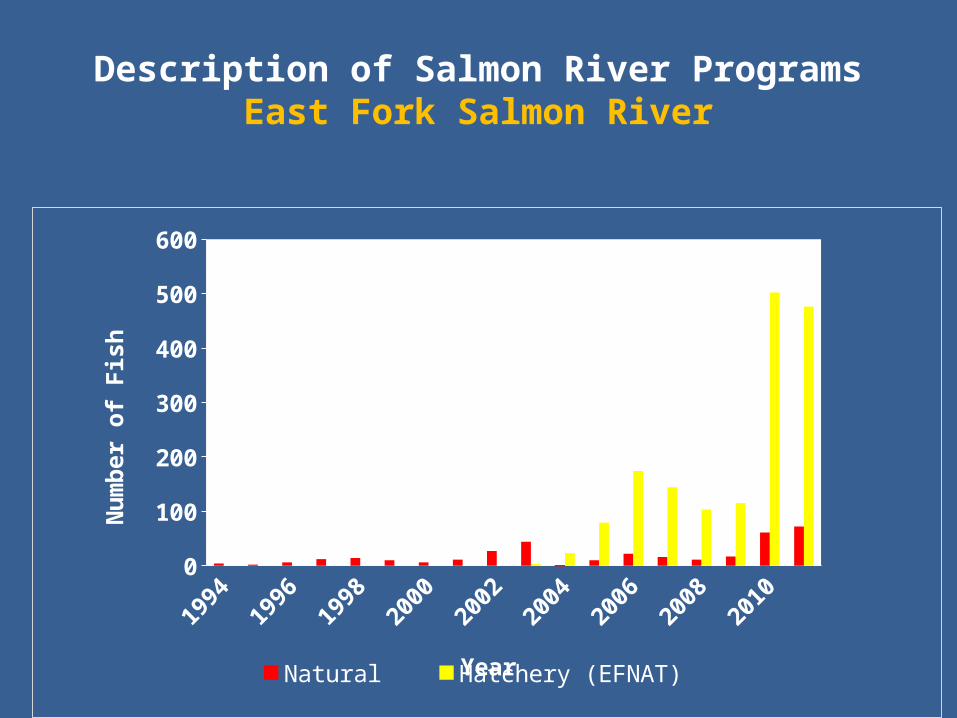
Description of Salmon River ProgramsEast Fork Salmon River
19941995
19961997
19981999
20002001
20022003
20042005
20062007
20082009
20102011
0
100
200
300
400
500
600
Natural Hatchery (EFNAT)Year
Num
ber o
f Fis
h

Description of Salmon River ProgramsEast Fork Salmon River
Program Limitations and Future Direction
- Inability to assess or control escapement in the EFSR- Absolute need
- Develop effective trapping facility in lower EFSR
- Reducing the size of the hatchery program (40-60k) - More influence from natural population- Target 100% natural broodstock- No restriction on hatchery returns released to spawn
naturally
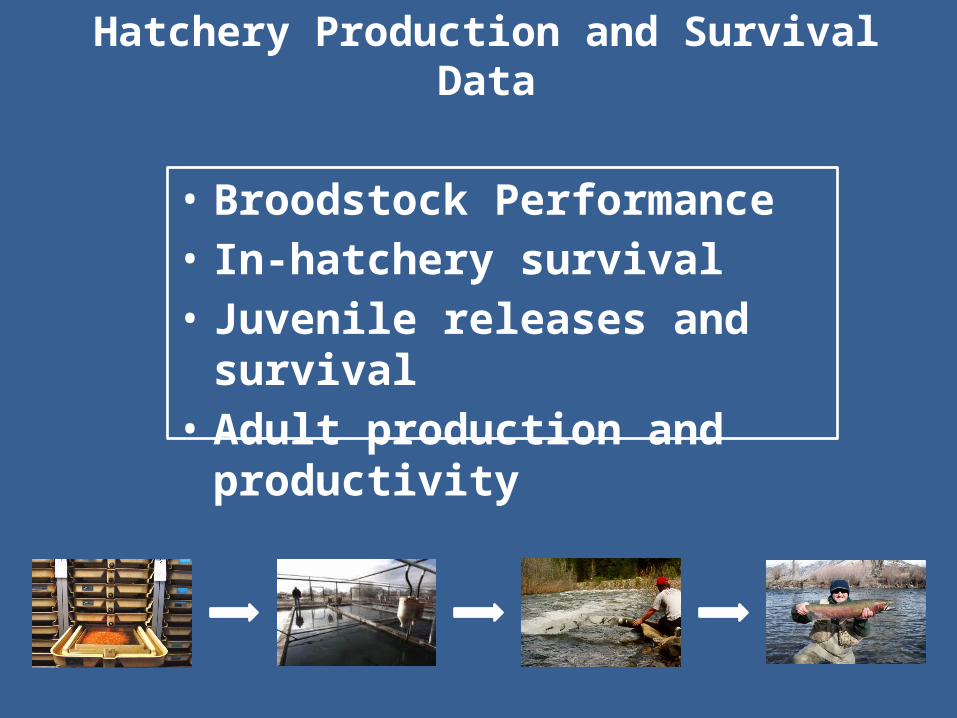
Hatchery Production and Survival Data
• Broodstock Performance• In-hatchery survival• Juvenile releases and survival• Adult production and productivity
Hatchery Production and Survival
• Incubation and Rearing occurs at: – Magic Valley Fish Hatchery (IDFG)– Hagerman National Fish Hatchery (USFWS)
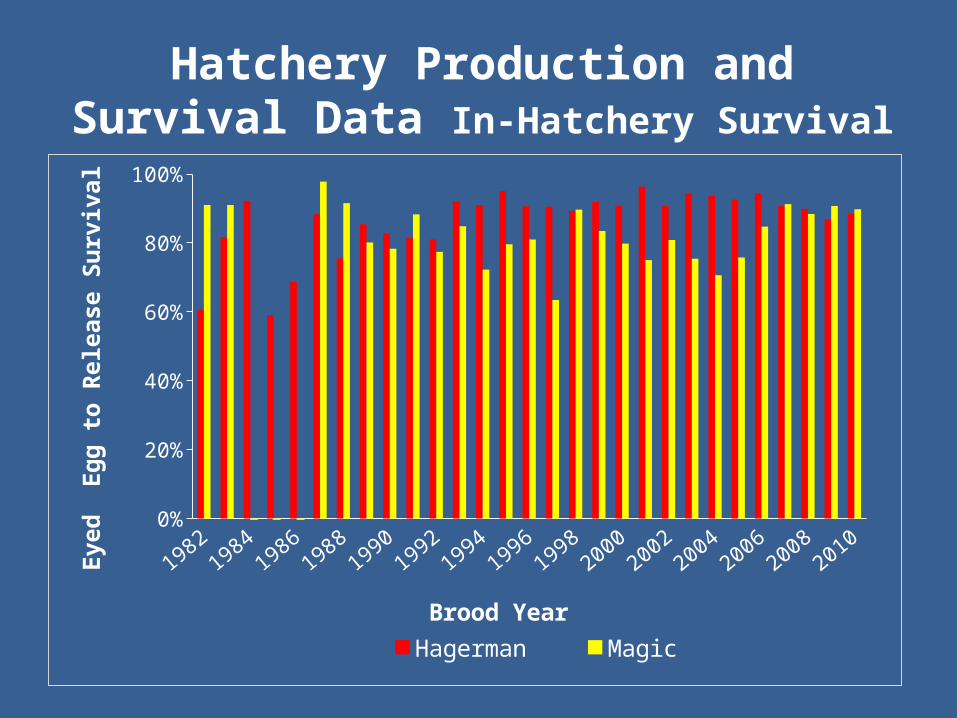
Hatchery Production and Survival Data In-Hatchery Survival
19821984
19861988
19901992
19941996
19982000
20022004
20062008
20100%
20%
40%
60%
80%
100%
Hagerman Magic
Brood Year
Eyed
Egg
to R
elea
se S
urvi
val
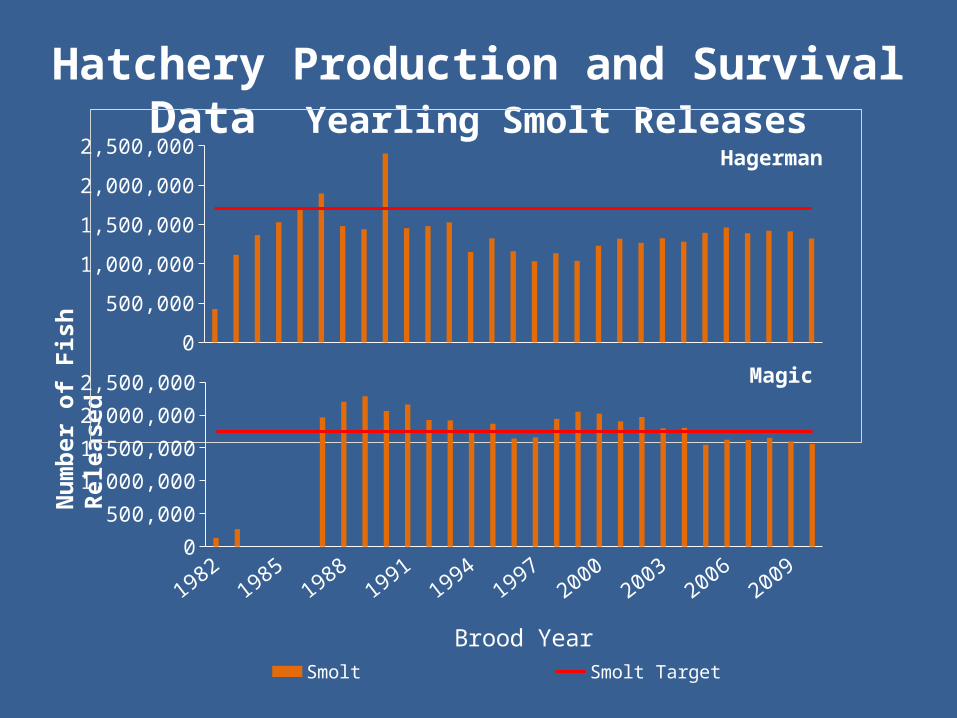
Hatchery Production and Survival Data Yearling Smolt Releases
Num
ber o
f Fis
h Re
leas
ed
Magic
Hagerman
0
500,000
1,000,000
1,500,000
2,000,000
2,500,000
19821984
19861988
19901992
19941996
19982000
20022004
20062008
20100
500,000
1,000,000
1,500,000
2,000,000
2,500,000
Smolt Smolt Target
Brood Year
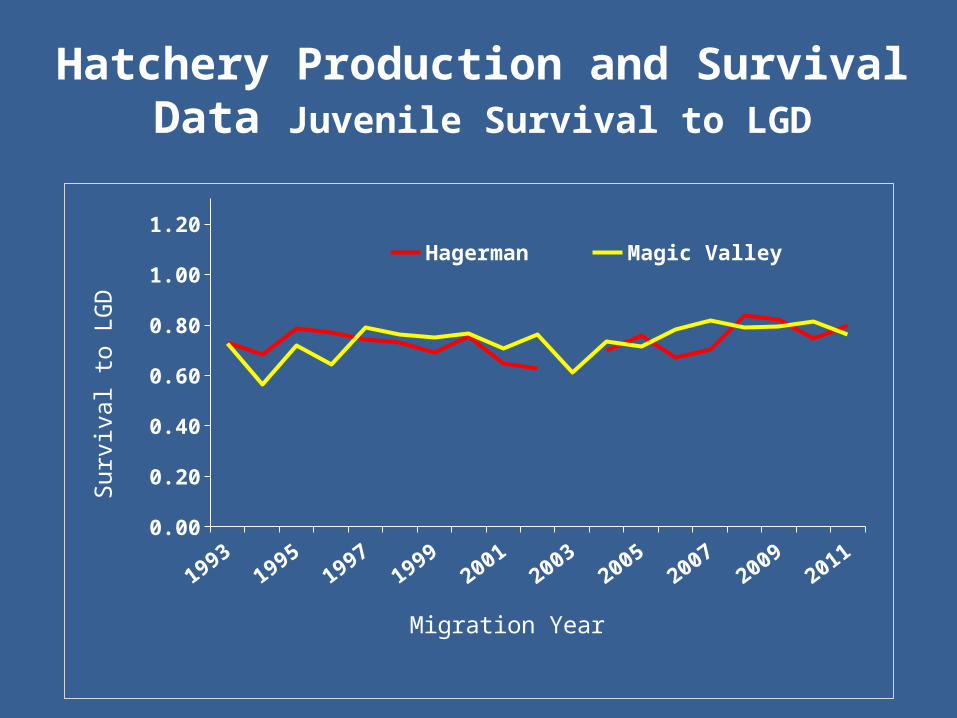
Hatchery Production and Survival Data Juvenile Survival to LGD
19931995
19971999
20012003
20052007
20092011
0.00
0.20
0.40
0.60
0.80
1.00
1.20Hagerman Magic Valley
Migration Year
Surv
ival
to L
GD
Fish Health/Disease
• Overall, disease has not limited the ability to meet smolt production targets
• Hagerman National Fish Hatchery– In Recent Years: Furunculosis, Sore back, Coldwater
Disease– In Past years: IHN, and Bacterial gill disease– DworB stock was problematic
• Magic Valley Fish Hatchery– Coldwater Disease and IHN

Adult Returns-Total Adults ProducedN
umbe
r of F
ish -
10,000 20,000 30,000 40,000 50,000 60,000
Hagerman National FH
1984-85
1986-87
1988-89
1990-91
1992-93
1994-95
1996-97
1998-99
2000-01
2002-03
2004-05
2006-07
2008-09
2010-11 -
10,000
20,000
30,000
40,000
50,000 Magic Valley FH
Adult Returns Return Goal
Run Year
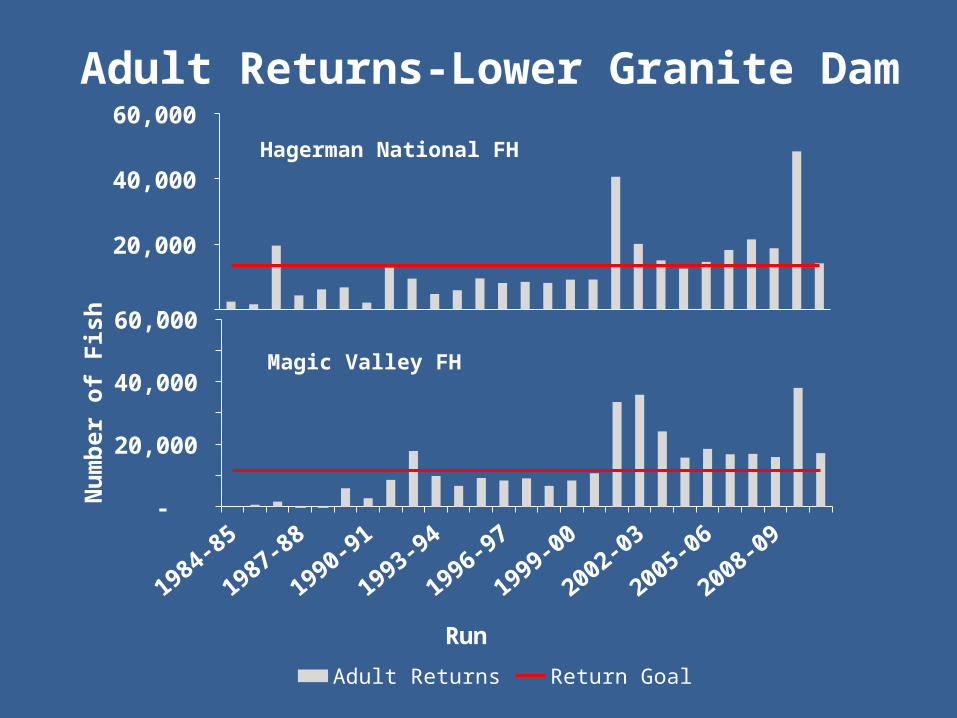
Adult Returns-Lower Granite DamN
umbe
r of F
ish
- 10,000 20,000 30,000 40,000 50,000 60,000
Hagerman National FH
1984-85
1986-87
1988-89
1990-91
1992-93
1994-95
1996-97
1998-99
2000-01
2002-03
2004-05
2006-07
2008-09
2010-11 -
10,000 20,000 30,000 40,000 50,000 60,000
Magic Valley FH
Adult Returns Return Goal
Run
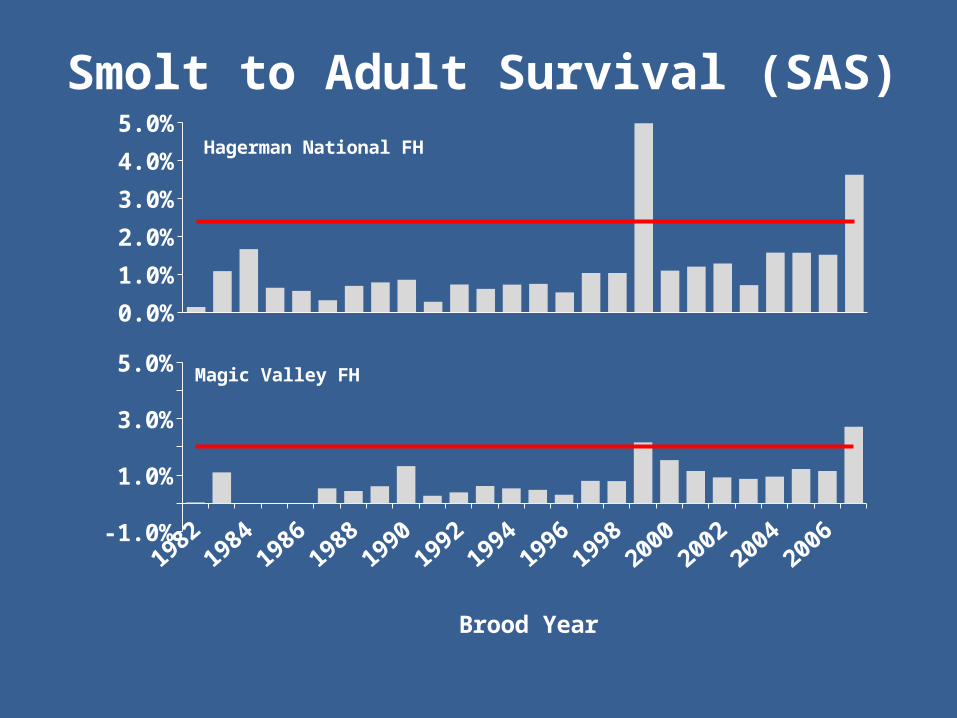
Smolt to Adult Survival (SAS)
0.0%
1.0%
2.0%
3.0%
4.0%
5.0%Hagerman National FH
19821984
19861988
19901992
19941996
19982000
20022004
2006-1.0%0.0%1.0%2.0%3.0%4.0%5.0% Magic Valley FH
SAS SAS (Assumed)
Brood Year
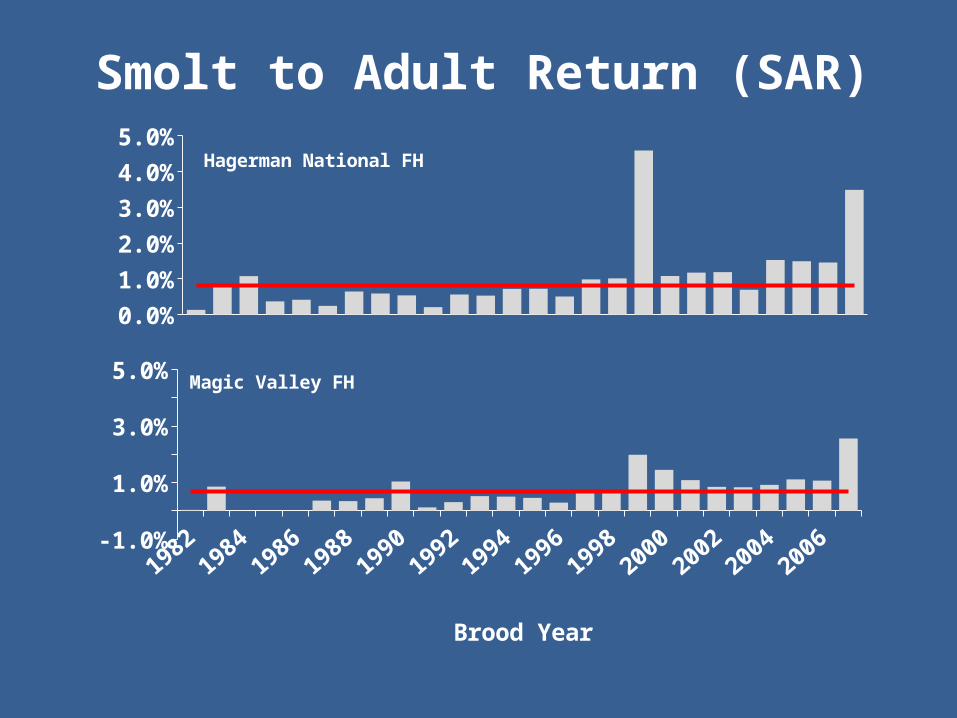
Smolt to Adult Return (SAR)
0.0%1.0%2.0%3.0%4.0%5.0%
Hagerman National FH
19821984
19861988
19901992
19941996
19982000
20022004
2006-1.0%0.0%1.0%2.0%3.0%4.0%5.0% Magic Valley FH
SAR SAR (Assumed)
Brood Year

Harvest and Escapement
• Harvest and Effort• Fishing Opportunity• Strays

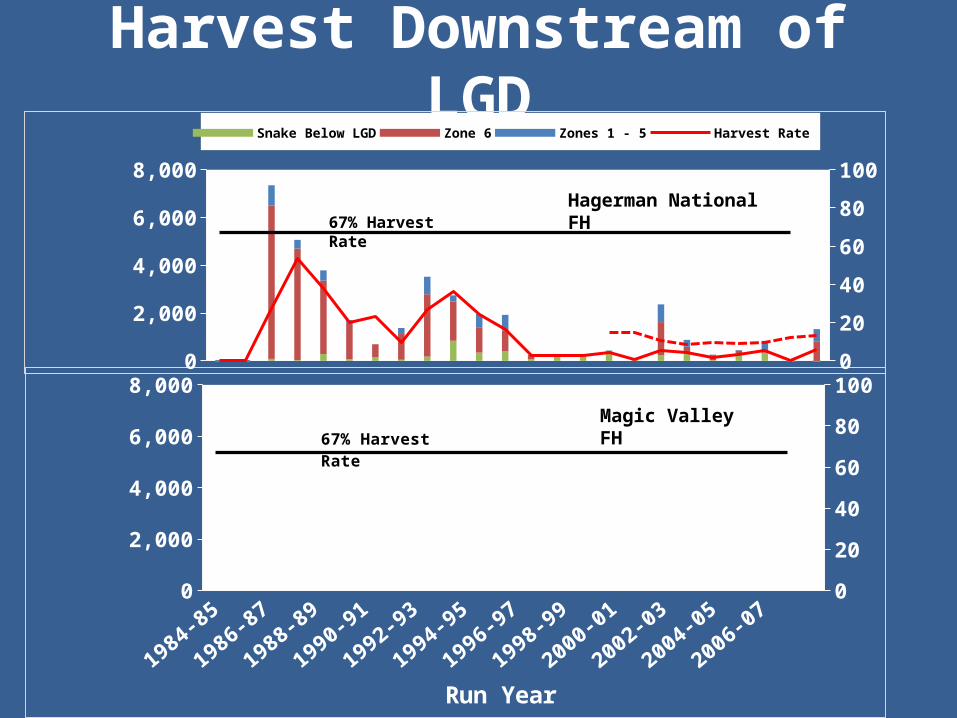
Harvest Downstream of LGD
1984-85
1986-87
1988-89
1990-91
1992-93
1994-95
1996-97
1998-99
2000-01
2002-03
2004-05
2006-070
2,000
4,000
6,000
8,000
0
20
40
60
80
100
Run Year
67% Harvest Rate
0
2,000
4,000
6,000
8,000
0
20
40
60
80
100
Snake Below LGD Zone 6 Zones 1 - 5 Harvest Rate
Hagerman National FH
Magic Valley FH
67% Harvest Rate
Harvest Downstream of LGD
1984-85
1986-87
1988-89
1990-91
1992-93
1994-95
1996-97
1998-99
2000-01
2002-03
2004-05
2006-070
2,000
4,000
6,000
8,000
0
20
40
60
80
100
Run Year
67% Harvest Rate
0
2,000
4,000
6,000
8,000
0
20
40
60
80
100
Snake Below LGD Zone 6 Zones 1 - 5 Harvest RateZones 1-6
Hagerman National FH
Magic Valley FH
67% Harvest Rate

Harvest Upstream of LGDN
umbe
r of F
ish
05,000
10,00015,00020,00025,00030,00035,000
0
20
40
60
80
100Hagerman National FH
1986-87
1988-89
1990-91
1992-93
1994-95
1996-97
1998-99
2000-01
2002-03
2004-05
2006-07
2008-09
2010-110
5,00010,00015,00020,00025,00030,00035,000
0
20
40
60
80
100
Tribal Harvest Harvest rateRun
Magic Valley FH
Harvest Rate (%
)

Harvest Opportunity
Salmon River
• Salmon and Little Salmon rivers
• 410 miles open to fishing in the Salmon and Little Salmon rivers
• 270 days open to fishing
• South Fork, Middle Fork Salmon rivers and Salmon R. tributaries
• Closed to fishing
Upper Middle Fork Salmon
!(!(
!(
!(
!(
!(
!(!(!(
!(
!(
!(
!(!(!(
²0 5025 Miles
Little Salmon
R.
SF Salmon R.
Upper Mainstem Salmon R.
EF Salmon R.
Pahsimeroi R.
Lemhi R.
Lower Middle Fork Salmon
R.
Panther Cr.
NF Salmon R.
Chamberlain Cr.
Secesh River
Hatchery
Release Site
!(!(
!(
!(
!(
!(
!(
!(
!(
!(!(
!(
!(
!(
!(
!(!(
!(!(
!(!(
!(!(
!(
!(!(
!(
!(
!(
!(
!(
!(
!(
!(!(
!(!(
!(
!(
!(
!(!(!(!(
!( !(!(
!(
!(
!(
!(
!( !(!(
!(
!(
!(!(
!(
!(
!(
!(!(
!(
!(
!(!(!(!(!(
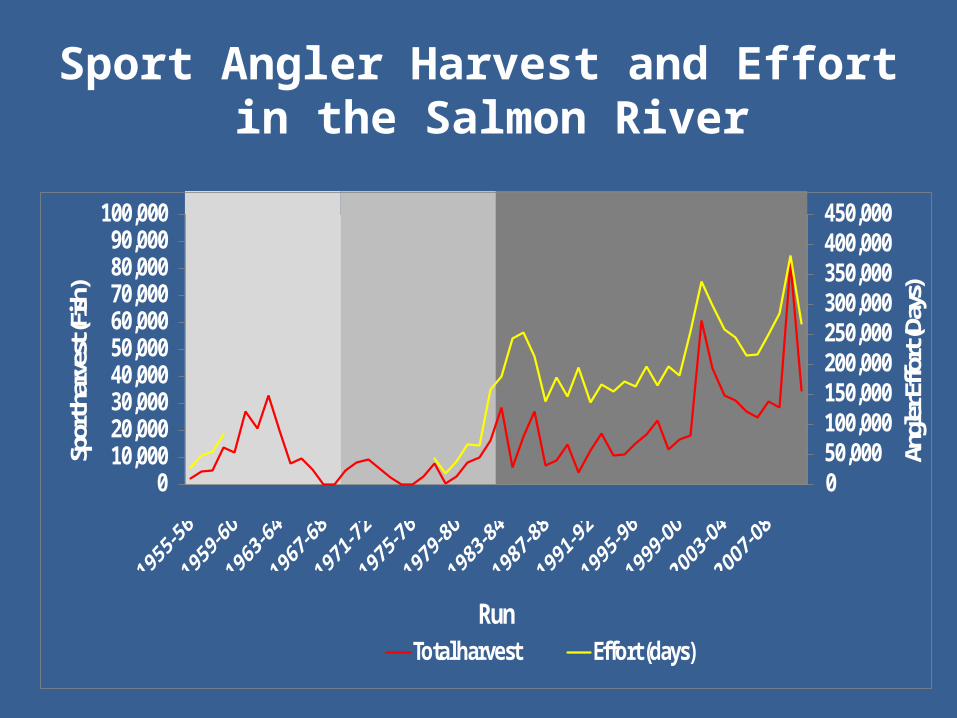
Sport Angler Harvest and Effort in the Salmon River
050,000100,000150,000200,000250,000300,000350,000400,000450,000
010,00020,00030,00040,00050,00060,00070,00080,00090,000
100,000
Angle
r Effo
rt (D
ays)
Spor
t har
vest
(Fish
)
RunTotal harvest Effort (days)
Pre-Hatchery Mitigation
IPCHatchery
Mitigation
IPC & LSRCPHatchery
Mitigation

Estimated Stray Rate
19821984
19861988
19901992
19941996
19982000
20022004
20062008
20100%
10%
20%
30%
40%
50%Magic
Brood Year
0%
10%
20%
30%
40%
50%Hagerman
Above LGD Below LGD
Stra
y Ra
te
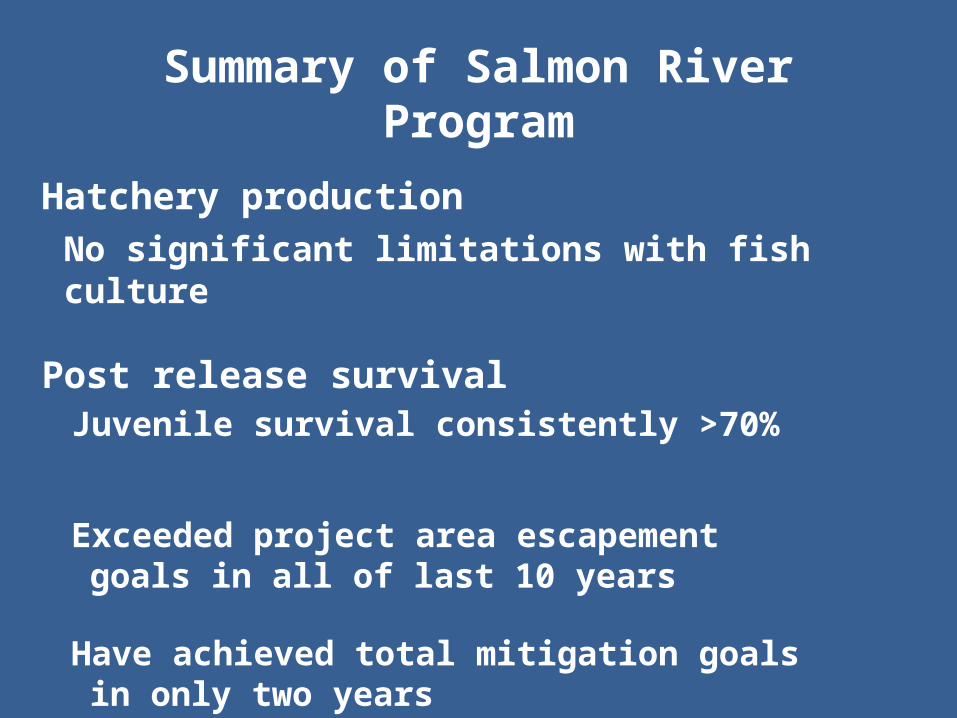
Summary of Salmon River Program
Hatchery productionNo significant limitations with fish culture
Post release survivalJuvenile survival consistently >70%
Exceeded project area escapement goals in all of last 10 years
Have achieved total mitigation goals in only two years
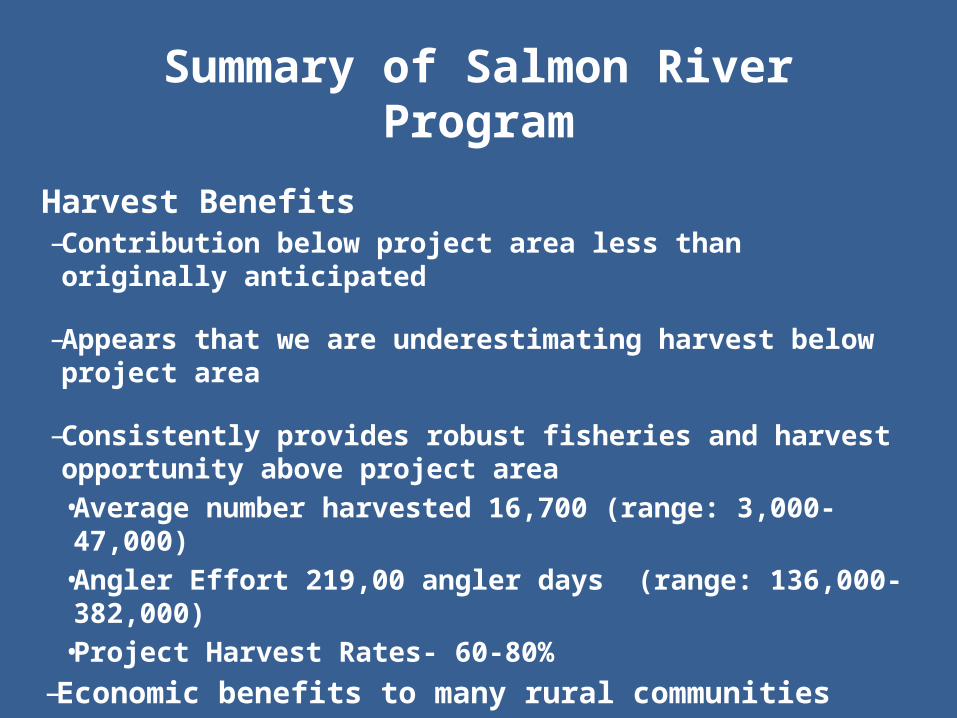
Summary of Salmon River Program
Harvest Benefits– Contribution below project area less than originally
anticipated
– Appears that we are underestimating harvest below project area
– Consistently provides robust fisheries and harvest opportunity above project area• Average number harvested 16,700 (range: 3,000-47,000)• Angler Effort 219,00 angler days (range: 136,000-382,000)• Project Harvest Rates- 60-80%
– Economic benefits to many rural communities
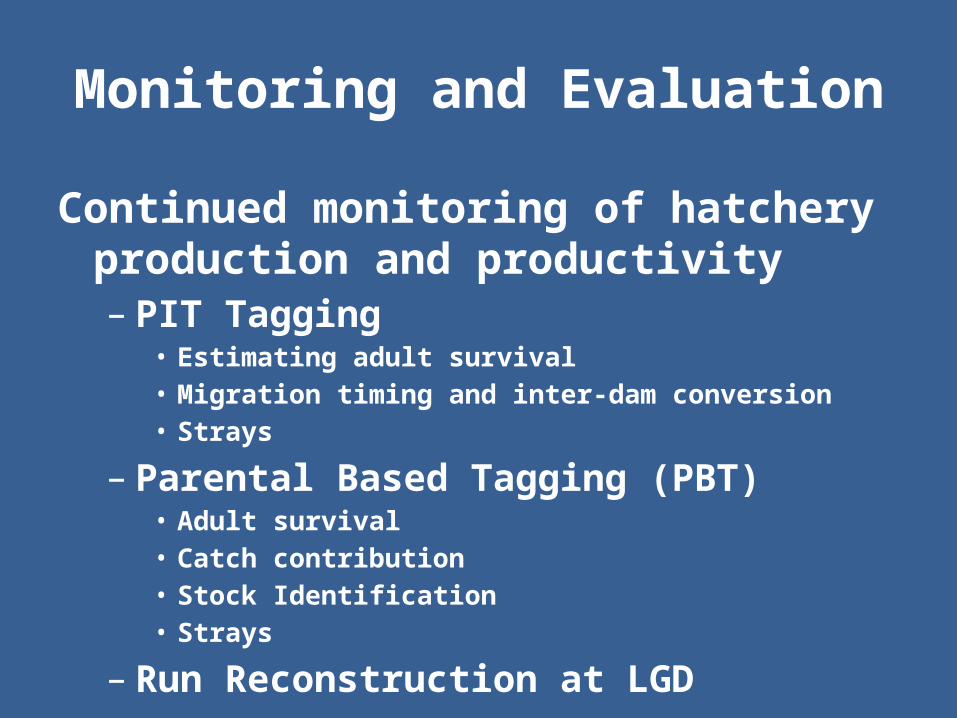
Monitoring and Evaluation
Continued monitoring of hatchery production and productivity– PIT Tagging
• Estimating adult survival• Migration timing and inter-dam conversion• Strays
– Parental Based Tagging (PBT)• Adult survival• Catch contribution• Stock Identification• Strays
– Run Reconstruction at LGD
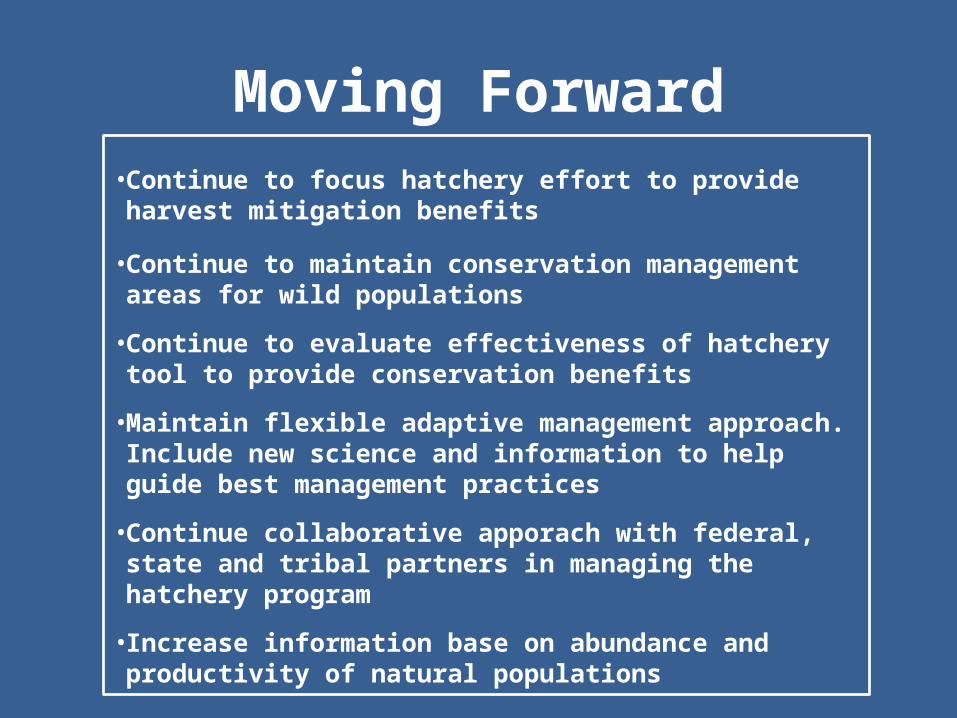
Moving Forward• Continue to focus hatchery effort to provide harvest
mitigation benefits
• Continue to maintain conservation management areas for wild populations
• Continue to evaluate effectiveness of hatchery tool to provide conservation benefits
• Maintain flexible adaptive management approach. Include new science and information to help guide best management practices
• Continue collaborative apporach with federal, state and tribal partners in managing the hatchery program
• Increase information base on abundance and productivity of natural populations

Questions?