Embed Size (px)
Citation preview

V o l u m e 1 0 3 A r t i c l e 0 5
EVALUATION OF THE HATCHERY-WILD COMPOSITIONOF IDAHO SALMON AND STEELHEAD HARVEST
October 1, 1992 to December 31, 1993
By:
Kent Ball, Senior Fishery Research Biologist
IDFG 96-9
April 1996

TABLE OF CONTENTSPaqe
ABSTRACT .................................................................. 1
OBJECTIVES ................................................................ 2
INTRODUCTION .............................................................. 2
DESCRIPTION OF STUDY AREA ................................................. 4
METHODS ................................................................... 4
Creel Survey ......................................................... 4Interview Schedule ............................................. 4
Data Analysis ........................................................ 7Tributary Straying ................................................... 8
RESULTS ................................................................... 8
DISCUSSION ............................................................... 33
CONTENTS i
Harvest of Sawtooth Hatchery Releases ............................... 33Harvest of East Fork Salmon River Releases .......................... 33Harvest of Little Salmon River Releases ............................. 35Harvest of Hammer Creek Releases .................................... 35Harvest of Clearwater River Releases ................................ 35Off-site Releases ................................................... 35Hatchery Straying ................................................... 36Tributary Straying .................................................. 37Sources of Error .................................................... 37
RECOMMENDATIONS .......................................................... 38
ACKNOWLEDGEMENTS ......................................................... 39
LITERATURE CITED ......................................................... 40
APPENDICES ............................................................... 41
LIST OF TABLES
Table 1. Steelhead season dates, bag limits, and specialrestrictions for the Clearwater, Salmon and Snakerivers, 1992-93 ................................................ 3
Table 2. River location codes for Idaho's anadromousfisheries ...................................................... 6
Table 3. Steelhead fishery interview data (unexpanded) fromlower Snake River (01), September - December 1992 . . . . 10
Table 4. Steelhead fishery interview data (unexpanded) from lowerClearwater River (03) and North ForkClearwater River (05), September 1992 - April 1993 . . . 11
Table 5. Steelhead fishery interview data (unexpanded) from upperClearwater and Middle Fork Clearwaterrivers (04), October 1992 - April 1993 ........................ 12

ii
LIST OF TABLES (Cont.)
Paqe
Table 6. Steelhead fishery interview data (unexpanded) fromSouth Fork Clearwater River (07), February -April 1993 ..............................................13
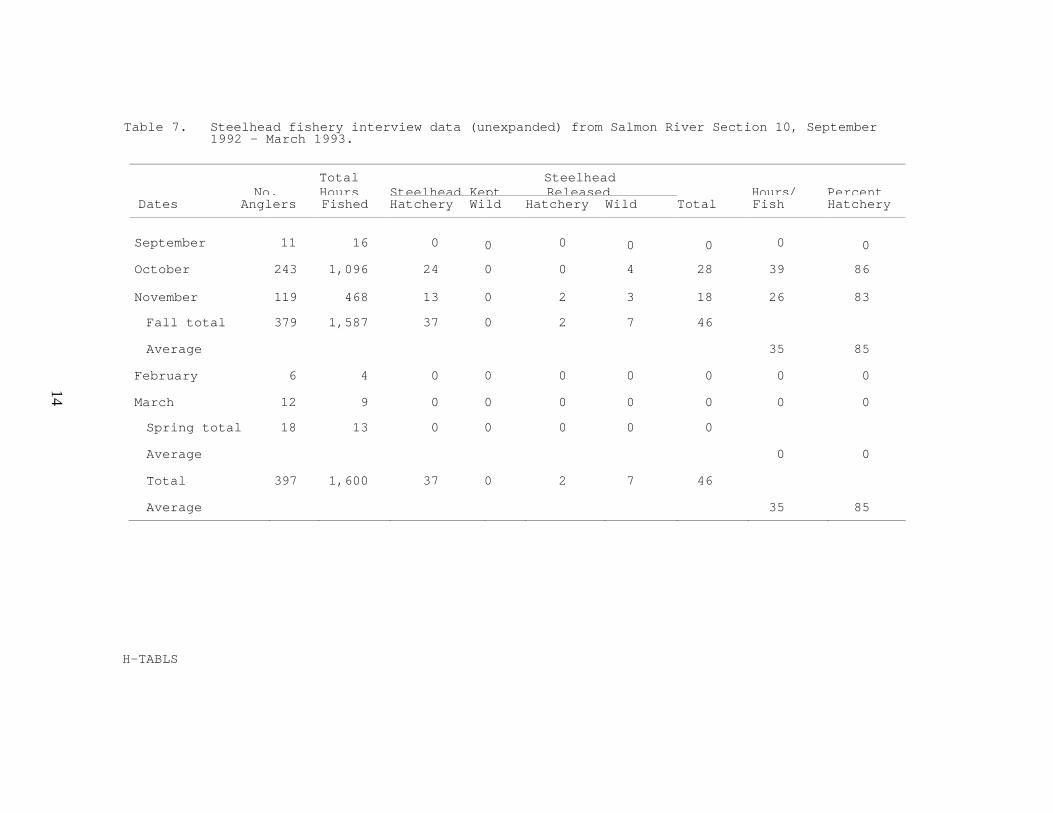
Table 7. Steelhead fishery interview data (unexpanded) fromSalmon River Section 10, September 1992 -March 1993 ..............................................14
Table 8. Steelhead fishery interview data (unexpanded) fromSalmon River Section 11, September 1992 -March 1993 ..............................................15
Table 9. Steelhead fishery interview data (unexpanded) fromSalmon River Section 12, September 1992 -March 1993 ..............................................16
Table 10. Steelhead fishery interview data (unexpanded) fromSalmon River Section 13, October 1992 -March 1993 ..............................................17
Table 11. Steelhead fishery interview data (unexpanded) fromSalmon River Section 14, October 1992 -March 1993 ..............................................18
Table 12. Steelhead fishery interview data (unexpanded) fromSalmon River Section 15, October 1992 -April 1993 ..............................................19
Table 13. Steelhead fishery interview data (unexpanded) fromSalmon River Section 16, October 1992 -April 1993 ..............................................20
Table 14. Steelhead fishery interview data (unexpanded) fromSalmon River Section 17, October 1992 -April 1993 ..............................................21
Table 15. Steelhead fishery interview data (unexpanded) fromSalmon River Section 18, February - April 1993 .......... 22
Table 16. Steelhead fishery interview data (unexpanded) fromSalmon River Section 19, April 1993 .....................23
Table 17. Steelhead fishery interview data (unexpanded) fromSalmon River Section 20, November 1992 -April 1993 ..............................................24
Table 18. Proportion of estimated harvest by river sectionthat was examined for marks, 1992-93 .................... 25
Table 19. Estimated number of hatchery steelhead harvested inthe lower Snake, Clearwater, and Salmon riversduring the 1992-93 seasons .............................. 26
Table 20. Summary of 1992-93 harvest estimates and hatcheryreturns of steelhead produced by LSRCP hatcheries . . . . 28
CONTENTS

iii
LIST OF TABLES (Cont.)Page
Table 21. Adult steelhead collected from upper Salmon Rivertributaries, 1993 ............................................. 31
Table 22. Coded wire tag (CWT) recoveries from upper SalmonRiver tributaries, 1993 ....................................... 32
Table 23. Difference between the number of steelhead passingMcNary Dam that can be accounted for upriver atIce Harbor and Priest Rapids dams, 1983-92a ...............................34
LIST OF FIGURES
Figure 1. Map of steelhead harvest areas in Idaho ....................... 5
Figure 2. Map of upper Salmon River tributaries .......................... 9
LIST OF APPENDICES
Appendix A. Total number of steelhead by section and monthharvested by resident and nonresident anglers,fall 1992 and spring 1993a ..........................................................42
Appendix B. Coded wire tag recoveries and fin clips identifiedSeptember 1992 - April 1993; harvest estimatesby month and river section; and total harvestestimates for the 1992-93 season .............................. 44
Appendix C. Steelhead groups returning to the Salmon River,1992-93 ...................................................... 118
Appendix D. Steelhead groups returning to the ClearwaterRiver, 1992-93 ............................................... 122
Appendix E. Miscellaneous coded wire tag steelhead groups thatwere recovered by Idaho anglers, 1992-93 ........................................................ 124
CONTENTS

9293LSRC 1
ABSTRACT
Steelhead trout Oncorhynchus mykiss and chinook salmon O. tshawytschafisheries in Idaho are monitored to assess hatchery contribution, distribution,and return rates. Coded wire tags (CWTs) are retrieved from fish harvested byanglers, and harvest rates are calculated by month and river section.
During the fall 1992 and spring 1993 steelhead seasons, 27,532 anglers wereinterviewed and 5,178 adult steelhead examined, which was 12.3% of the totalsteelhead harvest. We retrieved 377 CWTs from 74 different mark groups. Thetotal estimated harvest for the 1992-93 season was 42,221 hatchery and 22 wild-natural fish, of which an estimated 9,814 (23%) were produced by the Lower SnakeRiver Compensation Plan (LSRCP). An additional 3,088 LSRCP-reared fish returnedto hatchery racks or to off-site release locations.
The estimated total return of A-strain adults from 1,499,856 smoltsreleased at Sawtooth Hatchery in 1990 was 9,125 (0.61%), and 82% of the returnwas harvested. An estimated 1,009 (0.10%) B-strain adults returned after twoocean-years from 988,350 smolts released into the East Fork Salmon River in 1990;this group was harvested at 88%.
We surveyed 18 upper Salmon River tributaries with electrofishing gear inApril to document the occurrence and distribution of adult hatchery steelhead.We handled 13 wild/natural adults and retrieved 34 CWTs from 218 hatcherysteelhead.
Author:
Kent BallSenior Fishery Research Biologist

9293LSRC 2
INTRODUCTION
Chinook salmon Oncorhynchus tshawytscha and steelhead trout O. mykiss areraised in Idaho hatcheries to mitigate for losses caused by the construction ofhydroelectric dams. Adults returning to hatcheries in the Salmon and ClearwaterRiver basins commingle with each other and with wild stocks. In the Snake River,fish destined for Idaho also commingle with adults returning to Oregon andWashington streams.
The main purpose of this project is to determine the composition of theanadromous fish harvest in the Idaho fishery and to estimate the adult harvestcontribution from juveniles produced in Lower Snake River Compensation Plan(LSRCP) hatcheries. Contribution to the Idaho fishery is one of the measures ofperformance of LSRCP fish. However, there are also steelhead raised by IdahoPower Company (IPC) that are released in the Salmon River drainage. Although theharvest contribution of these fish is not included in this report, they areincorporated in the section on tributary straying. For some release groups,coded wire tagged (CWT) fish from the IPC program provide the basis for LSRCPevaluation.
Harvest management of steelhead in Idaho is directed toward harvest ofhatchery fish and protection of wild and naturally-produced fish. Currently,wild stocks are below escapement goals, and protection is necessary to perpetuatethese fish. Beginning in 1984, all hatchery-produced steelhead smolts releasedin Idaho rivers and streams had their adipose fins excised before release soreturning adults could be selectively harvested.
During the fall 1992 and spring 1993 seasons, all age groups of hatcherysteelhead returning to Idaho were marked by adipose fin clips, and regulationsstated that "only steelhead with a missing adipose fin (as evidenced by a healedscar) may be kept." Consequently, the harvest of any wild (unmarked) steelheadwas illegal. Table 1 lists the fall and spring regulations.
Representative groups of steelhead are marked with CWTs prior to release.Anglers are interviewed and fish snouts are retrieved in all major harvest areasto recover these tags from the fishery. Information is collected and used toestimate timing, straying, exploitation, harvest distribution, and relativeabundance of wild and hatchery stocks. Total harvested numbers are estimated bya statewide harvest survey, and the harvest contribution for each hatcheryprogram is derived from tag recoveries. Releasing steelhead smolts directly intothe upper Salmon River is being used as a tool for spreading harvest andincreasing returns. This report documents some of the behavior and distributionof these returning adults.
In recent years, harvest opportunity for chinook salmon has been limitedto hatchery stocks. Harvest is allowed when returning adult numbers exceedhatchery escapement needs. No harvest was allowed for spring chinook salmonproduced by LSRCP facilities in Idaho this year, so this report pertains only tosteelhead.
OBJECTIVES
Identify in the Idaho sport fishery the number and proportion of theharvest that is produced by LSRCP hatcheries.
Determine the spawning escapement of LSRCP stocks in Idaho.
Document the occurrence and distribution of adult hatchery steelhead inupper Salmon River tributaries.

3
Table 1. Steelhead season dates, bag limits and specialrestrictions for the Clearwater, Salmon and Snakerivers, 1992-93.
River and SectionsFall
Season Dates Bag Limitsa
Snake River(01)
Clearwater River(03)b
Sept 1 - Dec 31
Clearwater River(03 - 07)Cd
Oct 15 - Dec 31
2, 4, 10
Salmon River(10 - 20)
Sept 1 - Dec 31 2, 4, 6
River and SectionsSpring
Season Dates Bag Limitsa
Snake River(01)
Clearwater River(03 - 07)
Jan 1 - Apr 30
Salmon River(10 - 14)
Jan 1 - Mar 31
Salmon River(15 - 19)
Salmon River(20)
Jan 1 - Apr 30
2, 4, 10
a Bag limits denotes daily, possession, and season totals.b Section 03 includes only that portion from its mouth upstreamto Memorial Bridge of Highway 12 at Lewiston.
C Section 03 includes that portion from Memorial Bridge upstreamto Clear Creek.
d Catch and release fishery from September 1 through October 14.

9293LSRC 4
DESCRIPTION OF STUDY AREA
There are three major river systems in Idaho where steelhead are harvested:the Snake, Clearwater, and Salmon rivers (Figure 1; Table 2). All of Idaho'ssteelhead harvest areas are included in this study, except the upper Snake(section 02) and the Boise River (section 28). These two sections are excludedbecause no steelhead produced by the LSRCP are harvested there. Steelhead areblocked from reaching the Boise River by dams on the Snake River. However, aportion of the fish returning to Hells Canyon Dam are transplanted and releasedthere for harvest through the IPC mitigation program.
METHODS
Creel Survey
Angler interviews were conducted at check stations and from jet boats androving vehicles. Angler interview schedules and intensity were designed toobserve maximum numbers of harvested fish. Techniques were tailored to sportsmanaccess and harvest methods. For example, on the Clearwater River, a majorportion of the fall and winter harvest was taken by boat fishermen, so surveyefforts concentrated on interviewing boat anglers. In late spring, the densityof boats in a small area became so high that it was prohibitive to interviewanglers on the water; therefore, survey efforts were divided between major boatramps. In the roadless area of the Salmon River, almost all of the angler accesswas by boat, but most of the fishing effort was from shore. Anglers werecontacted by census clerks in jet boats or at check stations located at majoregress points.
During angler interviews, data collection included the number of anglersand hours fished, number of fish kept or released, wild or hatchery origin offish kept or released, fork length of fish kept, and date and river section wherefish were caught. Observed fish were inspected for tags and fin clips. Snoutswere removed for CWT retrieval from all fish with abnormalities of their leftventral fins, except when anglers desired to keep their fish intact.
Water conditions during the fall season are usually conducive to harvestand the interview schedule can be followed. During the spring season, high,turbid flows can reduce harvest to near zero. Anglers were not interviewedduring periods of very low harvest.
Interview Schedule
Lower Snake River (01) - by jet boat with Washington Department of Wildlifepersonnel and at boat ramps on alternating weekends for ten weekendsduring the fall and six weekends during the spring season.
Lower Clearwater and North Fork Clearwater River (03 and 05) - by roving vehicleone day each week and by jet boat three days each week for 15 weeks in thefall and 10 weeks in the spring season. Interviews were conducted fromboat ramps for the last six weeks of the spring season.
Upper Clearwater (including the Middle Fork) and South Fork Clearwater River (04and 07) - by roving vehicle on the Upper Clearwater in the fall and onboth rivers in the spring, two weekend days per week, for eight weeks inthe fall and ten weeks in the spring.

5

6
River Section Location Code
Snake River, below Salmon River 01Snake River, above Salmon River 02Clearwater River, below Orofino Bridge 03Clearwater River, above Orofino Bridge 04North Fork Clearwater River 05Middle Fork Clearwater River 06South Fork Clearwater River 07Selway River 08Lochsa River 09Salmon River, below Whitebird Creek 10Salmon River, Whitebird Creek to Little Salmon 11Salmon River, Little Salmon to Vinegar Creek 12Salmon River, Vinegar Creek to South Fork 13Salmon River, South Fork to Middle Fork 14Salmon River, Middle Fork to North Fork 15Salmon River, North Fork to Lemhi River 16Salmon River, Lemhi River to Pahsimeroi River 17Salmon River, Pahsimeroi River to East Fork 18Salmon River, above East Fork 19Little Salmon River 20South Fork Salmon River 21Middle Fork Salmon River 22North Fork Salmon River 23Lemhi River 24Pahsimeroi River 25East Fork Salmon River 26Snake River, Oxbow 27Boise River 28

9293LSRC 7
Salmon River
Section 10 - by jet boat six weekends in the fall and five weekends in thespring season.
Section 11 - by roving vehicle two weekdays and two weekend days for ten weeksin the fall and eight weeks in the spring season.
Sections 12 and 13 - by a check station at the old lumber mill site near Rigginsfor ten weekends in the fall and eight weekends in the spring season.
Sections 14 and 15 - by a check station near North Fork for ten weekends in thefall and eight weekends in the spring season.
Section 16 - by roving vehicle for six weekends in the fall and six weekends inthe spring season.
Section 17 - by roving vehicle for six weekends in the fall and six weekends inthe spring season.
Sections 17 and 18 - by a check station near Challis for three weekends in thespring season.
Section 18 - by roving vehicle for six weekends in the spring season.
Section 19 - by roving vehicle for six weekends in the spring season.
Section 20 - by roving vehicle for six weekends in the spring season.
Data Analysis
Harvest estimates for each river section were obtained from statewidetelephone survey results (Appendix A). Beginning with the fall 1990 season, thatportion of the Clearwater River up to the Memorial Bridge of Highway 12 atLewiston was designated river section 03 during the September 1 to October 15harvest period. Previously, harvest from this section of the Clearwater Riverhad been included with river section 01 (Ball 1992a).
The number of fish checked for marks from each river section, divided bythe harvest estimate, yields the sampling rate for each river section by month.Harvested fish that were not seen during the interviews were not included whenexpressing the proportion of the estimated harvest that was marked.
During angler interviews, hatchery-wild proportions were recorded for fishkept and for total catch, including released fish when their origin could bedetermined. The harvest of hatchery fish was the product of the hatcheryproportion observed in anglers' creels and the estimated monthly harvest fromstatewide surveys. Seasonal estimates of reported hatchery fish harvest were thesummation of monthly estimates. Hatchery harvest estimates for months whenharvest was low and no fish were checked were calculated using the hatcheryproportion calculated from the last month that data were available. Thesemethods were applied during winter when fish movement was minimal and theproportion of hatchery fish in the harvest was constant. Harvest estimates ofvarious CWT groups were calculated by dividing the number of tags recovered bythe sampling rate expressed as a decimal and then rounded to whole numbers. Taggroup harvest rates were calculated by dividing the estimated harvest of the

9293LSRC 8
group by the release group size. Harvest estimates for unmarked groups werecalculated using harvest rates from representative mark groups or companiongroups.
Hatchery returns were classified by strain (A or B) and ocean-age usinglength frequencies of previous known-age CWT returns. Marked returns to hatcheryracks were subtracted from total returns by strain and ocean-age. Total harvestof unmarked groups was assumed to parallel the performance of marked hatcheryrack returns. Where more than one unmarked group returned to a release site, theestimates of harvest and hatchery returns were calculated on the total of theunmarked fish and assumed to apply equally to each group.
Total returns of marked groups were the summation of harvest estimates andhatchery rack returns. However, in 1992-93, returns of some marked groups wereinsufficient to produce viable estimates. For Sawtooth Hatchery and East ForkSalmon River releases, the average exploitation rate from all marked returns fromthe previous two years was assumed to approximate current exploitation. Returnsfrom off-site releases at Shoup Bridge, Ellis Bridge, and North Fork wereestimated from returns of marked fish released at Shoup Bridge or from CWT fishreleased by the IPC program. Exploitation was assumed to be the same for allgroups. Returns from Little Salmon River and Hammer Creek releases werecalculated from marked returns to the Little Salmon River.
Exploitation rates were the harvest estimates divided by the sum of theharvest estimates and the number of fish that returned to the hatchery. Noattempts were made to include mortality from causes other than angler harvest norto determine contribution to natural reproduction.
Tributary Strayinq
Upper Salmon River tributary streams were visually checked near theirmouths for the presence of adult fish. When fish were observed, streams weresampled with backpack electrofishing gear to capture the adult steelhead (Figure2). The electrofishing operator was accompanied by two or three people withlarge mesh nylon dip nets. When netted, adult steelhead were sexed, inspectedfor marks, and visually assigned strain and ocean-age based on lengths of known-age CWT returns. Fish with the left ventral fin missing were collected for CWTretrieval. All other fish were released near their recovery site. Surveysusually began at or near the mouth of the streams and proceeded upstream untilsteelhead were too few in number to continue the survey.
RESULTS
During the fall 1992 and spring 1993 seasons, we interviewed 27,532 anglersthat had harvested 5,564 hatchery and 3 wild fish (Tables 3-17). We physicallyexamined 5,178 hatchery fish for marks, which represented 12.3% of the totalsteelhead harvest (Table 18). We removed 596 snouts from fish with clipped leftventral fins for CWT retrieval.
The composition of the hatchery steelhead harvest by river section andseason was compiled in Table 19. All river sections were included except 02 and28 (Table 2). Total harvest for the river sections listed was 42,243 steelhead,of which an estimated 22 fish were of wild-natural origin and were illegallypossessed.
From anglers' creels, we recovered 377 CWTs. The overall proportion oftags recovered from the number of fish checked for marks was 7.3% (Table 18).Coded wire tags were recovered from 74 mark groups (Appendix B). The number of

9

Table 3. Steelhead fishery interview data (unexpanded) from lower Snake River (01), September -December 1992.
Total SteelheadReleasedNo. Hours Steelhead Kept Hours/ Percent
Dates Anglers Fished Hatchery Wild Hatchery Wild Total Fish Hatchery
September 419 1,885 47 0 6 18 71 27 75October 900 3,454 104 0 16 29 149 23 81November 899 3,504 116 0 13 21 150 23 86December 277 940 36 0 2 7 45 21 84Fall total 2,495 9,783 303 0 37 75 415
Average 24 82
H-TABLS
10

H-TABLS
Table 4. Steelhead fishery interview data (unexpanded) from lower Clearwater River (03) and NorthFork Clearwater River (05), September 1992 - April 1993.
Total SteelheadNo. Hours Steelhead Kept Released Hours/ Percent
Dates Anglers Fished Hatchery Wild Hatchery Wild Total Fish Hatchery
September 162 816 12 0 7 9 28 29 68
October 1,554 6,658 247 0 57 107 411 16 74
November 1,857 8,587 271 0 16 67 354 24 81
December 674 2,541 96 0 4 13 113 22 88
Fall total 4,247 18,602 626 0 84 196 906
Average 21 78
January 593 2,087 96 0 9 15 120 17 88
February 1,872 7,827 244 1 57 91 393 20 77
March 1,538 7,849 257 0 150 47 454 17 90
April 223 1,040 30 0 9 0 39 27 100
Springtotal 4,226 18,803 627 1 225 153 1,006
Average 19 85
Total 8,473 37,405 1,253 1 309 349 1,912
Average 20 82
11

H-TABLS
Table 5. Steelhead fishery interview data (unexpanded) from upper Clearwater and Middle ForkClearwater rivers (04), October 1992 - April 1993.
Total SteelheadNo. Hours Steelhead Kept Released Hours/ Percent
Dates Anglers Fished Hatchery Wild Hatchery Wild Total Fish Hatchery
October 32 118 6 0 1 3 10 12 70
November 257 1,113 29 0 1 25 55 20 98
Fall total 289 1,231 35 0 2 28 65
Average 19 57
February 52 99 3 0 0 2 5 20 60
March 481 1,481 60 0 15 37 112 13 67
April 42 111 2 0 0 2 4 28 50
Spring total 575 1,691 65 0 15 41 121
Average 26 66
Total 864 2,922 100 0 17 69 186
Average 16 63
12

Table 6. Steelhead fishery interview data (unexpanded) from South Fork Clearwater River (07),February - April 1993.
Total SteelheadNo. Hours Steelhead Kept Released Hours/ Percent
Dates Anglers Fished Hatchery Wild Hatchery Wild Total Fish Hatchery
February 9 12 0 0 0 0 0 0 0
March 157 348 24 0 0 12 36 10 67
April 352 1,194 65 0 22 17 104 11 84
Spring total 518 1,554 89 0 22 29 140
Average 11 79
H-TABLS
13
H-TABLS
Table 7. Steelhead fishery interview data (unexpanded) from Salmon River Section 10, September1992 - March 1993.
Total SteelheadNo. Hours Steelhead Kept Released Hours/ Percent
Dates Anglers Fished Hatchery Wild Hatchery Wild Total Fish Hatchery
September 11 16 0 0 0 0 0 0 0
October 243 1,096 24 0 0 4 28 39 86
November 119 468 13 0 2 3 18 26 83
Fall total 379 1,587 37 0 2 7 46
Average 35 85
February 6 4 0 0 0 0 0 0 0
March 12 9 0 0 0 0 0 0 0
Spring total 18 13 0 0 0 0 0
Average 0 0
Total 397 1,600 37 0 2 7 46
Average 35 85
14

H-TABLS
Table 8. Steelhead fishery interview data (unexpanded) from Salmon River Section 11, September1992 - March 1993.
Total SteelheadNo. Hours Steelhead Kept Released Hours/ Percent
Dates Anglers Fished Hatchery Wild Hatchery Wild Total Fish Hatchery
September 23 51 1 0 0 0 1 51 100
October 594 2,732 96 0 46 58 200 14 71
November 685 3,024 117 0 39 59 215 14 73
December 30 69 0 0 0 0 0 0 0
Fall total 1,332 5,876 214 0 85 117 416
Average 14 72February 90 181 1 0 1 3 5 36 40
March 165 454 11 0 0 1 12 38 92
Spring total 255 635 12 0 1 4 17
Average 37 76
Total 1,587 6,511 226 0 86 121 433
Average 15 72
15

H-TABLS
Table 9. Steelhead fishery interview data (unexpanded) from Salmon River Section 12, September1992 - March 1993.
Total SteelheadNo. Hours Steelhead Kept Released Hours/ Percent
Dates Anglers Fished Hatchery Wild Hatchery Wild Total Fish Hatchery
September 5 13 0 0 0 0 0 0 0
October 520 4,057 102 1 38 71 212 19 66
November 823 5,407 108 0 18 32 158 34 80
December 7 11 1 0 0 0 1 11 100
Fall total 1,355 9,488 211 1 56 103 371
Average 26 72
February 18 64 1 0 0 0 1 64 100
March 551 2,645 22 0 7 10 39 68 74
Spring total 569 2,709 23 0 7 10 40
Average 68 75
Total 1,924 12,197 234 1 63 113 411
Average 30 72
16

Table 10. Steelhead fishery interview data (unexpanded) from Salmon River Section 13, October1992 - March 1993.
Total SteelheadNo. Hours Steelhead Kept Released Hours/ Percent
Dates Anglers Fished Hatchery Wild Hatchery Wild Total Fish Hatchery
October 71 1,515 33 0 0 41 74 20 45
November 69 959 42 0 0 30 72 13 58
Fall total 140 2,474 75 0 0 71 146
Average 17 51
March 52 724 14 0 0 12 26 28 54
Spring total 52 724 14 0 0 12 26
Average 28 54
Total 192 3,198 89 0 0 83 172
Average 19 52
H-TABLS
17

Table 11. Steelhead fishery interview data (unexpanded) from Salmon River Section 14, October1992 - March 1993.
Total SteelheadNo. Hours Steelhead Kept Released Hours/ Percent
Dates Anglers Fished Hatchery Wild Hatchery Wild Total Fish Hatchery
October 265 4,103 140 0 68 147 355 12 59
November 376 9,246 346 0 127 122 595 16 79
Fall total 641 13,349 486 0 195 269 950
Average 14 72
March 354 4,781 24 0 18 65 107 45 39
Spring total 354 4,781 24 0 18 65 107
Average 45 39
Total 995 18,130 510 0 213 334 1,057
Average 17 68
H-TABLS
18

Table 12. Steelhead fishery interview data (unexpanded) from Salmon River Section 15, October1992 - April 1993.
Total SteelheadNo. Hours Steelhead Kept Released Hours/ Percent
Dates Anglers Fished Hatchery Wild Hatchery Wild Total Fish Hatchery
October 1,416 15,227 621 0 351 213 1,185 13 82
November 1,322 13,490 585 0 221 125 931 14 87
Fall total 2,738 28,717 1,206 0 572 338 2,116
Average 14 84
March 1,912 18,531 455 1 335 58 849 22 93
April 89 561 40 0 9 5 54 10 91
Springtotal 2,001 19,092 495 1 344 63 903
Average 21 93
Total 4,739 47,809 1,701 1 916 401 3,019
Average 16 87
H-TABLS
19

Table 13. Steelhead fishery interview data (unexpanded) from Salmon River Section 16, October1992 - April 1993.
Total SteelheadNo. Hours Steelhead Kept Released Hours/ Percent
Dates Anglers Fished Hatchery Wild Hatchery Wild Total Fish Hatchery
October 245 1,124 52 0 7 10 69 16 86
November 182 742 41 0 9 4 54 14 93
Fall total 427 1,866 93 0 16 14 123
Average 15 89
March 422 2,018 34 0 5 10 49 41 80
April 97 493 6 0 3 4 13 38 69
Spring total 519 2,511 40 0 8 14 62
Average 41 77
Total 946 4,377 133 0 24 28 185
Average 24 85
H-TABLS
20

H-TABLS
Table 14. Steelhead fishery interview data (unexpanded) from Salmon River Section 17, October1992 - April 1993.
Total SteelheadNo. Hours Steelhead Kept Released Hours/ Percent
Dates Anglers Fished Hatchery Wild Hatchery Wild Total Fish Hatchery
October 16 47 1 0 0 1 2 24 50
November 32 65 4 0 0 0 4 16 100
Fall total 48 112 5 0 0 1 6
Average 19 83
February 54 80 0 0 0 0 0 0
March 871 3,546 27 0 1 6 34 104 82
April 604 5,298 249 0 87 16 352 15 95
Springtotal 1,529 8,924 276 0 88 22 386
Average 23 94
Total 1,577 9,036 281 0 88 23 392
Average 23 94
21

Table 15. Steelhead fishery interview data (unexpanded) from Salmon River Section 18, February -April 1993.
Total SteelheadNo. Hours Steelhead Kept Released Hours/ Percent
Dates Anglers Fished Hatchery Wild Hatchery Wild Total Fish Hatchery
February 16 42 0 0 0 0 0 0 0
March 213 722 6 0 2 2 10 72 80
April 698 4,096 162 0 213 34 409 10 92
Spring total 927 4,860 168 0 215 36 419
Average 12 91
H-TABLS
22

Table 16. Steelhead fishery interview data (unexpanded) from Salmon River Section 19, April 1993.
Steelhead KeptSteelheadReleasedNo.
Dates Anglers
TotalHoursFished Hatchery Wild Hatchery Wild Total
Hours/Fish
PercentHatchery
April
Spring total
Average
846
846
4,622
4,622
244
244
0
0
210
210
37
37
491
491
9
9
92
92
H-TABLS
23

Table 17. Steelhead fishery interview data (unexpanded) from Salmon River Section 20, November1992 - April 1993.
Total SteelheadNo. Hours Steelhead Kept Released Hours/ Percent
Dates Anglers Fished Hatchery Wild Hatchery Wild Total Fish Hatchery
November 19 23 4 0 1 0 5 5 80
Fall total 19 23 4 0 1 0 5
Average 5 80
February 26 75 0 0 0 1 1 75 0
March 213 431 8 0 0 0 8 54 100
April 794 2,540 184 0 133 49 366 7 87
Springtotal 1,033 3,046 192 0 133 50 375
Average 8 87
Total 1,052 3,069 196 0 134 50 380
Average 8 87
H-TABLS
24

25
Table 18. Proportion of estimated harvest by river sectionthat was examined for marks, 1992-93.
River No. Fish Estimated SampleSection Checked Harvesta Rate (%)
01 289 4,061 7.103 & 05 1,183 16,485 7.2
04 96 2,167 4.4
07 86 699 12.310 32 2,068 1.611 197 1,947 10.112 213 1,229 17.313 84 421 20.0
14 468 1,927 24.315 1,587 5,676 28.016 126 978 12.917 258 1,237 20.918 159 858 18.5
19 208 1,268 16.420 192 1,222 15.7
Total 5,178 42,243Average 12.3
a Data from statewide telephone survey (McArthur 1993).

26
H-TABLS
Table 19. Estimated number of hatchery steelhead harvested in the lower Snake, Clearwater and Salmonrivers during the 1992-93 seasons.
a From statewide surveys.b Assumed to be of hatchery origin.
Fall Season - 1992 Sprinq Season - 1993 Total HarvestRiver Estimated Percent No. Hatchery Estimated Percent No. Hatchery No. HatcherySection Harvesta
aHatchery Fish Harvest
aHatchery Fish Fish
Snake 01 3,356 100 3,356 705 __b 705 4,061
Clearwater03 & 05 9,059 100 9,059 7,426 99.8 7,411 16,47004 779 100 779 1,388 100 1,388 2,16707 62 -- 62b 637 100 637 699
Clwtr. Total 9,900 9,900 9,451 9,436 19,336
Average 100 99.8
Salmon River10 1,488 100 1,488 580 0 580b 2,06811 1,151 100 1,151 796 100 796 1,94712 797 99.5 793 432 100 432 1,22513 319 100 319 102 100 102 42114 1,665 100 1,665 262 100 262 1,92715 4,231 100 4,231 1,445 99.8 1,442 5,67316 682 100 682 296 100 296 97817 213 100 213 1,024 100 1,024 1,23718 62 -- 62b 796 100 796 85819 97 -- 97b 1,171 100 1,171 1,26820 142 100 142 1,080 100 1,080 1,222
Salmon Total 10,847 10,843 7,984 7,981 18,824
Average 100 100
1992-93 24,103 24,099 18,140 18,122 42,221

9293LSRC 27
tags recovered, the estimated harvest of tag code groups by month and riversection, and the total estimated harvest of tag code groups for the fall andspring seasons are also listed in Appendix B. Of the 74 mark groups that yieldedCWTs, 49 were from releases in Idaho (Appendices B, C, and D). There were 103additional CWTs from 22 tag groups that returned to hatchery racks, but were notrecovered from the fishery.
Coded wire tags were also recovered from 18 Washington tag groups and 7Oregon tag groups (Appendices B and E). Eight Washington tag groups were fromreleases on the Touchet River, six from the Tucannon River, two at Lyons FerryHatchery, and two from Asotin Creek. Six Oregon tag groups were from releasesat Wallowa Hatchery and one from Little Sheep Creek.
Estimates of total returns of LSRCP-reared fish were summarized in Table20. All Idaho returns from the LSRCP program that returned in 1992-93 were fromreleases in the Salmon River drainage. However, they were also recovered fromthe fishery in the Snake and Clearwater rivers. The total estimated return ofadult steelhead to Idaho in 1992-93 from the LSRCP program, which includesharvest by Idaho anglers, hatchery returns, and off-site escapement, was 12,902fish. The LSRCP contribution to Idaho's hatchery steelhead harvest (exceptsections 02 and 28) in 1992-93 was 9,814. This number does not include estimatedharvest of 583 LSRCP-reared fish from Oregon and Washington (Appendix B).Additionally, other LSRCP-reared fish released in Idaho, but caught by Oregon andWashington anglers, were not included in this report.
Adult steelhead returning to Sawtooth Hatchery in 1992-93 were exploitedat 80%. East Fork Salmon River returns were exploited at 90%. In the LittleSalmon River, and for off-site releases at Hammer Creek, exploitation was notquantified but was estimated to be 50% (Table 20).
Between April 6 and April 27, 1993, 18 tributary streams between Owl andSlate creeks in the upper Salmon River drainage were sampled with electrofishinggear to document the occurrence and distribution of adult hatchery steelhead(Table 21). Five additional streams (Colson Creek, Hughes Creek, Kid's Creek,Sheep Creek, and the North Fork Salmon River) were also checked, but no hatcherysteelhead were observed. In streams containing adult fish, at least 1 and asmany as 38 hatchery steelhead adults were handled per tributary. We classified218 adult hatchery fish and 13 wild-natural fish in the 18 tributariesidentified. The hatchery fish were 56% male and 97% A-strain origin. Of the 211A-strain fish, 74% were one-ocean.
We recovered 34 CWTs from tributary fish (Table 22). Tagged fish were fromhatchery releases at Sawtooth, Pahsimeroi, and the East Fork, as well as off-sitereleases at the North Fork of the Salmon River and Ellis Bridge. There were 2two-ocean fish (B-strain) from releases in the East Fork and 1 two-ocean fishreleased from Sawtooth Hatchery in addition to 31 one-ocean (A-strain)recoveries.
From 67,494 smolts released with CWTs at Ellis Bridge, 13 adults wererecovered in tributaries and 18 entered the adult trap at the Pahsimeroi Hatchery(Table 22). Only two CWTs were recovered from tributaries upstream of therelease site. From 67,631 marked fish released in the Salmon River at NorthFork, 6 were recovered from tributaries and 4 entered the trap at PahsimeroiHatchery. All of the tributary recoveries were upstream of the North Forkrelease site.
All CWT recoveries from steelhead released at upper Salmon River hatcherieswere recovered downstream of their release sites. From 114,676 CWTs released atSawtooth Hatchery in 1991, we recovered 8 tags from steelhead in tributaries, and98 fish with tags entered the trap at Sawtooth Hatchery. From the 1990 releaseat Sawtooth Hatchery of 39,620 marked fish, 1 two-ocean fish with CWT 10/40/59was recovered from Indian Creek, 253 km downstream. This A-strain fish was

H-TABLS
Table 20. Summary of 1992-93 harvest estimates and hatchery returns of steelhead produced by LSRCPhatcheries.
Strain Estimated Number of FishReleaseYear
andOcean-Age
No. of FishReleased Release Site
HatcheryRearing Marks Harvested
HatcheryReturna Total
1991 A-I 21,050 Sawtooth HNFHb CWT 10/43/33 45 24 691991 A-I 20,129 Sawtooth HNFH CWT 10/43/34 55 27 821991 A-I 12,066 Sawtooth HNFH CWT 10/43/35 32 12 441991 A-I 21,775 Sawtooth HNFH CWT 10/43/36 55 13 681991 A-I 20,318 Sawtooth HNFH CWT 10/43/37 49 15 641991 A-I 19,338 Sawtooth HNFH CWT 10/43/38 52 19 711991 A-I 985 Sawtooth HNFH PIT 2 1 31991 A-I 864,138 Sawtooth HNFH None 2,173 682 2,8551990` A-I 304,907 Sawtooth HNFH None --1991 A-I 364,700 Sawtooth MVSHd None 916 288 1,2041991 A-I 135,100 Pahsimeroi MVSH None 445 411 8561991 A-I 97,800 Shoup Bridge MVSH None 214 6 2201991 A-I 186,300 Hammer Creek MVSH None 116 116 2321991 A-I 21,809 Little Salmon MVSH CWT 10/43/17 4 4 81991 A-I 22,704 Little Salmon MVSH CWT 10/43/18 21 21 421991 A-I 21,484 Little Salmon MVSH CWT 10/43/19 16 16 321991 A-I 1,600 Little Salmon MVSH PIT 1 1 21991 A-I 242,703 Little Salmon MVSH None 151 151 302
Subtotal 2,378,906 4,347 1,807 6,154
1990 A-II 14,597 Sawtooth HNFH CWT 10/42/14 12 6 181990 A-II 15,482 Sawtooth HNFH CWT 10/42/15 33 5 381990 A-II 15,218 Sawtooth HNFH CWT 10/42/16 3 0 31990 A-II 255,859 Sawtooth HNFH None 314 44 3581990 A-II 39,620 Sawtooth MVSH CWT 10/40/59 53 0 531990 A-II 1,159,080 Sawtooth MVSH None 1,424 198 1,6221990 A-II 15,528 Shoup Bridge HNFH CWT 10/42/27 0 0 01990 A-II 15,196 Shoup Bridge HNFH CWT 10/42/28 8 0 81990 A-II 15,104 Shoup Bridge HNFH CWT 10/42/29 9 0 91990 A-II 154,418 Shoup Bridge HNFH None 57 0 571990 A-II 200,295 Ellis Bridge HNFH None 256 24 280
28

H-TABLS
Table 20. Continued.
Strain Estimated Number of FishRelease
Yearand
Ocean-AgeNo. of FishReleased Release Site
HatcheryRearing Marks
HatcheryHarvested Returna Total
1990 A-II 199,602 North Fork HNFH None 250 9 2591990 A-II 80,465 Little Salmon HNFH None 30 30 60
Subtotal 2,180,464 2,449 316 2,765
1991 B-I 20,498 East Fork MVSH CWT 10/43/14 200 1 2011991 B-I 21,017 East Fork MVSH CWT 10/43/15 5 1 61991 B-I 20,312 East Fork MVSH CWT 10/43/16 0 0 01991 B-I 1,500 East Fork MVSH PIT1991 B-I 22,525 East Fork MVSH CWT 10/43/20 4 3 71991 B-I 22,483 East Fork MVSH CWT 10/43/21 0 3 31991 B-I 21,375 East Fork MVSH CWT 10/43/22 0 1 11991 B-I 838,090 East Fork MVSH None 337 46 3831991 B-I 540,733 East Fork HNFH None 29 4 331991 B-I 19,831 Little Salmon HNFH CWT 10/43/32 6 6 121991 B-I 19,813 Little Salmon HNFH CWT 10/43/39 4 4 81991 B-I 18,877 Little Salmon HNFH CWT 10/43/40 3 3 61991 B-I 501 Little Salmon HNFH PIT -- -- --1991 B-I 398,078 Little Salmon HNFH None 88 88 1761991 B-I 120,323 Little Salmon HNFH None 27 27 54
Subtotal 577,423 703 187 890
1990 B-II 64,150 East Fork HNFH None 9 1 101990 B-II 40,905 East Fork MVSH CWT 10/40/58 66 15 811990 B-II 14,964 East Fork MVSH CWT 10/42/33 2 0 21990 B-II 15,157 East Fork MVSH CWT 10/42/34 58 0 581990 B-II 14,642 East Fork MVSH CWT 10/42/35 9 1 101990 B-II 15,474 East Fork MVSH CWT 10/42/36 20 4 241990 B-II 15,971 East Fork MVSH CWT 10/42/37 21 3 241990 B-II 14,958 East Fork MVSH CWT 10/42/38 21 3 241990 B-II 792,129 East Fork MVSH None 535 73 6081990 B-II 14,841 Little Salmon HNFH CWT 10/42/30 258 258 5161990 B-II 14,065 Little Salmon HNFH CWT 10/42/31 4 4 8
29

H-TABLS
Table 20. Continued.
Strain Estimated Number of FishRelease and No. of Fish Hatchery HatcheryYear Ocean-Age Released Release Site Rearing Marks Harvested Returna Total
1990 B-II 13,416 Little Salmon HNFH CWT 10/42/32 9 9 181990 B-II 351,030 Little Salmon HNFH None 166 166 332
Subtotal 1,381,702 1,178 537 1,715
1989 B-III 15,624 East Fork MVSH CWT 10/41/44 0 0 01989 B-III 14,126 East Fork MVSH CWT 10/41/45 0 0 01989 B-III 14,314 East Fork MVSH CWT 10/41/46 0 0 01989 B-III 2,930 East Fork MVSH PIT1989 B-III 306,306 East Fork MVSH None 0 0 01989 B-III 14,939 East Fork HNFH CWT 10/41/32 0 0 01989 B-III 14,911 East Fork HNFH CWT 10/41/33 7 0 71989 B-III 13,719 East Fork HNFH CWT 10/41/34 0 0 01989 B-III 393,007 East Fork HNFH None 63 0 63
Subtotal 789,876 70 0 70
a Includes off-site escapement.b HNFH = Hagerman National Steelhead Hatchery.c Fall release of presmolts.d MVSH = Magic Valley Steelhead Hatchery.
30

Table 21. Adult steelhead collected from upper Salmon River tributaries, 1993.
Hatchery FishCollection Strain and Ocean-aqe Sex Total No. of Fish
Stream Date A-I A-II B-strain Male Female Hatchery Wild/NaturalSquaw (lower) 4/6 8 3 0 5 6 11 04/19 3 0 0 1 2 3 0Indian 4/6 5 3 0 6 2 8 14/19 1 3 1 3 2 5 0Owl 4/8 1 0 0 0 1 1 1Slate 4/12 1 0 0 0 1 1 0Hat 4/13 33 5 0 25 13 38 0Cow 4/13 16 0 0 10 6 16 0Warm Springs 4/13 9 1 0 6 4 10 0Morgan 4/16 20 11 1 15 17 32 0Challis 4/16 0 1 0 1 0 1 0Williams 4/17 19 4 0 15 8 23 0Iron 4/17 1 0 0 1 0 1 1Fourth of July 4/19 4 4 0 3 5 8 0Thompson 4/20 11 1 1 8 5 13 3Squaw (upper) 4/20 6 0 1 3 4 7 7Tower 4/21 0 1 0 1 0 1 0Salmon GolfCourse 4/21 2 1 0 1 2 3 04/27 0 1 0 1 0 1 0Carmen 4/22 20 11 3 18 16 34 0Rattlesnake 4/27 0 1 0 0 1 1 0
Total 160 51 7 123 95 218 13(%) (74) (23) (3) (56) (44) (94) (6)
H-TABLS
31

32
H-TABLS
Table 22. Coded wire tag (CWT) recoveries from upper Salmon River tributaries, 1993.
aPrecocial male with LV clip.
Recovery CWT Date Ocean- No. ofStream Datacode Recovered Release Site Strain age Fish
Carmen 10/43/24 4/22 SalmonR.
@ North Fork A I 110/43/25 4/27 Salmon @ North Fork A I 110/43/26 4/22 Salmon @ Ellis Bridge A I 110/43/27 4/22 Pahsimer R. A I 110/43/31 4/22 Salmon @ Ellis Bridge A I 1
Cow 10/43/30 4/13 Salmon R. @ Ellis Bridge A I 1Fourth of July 10/43/26 4/19 Salmon R. @ North Fork A I 1Hat 10/43/23 4/13 Pahsimeroi R. A I 1
10/43/24 4/13 Salmon R. @ Fork A I 110/43/27 4/13 Pahsimeroi R. A I 110/43/29 4/13 Salmon @ Ellis Bridge A I 210/43/30 4/13 Salmon @ Ellis Bridge A I 210/43/31 4/13 Salmon @ Ellis Bridge A I 2
Indian 10/40/59 4/19 Sawtooth Hatchery
A II 110/43/36 4/06 Sawtooth Hatcher
yA I 1
Morgan 10/42/36 4/16 East Salmon R. B II 110/43/30 4/16 Salmon R. @ Bridge A I 110/43/31 4/16 Salmon R. @ Bridge A I 110/43/34 4/16 Sawtooth A I 110/43/36 4/16 Sawtooth
HatcheryA I 1
Rattlesnake 10/40/58 4/27 East Fork Salmon R. B II 1Slate 10/43/33 4/12 Sawtooth Hatchery A I 1Squaw (lower) 10/43/30 4/19 Salmon
R.@ Ellis Bridge A I 1
Squaw (upper) 10/43/36 4/20 Sawtooth Hatchery A I 110/43/37 4/20 Sawtooth Hatchery A I 1
Thompson 10/15/30 4/20 Sawtooth Hatchery A 0 a 110/43/34 4/20 Sawtooth Hatchery A I 110/43/38 4/20 Sawtooth Hatchery A I 1
Warm Springs 10/43/31 4/13 SalmonR.
@ Ellis Bridge A I 2Williams 10/43/26 4/17 Salmon R. @ North Fork A I 1

9293LSRC 33
recovered the greatest distance from its release site. No adults from this taggroup entered the Sawtooth trap. From 42,878 A-strain steelhead with CWTsreleased at the Pahsimeroi Hatchery in 1991, 3 were recovered in tributaries and113 returned to the Pahsimeroi weir. From 56,379 CWT B-stain steelhead releasedin the East Fork Salmon River in 1990, we recovered 2 from tributaries and 19returned to the East Fork trap. The furthest downstream tributary recovery ofan East Fork CWT release was in Rattlesnake Creek, 101 km downstream from themouth of the East Fork Salmon River.
We also handled a large fish in Carmen Creek that was likely a B-strainfish released in the East Fork, but it did not have a left ventral clipsignifying a CWT. This recovery was 144 km downstream from the mouth of the EastFork Salmon River.
During our electrofishing survey in Thompson Creek on April 20, we observedseveral hundred smolts that were most likely from the release at SawtoothHatchery on April 7-9, 1993. We also collected a 37 cm precocial male from the1992 Sawtooth Hatchery release bearing tag code 10/15/30 (Table 22).
DISCUSSION
The number of adult steelhead that passed McNary Dam on the Columbia Riverin fall 1992 was the highest count of the last ten years (Table 23). Of the194,000 fish that passed McNary Dam, 10.20 were unaccounted for at Priest Rapidsand Ice Harbor dams. The 160,600 adults that passed Ice Harbor Dam was 30thigher than the previous year's number.
Harvest of Sawtooth Hatchery Releases
Returns of steelhead released from Sawtooth Hatchery in 1990 are nowcomplete. From a total release of 1,499,856 smolts, we estimated a return of7,030 adults after one ocean-year and 2,092 after two ocean-years. The totalreturn of 9,125 was 0.610 of the number released, and 820 of the adult returnswere harvested (Ball 1992b) (Table 20).
Adult returns from the 1991 Sawtooth Hatchery releases have returned aftertheir first ocean-year. From 1,344,499 smolts released, 5,768 (0.43%) returnedto the fishery and Sawtooth Hatchery (Table 20).
Harvest of East Fork Salmon River Releases
Beginning in 1989, progeny of East Fork and Dworshak stock parents weredivided into two groups approximately equal in number and time of release, markedwith CWTs, and released into the East Fork Salmon River. Smolts of East Forkstock were marked with tag codes 10/41/44, 10/41/45, and 10/41/46, and Dworshakstock smolts received CWTs 10/41/32, 10/41/33, and 10/41/34 (Table 20; AppendixB).
Adult returns from 353,300 East Fork stock and 436,576 Dworshak stock B-strain smolts released in 1989 were reported by Ball (1992a, 1992b). Oneadditional Dworshak stock fish returned after three ocean-years so the totalreturn of Dworshak stock fish was 449 fish (0.10%), of which 91% were harvested.The total return of East Fork stock was 705 fish (0.20%), of which 90W wereharvested. Anglers harvested one and one-half times more fish from this groupthan progeny of Dworshak stock.

34
Table 23. Difference between the number of steelhead passing McNary Damthat can be accounted for upriver at Ice Harbor and PriestRapids dams, 1983-92a.
No. of Fish (000's)
Fall ofYear
McNaryDam
IceHarborDam
PriestRapidsDam
Ice Harbor +Priest Rapids
Total Difference
1983 125.2 88.5 31.1 119.6 5.6 (4.5%)
1984 135.5 94.0 26.0 120.0 15.5 (11.4%)
1985 188.2 128.8 34.5 163.3 24.9 (13.2%)
1986 193.5 144.3 22.4 166.7 26.8 (13.9%)
1987 148.8 74.5 14.0 88.5 60.3 (40.5%)
1988 151.8 99.7 10.2 109.9 41.9 (27.6%)
1989 170.5 151.1 10.7 161.8 8.7 (5.1%)
1990 95.1 54.7 7.8 62.5 32.6 (34.3%)
1991 169.0 123.8 14.0 137.8 31.2 (18.5%)
1992 194.0 160.6 13.7 174.3 19.7 (10.2%)
a Totals from Army Corps of Engineers annual fish passage reports.

9293LSRC 35
From 988,350 smolts released in 1990, we estimated that 168 returned afterone ocean-year and 841 returned after two ocean-years (Ball 1992b) (Table 20).The total return to date is 1,009 (0.10%) adults, and 88% of these fish wereharvested.
There were 967,800 smolts released into the East Fork in 1991, and weestimated that 634 (0.07%) returned after one ocean-year.
Harvest of Little Salmon River Releases
Adult returns from 80,465 A-strain smolts and 392,812 B-strain smoltsreleased in 1990 are now complete. We estimated that 66 A-strain fish returnedafter one ocean-year and another 60 adults after two ocean-years. There were noone-ocean B-strain recoveries and 874 fish returned after two ocean-years. Thetotal return after two ocean-years of 126 A-strain fish (0.16%) includes anestimated 50% escapement past the fishery. The total return to date of 874 B-strain adults (0.22%) also includes an estimated 50% escapement past the fishery.
In 1991, there were 310,300 A-strain and 457,110 B-strain smolts releasedin the Little Salmon River as part of the LSRCP program. After one ocean-year,there were 386 returns from the A-strain release and 256 B-strain returns.
Harvest of Hammer Creek Releases
In addition to the Little Salmon River, there were LSRCP releases in 1991at the Hammer Creek Access below Whitebird. From 186,300 A-strain smoltsreleased, an estimated 232 adults returned after one ocean-year.
Harvest of Clearwater River Releases
In 1989, there were 399,496 steelhead smolts released into the ClearwaterRiver drainage from Hagerman National Fish Hatchery. The total return from thisrelease was an estimated harvest of 31 fish, and 4 returned to the adult trap atKooskia National Fish Hatchery.
Off-site Releases
Off-site releases (smolt releases into the river or into tributarieswithout means or attempts to collect spawning adults) is a technique employed todistribute the harvest and put more hatchery fish into anglers' creels. LowerSalmon River harvest areas are corridors for all fish destined upriver, but havebeen unable to sustain a viable fishery after upriver fish have passed.
Releases into Hammer Creek during 1991 did not contain any CWTs, so harvestdistribution was not ascertained. Adult returns were estimated from theperformance of CWT groups released in Little Salmon River. In 1990, smoltreleases at Ellis Bridge and near the mouth of the North Fork Salmon River werealso without representative mark groups. Adult returns were estimated frommarked groups released nearby. Again in 1991, releases at Pahsimeroi and ShoupBridge were also without representative mark groups. Returns were estimated byusing CWT groups reared by Idaho Power's steelhead mitigation program andreleased at the Pahsimeroi Hatchery.

9293LSRC 36
In 1988, evaluation of in-river releases began with marked fish releasesat Shoup Bridge, about 8 km upstream of the city of Salmon. There were no markedLSRCP releases that year, but estimated returns were derived from a companiongroup of marked fish from Niagara Springs Fish Hatchery (Ball 1992b). In 1989,all the in-river releases, both marked and unmarked, were reared at NiagaraSprings Fish Hatchery (Appendix C). In 1990, the fish released at Shoup Bridgewere LSRCP-reared fish from Hagerman National Fish Hatchery. From 45,828 markedfish released, anglers harvested an estimated 73 fish (Table 20). The harvestrate of 0.15% after one ocean-year is slightly higher than the 0.129
6- reported forthe 1988 release after two ocean-years (Ball 1992b). More than half of theharvest was taken from section 15 (Appendix B). The relatively small harvestfrom near the release site may be due to the change in river morphology duringsuccessive drought years since 1986. The stream reach below the Shoup Bridgerelease site has less holding water for fish since the drought began.
Although no marked LSRCP fish were released in the Salmon River at NorthFork or Ellis Bridge, there has been an increase in both effort and harvest nearthese release sites. Both of these reaches have large, long pools downstream oftheir release sites. Harvested numbers of CWT fish raised by IPC and releasedat North Fork and Ellis Bridge are reported in Appendix B. Performance of thesegroups, especially the North Fork release, illustrates the value of off-sitereleases as a tool to improve harvest opportunity and angler distribution.
Hatchery Straying
Adult steelhead returning to Idaho rivers in the fall are several monthsaway from spawning and commonly wander into streams other than where they werereleased. It is not unusual for these wandering fish to spend time in one ormore rivers that are not their natal or release drainage. Adults observed orharvested during the wandering phase should not be considered strays. Themajority of them would eventually return to their natal stream, hatchery, orrelease site.
In 1993, there were 871 CWTs recovered from hatchery steelhead at hatcheryracks in Idaho. Additionally, National Marine Fisheries Service (NMFS) personnelmark smolts with CWTs during their downriver outmigration. These smoltsoriginate from throughout the Snake River drainage and may be encountered asreturning adults. However, in 1993, no NMFS-tagged fish returned to Idahohatchery racks.
There were three strays of LSRCP fish tagged by Washington that werecollected at Dworshak National Fish Hatchery. Two were from releases in theTucannon River (63/08/38 and 63/39/12) and one was from a Lyons Ferry Hatcheryrelease (63/14/21). Straying rates for these groups were reported by Washington.
Off-site releases that return to areas without spawning gravel may enterhatchery racks and are included in the number of CWTs recovered there. In 1993,there were seven CWTs recovered at the Pahsimeroi Hatchery from the off-siterelease at Ellis Bridge. Four fish from the off-site release at North Fork alsoentered the Pahsimeroi trap. Although technically these marked fish strayed fromtheir release location, we are not including them in this straying evaluationbetween hatchery racks.
Of the 857 CWTs recovered from hatchery releases in the Salmon Riverdrainage, only two fish (0.23) strayed. One IPC-reared fish was tagged with CWT10/43/23 and released at the Pahsimeroi Hatchery in 1991. It returned to thetrap at the East Fork Salmon River. One additional fish released at thePahsimeroi Hatchery strayed to the hatchery rack at Hells Canyon Dam on the SnakeRiver. This year's straying rate is similar to the range of straying rates (0.2-0.6%) reported since 1985 (Ball 1986, 1988, 1989, 1990, 1992a, 1992b).

9293LSRC 37
Furthermore, there is very little variation between years and little or no changeover time in the years we have been calculating straying rates between hatcheryracks.
Tributary Straying
Electrofishing surveys in 1993 were qualitative and should not beconsidered a reflection of straying rates of either hatchery or off-sitereleases. In addition to tributary spawning, fish released from hatchery rackswere also spawning in the river below their release sites. This is especiallyevident in the upper Salmon River downstream from Sawtooth. A true quantitativeanalysis of straying would require weirs and very intensive electrofishingsurveys over many miles of a large number of streams. The amount of straying,and possibly the distribution of steelhead, could be a function of lower flowsand higher water temperatures during a drought cycle which began in 1987.
Straying between hatchery releases as documented by CWTs has beenconsistently low, but it is not a good indication of the number of adultsteelhead straying into tributary streams (Ball 1986, 1989, 1992a, 1992b). Evenwithout a quantitative straying analysis, it appears that a much largerproportion of adults are spawning in tributaries than stray to a hatchery rackother than where they were released.
Although we handled a small number of wild-natural steelhead, their timeof arrival into the tributaries corresponds closely with hatchery fish. Bothgroups of fish enter the streams when males are ripe and females are gravid.Spawning begins soon after entry into the streams and the fish leave whenspawning is complete. Males may return to the river and then return to thetributary with another female. We did not attempt to document contribution ofhatchery steelhead to natural production in these tributaries.
Sources of Error.
The primary sources of error involved in the steelhead harvest estimateshave been discussed previously by Ball (1986), as well as the quality control ofadipose clipping (Ball 1989).
Left ventral fin clips, which are used on steelhead to identify thepresence of CWTs, may regenerate but nonetheless leave the fin deformed. Sincethere is a high proportion of hatchery fish with deformed fins from their lifein the hatchery, we attempt to take snouts from all fish with deformed leftventral fins. Although we take additional snouts with these methods, we shouldnot be missing very many CWTs. Spot checks at hatcheries with portable CWTdetectors have confirmed that our methods detect greater than 98% of CWT fish.
The number of marked fish in each release group and the number of groupsreleased each depend on many factors, but generally have been adjusted to produceadequate adult returns under average conditions. Several consecutive low wateryears and poor migration survival of both juveniles migrating downstream andadults returning upstream have resulted in several poor steelhead runs in theSalmon River. Consequently, the chance of recovering marked fish becomes verylow and the accuracy of return information diminishes. Harvest patterns,exploitation rates, age at return, and other reasonably stable statistics havebeen aberrant.

9293LSRC 38
It is impossible to predict when poor migration conditions will occur inorder to mark more fish to compensate for poor survival. The reasoning to markenough fish with average return expectations is still sound, but may not producesufficient results in very low return years.
RECOMMENDATIONS
Continue to include coded wire tags in each major smolt release that arerepresentative in size, time of release, and fish health.
Continue to evaluate rate of return, contribution to the sport fishery, anddistribution of adults returning from off-site releases.
Set up check stations in Salmon River Sections 17 and 18 to improvemanpower efficiency and to increase the number of fish checked.
Survey upper Salmon River tributaries to document presence or absence ofoff-site releases.
Formulate a marking program for PIT tag evaluation of adult returns toLower Granite Dam.
Move Shoup Bridge off-site release downstream to mouth of Lemhi River.

9293LSRC 39
ACKNOWLEDGEMENTS
Marsha White and Ellen Smith assisted with data compilation and wordprocessing. Vicki Feucht provided data from coded wire tags. Ralph Rosebergprovided data from Dworshak National Fish Hatchery. Tom McArthur producedstatewide harvest estimates. Mark Schuck and Art Viola, Washington Departmentof Fish and Wildlife, cooperated with data collection and compilation for theSnake River. The cover photo was contributed by Marsha White.

9293LSRC 40
LITERATURE CITED
Ball, K. 1986. Evaluation of hatchery-wild steelhead harvest, December 1, 1984to September 30, 1985. U.S. Fish and Wildlife Service Lower Snake RiverCompensation Plan, Contract No. 14-16-0001-85607 (RWG). Idaho Departmentof Fish and Game, Boise.
Ball, K. 1989. Evaluation of hatchery-wild steelhead harvest, October 1, 1986to December 31, 1987. U.S. Fish and Wildlife Service Lower Snake RiverCompensation Plan, Contract No. 14-16-0001-87501 (RWG). Idaho Departmentof Fish and Game, Boise.
Ball, K. 1992a. Evaluation of hatchery-wild composition of Idaho salmon andsteelhead harvest, October 1, 1989 to December 31, 1990. U.S. Fish andWildlife Service Lower Snake River Compensation Plan, Contract No. 14-16-0001-89501 (RWG). Idaho Department of Fish and Game, Boise.
Ball, K. 1992b. Evaluation of hatchery-wild composition of Idaho salmon andsteelhead harvest, October 1, 1990 to December 31, 1991. U.S. Fish andWildlife Service Lower Snake River Compensation Plan, Contract No. 14-16-0001-89501 (RWG). Idaho Department of Fish and Game, Boise.
Ball, K. 1994. Evaluation of hatchery-wild composition of Idaho salmon andsteelhead harvest, October 1, 1991 to December 31, 1992. U.S. Fish andWildlife Service Lower Snake River Compensation Plan, Idaho Department ofFish and Game, Boise.
U.S. Army Corps of Engineers, North Pacific Division. 1992. 1991 Annual FishPassage Report, Columbia and Snake rivers for salmon, steelhead, and shad.U.S. Army Engineer Districts, Portland and Walla Walla.

A P P E N D I C E S
9293LSRC 41

Appendix A. Total number of steelhead by section and month harvested byresident and nonresident anglers, fall 1992 and spring 1993a.
Fall 1992 Steelhead HarvestRiver
Section September October November December Total
01 133 912 1,727 584 3,35602 9 434 638 239 1,319
SnakeTotals 142 1,346 2,364 824 4,675
03 177 2,984 3,870 1,346 8,377
04 9 283 310 115 717
05 0 71 434 177 682
06 9 9 26 18 62
07 18 0 44 0 62
ClearwaterTotals 213 3,347 4,684 1,656 9,900
10 35 868 434 151 1,488
11 0 514 522 115 1,151
12 0 328 416 53 797
13 0 142 168 9 319
14 9 859 744 53 1,665
15 0 2,176 1,851 204 4,231
16 9 283 363 27 381
17 0 53 160 0 213
18 0 53 9 0 62
19 0 79 18 0 97
20 0 44 89 9 142
SalmonTotals 53 5,401 4,773 620 10,847
Oxbow 0 213 177 239 619
Boise 0 0 18 0 18
Payette 0 9 18 18 44
Statewide 407 10,316 12,034 3,356 26,113Totals
42

43
Appendix A. Continued.
Spring 1993 SteelheadRiver
Section Januar February March April Total
01 410 159 91 45 705
02 102 34 34 34 205
SnakeTotals 512 193 125 80 910
03 1,456 2 ,228 1 ,672 193 5 ,549
04 171 477 421 80 1,149
05 250 353 967 307 1 ,877
06 45 0 137 57 239
07 11 102 102 422' 637
ClearwaterTotals 1,933 3 ,162 3 ,298 1 ,058 9 ,451
10 159 216 182 23 580
11 227 274 136 159 796
12 0 205 68 159 432
13 0 0 68 34 102
14 45 34 68 115 262
15 91 239 956 159 1,445
16 34 57 160 45 296
17 11 34 489 490 1 ,024
18 0 23 387 386 796
19 57 0 205 909 1,171
20 0 205 125 751 1,080
SalmonTotals 626 1 ,285 2,843 3 ,230 7 ,984
Oxbow 57 34 0 91 182
Boise 0 0 11 11 22
Payette 0 0 0 0 0
StatewideTotals 3,128 4 ,674 6 ,278 4 ,470 18,550
a Statewide harvest survey data (unpublished).

Total estimated harvest 93
Appendix B. Coded wire tag recoveries and fin clips identified September 1992 - April 1993; harvestestimates by month and river section; and total harvest estimates for the 1992-93 season.
TAG CODE - 05/20/44 RELEASE SITE - North Fork Clearwater R. NUMBER RELEASED - 20,016
September October November DecemberNo. Sample Est. No. Sample Est. No. Sample Est. No. Sample Est.
River Section Taqs Rate Harv. Taqs Rate Hary Taqs Rate Harv. Taqs Rate Harv.01
03/05 1 0.077 13 1 0.061 1604/06071011121314151617
January February March April 1992-93No. Sample Est. No. Sample Est. No. Sample Est. No. Sample Est. No. Est.
River Section Taqs Rate Harv. Taqs Rate Harv. Taqs Rate Hary Taqs Rate Harv. Taqs Harv. 0103/05 1 0.053 19 2 0.086 23 2 0.091 22 7 9304/06071011121314151617181920
44

A
T
R
45
ppendix B. Continued.
AG CODE - 05/20/45 RELEASE SITE - North Fork Clearwater R. NUMBER RELEASED - 19,797
September October November DecemberNo. Sample Est. No. Sample Est. No. Sample Est. No. Sample Est.
iver Section Tags Rate Harv. Tags Rate Hary Tags Rate Harv. Tags Rate Harv.01
03/0504/06
071011121314151617
January FebruaryNo. Sample Est. No. Sample Est.
River Section Tags Rate Harv. Tags Rate Hary 0103/05 1 0.060 17 1 1704/06
071011121314151617181920
Total estimated harvest 17
March April 1992-93No. Sample Est. No. Sample Est. No. Est.
Tags Rate Harv. Tags Rate Harv. Tags Harv.

Total estimated harvest 84
Appendix B. Continued.
TAG CODE - 05/20/47 RELEASE SITE - North Fork Clearwater R. NUMBER RELEASED - 21,290
September October November DecemberNo. Sample Est. No. Sample Est. No. Sample Est. No. Sample Est.
River Section Tags Rate Harv. Tags Rate Harv. Tags Rate Harv. Tags Rate Harv.01
03/05 2 0.061 33 1 0.060 1704/06071011121314151617
January February March April 1992-93No. Sample Est. No. Sample Est. No. Sample Est. No. Sample Est. No. Est.
River Section Tags Rate Hary Tags Rate Harv. Tags Rate Hary Tags Rate Harv. Tags Hazy. 0103/05 2 0.086 23 1 0.091 11 6 8404/0607 1011 1213 1415 1617 1819 20
46

Total estimated harvest 95
Appendix B. Continued.
TAG CODE - 05/20/48 RELEASE SITE - North Fork Clearwater R. NUMBER RELEASED - 20,888
September October November DecemberNo. Sample Est. No. Sample Est. No. Sample Est. No. Sample Est.
River Section Tags Rate Harv. Tags Rate Hary Tags Rate Harv. Tags Rate Harv.01 1 0.110 9
03/05 4 0.077 5204/06
071011121314151617
January February March April 1992-93No. Sample Est. No. Sample Est. No. Sample Est. No. Sample Est. No. Est.
River Section Tags Rate Harv. Tags Rate Harv. Tags Rate Harv. Tags Rate Harv. Tags Harv.01 1 9
03/05 2 0.086 23 1 0.091 11 7 8604/06
071011121314151617181920
47

Total estimated harvest 174
Appendix B. Continued.
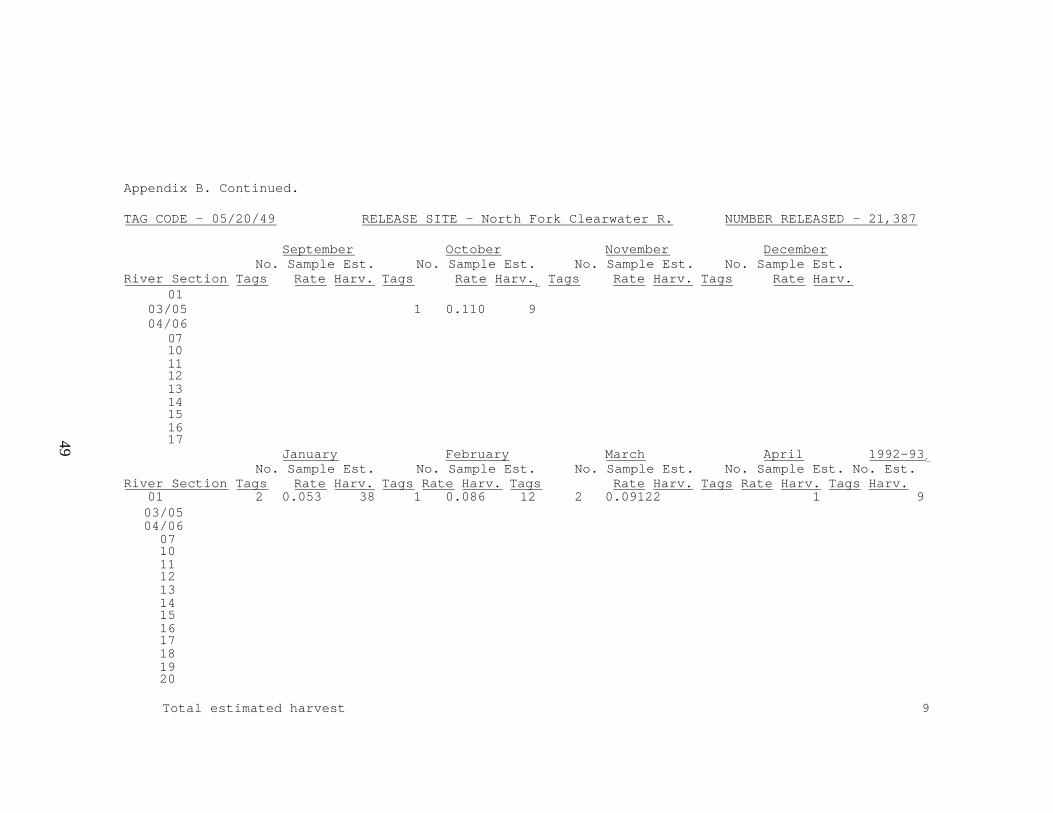
TAG CODE - 05/20/49 RELEASE SITE - North Fork Clearwater R. NUMBER RELEASED - 21,387
September October November DecemberNo. Sample Est. No. Sample Est. No. Sample Est. No. Sample Est.
River Section Tags Rate Harv. Tags Rate Harv., Tags Rate Harv. Tags Rate Harv.01
03/05 4 0.077 52 2 0.061 33 1 0.060 1704/06
071011121314151617
January February March April 1992-93,No. Sample Est. No. Sample Est. No. Sample Est. No. Sample Est. No. Est.
River Section Tags Rate Harv. Tags Rate Harv. Tags Rate Harv. Tags Rate Harv. Tags Harv. 0103/05 2 0.053 38 1 0.086 12 2 0.091 22 12 17404/06
071011121314151617181920
48
Appendix B. Continued.
TAG CODE - 05/20/49 RELEASE SITE - North Fork Clearwater R. NUMBER RELEASED - 21,387
September October November DecemberNo. Sample Est. No. Sample Est. No. Sample Est. No. Sample Est.
River Section Tags Rate Harv. Tags Rate Harv., Tags Rate Harv. Tags Rate Harv.01
03/05 1 0.110 904/06
071011121314151617
January February March April 1992-93,No. Sample Est. No. Sample Est. No. Sample Est. No. Sample Est. No. Est.
River Section Tags Rate Harv. Tags Rate Harv. Tags Rate Harv. Tags Rate Harv. Tags Harv.01 2 0.053 38 1 0.086 12 2 0.09122 1 903/0504/06
071011121314151617181920
Total estimated harvest 9
49

Total estimated harvest 9
Appendix B. Continued.
TAG CODE - 07/51/20 RELEASE SITE - Wallowa R. @ Spring Cr. NUMBER RELEASED - 26,347
September October November DecemberNo. Sample Est. No. Sample Est. No. Sample Est. No. Sample Est.
River Section Tags Rate Harv. Tags Rate Hary Tags Rate Harv. Tags Rate Harv.01 1 0.110 9
03/0504/06071011121314151617
January February March April 1992-93No. Sample Est. No. Sample Est. No. Sample Est. No. Sample Est. No. Est.
River Section Tags Rate Harv. Tags Rate Harv. Tags Rate Hary Tags Rate Harv. Tags Harv. 01 1 903/0504/06071011121314151617181920
50

Total estimated harvest 9
Appendix B. Continued.
TAG CODE - 07/51/21 RELEASE SITE - Wallowa R. C Spring Cr. NUMBER RELEASED - 26,473
DecemberNovemberOctoberSeptemberNo.
River Section TagsSample Est.Rate Harv.
No.Tags
Sample Est.Rate Harv.
No.Tags
Sample Est.Rate Harv.
No.Tags
Sample Est.Rate Harv.
01 1 0.110 903/0504/06
071011121314151617
January February March April 1992-93No. Sample Est. No. Sample Est. No. Sample Est. No. Sample Est. No. Est.
River Section Tags Rate Harv. Tags Rate Harv. Tags Rate Harv. Tags Rate Harv., Tags Harv.01 1 903/0504/06071011121314151617181920
51

Total estimated harvest 24
Appendix B. Continued.
TAG CODE - 07/51/22 RELEASE SITE - Wallowa R. @ Spring Cr. NUMBER RELEASED - 26,771September October November December
No. Sample Est. No. Sample Est. No. Sample Est. No. Sample Est.River Section Tags Rate Harv. Taqs Rate Harv. Tags Rate Harv. Tags Rate Harv.
01 1 0.110 9 1 0.065 1503/0504/06071011121314151617
January February March April 1992-93No. Sample Est. No. Sample Est. No. Sample Est. No. Sample Est. No. Est.
River Section Taqs Rate Harv. Tags Rate Harv. Taqs Rate Hary Tags Rate Harv. Tags Harv.01 2 24
03/0504/06071011121314151617181920
52

Appendix B. Continued.
TAG CODE - 07/53/57 RELEASE SITE - Imnaha R. @ Little Sheep Cr. NUMBER RELEASED - 24,282
September October November DecemberNo.
River Section TagsSample Est.Rate Harv.
No.Tags
Sample Est.Rate
No.Tags
Sample Est.Rate Hary
No.Tags
Sample Est.Rate Harv.
01 1 0.110 9 1 0.065 1503/05 1 0.062 1604/06071011 1 0.154 6121314151617
January February March April 1992-93No. Sample Est. No. Sample Est. No. Sample Est. No. Sample Est. No. Est.
River Section Tags Rate Hary Tags Rate Harv. Tags Rate Harv. Tags Rate Harv. Tags Harv.01 2 24
03/05 1 1604/06
071011 1 6121314151617181920
Total estimated harvest 46
53

54
Appendix B. Continued.
TAG CODE - 07/54/43 RELEASE SITE - Wallowa R. @ Spring Cr. NUMBER RELEASED - 28,815September October November December
No. Sample Est. No. Sample Est. No. Sample Est. No. Sample Est.River Section Tags Rate Harv. Tags Rate Harv. Tags Rate Harv. Tags Rate Harv.
01 1 0.065 1503/0504/06071011121314151617
January FebruaryNo. Sample Est. No. Sample Est.
River Section Tags Rate Harv. Tags Rate Hary 01
03/0504/06071011121314151617181920
Total estimated harvest 15
March April 1992-93No. Sample Est. No. Sample Est. No. Est.
Tags Rate Harv. Tags Rate Harv. Tags Harv.1 15

000
55
Appendix B. Continued.
TAG CODE - 07/54/44 RELEASE SITE - Wallowa R. @ Spring Cr. NUMBER RELEASED - 28,738
September October November DecemberNo.
River Section TagsSample Est.Rate Hary
No.Taps
Sample Est.Rate Harv.
No.Tags
Sample Est.Rate Hary
No.Tags
Sample Est.Rate Harv.
01 1 0 110 903/0504/06
071011121314151617
January February March April 1992-93No. Sample Est. No. Sample Est. No. Sample Est. No. Sample Est. No.
River Section Tags Rate Harv. lags Rate Harv. Tags Rate Hary Tag Ra e Harv. Tags13/054/06071011121314151617181920
Total estimated harvest
1 9
9

AT
R
R0
56
ppendix B. Continued.AG CODE - 10/40/58 RELEASE SITE - East Fork Salmon R. NUMBER RELEASED - 40,905
September October November DecemberNo. Sample Est. No. Sample Est. No. Sample Est. No. Sample Est.
iver Section Tags Rate Harv. Tags Rate Harv. Taqs Rate Hary Taqs Rate Harv.01
03/0504/06
071011 3 0.154 1912 1 0.284 413 1 0.218 514 3 0.433 715 4 0.258 16 1 0.298 316 1 0.177 617
January FebruaryNo. Sample Est. No. Sample Est.
iver Section Taqs Rate Harv. Taqs Rate Hary1
03/05
04/06071011121314151617181920 1 0.243 4 1 4
Total estimated harvest 66
March April 1992-93No. Sample Est. No. Sample Est. No. Est.
Tags Rate Harv. Tags Rate Harv. Tags Harv.
1 0.456 2
3 191 41 53 76 211 6

Appendix B. Continued.
TAG CODE - 10/40/59 RELEASE SITE - Sawtooth Hatchery NUMBER RELEASED - 30,620
September October November DecemberNo. Sample Est. No. Sample Est. No. Sample Est. No. Sample Est.
River Section Tags Rate Harv. Tags Rate Hary lags Rate Harv. Tags Rate Harv.01
03/0504/06071011121314 1 0.149 7 2 0.433 515 1 0.258 4 1 .0.298 31617
January FebruaryNo. Sample Est. No. Sample Est.
River Section Tags Rate Harv. Tags Rate Hary
March April 1992-93No. Sample Est. No. Sample Est. No. Est.
Tags Rate Harv. Tags Rate Harv. Tags Harv.01
03/0504/06071011121314 3 1215 1 0.456 2 3 91617 1 0.051 20 1 2018 1 0.399 3 1 319 2 0.229 9 2 920
Total estimated harvest 53
57

A
T
R
58
ppendix B. Continued.
AG CODE - 10/41/33 RELEASE SITE - East Fork Salmon R. NUMBER RELEASED - 14,911,
September October November DecemberNo. Sample Est. No. Sample Est. No. Sample Est. No. Sample Est.
iver Section Tags Rate Harv. Tags Rate Harv. Tags Rate Hary Tags Rate Harv.01
03/0504/0607 1011 121314 1 0.149 7151617
JanuaryNo. Sample Est. No.
River Section Taqs Rate Hary Tags 0103/0504/06071011121314 1 7151617181920
Total estimated harvest 7
February March April 1992-93Sample Est. No. Sample Est. No. Sample Est. No. Est.Rate Harv. Tags Rate Harv. Tags Rate Harv. Tags Hazy.

T
R
R
59
Appendix B. Continued..
AG CODE - 10/42/14 RELEASE SITE - Sawtooth Hatchery NUMBER RELEASED - 14,597
November DecemberOctoberSeptemberNo.
iver Section TagsSample Est.Rate Harv.
No.Tag
Sample Est.Rate Harv.
No.Tags
SampleEst.
No.Tag
Sample Est.Rate
0103/0504/06
071011121314151617
1 0.298
March April 1992-93FebruaryJanuaryNo.
iver Section TagsSample Est.
RateNo.Tag
Sample Est.Rate
No.Tags
SampleEst.
No.Tag
SampleRate
Est.Harv.
No. Est.Tags
0103/0504/06
07101112131415 1 316171819 2 0.229 9 2 920
Total estimated harvest 12

Total estimated harvest 33
Appendix B. Continued.
TAG CODE - 10/42/15RELEASE SITE - Sawtooth Hatchery NUMBER RELEASED - 15,482
September October November DecemberNo. Sample Est. No. Sample Est. No. Sample Est. No. Sample Est.
River Section Tags Rate Hary Tags Rate Harv. Tags Rate Harv. Tags Rate Harv.01
03/0504/06071011121314 3 0.149 2015 4 0.298 131617
January February March April 1992-93No. Sample Est. No. Sample Est. No. Sample Est. No. Sample Est. No. Est.
River Section Tags Rate Harv. Tags Rate Hary Tags Rate Hary Tags Rate Harv. Tags Harv. 0103/0504/06071011121314 3 2015 4 131617181920
60

61
Appendix B. Continued.
TAG CODE - 10/42/16 RELEASE SITE - Sawtooth Hatchery NUMBER RELEASED - 15,218
September October November DecemberNo. Sample Est. No. Sample Est. No. Sample Est. No. Sample Est.
River Section Tags Rate Harv. Taqs Rate Harv. Tags Rate Harv. Taqs Rate Harv.01
03/0504/06
071011121314151617
No.River Section Taqs
0103/0504/06
071011121314151617181920
Total estimated harvest 3
1 0.298 3
January February March April 1992-93Sample Est. No. Sample Est. No. Sample Est. No. Sample Est. No. Est.Rate Hary Tags Rate Harv. Tags Rate Harv. Tags Rate Harv. Tags Harv.
1 3

Appendix B. Continued.
R. RELEASED - 14,339TAG CODE - RELEASE SITE - Pahsimeroi NUMBER
OctoberSeptember November December
River SectionNo.
TaqsSampleRate
Est.Harv.
No.Taq
No.Taqs
SampleRate
Est.Harv.
No.Tags
SampleRate
Est.Harv.
0103/0504/06
071011121314151617
Sample Est.Rate Harv.
January February March April 1992-93No. Sample Est. No. Sample Est. No. Sample Est. No. Sample Est. No. Est.
River Section Tags Rate Harv. Tags Rate Harv. Taqs Rate Harv. Tags Rate Harv. Tags Harv.01
03/0504/06
071011121314151617 1 0.465 2 1 2181920
Total estimated harvestharvest
2
62

T
R
R
63
Appendix Continued.
AG CODE - 10/42/25 RELEASE SITE - Little Salmon R. NUMBER RELEASED - 15,004
OctoberSeptember November DecemberNo.
iver Section TagsSample Est.
RateNo.
TagsSample Est.Rate Harv.
No.Tag
s
Sample Est.Rate
No.Tag
s
Sample Est.Rate Harv.
0103/0504/06
071011 1 0.154 612 1 0.284 41314151617
January February March April 1992-93No. Sample Est. No. Sample Est. No. Sample Est. No. Sample Est. No. Est.
iver Section Tags Rate Harv. Tag Rate Harv. Tags Rate Harv. Tags Rate Harv. Tags01
03/0504/06071011 1 612 1 41314151617181920
To t a l estimated harvest 10

Appendix B. Continued.
TAG CODE - 10/42/26 RELEASE SITE - Little Salmon R. NUMBER RELEASED - 15,250
October November DecemberSeptemberNo.
River Section TaqsSample Est.
RateNo.Taq
Sample Est.Rate
No.Taqs
Sample Est.Rate
No.Taq
Sample Est.Rate Harv.
0.232 4
0.298 3
March April 1992-93
0103/0504/06
0710
Sample Est.Rate
Sample Est.Rate
Sample Est.Rate
SampleRate
Est. No. Est.Harv. Taqs
0103/0504/060710111213 1 41415 1 31617181920
Total estimated harvest 7
64

Appendix B. Continued.
TAG CODE - 10/42/28 RELEASE SITE - Salmon R. @ Shoup Bridge NUMBER RELEASED - 15,196
October November DecemberSeptemberNo.
River Section TagsSample Est.
RateNo.
TagsSample Est.
RateNo.Tag
Sample Est.Rate Harv.
No.Tag
Sample Est.Rate Harv.
0103/0504/06
0.258 4
February
0.433
March
0710111213
Sample Est.Rate Harv.
Sample Est.RateHarv
1
SampleRate
2
SampleRate
Est.No. Est.
Harv. Tags01
03/0504/06071011121314 1 215 1 0.456 2 2 61617181920
Total estimated harvest 8
65

Total estimated harvest 9
Appendix B. Continued.
TAG CODE - 10/42/29 RELEASE SITE - Salmon R. @ Shoup Bridge NUMBER RELEASED - 15,104
September October November DecemberNo. Sample Est. No. Sample Est. No. Sample Est. No. Sample Est.
River Section Taqs Rate Harv. Taqs Rate Hary Taqs Rate Harv. Tags Rate Harv._01 03/0504/06
07101112 1 0.284 4131415 1 0.298 31617
January February March April 1992-93No. Sample Est. No. Sample Est. No. Sample Est. No. Sample Est. No. Est.
River Section Taqs Rate Harv. Taqs Rate Harv. Tags Rate Harv. Taqs Rate Harv. Taqs Harv.01
03/0504/0607101112 1 4131415 1 0.456 2 2 51617181920
66

Total estimated harvest 258
Appendix B. Continued.
TAG CODE - 10/42/30 RELEASE SITE - Little Salmon R. NUMBER RELEASED - 14,841
September October November DecemberNo. Sample Est. No. Sample Est. No. Sample Est. No. Sample Est.
River Section Tags Rate Harv. Tags Rate Harv. Tags Rate Harv. Tags Rate Harv.01
03/0504/06
071011121314151617
January February March April 1992-93No. Sample Est. No. Sample Est. No. Sample Est. No. Sample Est. No. Est.
River Section Tags Rate Hary Tags Rate Harv. Tags Rate Hary Tags Rate Harv. Tags Harv.01
03/0504/06
071011 1 0.004 250 1 250121314151617181920 2 0.243 8 2 8
67

Total estimated harvest 4
Appendix B. Continued.
TAG CODE - 10/42/31
SeptemberNo. Sample Est.
River Section Tags Rate Hary 0103/0504/06071011121314151617
January February March April 1992-93No. Sample Est. No. Sample Est. No. Sample Est. No. Sample Est. No. Est.
River Section Tags Rate Harv. Tags Rate Harv. Tags Rate Harv. Tags Rate Harv. Tags Harv.01
03/0504/06071011121314151617181920 1 0.243 4 1 4
RELEASE SITE - Little Salmon R. NUMBER RELEASED - 14,065
October November DecemberNo. Sample Est. No. Sample Est. No. Sample Est. Tags Rate
Harv. Tags Rate Harv. Tags Rate Harv.
68

A
T
R
R
69
ppendix B. Continued.
AG CODE - 10/42/32,
SeptemberNo. Sample Est.
iver Section Tags Rate Hary01
03/0504/06071011121314151617
JanuaryNo. Sample Est.
iver Section Tags Rate Hary01
03/0504/06071011121314151617181920
Total estimated harvest
RELEASE SITE - Little Salmon R. NUMBER RELEASED - 13,416
October November DecemberNo. Sample Est. No. Sample Est. No. Sample Est. Tags Rate
Harv. Tags Rate Harv. Tags Rate Harv.
1 0.201 5
February March April 1992-93No. Sample Est. No. Sample Est. No. Sample Est. No. Est.
Tags Rate Harv. Tags Rate Hary Tags Rate Harv. Tags Harv.
1 5
1 0.243 4 1 4
9

Total estimated harvest 2
Appendix B. Continued.
TAG CODE - 10/42/33 RELEASE SITE - East Fork Salmon R. NUMBER RELEASED - 14,964
September October November DecemberNo. Sample Est. No. Sample Est. No. Sample Est. No. Sample Est.
River Section Tags Rate Harv. Tags Rate Hary Tags Rate Harv. Tags Rate Harv.01 03/0504/06
071011121314 1 0.433 2151617
January February March April 1992-93No. Sample Est. No. Sample Est. No. Sample Est. No. Sample Est. No. Est.
River Section Tags Rate Harv. Tags Rate Harv. Tags Rate Hary Tags Rate Harv. Tags Harv.01
03/0504/06071011121314 1 2151617181920
70

AT
R
0
R
71
ppendix B. Continued.AG CODE - 10/42/34 RELEASE SITE -East Fork Salmon R. NUMBER RELEASED - 15,157
September October November DecemberNo. Sample Est. No. Sample Est. No. Sample Est. No. Sample Est.
iver Section Tags Rate Hary Taqs Rate Harv. Tags Rate Hary Tags Rate Harv.01
3/0504/06071011121314151617
January FebruaryNo. Sample Est. No. Sample Est.
iver Section Tags Rate Harv. Tags Rate Hary 0103/0504/0607101112131415161718 1 0.399 3 1 31920Total estimated harvest 58
1 0.201 5
March April 1992-93No. Sample Est. No. Sample Est. No. Est.
Taqs Rate Harv. Tags Rate Harv. Tags Harv.
1 48
1 5
1 0.456 2 1 2
1 0.021 48

72
Appendix B. Continued.
TAG CODE - 10/42/35 RELEASE SITE - East Fork Salmon R. NUMBER RELEASED - 14,642
September OctoberNo. Sample Est. No. Sample Est.
River Section Tags Rate Harv. Tags Rate Hary01
03/0504/0607101112 1 0.284 41314151617
January FebruaryNo. Sample Est. No. Sample Est.
River Section Tags Rate Harv. Tags Rate Hary 0103/0504/06071011121314151617181920
Total estimated harvest
November DecemberNo. Sample Est.No. Sample Est. Tags Rate Harv.
Tags Rate Harv.
March April 1992-93No. Sample Est. No. Sample Est. No. Est.
Tags Rate Harv. Tags Rate Harv. Tags Harv.
1 41 0.206 5 1 5
9

Appendix B.Continu
TAG CODE - 10/42/36 RELEASE SITE - East Fork Salmon R. NUMBER RELEASED - 15,474
September October November DecemberNo.River Section Taqs
Sample Est.Rate
No.Taqs
Sample Est.Rate Hary
No.Taqs
Sample Est.Rate Harv.
No.Taqs
Sample Est.Rate Harv.01 1 0.316 3
03/0504/06
071011 1 0.154 612 1 0.238 41314151617
January February March April 1992-93No. Sample Est. No. Sample Est. No. Sample Est. No. Sample No. Est.
River Section Taqs Rate Harv. Taqs Rate Harv. Tags Rate Harv. Taqs Rate Tags Harv.
01 1 303/05 104/06071011 1 612 1 4131415 1 0.456 2 1 21617 1 0.465 2 1 218 1 0.399 3 1 31920
Total estimated harvest 20
73

Total estimated harvest 21
Appendix B. Continued.
TAG CODE - 10/42/37 RELEASE SITE - East Fork Salmon R. NUMBER RELEASED - 15,971
September October November DecemberNo. Sample Est. No. Sample Est. No. Sample Est. No. Sample Est.
River Section Tags Rate Harv. Tags Rate Harv. Tags Rate Hary Tags Rate Harv.01
03/0504/06071011121314 3 0.433 715 3 0.258 4 1 0.298 31617
January February March April 1992-93No. Sample Est. No. Sample Est. No. Sample Est. No. Sample Est. No. Est.
River Section Tags Rate Harv. Tags Rate Harv. Tags Rate Harv. Tags Rate Harv. Tags Harv.01
03/0504/06071011121314 3 715 1 0.456 2 5 9161718 2 0.399 5 2 51920
74

Total estimated harvest 21
Appendix B. Continued.
TAG CODE - 10/42/38 RELEASE SITE - East Fork Salmon R. NUMBER RELEASED - 14,958
September November DecemberOctoberNo.
River Section TagsSample Est.Rate Hary
No.Tags
Sample Est.Rate
No.Tags
Sample Est.Rate Hary
No.Tags
Sample Est.Rate Harv.
0103/0504/06
07101112 1 0.284 41314 1 0.149 7 1 0.433 215 1 0.258 41617
January February March April 1992-93No. Sample Est. No. Sample Est. No. Sample Est. No. Sample Est. No.
River Section Tags Rate Harv. Tags Rate Tags Rate Hary Tags Rate Harv. Tags01
03/0504/06
07101112 1 41314 2 915 2 0.456 4 3 81617181920
75

Total estimated harvest 200
Appendix B. Continued.
TAG CODE - 10/43/14 RELEASE SITE - East Fork Salmon R. NUMBER RELEASED - 20,498
September October November DecemberNo. Sample Est. No. Sample Est. No. Sample Est. No. Sample Est.
River Section Tags Rate Harv. Tags Rate Harv. Tags Rate Hary Tags Rate Harv.01
03/0504/06071011121314151617
January February March April 1992-93No. Sample Est. No. Sample Est. No. Sample Est. No. Sample Est. No. Est.
River Section Tags Rate Harv. Tags Rate Harv. Tags Rate Hary Tags Rate Harv. Tags Hare. 0103/0504/0607101112 1 0.005 200 1 2001314151617181920
76

Total estimated harvest 5
Appendix B. Continued.
TAG CODE - 10/43/15RELEASE SITE - East Fork Salmon R. NUMBER RELEASED -21,017,
No.River Section Tags
0103/0504/06071011121314151617
September October November DecemberSample Est. No. Sample Est. No. Sample Est. No. Sample Est.Rate Hary Tags Rate Harv. Tags Rate Hary Tags Rate Harv.
1 0.201 5
January February March April 1992-93No. Sample Est. No. Sample Est. No. Sample Est. No. Sample Est. No. Est.
River Section Tags Rate Harv. Tags Rate Harv. Tags Rate Harv. Tags Rate Harv. Tags Harv.01
03/0504/06071011 1 5
121314151617181920
77

Total estimated harvest 4
Appendix B. Continued.
TAG CODE - 10/43/17 RELEASE SITE - Little Salmon R. NUMBER RELEASED - 21,809
September October November DecemberNo. Sample Est. No. Sample Est. No. Sample Est. No. Sample Est.
River Section Tags Rate Harv.. Tags Rate Harv. Tags Rate Hary Tags Rate Harv.01 03/05
04/0607101112131415 1 0.258 41617
January February March April 1992-93No. Sample Est. No. Sample Est. No. Sample Est. No. Sample Est. No. Est.
River Section Tags Rate Harv. Tags Rate Harv. Tags Rate Hary Tags Rate Harv. Tags Hare._ 0103/0504/0607101112131415 1 41617181920
78

Total estimated harvest 21
Appendix B. Continued.
TAG CODE - 10/43/18 RELEASE SITE - Little Salmon R. NUMBER RELEASED - 22,704
September October November DecemberNo. Sample Est. No. Sample Est. No. Sample Est. No. Sample Est.
River Section Taqs Rate Harv. Taqs Rate Hary Taqs. Rate Harv. Taqs Rate Harv.01 03/0504/06
071011 2 0.154 1312 1 0.284 41314151617
January February March April 1992-93No. Sample Est. No. Sample Est. No. Sample Est. No. Sample Est. No. Est.
River Section Taqs Rate Harv. Taqs Rate Harv. Taqs Rate Hary Taqs Rate Harv. Taqs Harv.01
03/0504/06071011 2 1312 1 0.279 4 2 81314151617181920
79

Total estimated harvest 16
Appendix B. Continued.
TAG CODE - 10/43/19 RELEASE SITE - Little Salmon R. NUMBER RELEASED - 21,484
September October November DecemberNo. Sample Est. No. Sample Est. No. Sample Est. No. Sample Est.
River Section Tags Rate Harv. Tags Rate Harv. Tags Rate Harv. Tags Rate Harv.01 03/0504/06
07101112 1 0.284 41314151617
January February March April 1992-93No. Sample Est. No. Sample Est. No. Sample Est. No. Sample Est. No. Est.
River Section Tags Rate Harv. Tags Rate Harv. Tags Rate Harv. Tags Rate Harv. Tags Harv.01
03/0504/0607101112 1 41314151617181920 3 0.243 12 3 12
80

A
T
R000011111111
R
81
ppendix B. Continued.
AG CODE - 10/43/20 RELEASE SITE - East Fork Salmon R. NUMBER RELEASED - 22,525
September OctoberNo. Sample Est. No. Sample Est.
iver Section Tags Rate Harv. Tags Rate Hary13/054/06701234567
January FebruaryNo. Sample Est. No. Sample Est.
iver Section Tags Rate Harv. Tags Rate Hary 0103/0504/06071011121314151617181920
Total estimated harvest
November DecemberNo. Sample Est. No. Sample Est.
Tags Rate Harv. Tags Rate Harv.
March April 1992-93No. Sample Est. No. Sample Est. No. Est.
Tags Rate Harv. Tags Rate Harv. Tags Harv.
1 0.233 4 1 4
4

Appendix B. Continued.
TAG CODE - 10/43/23
SeptemberNo. Sample Est.
River Section Tags Rate Hary01
03/0504/06071011121314151617
JanuaryNo. Sample Est.
River Section Tags Rate Hary 0103/0504/06071011121314151617181920
Total estimated harvest
RELEASE SITE - Pahsimeroi R. NUMBER RELEASED - 20,550
October November DecemberNo. Sample Est. No. Sample Est. No. Sample Est.
Tags Rate Harv. Tags Rate Harv. Tags Rate Harv.
1 0.258 4 2 0.298 71 0.177 6
February March April 1992-93No. Sample Est. No. Sample Est. No. Sample Est. No. Est.
Tags. Rate Harv. Tags. Rate Harv. Tags Rate Harv. Tags Harv.
1 0.265 4 1 41 0.456 2 1 0.233 4 5 17
1 63 0.465 6 3 6
33
82

Total estimated harvest 45
Appendix B. Continued.
TAG CODE - 10/43/24 RELEASE SITE - Salmon R. @ North Fork NUMBER RELEASED - 21,605
September October November DecemberNo. Sample Est. No. Sample Est. No. Sample Est. No. Sample Est.
River Section Taqs Rate Harv. Taqs Rate Harv. Taqs Rate Hary Tags Rate Harv.01
03/0504/0607
1011121314 1 0.433 215 2 0.258 8 3 0.298 101617
January February March April 1992-93No. Sample Est. No. Sample Est. No. Sample Est. No. Sample Est. No. Est.
River Section Taqs Rate Harv. Tags Rate Harv. Tags Rate Harv. Tags Rate Harv. Tags Harv.01
03/0504/0607 1011 121314 1 215 5 0.456 11 2 0.233 9 12 3816 1 0.188 5 1 517181920
83

Total estimated harvest 56
Appendix B. Continued.
TAG CODE - 10/43/25 RELEASE SITE -Salmon R. @ North Fork NUMBER RELEASED - 23,782
September October November DecemberNo. Sample Est. No. Sample Est. No. Sample Est. No. Sample Est.
River Section Tags Rate Harv. Tags Rate Harv. Tags Rate Harv. Tags Rate Harv.01
03/0504/06071011121314 2 0.149 13 2 0.433 515 3 0.258 12 4 0.298 131617
January February March April 1992-93No. Sample Est. No. Sample Est. No. Sample Est. No. Sample Est. No. Est.
River Section Tags Rate Harv. Tags Rate Harv. Tags Rate Harv. Tags Rate Harv. Tags Harv.01
03/0504/06071011121314 4 1815 3 0.456 7 1 0.233 4 11 361617 1 0.465 2 1 2181920
84

85
Appendix B. Continued.
TAG CODE - 10/43/26 RELEASE SITE - Salmon R. @ North Fork NUMBER RELEASED - 22,244,
September October November DecemberNo. Sample Est. No. Sample Est. No. Sample Est. No. Sample Est.
River Section Tags Rate Harv. Tags Rate Harv. Tags Rate Harv. Tags, Rate Harv.01
03/0504/06
07101112 1 0.238 41314 1 0.149 7 1 0.433 215 2 0.258 8 1 0.298 31617
January FebruaryNo. Sample Est. No. Sample Est.
River Section Tags Rate Harv. Tags Rate Hary01
03/0504/06071011121314151617181920
Total estimated harvest
47
March April 1992-93No. Sample Est. No. Sample Est. No. Est.
Tags Rate Harv. Tags Rate Harv. Tags Harv.
1 4
2 95 0.456 11 1 0.233 4 9 26
1 0.133 8 1 8

86
Appendix B. Continued.
TAG CODE - 10/43/27 RELEASE SITE - Pahsimeroi R. NUMBER RELEASED - 22,328
SeptemberNo. Sample Est.
River Section Tags Rate Hary0103/0504/0607101112 1 0.284 41314151617
January FebruaryNo. Sample Est. No. Sample Est.
River Section Tags Rate Harv. Tags Rate Hary01
03/0504/06071011121314151617181920
Total estimated harvest
1 0.433 24 0.298 13
March April 1992-93No. Sample Est. No. Sample Est. No. Est.
Tags Rate Harv. Tags Rate Harv. Tags Harv.
1 4
1 24 0.456 9 12 38
1 66 0.465 13 6 13
October November DecemberNo. Sample Est. No. Sample Est. No. Sample Est.
Tags Rate Harv. Tags Rate Harv. Tags Rate Harv.
4 0.258 161 0.177 6
63

AT
87
ppendix B. Continued.AG CODE - 10/43/28
RELEASE SITE - Pahsimeroi R. NUMBER RELEASED - 22,395October November December
No. Sample Est. No. Sample Est. No. Sample Est.Taqs Rate Harv. Taqs Rate Hary Tags Rate Harv.
1 0.077 13
January February March April 1992-93No. Sample Est. No. Sample Est. No. Sample Est. No. Sample Est. No. Est.
River Section Tags Rate Harv. Tags Rate Harv. Tags Rate Hary Tags Rate Harv. Tags Harv.01
03/05 1 1304/06
07101112 1 41314 2 515 4 151617 1 0.051 20 2 0.465 4 3 24181920
Total estimated harvest 61
SeptemberNo. Sample Est.
River Section Tags Rate Hary01
03/0504/06
071011121314 2 0.433 515 3 0.258 12 1 0.298 31617
1 40.238

Appendix B. Continued.
TAG CODE - 10/43/29 RELEASE SITE - Salmon R. G Ellis Bridge NUMBER RELEASED - 23,280
September October November DecemberNo. Sample Est. No. Sample Est. No. Sample Est. No. Sample Est.
River Section Taqs Rate Hary Taqs Rate Harv Taqs Rate Harv. Taqs Rate Harv.01 03/0504/06
071011121314 1 0.149 715 1 0.258 4 1 0.298 31617
January FebruaryNo. Sample Est. No. Sample Est.
River Section Taqs Rate Harv. Taqs Rate Hary
March April 1992-93No. Sample Est. No. Sample Est. No. Est.
Taqs Rate Harv. Taqs Rate Harv. Taqs Harv.01
03/0504/06071011121314 1 715 2 0.456 4 4 111617 3 0.465 6 3 618 1 0.399 3 1 31920 1 0.243 4 1 4
Total estimated harvest 31
88

Total estimated harvest 32
Appendix B. Continued.
TAG CODE - 10/43/30 RELEASE SITE - Salmon R. @ Ellis Bridqe NUMBER RELEASED - 22,388
September October November DecemberNo. Sample Est. No. Sample Est. No. Sample Est. No. Sample Est.
River Section Taqs Rate Hary Taqs Rate Harv. Taqs Rate Hary Taqs Rate Harv.01
03/0504/06071011 1 0.154 61213 1 0.218 51415 2 0.258 81617
January February March April 1992-93No. Sample Est. No. Sample Est. No. Sample Est. No. Sample Est. No. Est.
River Section Taqs Rate Harv. Taqs Rate Harv. Taqs Rate Harv. Taqs Rate Harv. Taqs Harv.01
03/05 04/06 071011 1 61213 1 51415 2 81617 6 0.465 13 6 13181920
89

Total estimated harvest 47
January February March April 1992-93No. Sample Est. No. Sample Est. No. Sample Est. No. Sample Est. No. Est.
River Section Tags Rate Harv. Tags Rate Harv. Taqs Rate Hary TagsRate Harv. Tags Harv.01
03/0504/06
07101112 513 114 3 715 1 0.456 2 6 201617 5 0.465 11 5 111819 1 0.229 4 1 420
Appendix B. Continued.
TAG CODE - 10/43/31 RELEASE SITE - Salmon R. @ Ellis Bridge NUMBER RELEASED - 21,826
September October November DecemberNo. Sample Est. No. Sample Est. No. Sample Est. No. Sample Est.
River Section Tags Rate Harv. Tags Rate Harv. Taqs Rate Harv. Tags Rate Harv.01
03/0504/060710111213 1 0.218 514 3 0.433 715 2 0.258 8 3 0.298 101617
90

Total estimated harvest 6
Appendix B. Continued.
TAG CODE - 10/43/32 RELEASE SITE - Little Salmon R. NUMBER RELEASED - 19,831
September October November DecemberNo. Sample Est. No. Sample Est. No. Sample Est. No. Sample Est.
River Section Taqs Rate Harv. Tags Rate Harv. Tags Rate Harv. Tags Rate Harv.01 03/0504/06
071011 1 0.154 6121314151617
January February March April 1992-93No. Sample Est. No. Sample Est. No. Sample Est. No. Sample Est. No. Est.
River Section Tags Rate Harv. Tags Rate Harv. Tags Rate Harv. Tags Rate Harv. Tags Hain.01
03/0504/06071011 1 6
121314151617181920
91

Appendix B. Continued.
TAG CODE - 10/43/33 RELEASE SITE - Sawtooth Hatchery NUMBER RELEASED - 21,050
September October November DecemberNo. Sample Est. No. Sample Est. No. Sample Est. No. Sample Est.
River Section Tags Rate Harv. Tags Rate Harv. Tags Rate Harv. Tags Rate Harv.01
03/0504/06071011121314 1 0.433 215 3 0.258 12 2 0.298 71617
January February March April 1992-93No. Sample Est. No. Sample Est. No. Sample Est. No. Sample Est. No. Est.
River Section Tags Rate Harv. Tags Rate Harv. Tags Rate Hary Tags Rate Harv., Tags Hare.01
03/0504/06071011121314 1 215 1 0.456 2 6 211617 1 0.465 2 1 218 1 0.399 3 1 319 4 0.229 17 4 1720
Total estimated harvest 45
92

93
Appendix B. Continued.
TAG CODE - 10/43/34 RELEASE SITE - Sawtooth Hatchery NUMBER RELEASED - 20,129
September October November DecemberNo. Sample Est. No. Sample Est. No. Sample Est. No. Sample Est.
River Section Tags Rate Harv. Tags Rate Harv. Tags Rate Harv. Tags Rate Harv.01
03/0504/06
071011121314 1 0.433 215 3 0.258 12 5 0.298 1716 1 0.177 617
JanuaryNo. Sample Est.
River Section Tags Rate Harv. 0103/0504/06 07 10 11 12 13 14 15 16
17 18 19 20
Total estimated harvest 55
February March April 1992-93No. Sample Est. No. Sample Est. No. Sample Est. No. Est.
Tags Rate Harv. Tags Rate Harv. Tags Rate Harv. Tags Hare.
2 0.456 41 0.188 5
1 210 332 11
2 0.229 9 2 9

A
T
R
R
94
ppendix B. Continued.
AG CODE - 10/43/35 RELEASE SITE - Sawtooth Hatchery NUMBER RELEASED - 12,066
September October November DecemberNo. Sample Est. No. Sample Est. No. Sample Est. No. Sample Est.
iver Section Tags Rate Harv. Tags Rate Harv. Tags Rate Harv., Tags Rate Harv.01 03/0504/06
071011121314 1 0.149 7 1 0.433 215 3 0.298 101617
January FebruaryNo. Sample Est. No. Sample Est.
iver Section Tags Rate Harv. Tags Rate Hary01
03/0504/06071011121314151617181920
Total estimated harvest32
March April 1992-93No. Sample Est. No. Sample Est. No. Est.
Tags Rate Harv. Tags Rate Harv. Tags Hazy.
2 95 0.456 11 8 21
1 0.465 2 1 2

Total estimated harvest 55
Appendix B. Continued.
TAG CODE - 10/43/36RELEASE SITE - Sawtooth Hatchery NUMBER RELEASED - 21,775
September October November DecemberNo. Sample Est. No. Sample Est. No. Sample Est.
River Section Tags Rate Harv. Taqs Rate Hary Taqs Rate Harv.01
03/0504/060708091011121314 1 0.149 7 2 0.433 515 4 0.258 16 1 0.298 316 1 0.177 617
January February March April 1992-93No. Sample Est. No. Sample Est. No. Sample Est. No. Sample Est. No. Est.
River Section Tags Rate Harv. Tags Rate Harv. Tags Rate Hary Tags Rate Harv., Tags Harv.
0103/0504/06
071011121314 3 1215 1 0.456 2 6 2116 1 0.188 5 1 0.133 8 3 191718 1 0.399 3 1 31920
95

96
Appendix B. Continued.
TAG CODE - 10/43/37 RELEASE SITE - Sawtooth Hatchery NUMBER RELEASED - 20,318
September October November DecemberNo. Sample Est. No. Sample Est. No. Sample Est. No. Sample Est.
River Section Tags Rate Harv. Tags Rate Harv. Tags Rate Harv. Tags Rate Harv.01
03/0504/060710 1 0.024 421112131415 1 0.258 41617
January FebruaryNo. Sample Est. No. Sample Est.
River Section Tags Rate Harv. Tags Rate Hary01
03/0504/06071011121314151617181920
Total estimated harvest 49
March April 1992-93No. Sample Est. No. Sample Est. No. Est.
Tags Rate Harv. Tags Rate Harv. Tags Hare.
1 42
1 4
2 0.399 3 2 3

Appendix B. Continued.
TAG CODE - 10/43/38 RELEASE SITE - Sawtooth Hatchery NUMBER RELEASED - 19,338
DecemberNovemberOctoberSeptemberNo.
River Section TagsSample Est.
RateNo.Tags
SampleRate
Est.Harv.
No.Tags
Sample Est.Rate
No.Tags
Sample Est.Rate Harv.
0103/0504/06071011121314 1 0.149 715 2 0.258 8 3 0.298 1016 1 0.177 617
AprilMarch 1992-93January FebruaryNo.
River Section TagsSample Est. No. Sample Est.Rate Harv. Tags Rate Hary
No.Tags
SampleRate
Est.Harv.
No.Tags
SampleRate
Est. No.Est.
0103/0504/0607101112 1 0.279 4 1 41314 1 715 2 0.456 4 1 0.233 4 8 2616 1 6171819 2 0.229 9 2 920
Total estimated harvest 52
97

98
Appendix B. Continued.TAG CODE - 10/43/39 RELEASE SITE - Little Salmon R. NUMBER RELEASED - 19,813
September October November DecemberNo. Sample Est. No. Sample Est. No. Sample Est. No. Sample Est.
River Section Tags Rate Harv. Tags Rate Hary Tags Rate Hary Tags Rate Harv.01
03/0504/06071011121314151617
JanuaryNo. Sample Est.
River Section Tags Rate Hary01
03/0504/06071011121314151617181920
Total estimated harvest 4
February March April 1992-93No. Sample Est. No. Sample Est. No. Sample Est. No. Est.
Tags Rate Harv. Tags Rate Harv. Tags Rate Harv. Tags Harv.
1 0.243 4 1 4

Appendix B. Continued.
TAG CODE - 10/43/40 RELEASE SITE -Little Salmon R. NUMBER RELEASED - 18,877
September October November DecemberNo. Sample Est. No. Sample Est. No. Sample Est. No. Sample Est.
River Section Taqs Rate Harv. Taqs Rate Harv. Taqs Rate Harv. Tags Rate Harv.01 03/0504/06
071011121314151617
No.River Section Tags
0103/0504/06071011121314151617181920
January February March April 1992-93Sample Est. No. Sample Est. No. Sample Est. No. Sample Est. No. Est.Rate Hary Taqs Rate Harv. Tags Rate Harv. Taqs Rate Harv. Taqs Harv.
1 0.399 3 1 3
Total estimated harvest 3
99

Appendix B. Continued.
TAG CODE – 63/07/25 RELEASE SITE –Asotin Creek (Snake R.) NUMBER RELEASED – 20,061
September October November DecemberNo. Sample Est. No. Sample Est. No. Sample Est. No. Sample Est.
River Section Taqs Rate Harv. Taqs Rate Harv. Taqs Rate Harv. Tags Rate Harv.01 1 0.110 9
03/0504/06071011121314151617
January February March April 1992-93No. Sample Est. No. Sample Est. No. Sample Est. No. Sample Est. No. Est.
River Section Taqs Rate Harv. Taqs Rate Harv. Taqs Rate Harv. Tags Rate Harv. Tags Harv.01 1 9
03/0504/06071011121314151617
Total estimated harvest 9
100

Total estimated harvest 29
Appendix B. Continued.
TAG CODE - 63/08/41 RELEASE SITE -Curl Lake (Tucannon R.) NUMBER RELEASED - 19,820
DecemberNovemberOctoberSeptemberSample Est.
RateNo.
River Section TagsSample Est.Rate Hary
No.Tags
Sample Est.Rate Harv.
No.Tags
Sample Est.Rate Hary
No.Tags
0103/05 1 0.077 13 1 0.061 1604/06
071011121314151617
January February March April 1992-93No. Sample Est. No. Sample Est. No. Sample Est. No. Sample Est. No.
Rate Harv. TagsRiver Section Tags Rate Harv. Tags Rate Harv. Tags Rate Harv. Tags01
03/05 2 2904/0607
1011121314151617181920
101

Total estimated harvest 26
Appendix B. Continued.
TAG CODE - 63/08/42 RELEASE SITE -Curl Lake (Tucannon R.) NUMBER RELEASED - 19,820
DecemberNovemberOctoberSeptemberSample Est.
RateNo.
River Section TagsSample Est.Rate Hary
No.Tags
Sample Est.Rate Harv.
No.Tags
Sample Est.Rate Hary
No.Tags
0103/05 2 0.077 2604/06
071011121314151617
January February March April 1992-93No. Sample Est. No. Sample Est. No. Sample Est. No. Sample Est. No. Est.
River Section Tags Rate Harv. Tags Rate Harv. Tags Rate Harv. Tags Rate Harv. Tags Harv.01
03/05 2 2604/0607
1011121314151617181920
102

Total estimated harvest 26
Appendix B. Continued.
TAG CODE - 63/14/21 RELEASE SITE - Lyons Ferry (Snake R.) NUMBER RELEASED - 17,914
September October November DecemberNo. Sample Est. No. Sample Est. No. Sample Est. No. Sample Est.
River Section Tags Rate Harv. Tags Rate Hary Tags Rate Harv. Tags Rate Harv.01
03/05 2 0.077 2604/06
071011121314151617
January February March April 1992-93No. Sample Est. No. Sample Est. No. Sample Est. No. Sample Est. No. Est.
River Section Tags Rate Harv. Tags Rate Harv. Tags Rate Harv. Tags Rate Harv. Tags Harv.01
03/05 2 2604/06
071011121314151617181920
103

104
Appendix B. Continued.
TAG CODE - 63/14/22 RELEASE SITE - Asotin Creek (Snake R.) NUMBER RELEASED - 19,750
September October November DecemberNo. Sample Est. No. Sample Est. No. Sample Est. No. Sample Est.
River Section Tags Rate Harv., Taqs Rate Harv.. Tags Rate Harv., Tags Rate Harv.01 1 0.065 15
03/0504/06071011121314151617
January FebruaryNo. Sample Est. No. Sample Est.
River Section Tags Rate Harv. Tags Rate Hary01
03/0504/06071011121314151617181920Total estimated harvest 15
March April 1992-93No. Sample Est. No. Sample Est. No. Est.
Taqs Rate Harv. Tags Rate Harv. Tags Hacv.1 15

105
Appendix B. Continued.
TAG CODE - 63/14/44 RELEASE SITE - Tucannon R. NUMBER RELEASED - 19,767
September October November DecemberNo. Sample Est. No. Sample Est. No. Sample Est. No. Sample Est.
River Section Tags Rate Harv. Tags Rate Harv. Tags Rate Harv. Tags Rate Harv.01 3 0.316 9 3 0.065 46
03/05 2 0 077 2604/06
071011121314151617
January FebruaryNo. Sample Est. No. Sample Est.
River Section Taas Rate Harv. Tags Rate Hary01
03/0504/06 07 10 11 12 13 14 15 16 17 18 19 20
Total estimated harvest 81
March April 1992-93No. Sample Est.- No. Sample Est. No. Est.
Tags Rate Harv. Tags Rate Harv. Tags Harv.6 552 26

106
Appendix B. Continued.
TAG CODE - 63/14/47 RELEASE SITE - Tucannon R. NUMBER RELEASED - 19,858
September October November DecemberNo. Sample Est. No. Sample Est. No. Sample Est. No. Sample Est.
River Section Tags Rate Harv._ Tags Rate Harv. Tags Rate Harv. Tags Rate Harv.01 1 0.316 3 1 0.065 15
03/0504/06071011121314151617
January FebruaryNo. Sample Est. No. Sample Est.
River Section Tags Rate Harv. Tags Rate Hary01
03/0504/06071011121314151617181920
Total estimated harvest 18
March April 1992-93No. Sample Est. No. Sample Est. No. Est.
Tags Rate Harv. Tags Rate Harv. Tags Harv.2 18

A
T
107
Total estimated harvest 31
ppendix B. Continued.
AG CODE - 63/14/49RELEASE SITE - Tucannon R. NUMBER RELEASED - 19,752
SeptemberNo. Sample Est.
River Section Tags Rate Harv01
03/0504/06071011121314151617
January February March April 1992-93No. Sample Est. No. Sample Est. No. Sample Est. No. Sample Est. No. Est.
River Section Tags Rate Harv. Tags Rate Harv. Tags Rate Harv. Tags Rate Harv. Tags Harv.01 2 18
03/05 1 1304/06
071011121314151617181920
October November DecemberNo. Sample Est. No. Sample Est. No. Sample Est.
Tags Rate Harv. Tags Rate Hary Tags Rate Harv.2 0.110 181 0.077 13

A
T
108
ppendix B. Continued.
AG CODE - 63/14/52 RELEASE SITE - Curl Lake (Tucannon R.) NUMBER RELEASED - 19,787
SeptemberNo. Sample Est.
River Section Tags Rate Hary 0103/0504/06
071011121314151617
No.River Section Tags
0103/0504/06
071011121314151617181920
October November DecemberNo. Sample Est. No. Sample Est. No. Sample Est.Tags Rate Harv. Tags Rate Harv. Tags Rate Harv.
Total estimated harvest 29
1 0.062 16 1 0.077 13
2 29
January February March April 1992-93Sample Est. No. Sample Est. No. Sample Est. No. Sample Est. No. Est.Rate Harv. Tags Rate Harv. Tags Rate Harv. Tags Rate Harv. Tags Harv.

Total estimated harvest 13
Appendix B. Continued.
TAG CODE - 63/14/55 RELEASE SITE -Curl Lake (Tucannon R.) NUMBER RELEASED - 20,145
DecemberNovemberOctoberSeptemberNo.
River Section TaqsSample Est.Rate Harv.
No.Tags
Sample Est.Rate Hary
No.Taqs
Sample Est.Rate
No.Tags
Sample Est.Rate
0103/05 1 0.077 1304/06
071011121314151617
January February March April 1992-93No. Sample Est. No. Sample Est. No. Sample Est. No. Sample Est. No.
River Section Tags Rate Hary Tags Rate Harv. Tags Rate Hary Tags Rate Harv. Tags01
03/05 1 1304/0607
1011121314151617181920
109

A
T
R
110
ppendix B. Continued.
AG CODE - 63/14/56 RELEASE SITE - Touchet River @ Dayton NUMBER RELEASED - 19,923
SeptemberNo. Sample Est.
River Section Tags Rate Hary 0103/0504/06071011121314151617
January FebruaryNo. Sample Est. No. Sample Est.
iver Section Taqs Rate Harv. Tags Rate Hary01
03/0504/06071011121314151617181920
Total estimated harvest
October November DecemberNo. Sample Est. No. Sample Est. No. Sample Est. Taqs
Rate Harv. Taqs Rate Harv. Tags Rate Harv.1 0.110 92 0.077 26
35
March April 1992-93No. Sample Est. No. Sample Est. No. Est.
Tags Rate Harv. Tags Rate Harv. Tags Harv.1 92 26

Total estimated harvest 13
Appendix B. Continued.
TAG CODE - 63/39/08 RELEASE SITE - Touchet River C Dayton NUMBER RELEASED - 19,302
September October November DecemberNo. Sample Est. No. Sample Est. No. Sample Est. No. Sample Est.
River Section Taqs Rate Harv. Tags Rate Harv Tags Rate Hary Tags Rate Harv.01
03/05 1 0.077 1304/06
071011121314151617
January February March April 1992-93No. Sample Est. No. Sample Est. No. Sample Est. No. Sample Est. No. Est.
River Section Tags Rate Harv. Tags Rate Hary Tags Rate Hary Tags Rate Harv. Tags Hare. 0103/05 1 1304/06
071011121314151617181920
111

Total estimated harvest 25
Appendix B. Continued.
TAG CODE - 63/39/12 RELEASE SITE - Curl Lake (Tucannon R.) NUMBER RELEASED - 19,672
September October November DecemberNo. Sample Est. No. Sample Est. No. Sample Est. No. Sample Est.
River Section Tags Rate Harv. Tags Rate Harv. Tags Rate Harv Tags Rate Harv.01 1 0 110 9
03/05 1 0 061 1604/0607
1011121314151617
January February March April 1992-93No. Sample Est. No. Sample Est. No. Sample Est. No. Sample Est. No. Est.
River Section Tags Rate Harv. Taqs Rate Harv. Tags Rate Harv. Tags Rate Harv. Tags Harv.01 1 9
03/05 1 1604/0607
1011121314151617181920
112

Total estimated harvest 13
Appendix A. Continued.
TAG CODE - 63/40/58 RELEASE SITE - Touchet River @ Dayton NUMBER RELEASED - 20,011
September October November DecemberNo. Sample Est. No. Sample Est. No. Sample Est. No. Sample Est.
River Section Tags Rate Harv. Tags Rate Harv. Tags Rate Harv. Tags Rate Harv.01
03/05 1 0.077 1304/06
071011121314151617
January February March April 1992-93No. Sample Est. No. Sample Est. No. Sample Est. No. Sample Est. No. Est.
River Section Tags Rate Hary Tags Rate Harv. Tags Rate Hary Tags Rate Harv. Tags Harv.01
03/05 1 1304/06071011121314151617181920
113

Total estimated harvest 32
Appendix A. Continued.
TAG CODE - 63/40/59 RELEASE SITE - Touchet River @ Dayton NUMBER RELEASED - 20,011
September October November DecemberNo. Sample Est. No. Sample Est. No. Sample Est. No. Sample Est.
River Section Tags Rate Harv. Tags Rate Harv. Tags Rate Harv. Tags Rate Harv.01
03/05 2 0.077 2604/06
071011121314151617
January February March April 1992-93No. Sample Est. No. Sample Est. No. Sample Est. No. Sample Est. No. Est.
River Section Tags Rate Hary Tags Rate Harv. Tags Rate Hary Tags Rate Harv. Tags Harv.01 2 26
03/05 1 1304/06071011121314151617181920
114

115
Appendix B. Continued.
TAG CODE - 63/40/60 RELEASE SITE - Touchet River @ Dayton NUMBER RELEASED - 20,104
September October November DecemberNo. Sample Est. No. Sample Est. No. Sample Est. No. Sample Est.
River Section Taqs Rate Harv. Taqs Rate Harv. Tags Rate Harv. Tags Rate Harv.01
03/05 1 0.077 1304/06
071011121314151617
January FebruaryNo. Sample Est. No. Sample Est.
River Section Tags Rate Harv. Taqs Rate Hary01
03/0504/06 071011121314151617181920
Total estimated harvest 13
March April 1992-93No. Sample Est. No. Sample Est. No. Est.
Tags Rate Harv. Tags Rate Harv. Tags Harv.1 13

116
Total estimated harvest 16
Appendix B. Continued.
TAG CODE - 63/40/61 RELEASE SITE - Touchet River @ Dayton NUMBER RELEASED - 20,104
September October November DecemberNo. Sample Est. No. Sample Est. No. Sample Est. No. Sample Est.
River Section Taqs Rate Harv. Taqs Rate Harv. Tags Rate Harv. Tags Rate Harv.01 1 0.316 32
03/05 1 0.077 1304/06
071011121314151617
January February March April 1992-93No. Sample Est. No. Sample Est. No. Sample Est. No. Sample Est. No. Est.
River Section Tags Rate Harv Tags Rate Harv. Tags Rate Harv Tags Rate Harv. Tags Harv.01
03/0504/06071011121314151617181920

117
Total estimated harvest 38
Appendix B. Continued.
TAG CODE - 63/40/62 RELEASE SITE - Touchet River @ Dayton NUMBER RELEASED - 20,104
September October November DecemberNo. Sample Est. No. Sample Est. No. Sample Est. No. Sample Est.
River Section Taqs Rate Harv. Taqs Rate Harv. Tags Rate Harv. Tags Rate Harv.01 1 0.316 3 1 0.110 9
03/05 2 0.077 2604/06
071011121314151617
January February March April 1992-93No. Sample Est. No. Sample Est. No. Sample Est. No. Sample Est. No. Est.
River Section Tags Rate Harv Tags Rate Harv. Tags Rate Harv Tags Rate Harv. Tags Harv.01 2 12
03/05 2 2604/06071011121314151617181920

118
Appendix C. Steelhead groups returning to the Salmon River, 1992-93.
Strain Age No. of Fish Release SiteHatcheryRearing Marks
A I 21,050 Sawtooth Hatchery HNFHa CWT 10/43/33
A I 20,129 Sawtooth Hatchery HNFH CWT 10/43/34
A I 12,066 Sawtooth Hatchery HNFH CWT 10/43/35
A I 21,775 Sawtooth Hatchery HNFH CWT 10/43/36
A I 20,318 Sawtooth Hatchery HNFH CWT 10/43/37
A I 19,338 Sawtooth Hatchery HNFH CWT 10/43/38
A I 985 Sawtooth Hatchery HNFH PIT
A I 864,138 Sawtooth Hatchery HNFH None
A I 304,907 Sawtooth Hatchery HNFH None
A I 364,700 Sawtooth Hatchery MVSHb None
A I 135,100 Pahsimeroi R. MVSH None
A I 20,550 Pahsimeroi R. NSPRc CWT 10/43/23
A I 22,328 Pahsimeroi R. NSPR CWT 10/43/27
A I 22,395 Pahsimeroi R. NSPR CWT 10/43/28
A I 500 Pahsimeroi R. NSPR PIT
A I 409,227 Pahsimeroi R. NSPR None
A I 23,280 Salmon R. @ Ellis Bridge NSPR CWT 10/43/29
A I 22,388 Salmon R. @ Ellis Bridge NSPR CWT 10/43/30
A I 21,826 Salmon R. @ Ellis Bridge NSPR CWT 10/43/31
A I 106,906 Salmon R. @ Ellis Bridge NSPR None
A I 97,800 Salmon R. @ Shoup Bridge MVSH None
A I 48,200 Salmon R. @ Shoup Bridge NSPR None
A I 21,605 Salmon R. @ North Fork NSPR CWT 10/43/24
A I 23,782 Salmon R. @ North Fork NSPR CWT 10/43/25
A I 22,244 Salmon R. @ North Fork NSPR CWT 10/43/26
A I 500 Salmon R. @ North Fork NSPR PIT
A I 90,269 Salmon R. @ North Fork NSPR None
A I 21,809 Little Salmon R. MVSH CWT 10/43/17

119
Appendix C. Continued.
Strain Age No. of Fish Release Site HatcheryRearing Marks
A I 22,704 Little Salmon R. MVSH CWT 10/43/18A I 21,484 Little Salmon R. MVSH CWT 10/43/19A I 1,600 Little Salmon R. MVSH PIT
A I 242,703 Little Salmon R. MVSH None
A I 186,300 Salmon R. @ Hammer Cr. MVSH None
Total 3,234,906
A II 14,597 Sawtooth Hatchery HNFH CWT 10/42/14
A II 15,482 Sawtooth Hatchery HNFH CWT 10/42/15
A II 15,218 Sawtooth Hatchery HNFH CWT 10/42/16
A II 255,859 Sawtooth Hatchery HNFH None
A II 39,620 Sawtooth Hatchery MVSH CWT 10/40/59
A II 1,159,080 Sawtooth Hatchery MVSH None
A II 14,909 Pahsimeroi R. NSPR CWT 10/42/21
A II 14,339 Pahsimeroi R. NSPR CWT 10/42/22
A II 15,127 Pahsimeroi R. NSPR CWT 10/42/23
A II 457,225 Pahsimeroi R. NSPR None
A II 200,295 Salmon R. @ Ellis Bridge HNFH None
A II 15,528 Salmon R. @ Shoup Bridge HNFH CWT 10/42/27
A II 15,196 Salmon R. @ Shoup Bridge HNFH CWT 10/42/28
A II 15,104 Salmon R. @ Shoup Bridge HNFH CWT 10/42/29
A II 154,418 Salmon R. @ Shoup Bridge HNFH None
A II 199,602 Salmon R. @ North Fork HNFH None
A II 80,465 Little Salmon R. HNFH None
A II 15,501 Little Salmon R. NSPR CWT 10/42/24
A II 15,004 Little Salmon R. NSPR CWT 10/42/25
A II 15,250 Little Salmon R. NSPR CWT 10/42/26

120
Appendix C. Continued.
Strain Aqe No. of Fish Release Site HatcheryRearing Marks
A II 179,745 Little Salmon R. NSPR NoneA II 229,000 Salmon R. @ Hammer Cr. NSPR None
Total 3,136,564
B I 20,498 East Fork Salmon R. MVSH CWT 10/43/14
B I 21,017 East Fork Salmon R. MVSH CWT 10/43/15
B I 20,312 East Fork Salmon R. MVSH CWT 10/43/16
B I 750 East Fork Salmon R. MVSH PIT
B I 22,525 East Fork Salmon R. MVSH CWT 10/43/20
B I 22,483 East Fork Salmon R. MVSH CWT 10/43/21
B I 21,375 East Fork Salmon R. MVSH CWT 10/43/22
B I 750 East Fork Salmon R. MVSH PIT
B I 838,090 East Fork Salmon R. MVSH None
B I 540,733 East Fork Salmon R. HNFH None
B I 19,831 Little Salmon R. HNFH CWT 10/43/32
B I 19,813 Little Salmon R. HNFH CWT 10/43/39
B I 18,877 Little Salmon R. HNFH CWT 10/43/40
B I 501 Little Salmon R. HNFH PIT
B I 398,078 Little Salmon R. HNFH NoneB I 120,323 Little Salmon R. HNFH NoneTotal 2,085,956
B II 64,150 East Fork Salmon R. HNFH None
B II 40,905 East Fork Salmon R. MVSH CWT 10/40/58
B II 14,964 East Fork Salmon R. MVSH CWT 10/42/33
B II 15,157 East Fork Salmon R. MVSH CWT 10/42/34B II 14,642 East Fork Salmon R. MVSH CWT 10/42/35B II 15,474 East Fork Salmon R. MVSH CWT 10/42/36B II 15,971 East Fork Salmon R. MVSH CWT 10/42/37B II 14,958 East Fork Salmon R. MVSH CWT 10/42/38

121
Appendix C. Continued.
Strain Age No. of Fish Release Site HatcheryRearing Marks
BII 792,129 East Fork Salmon R. MVSH None
B II 14,841 Little Salmon R. HNFH CWT 10/42/30B II 14,065 Little Salmon R. HNFH CWT 10/42/31B II 13,416 Little Salmon R. HNFH CWT 10/42/32B II 351,030 Little Salmon R. HNFH NoneTotal 1,381,702
B III 14,939 East Fork Salmon R. HNFH CWT 10/41/32B III 14,911 East Fork Salmon R. HNFH CWT 10/41/33B III 13,719 East Fork Salmon R. HNFH CWT 10/41/34B III 393,007 East Fork Salmon R. HNFH NoneB III 15,624 East Fork Salmon R. MVSH CWT 10/41/44B III 14,126 East Fork Salmon R. MVSH CWT 10/41/45B III 14,314 East Fork Salmon R. MVSH CWT 10/41/46B III 2,930 East Fork Salmon R. MVSH PITB III 306,306 East Fork Salmon R. MVSH NoneTotal 789,876
a HNFH = Hagerman National Fish Hatchery.b MVSH = Magic Valley Steelhead Hatchery.cNSPR = Niagara Springs Fish Hatchery.

122
Appendix D. Steelhead groups returning to the Clearwater River, 1992-93.
Strain Aqe No. of FishHatchery
Release Site Rearing Marks
B I 210,874 American R. DNFHa None
B I 369,190 Clearwater R @ Clear Cr. DNFH None
B I 19,773 Clearwater R. DNFH CWT 05/24/24
B I 20,320 Clearwater R. DNFH CWT 05/24/25
B I 19,858 Clearwater R. DNFH CWT 05/24/26
B I 19,515 Clearwater R. DNFH CWT 05/24/27
B I 20,547 Clearwater R. DNFH CWT 05/25/28
B I 20,499 Clearwater R. DNFH CWT 05/24/29
B I 20,293 Clearwater R. DNFH CWT 05/24/30
B I 1,051,698 Clearwater R. DNFH None
B I 201,847 Eldorado Cr. (Lolo Cr.) DNFH None
B I 213,827 Red R. DNFH None
B I 467,757 South Fork Clearwater R. DNFH None
Total 2,655,998
B II 209,847 American R. DNFH None
B II 374,040 Clearwater R.@ Clear Cr. DNFH None
B II 214,633 Crooked R. DNFH None
B II 199,700 Eldorado Cr. (Lolo Cr.) DNFH None
B II 20,016 North Fork Clearwater R. DNFH CWT 05/20/44
B II 19,797 North Fork Clearwater R. DNFH CWT 05/20/45
B II 20,279 North Fork Clearwater R. DNFH CWT 05/20/46
B II 21,290 North Fork Clearwater R. DNFH CWT 05/20/47
B II 20,888 North Fork Clearwater R. DNFH CWT 05/20/48
B II 21,387 North Fork Clearwater R. DNFH CWT 05/20/49
B II 1,043,007 Clearwater R. DNFH None
B II 210,836 South Fork Clearwater R.@ Newsome Cr.
DNFH None
B II 287,830 South Fork Clearwater R. DNFH None
Total 2,663,550

123
Appendix D. Continued.
Strain Age No. of Fish HatcheryRelease Site Rearing Marks
B III 15,294 Clearwater R.@ Clear Cr. HNFHb CWT 10/41/35
B III 15,482 Clearwater R.@ Clear Cr. HNFH CWT 10/41/36
B III 14,375 Clearwater R.@ Clear Cr. HNFH CWT 10/41/37
B III 3,996 Clearwater R.@ Clear Cr. HNFH None
B III 208,201 Clearwater R.@ Clear Cr. DNFH None
B III 109,898 Crooked R. DNFH None
B III 109,480 Eldorado Cr.(Lolo Cr.) DNFH None
B III 16,912 North Fork Clearwater R. DNFH CWT 05/18/37
B III 17,789 North Fork Clearwater R. DNFH CWT 05/18/38
B III 20,339 North Fork Clearwater R. DNFH CWT 05/19/45
B III 19,894 North Fork Clearwater R. DNFH CWT 05/19/46
B III 18,869 North Fork Clearwater R. DNFH CWT 05/19/47
B III 20,603 North Fork Clearwater R. DNFH CWT 05/20/41
B III 20,782 North Fork Clearwater R. DNFH CWT 05/20/42
B III 20,497 North Fork Clearwater R. DNFH CWT 05/20/43
B III 918,215 North Fork Clearwater R. DNFH None
B III 103,273 South Fork Clearwater R.@ Newsome Cr.
HNFH None
B III 247,076 South Fork Clearwater R. HNFH None
Total 1,797,702
a DNFH = Dworshak National Fish Hatchery.b HNFH = Hagerman National Fish Hatchery.

124
Appendix E. Miscellaneous coded wire tag steelhead groups that wererecovered by Idaho anglers, 1992-93.
A I 24,282 Imnaha R. @ Little SheepCr.
ODFWa CWT 07/53/57
A I 28,815 Wallowa R. @ Spring Cr. ODFW CWT 07/54/43
A I 28,738 Wallowa R. @ Spring Cr. ODFW CWT 07/54/44
A I 19,971 Tucannon R. WDFWb CWT 63/14/44
A I 19,860 Tucannon R. WDFW CWT 63/14/47
A I 19,756 Tucannon R. WDFW CWT 63/14/49
A I 19,791 Curl Lake (Tucannon R.) WDFW CWT 63/14/52
A I 20,155 Curl Lake (Tucannon R.) WDFW CWT 63/14/55
A I 19,925 Touchet R. @ Dayton WDFW CWT 63/14/56
A I 20,132 Touchet R. @ Dayton WDFW CWT 63/40/58
A I 20,024 Touchet R. @ Dayton WDFW CWT 63/40/59
A I 20,104 Touchet R. @ Dayton WDFW CWT 63/40/60
A I 20,024 Touchet R. @ Dayton WDFW CWT 63/40/61
A I 20,108 Touchet R. @ Dayton WDFW CWT 63/40/62
A II 25,961 Wallowa R. @ Spring Cr. ODFW CWT 07/51/18
A II 26,347 Wallowa R. @ Spring Cr. ODFW CWT 07/51/20
A II 26,473 Wallowa R. @ Spring Cr. ODFW CWT 07/51/21
A II 26,771 Wallowa R. @ Spring Cr. ODFW CWT 07/51/22
A II 20,061 Asotin Cr. (Snake R.) WDFW CWT 63/07/25
A II 19,820 Curl Lake (Tucannon R.) WDFW CWT 63/08/41
A II 20,597 Lyons Ferry (Snake R.') WDFW CWT 63/08/42
A II 17,914 Lyons Ferry (Snake R.) WDFW CWT 63/14/21
A II 19,750 Asotin Cr. (Snake R.) WDFW CWT 63/14/22
A II 19,928 Touchet R. @ Dayton WDFW CWT 63/39/08
A II 19,672 Curl Lake (Tucannon R.) WDFW CWT 63/39/12
a ODFW = Oregon Department of Fish and Wildlife.b WDFW = Washington Department of Fish and Wildlife.