Embed Size (px)
Citation preview

Autofluorescence signatures of seven pathogens: preliminary in
vitro investigations of a potential diagnostic for Acanthamoeba
keratitis
Philippa M. Molyneux, PhD1*, Simon Kilvington, PhD2,, Matthew J. Wakefield,
MBChB, PhD3, Jeremy I. Prydal, PhD, MD, FRCOphth3, Nigel P. Bannister, PhD1
1. Department of Physics and Astronomy, University of Leicester, University Road,
Leicester, UK.
2. Department of Infection, Immunity & Inflammation, University of Leicester,
University Road, Leicester, UK.
3. Department of Ophthalmology, Leicester Royal Infirmary, Leicester, UK.
* Corresponding author. Email: [email protected], Tel: +44 116 252 5850
The authors have no conflicts of interest to disclose.
This research was supported by STFC Mini IPS grant ST/K003054/1.
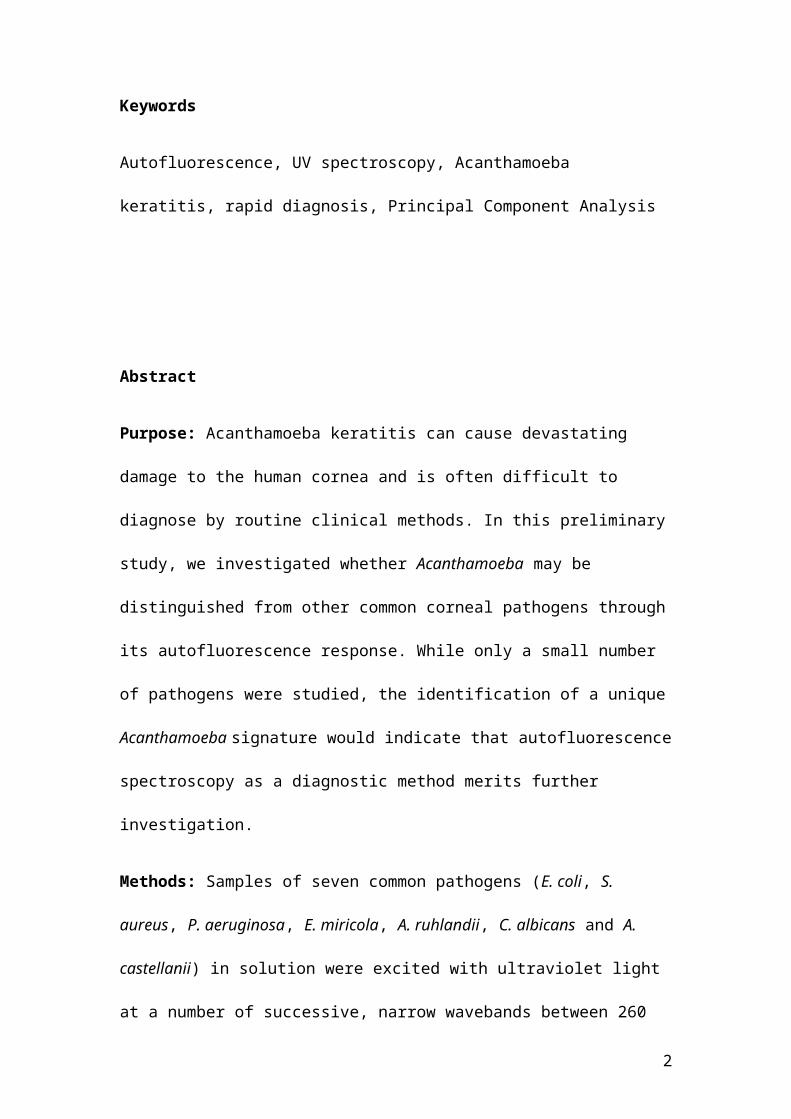
Keywords
Autofluorescence, UV spectroscopy, Acanthamoeba keratitis, rapid diagnosis,
Principal Component Analysis
1
Abstract
Purpose: Acanthamoeba keratitis can cause devastating damage to the human
cornea and is often difficult to diagnose by routine clinical methods. In this
preliminary study, we investigated whether Acanthamoeba may be distinguished
from other common corneal pathogens through its autofluorescence response.
While only a small number of pathogens were studied, the identification of a
unique Acanthamoeba signature would indicate that autofluorescence
spectroscopy as a diagnostic method merits further investigation.
Methods: Samples of seven common pathogens (E. coli, S. aureus, P. aeruginosa,
E. miricola, A. ruhlandii, C. albicans and A. castellanii) in solution were excited
with ultraviolet light at a number of successive, narrow wavebands between 260
nm and 400 nm, and their fluorescence response recorded. Principal Component
Analysis was used to allow better visualisation of the differences in response to
UV light for different species.
Results: Acanthamoeba was found to possess a characteristic autofluorescence
response and was easily distinguished from E. coli, S. aureus, P. aeruginosa, E.
miricola, A. ruhlandii and C. albicans over a wide range of excitation wavelengths.
We also found a clear discrimination between E. coli, C. albicans and P.
aeruginosa at an excitation wavelength of 274 nm, while E. miricola, S. aureus and
A. ruhlandii could be separated using an excitation wavelength of 308 nm.
Conclusions: Our results, while preliminary, indicate that autofluorescence
spectroscopy shows promise as a diagnostic technique for keratitis. We intend to
2
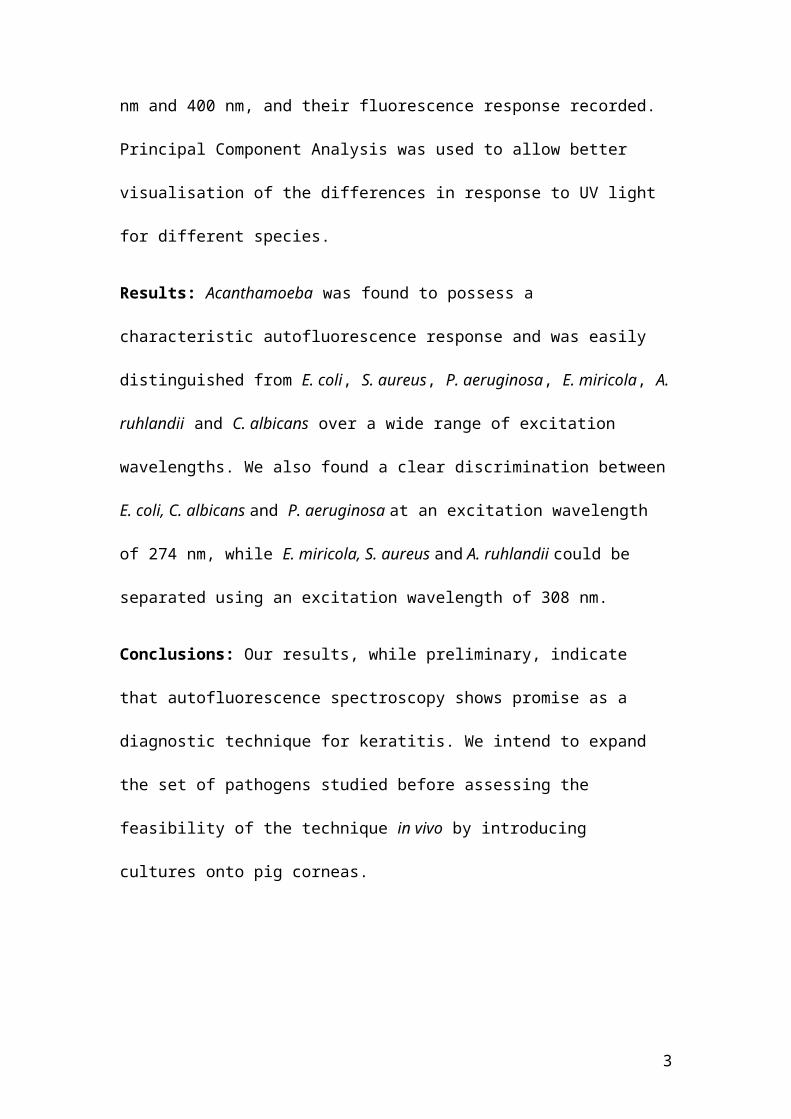
expand the set of pathogens studied before assessing the feasibility of the
technique in vivo by introducing cultures onto pig corneas.
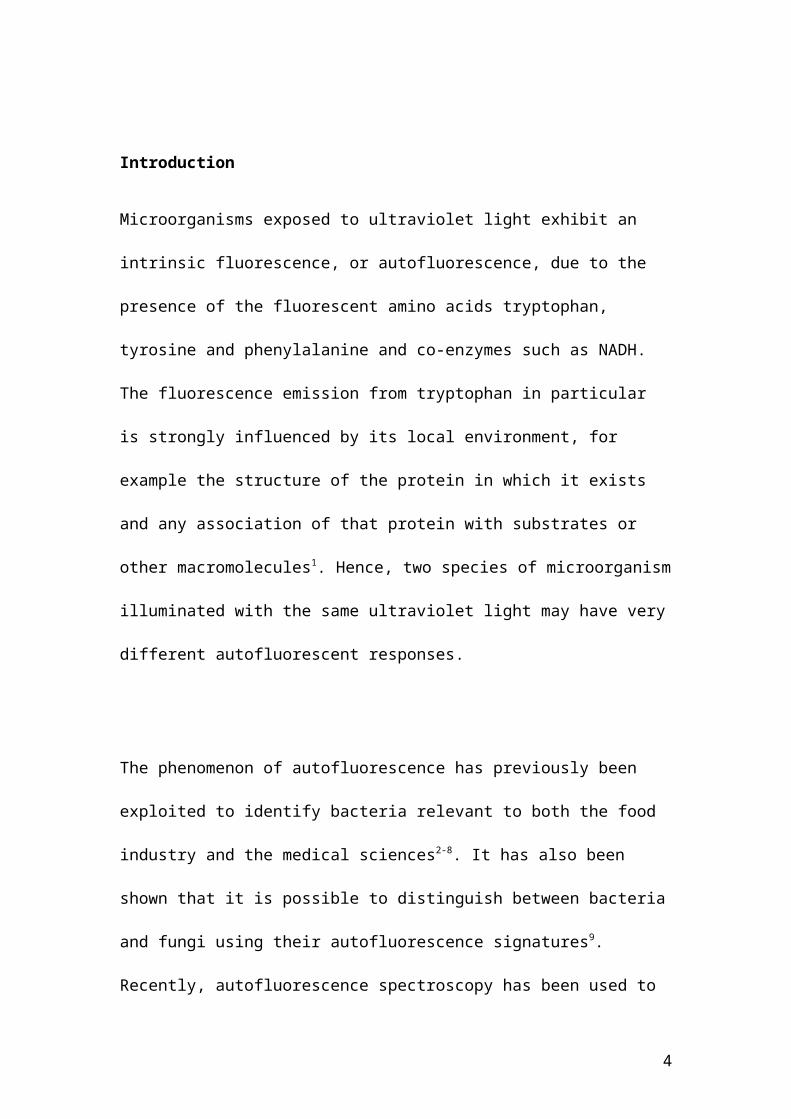
Introduction
Microorganisms exposed to ultraviolet light exhibit an intrinsic fluorescence, or
autofluorescence, due to the presence of the fluorescent amino acids tryptophan,
tyrosine and phenylalanine and co-enzymes such as NADH. The fluorescence
emission from tryptophan in particular is strongly influenced by its local
environment, for example the structure of the protein in which it exists and any
association of that protein with substrates or other macromolecules1. Hence, two
species of microorganism illuminated with the same ultraviolet light may have
very different autofluorescent responses.
The phenomenon of autofluorescence has previously been exploited to identify
bacteria relevant to both the food industry and the medical sciences2-8. It has also
been shown that it is possible to distinguish between bacteria and fungi using
their autofluorescence signatures9. Recently, autofluorescence spectroscopy has
been used to directly identify 37 common bacterial and fungal pathogens in
blood cultures, with potential application to the clinical management of sepsis.
An algorithm was developed that could correctly classify 99.6% of the unknown
3
samples to the Gram staining level, 99.3% to the family level, and 96.5% to the
species level using autofluorescence measurements alone10. Similarly, the urine
of patients with urinary tract infections has been shown to exhibit an increase in
autofluorescence11. Aside from microbiology, there are a number of additional
potential clinical applications of autofluorescence spectroscopy, including the
monitoring of tissue damage12 and the diagnosis and monitoring of various
cancers (see, for example, the review by Liu et al. 201313), and autofluorescence
endoscopies are already routinely used to identify potential biopsy sites. While
autofluorescence spectroscopy has thus already shown promise as a method of
identifying different bacteria, fungi and tissue types, autofluorescence
measurements for the identification of Acanthamoeba have not previously been
investigated.
Microbial keratitis affects up to 710 per 100,000 population per year14.
Acanthamoeba is a ubiquitous, free-living protozoan that can cause devastating
ulceration of the human cornea, particularly in soft contact lens wearers, which
can lead to blindness and even loss of the eye in 2% of patients15. The increasing
threat of Acanthamoeba keratitis has been well reported16-18 and it is clear that
prompt diagnosis and appropriate targeted therapy are essential to a good
prognosis14,15. Late diagnosis leads to the increased need for surgical intervention
and worse visual outcomes19. However, identifying Acanthamoeba as the cause of
a corneal infection by routine clinical methods is difficult and often leads to
delays in diagnosis. Microbiological culture remains the ‘gold standard’ but these
tests are only positive in 52.5% - 67% of cases20. Often a combination of culture,
4

confocal microscopy, histological examination of biopsy specimens and detection
of Acanthamoeba DNA by polymerase chain reaction is used to arrive at the
diagnosis15.
Here, we have demonstrated that Acanthamoeba can be distinguished in vitro
from other common corneal pathogens by its autofluorescence signature.
Materials and Methods
The autofluorescence signatures of five bacteria, one yeast and one strain of
Acanthamoeba castellanii (ATCC 50370) were studied. Cultures of Escherichia
coli (ATCC 8739), Staphylococcus aureus (ATCC 6538), Pseudomonas aeruginosa
(ATCC 9027), Elizabethkingia miricola (3AS) and Achromobacter ruhlandii (S4)
were grown on trypticase soy agar at 32° C for 24 hours in air. Candida albicans
(ATCC 10231) was grown on Sabouraud Dextrose Agar at 32° C for 24 hours in
air. A. castellanii trophozoites were cultured in a semi-defined axenic broth
medium21. All samples, except Acanthamoeba, were then suspended in
Dulbecco’s phosphate buffered saline (DPBS) for the autofluorescence
measurements. The optical density at 600 nm (OD600) of the DPBS suspended
bacterial and yeast samples were ~0.1.
For the A. castellanii, the trophozoites were washed ×3 in 1/4 strength Ringer’s
solution or deionized water by centrifugation at 500 ×g for 5 minutes. Each A.
5

castellanii sample contained ~1×10⁵ trophozoites. It was important that the
trophozoites were washed thoroughly since the axenic broth medium in which
they were cultured was found to be highly fluorescent. The use of two different
solutions for the Acanthamoeba samples was intended to show that any
differences between the autofluorescence of the amoeba and that of the other
species were consistent and not environment dependent.
Excitation wavelength-resolved autofluorescence spectroscopy was conducted
using an Ocean Optics HPX-2000 Xenon arc lamp as the excitation source. The
lamp was connected via an optical fibre to a Newport Cornerstone 130
motorised monochromator, which allowed a small (~1 nm) region of light to be
isolated within the lamp’s 185 – 2000 nm output. The selected light was directed
onto the surface of each sample using an Ocean Optics QR200-7 UV reflectance
probe. The probe consisted of a ring of six illumination fibres and a central fibre
branching away from the others to direct reflected light and autofluorescence to
an Ocean Optics Maya spectrometer (sensitive in the range 250 – 700 nm). Each
sample was illuminated at 71 excitation wavelengths, covering the range 260 –
400 nm in 2 nm steps. Three consecutive scans of a sample were performed
before the probe was moved to illuminate the next species. This process was
repeated five times so that a total of 15 spectra at each excitation wavelength
were collected for each species. Scans of all pathogens except Acanthamoeba
were performed over two consecutive days –three sets of scans on day one and
two on day two. Fresh samples were produced each day from the cultured plates.
All Acanthamoeba scans were performed in a single day. The exposure time per
6
illumination wavelength was 0.5 seconds. A schematic of the equipment is given
in Figure 1.
The collected 71 spectra from each scan were normalised to the maximum
intensity seen at an excitation wavelength of 290 nm during that scan. This had
the effect of removing any differences in concentration between samples, which
result in different fluorescence intensities but do not affect the shape of the
fluorescence response. It is important that the identification of a species by its
autofluorescence is not concentration dependent since we will clearly have no
control over the concentration of pathogens in vivo.
Results
Excitation Emission Matrices (EEMs) were produced for each sample by plotting
each set of 71 spectra as excitation versus emission response, as shown in Figure
2. The EEMs shown are normalised to the maximum of the fluorescence response
at an excition wavelength of 290 nm. The Acanthamoeba autofluorescence is
clearly different to that of the other microorganisms, exhibiting a “comma
shaped” morphology. While the shape of the fluorescence signature was similar
for all other samples (with the exception of P. aerugnisosa, which exhibits a
secondary fluorescence due to the presence of the fluorescent pigment
pyoverdin), small differences can be seen. The fluorescence signal is
concentrated in the excitation-emission region associated with amino acid
fluorescence. We attribute most of this signal to tryptophan, since phenylalanine
7

fluorescence is significantly weaker and tyrosine fluorescence in proteins is
generally quenched by a number of factors including nearby carboxyl groups and
amino groups1.
We applied Principal Component Analysis (PCA) to the emission spectra
obtained at a number of excitation wavelengths which showed the clearest
variation between species. The data were transformed onto a set of uncorrelated
variables called Principal Components, such that the first Principal Component
accounts for as much of the variation between spectra as possible, and each
successive Principal Component accounts for as much variation as possible while
also being uncorrelated with all previous Principal Components. The differences
between spectra from different species may then be more easily visualised by
creating 2D scatter plots using Principal Components as axes.
We found that Acanthamoeba and P. aeruginosa could be readily distinguished
from the other samples over a wide range of excitation wavelengths, as expected
from the appearance of their EEMs. While we were unable to identify a single
wavelength at which all of the species studied could be unambiguously
identified, we were able to distinguish between all samples using a combination
of two excitation wavelengths. For example, Acanthamoeba, P. aeruginosa, E. coli
and C. albicans were all well separated in PCA plots for an excitation wavelength
of 274 nm, but the remaining three species overlapped. By applying a second
PCA to spectra obtained at an excitation wavelength of 308 nm we were able to
separate these three species. The emission spectra obtained for excitation
wavelengths of 274 nm and 308 nm for each species are shown below the
8
relevant EEM in Figure 2. PCA plots for 274 nm and 308 nm excitation are shown
in Figure 3.
Discussion
These data demonstrate that Acanthamoeba can be distinguished from a subset
of other common corneal pathogens based on its autofluorescence
characteristics. Furthermore, the excitation-emission matrices, resolved to the
nanometre level for excitation wavelength, provide characteristic spectral
fingerprints for all the corneal pathogens tested. Discrimination of
Acanthamoeba is unambiguous at a number of excitation wavelengths, including
274 nm, as shown in Figure 3. We were also able to identify a combination of two
excitation wavelengths which allowed the discrimination of all species studied.
The increasing incidence of Acanthamoeba worldwide and its significant
morbidity for a younger population makes it an economically important
healthcare problem16-18. The limitations of current diagnostic techniques and the
resulting delay in diagnosis lead to unnecessary suffering and loss of vision.
Microbiological cultures may take weeks to become positive and sensitivities are
often low, in the range 0 to 68%20,22. PCR is reported to offer marginally better
sensitivity for infections in the superficial layers of the cornea but is more
expensive, requires technical expertise, is dependent on the sampling methods
and is not a widely available technique23. In vivo confocal microscopy is rapidly
becoming the preferred technique to early diagnosis at the time of patient
9

presentation to the eye emergency department. However, while some studies
demonstrate sensitivities and specificities up to 94 and 93%, respectively24,25, if
the observers are not highly trained then these parameters rapidly fall to 56 and
84%26. Therefore, there remains a clear need for a rapid and accurate diagnostic
test for Acanthamoeba keratitis.
Producing the high resolution spectral fingerprints for individual corneal
pathogens takes minutes at low energy levels of illumination (typically 0.4
millijoule for a complete scan assuming one exposure per excitation
wavelength). Such timescales would be acceptable for clinical examination of the
corneal ulcers and the spatial resolution of the system is appropriate to the size
of a corneal ulcer. The use of principal component analysis will allow the authors
to select a subset of exciting wavelengths for sensitive and specific
Acanthamoeba identification and further reduce the time for each clinical
examination.
However, the ability of autofluorescence spectral fingerprints to differentiate
Acanthamoeba from other corneal pathogens is not necessarily reproducible in
vivo for several reasons. Firstly, Acanthamoeba exists in different stages of a
lifecycle which involves an actively replicating and virulent trophozoite and an
inactive and highly resistant cystic form27. The spectral fingerprint during an
infection may depend on where the majority of Acanthamoeba organisms are
within this life cycle. The organisms examined in this study were in the
10

trophozoite phase due to the way the cultures were prepared. However, it is not
possible to accurately replicate in vivo conditions of an active infection in the
laboratory. Secondly, in vivo autofluorescence signals will be affected by
structural components of the cornea and also the cellular immune response to
infection. It may be possible to reduce the background fluorescence by scanning
a corneal scrape inoculated into a spectroscopic medium rather than directly
observing the infected eye. The feasibility of this technique may be investigated
by using titration experiments to determine the lower limit of detection in liquid
suspension. Thirdly, while repeat measurements of the samples studied in this
initial investigation were performed, only one culture of each pathogen was
used: further cultures should be measured to show that the results are fully
reproducible. Finally, the range of potential corneal pathogens that need to be
distinguished from Acanthamoeba is wider than those used in this study. In order
to assess the feasibility of this as an in vivo technique, we intend to introduce
cultures of Acanthamoeba and a wider range of other microorganisms which
commonly cause keratitis onto pig corneas and assess the autofluorescence
spectral fingerprints.
In summary, Acanthamoeba appears to possess a distinctive autofluorescence
signature that allows it to be easily differentiated from other microorganisms
using fluorescence spectroscopy. This feature may be exploited to develop a
method for the rapid diagnosis of Acanthamoeba keratitis.
11
References
1. Lakawicz JR, Principles of Fluorescence Spectroscopy. New York: Plenum
Press, 1983.
2. Sorrell MJ, Tribble J, Reinisch L, et al. Bacteria identification of otitis media
with fluorescence spectroscopy. Lasers Surg Med 1994;14:155-163.
3. Spector BC, Reinisch L, Smith D et al. Noninvasive fluorescent identification of
bacteria causing acute otitis media in a chinchilla model. Laryngoscope
2000;110:1119 – 1123.
4. Leblanc L, Dufour E. Monitoring the identity of bacteria using their intrinsic
fluorescence, FEMS Microbiol Lett 2002;211:147-153.
5. Giana HE, Silveira L Jr, Zângaro RA, et al. Rapid Identification of Bacterial
Species by Fluorescence Spectroscopy and Classification Through Principal
Components Analysis. J Fluoresc 2003;13:489-493.
6. Ammor S, Yaakoubi K, Chevallier I, et al. Identification by fluorescence
spectroscopy of lactic acid bacteria isolated from a small-scale facility producing
traditional dry sausages. J Microbiol Meth 2004;59:271-281.
7. Ammor S, Delgado S, Alvarez-Martin P, et al. Reagentless identification of
human bifidobacteria by intrinsic fluorescence. J Microbiol Meth 2007;69:100-
106.
8. Sohn M, Himmelsbach DS, Barton FE II, et al. Fluorescence spectroscopy for
rapid detection and classification of bacterial pathogens. Appl Spectrosc
2009;63:1251-1255.
12

9. Bhatta H, Goldys EM, Learmonth RP. Use of Fluorescence Spectroscopy to
Differentiate Yeast and Bacterial Cells. Appl Microbiol Biot 2006;71:121-126.
10. Walsh JD, Hyman JM, Borzhamskaya L, et al. Rapid Intrinsic Fluorescence
Method for Direct Identification of Pathogens in Blood Cultures, mBio 2014;4:1-
9.
11. Perinchery SM, Kuzhiumparambil U, Vemulpad S, et al. The potential of
autofluorescence spectroscopy to detect human urinary tract infection. Talanta
2010;82:912-917.
12. Buttermere C, Chari R, Anderson C, et al. In Vivo Assessment of Thermal
Damage in the Liver Using Optical Spectroscopy. J Biomed Opt 2004;9:1018-
1027.
13. Liu W, Zhang XH, Liu KP, et al. Laser-induced fluorescence: Progress and
prospective for in vivo cancer diagnosis. Chinese Science Bulletin 2013;58:2003-
2016.
14. Thomas PA, Geraldine P. Infectious keratitis. Curr Opin Infect Dis 2007;20:
129-141.
15. Dart JKG, Saw VPJ, Kilvington S, Acanthamoeba Keratitis: Diagnosis and
Treatment Update 2009, Am J Ophthalmol 2009;148;487-499.e2.
16. Cavanagh HD. Acanthamoeba keratitis: 2007: a train wreck in slow motion.
Eye Contact Lens 2007;33:209.
17. Acharya NR, Lietman TM, Margolis TP. Parasites on the rise: a new epidemic
of Acanthamoeba keratitis, Am J Ophthalmol 2007;144:292-293.
13

18. Centers for Disease Control and Prevention. Acanthamoeba keratitis multiple
states, 2005-2007. Morb Mortal Wkly Rep 2007;56:3.
19. Bouheraoua N, Gaujoux T, Goldschmidt P et al. Prognostic factors associated
with the need for surgical treatments in acanthamoeba keratitis. Cornea
2013;32;130-136.
20. Keay L, Edwards K, Naduvilath T, et al. Microbial keratitis predisposing
factors and morbidity. Ophthalmology 2006;113;109-116.
21. Kilvington S, Lam A. Development of standardized methods for assessing
biocidal efficacy of contact lens care solutions against Acanthamoeba
trophozoites and cysts. Invest Ophthalmol Vis Sci 2013;54:4527-4537.
22. Claerhout I, Goebuer A, van den Broecke C, et al. Delay in diagnosis and
outcome of acanthamoeba keratitis, Graef Arch Clin Exp 2004;242:648-653.
23. Mathers WD, Nelson SE, Lane JL, et al. Confirmation of confocal microscopy
diagnosis of acanthamoeba keratitis using polymerase chain reaction analysis.
Arch Ophthalmol 2000;118:178-183.
24. Kanavi MR, Javadi M, Yazdani S, et al. Sensitivity and specificity of confocal
scan in the diagnosis of infectious keratitis. Cornea 2007:26;783-786.
25. Vaddavalli PK, Garg P, Sharma S, et al. Role of confocal microscopy in the
diagnosis of fungal and acanthamoeba keratitis. Ophthalmology 2011:118;29-35.
26. Hau SC, Dart JK, Vesaluoma M, et al. Diagnostic accuracy of microbial keratitis
with in vivo scanning laser confocal microscopy, Br J Ophthalmol 2010:94;982-
987.
14

27. Centers for Disease Control and Prevention. Acanthamoeba – Biology, 2012.
http://www.cdc.gov/parasites/acanthamoeba/biology.html (last accessed: 9
April 2015)
FIGURE 1. Schematic of autofluorescence spectroscopy equipment. The
reflectance probe inset shows the six illuminator (I) fibres and single read (R)
fibre.
FIGURE 2. Example Excitation-Emission Matrices (EEMs) for the
microorganisms studied. Clockwise from top left: P. aeruginosa, S. aureus, C.
albicans, E. coli, , A. castellanii in Ringer’s solution, A. castellanii in deionized
water, E. miricola, A. ruhlandii. The panel below each EEM shows the
fluorescence response for the two excitation wavelengths used for Principal
Component Analysis: 274 nm (solid line) and 308 nm (dashed line).
FIGURE 3. PCA scatter plots showing the first and third Principal Components
for all samples at an excitation wavelength of 274 nm (upper panel) and the first
and second Principal Components at 308 nm for the subset of samples that could
not be separated at 274 nm (lower panel).
15

16

17

18