Embed Size (px)
Citation preview

1
The 2016-17 U.S. News rankings placed Loyola University in the top 100 for the second consecutive year
(Table 1). Loyola was ranked 99th (last year also 99th) with an overall score of 48 (last year 44). Having
the same rank despite an improved overall score, seems to suggest that other universities, similarly ranked
near Loyola last year, improved their overall score somewhat commensurately. Looking at the table below
shows Loyola improved significantly in important areas. Peer Assessment (highest score ever), graduation
rate, graduation performance, both faculty resources and financial resources (highest rank ever), and the
percentage of classes under 20 markedly improved over last year
.
Table 1
Loyola University Chicago Ten-Year Trend Change
Category Weight 2007 2008 2009 2010 2011 2012 2013 2014 2015 2016 1-Yr. 10-Yr.
National Rank 112 116 119 117 119 106 101 106 99 99 0 -13
Overall Total Score 100.0% 38 36 36 39 44 46 48 44 44 48 4 10
Academic Reputation 22.5% Peer Assessment Score 15.0% 2.9 2.9 2.8 2.8 2.9 2.9 2.9 2.9 2.9 3.0 .1 .1
HS Counselor Score 7.5% 3.9 4.0 4.0 4.0 0.0 Graduation and Retention 22.5% Graduation/Retention Rank 96 100 102 102 110 106 101 99 99 100 1 4
Freshmen Retention 4.5% 84% 84% 84% 84% 85% 85% 86% 86% 86% 86% 0% 2%
Predicted Graduation Rate 65% 67% 67% 69% 70% 69% 70% 73% 71% 71% 0% 6%
Actual Graduation Rate 18.0% 70% 65% 66% 68% 67% 70% 70% 71% 73% 74% 1% 4%
Over/Underperformance 7.5% 5.0 -2.0 -1.0 -1.0 -3.0 1.0 0.0 -2.0 2.0 3.0 1 -2
Faculty Res./Compensation 20.0% Faculty Resources Rank 158 143 173 161 159 115 102 118 116 108 -8 -50
% of Classes < 20 6.0% 30% 33% 29% 32% 31% 38% 39% 38% 39% 45% 6% 15%
% of Classes > 50 2.0% 10% 11% 13% 9% 10% 8% 7% 7% 7% 7% 0% -3%
Student Faculty Ratio 1.0% 13/1 14/1 15/1 15/1 15/1 15/1 14/1 14/1 14/1 14/1 0 1
% Full-Time Faculty 1.0% 74% 70% 70% 72% 74% 75% 74% 75% 74% 73% -1% -1%
Selectivity Rank 12.5% 78 82 91 93 82 87 87 92 88 106 18 28
Average ACT 8.0% 23-28 23-28 24-29 24-29 25-29 25-29 25-29 24-29 25-29 24-29 -1-0 1-1
Fresh Top 10% of HS Class 3.0% 32% 33% 34% 32% 34% 32% 35% 37% 34% 34% 0% 2%
Acceptance Rate 1.0% 77% 73% 74% 78% 60% 55% 81% 85% 63% 71% -8% 6%
Financial Resources 10.0% Financial Resources Rank 142 144 136 133 133 141 130 117 113 112 -1 -30
Alumni Giving 5.0% Alumni Giving Rank 174 166 154 156 157 132 112 114 139 175 36 1
Alumni Giving Rate 9% 10% 10% 9% 9% 10% 12% 11% 9% 6% -3% -3%
Numbers in Red=Negative Trend Numbers in Blue=Positive Trend Numbers in Black=No Trend
Loyola University Chicago 2016-17 U.S. News & World Report Ranking Update
Prepared by the Office of Institutional Research

2
On the downside, Loyola declined in selectivity (admission rate rose from 63% to 71% and average ACT
25th percentile declined from 25 to 24). Also, full-time faculty declined from 74% to 73% and alumni
giving declined from 9% to 6%. Overall, however, U.S. News does not weight input measures heavily.
More weight is given to output measures (such as graduation and retention rates). Thus, the input declines
experienced by Loyola had a relatively negligible effect on Loyola’s overall score.
An examination of the top 100 ranked universities shows that 27% remained ranked the same as last year.
Moreover, 33% moved in the rankings (either up or down) by one only or two ranks. For the top 100, the
average movement in rank was .52.
Three of the top 100 institutions scored (total score) lower (by only 1 point) and the average change in score
was plus 2.7. Only 11% of the top 100 either declined in total score by only 1 point (3%) or remained the
same (8%) as the previous year—the other 89% showed increases in total score. Since change from one
year to the next in terms of the U.S. News measures for most institutions are at best slight, the increases in
total scores could only mean a U.S. News change in the weighting of certain performance measures.
Responding to criticism of what really matters in ranking higher education institutions, U.S. News recently
changed its weighting formula towards outcome measures, such as graduation and retention rates.
In general, most seem to agree that placing more weight on outcome measures is a more positive step
towards measuring what matters in higher education. However, the top 100 appear to benefit greatly from
the placing of more weight on outcome measures. This is because U.S. News did not decrease, as we have
noted in all previous U.S. News ranking reports, the main driver of the rankings—peer assessment of
reputation.
Table 2 below shows the results of comparing the top 100 rankings for this year compared with the top 100
rankings for the previous year (paired comparisons) and total score comparisons. The results show a rank
correlation of .994 between the 2016 and 2017 top 100 rankings and a total score correlation of .994--a near
one-to-one relationship. This means that top 100 from 2016 to 2017 remained essentially unchanged.
Table 2
2016 & 2017 Comparison of U.S. News Top 100 Rankings 2016 2017
016 Ranking Spearman's Rank Order Coefficient (rho) 1.0 .998**
2017 Ranking Spearman's Rank Order Coefficient (rho) .998** 1.0
2016 Total Score Pearson's Correlation Coefficient (r) 1.0 .994**
2016 Total Score Pearson's Correlation Coefficient (r) .994** 1.0
** Correlation is significant at the 0.01 level (2-tailed).
r2=.99.6% of variance explained

3
The top 100 rankings comparison results have two major implications for Loyola. First, Loyola has moved
over the past several years from just below the top 100 to 99th due to extraordinary positive changes in
graduation rates, faculty resources, and financial resources. In future rankings, Loyola must consider
whether or not continued extraordinary changes are possible, and if so, what areas should be the focus.
Secondly, although the top 100 rankings comparison showed a .994 correlation, this is in relation to
remaining in the top 100. If we examine the top 10, top 25, top 50, etc., correspondingly there is one
institution ranked 9, 24, and 49, respectively. Although these institutions are highly unlikely to fall out of
the top 100, institutions on the margins are all vulnerable to falling out of their respective ‘top’ categories.
Small changes of 1 or 2 total score points could prove significant. Clearly, Loyola ranked 99th is vulnerable
to falling out of the top 100. It is unlikely that Loyola will rank lower or higher by 10 ranks. But, a change
of three ranks, either up or down, is probably a reasonable expectation. Keep in mind, however, that
although there may be changes in Loyola’s total score, Loyola’s U.S. News rankings are always based
relative to the performance of other institutions.
No doubt next year, like previous years, there will be a great deal of uncertainty that has always
accompanied the anticipation of the ranking results. For the public, what will a move for Loyola up or
down in the rankings really mean? There is the general problem with the consumers of ranking results
interpreting the ranks as if they were the actual overall scores. Ranks are not scores, rankings are based on
scores. We cannot say that the number one ranked institution scored 10 times better than the tenth ranked
institution. The actual scores underlying these respective ranks may actually be 49.1 and 48.3. Using only
the year to year rank numbers for any particular college/university makes it difficult to determine if there
was actually any meaningful change in institutional performance. Unfortunately, the ranks, more than the
actual scores, seem to dominate consumer interest and attention in terms of measured institutional
performance.
More recently, U.S. News has added more weight to outcomes such as graduation and retention. This
seems to make the rankings more relevant to the public, while at the same time giving more weight to the
top institutions who already score high on these factors. Also, U.S. News has been using more averages
on measures across a few years. True that these make sense for the middle ranks, but have little to no
impact on the top 100. Thus, there is never any real surprises concerning which institutions are top 100
ranked. However, those in the middle ranks are more sensitive to small shifts in overall score that yield a
few ranking changes up or down.
Overall, with respect to the U.S. News Best College Rankings, the rankings may not pass scientific
scrutiny and yield nothing more than a ‘beauty contest’, there may be no real answer to the questions of
what is mean by ‘best’ or ‘what really matters’, but the rankings do include some important measures, and
the consumers of ranking information consider the rankings as both legitimate and highly useful. Two
related famous quotes come to mind with respect to the legitimacy and objectivity of the U.S. News Best
College Rankings: Thomas theorem
If a person perceives a situation as real, it is real in its consequences
W.I. Thomas 1928
Keynesian Beauty Contest
People pricing shares not based on what they think their fundamental value is, but rather on what they
think everyone else thinks their value is, or what everybody else would predict the average assessment of
value to be.
John Maynard Keynes, The General Theory of Employment, Interest and Money (1936)

4
The U.S. News 2016-17 ranking results shows some significant changes within Loyola’s peer group.
Table 3 below shows the U.S. News rankings trend for Loyola’s peer members who were classified as
“National Universities”. Others Peer members classified as “Regional”, Liberal Arts, etc. were not included.
Marked drops were experienced by St. John’s (-11), Duquesne (-9), American University (-2) and DePaul
and Catholic University (-1). The gap between DePaul (124) and Loyola (99) is now 25 ranks. On the other
hand, increases were experienced by Fordham (+6), Illinois Institute (+5), University of San Diego (+3),
Tulane (+2), and the University of San Francisco (+1). It should be noted that Fordham was an outlier in
terms of ranking change for 2017. Fordham’s ranking in 2016 of 66 was unusual with respect to prior years
and the 2017 ranking was more consistent with Fordham’s past rankings.
Loyola’s 2016-17 overall rank of 99 places Loyola pretty much in the middle of its peer group. However,
the gap is narrower between Loyola and Jesuit peer members ranked higher. For example, the gap between
Marquette and St. Louis compared with Loyola over the past ten years has narrowed from 30 ranks to 13
for Marquette and 3 for St. Louis. It is quite possible for Loyola to overtake St. Louis in the near future.
Table 3
Note: ‘---‘ indicates prior ranking in terms of Tiers with nor rank
Tables 4-7 shows Loyola’s peer group scores for total score, peer assessment, graduation and retention, and
selectivity. These tables are very consistent with the pattern found in Table 3. Each table places Loyola
pretty much in the middle of its peer group
Peer Institution Name 2008 2009 2010 2011 2012 2013 2014 2015 2016 2017 2008-17 2016-17
Tulane Univers i ty 50 51 50 51 50 51 52 54 41 39 -11 -2
Fordham Univers i ty 67 61 61 56 53 58 57 58 66 60 -7 -6
American Univers i ty 85 83 84 79 82 77 75 71 72 74 -11 2
Marquette Univers i ty 82 77 84 75 82 83 75 76 86 86 4 0
Univers i ty of Denver 85 89 84 86 82 83 91 88 86 86 1 0
Univ. of San Diego 107 102 110 94 97 92 91 95 89 86 -21 -3
St. Louis Univers i ty 82 80 88 86 90 92 101 99 96 96 14 0
Loyola University 112 116 119 117 119 106 101 106 99 99 -13 0
I l l inois Insti tute 96 102 106 111 111 113 109 116 108 103 7 -5
Univ. of San Francisco Tier 3 127 121 117 119 106 117 106 108 107 ---- -1
Duquesne Univers i ty Tier 3 130 128 120 119 120 121 116 115 124 ---- 9
Cathol ic Univers i ty 122 116 121 120 119 120 121 116 123 124 2 1
DePaul Univers i ty Tier 3 Tier 3 Tier 3 136 132 134 121 121 123 124 ---- 1
St. John's Univers i ty Tier 3 Tier 3 Tier 3 143 152 147 152 145 153 164 ---- 11
Change Loyola University Peer Group National Rankings

5
Table 4 shows Loyola’s U.S. News Peer Group total score results for the past ten years. Every peer
institution in Loyola’s Peer Group increased their total score from 2016 to 2017. The range of improvement
in total score was from 3 to 6 (average increase of 4.3). Loyola experienced a gain of 4, on par with the
Peer average increase. The 10-year trend shows Loyola with the second greatest improveed total score of
10. Fordham, American, and University of San Diego showed increases of 11. Since the U.S. News rankings
are based on how others score, we see some evidence to indicate that Loyola’s essentially same rank as last
year’s overall rank was due in part to the improvement of others above and below and increases for some
above and below—a combination effect much like grading on the curve.
Table 4
Note: ‘---‘ indicates prior ranking in terms of Tiers with nor rank
Peer Institution Name 2008 2009 2010 2011 2012 2013 2014 2015 2016 2017 2008-17 2016-17
Tulane Univers i ty 55 54 55 56 62 61 61 58 61 64 9 3
Fordham Univers i ty 48 49 50 53 60 58 60 57 54 59 11 5
American Univers i ty 43 42 43 47 52 52 53 52 51 54 11 3
Marquette Univers i ty 44 44 43 48 52 51 53 50 47 51 7 4
Univers i ty of Denver 43 41 43 45 52 51 50 48 47 51 8 4
Univ. of San Diego 40 39 38 43 48 49 50 47 46 51 11 5
St. Louis Univers i ty 44 43 42 45 50 49 48 46 45 49 5 4
Loyola University 38 36 36 39 44 46 48 44 44 48 10 4
I l l inois Insti tute 41 39 39 40 46 45 47 42 41 47 6 6
Univ. of San Francisco Tier 3 33 35 39 44 46 45 44 41 46 --- 5
Duquesne Univers i ty Tier 3 32 33 38 44 43 43 42 40 43 --- 3
Cathol ic Univers i ty 36 36 35 38 44 43 43 42 38 43 7 5
DePaul Univers i ty Tier 3Tier 3Tier 3 34 41 40 43 41 38 43 --- 5
St. John's Univers i ty Tier 3Tier 3Tier 3 32 37 38 37 35 31 35 --- 4
Change Peer Group Total Score
6
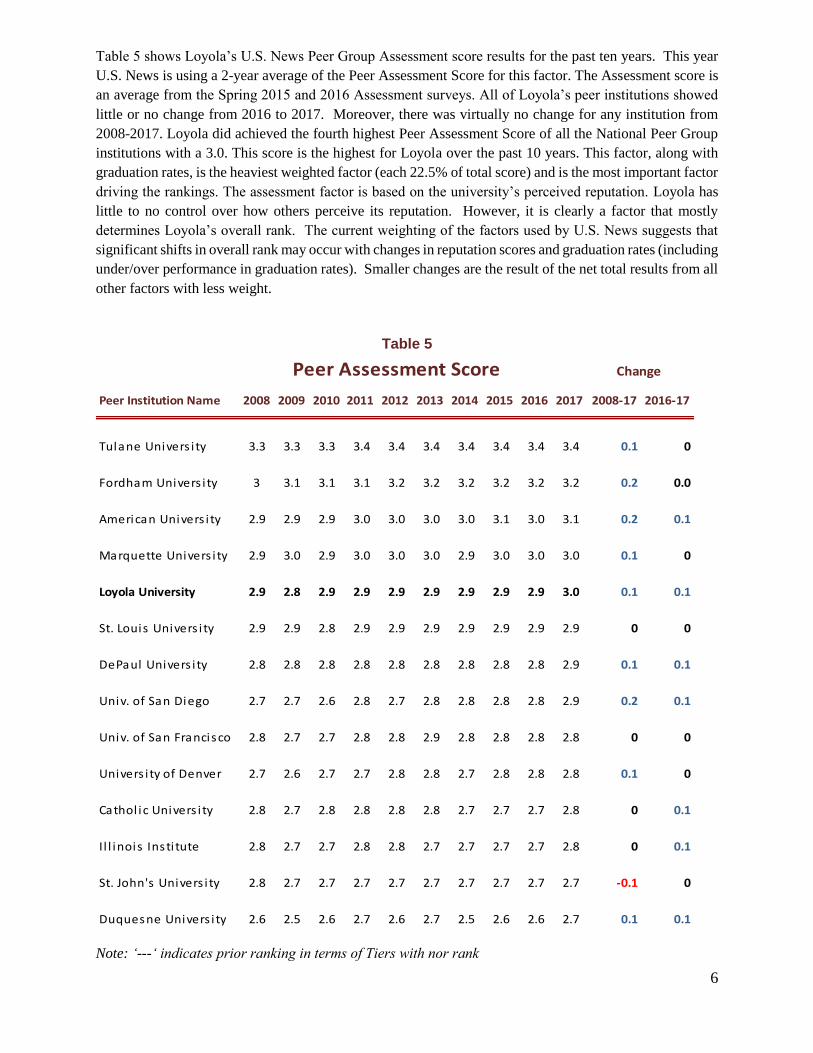
Table 5 shows Loyola’s U.S. News Peer Group Assessment score results for the past ten years. This year
U.S. News is using a 2-year average of the Peer Assessment Score for this factor. The Assessment score is
an average from the Spring 2015 and 2016 Assessment surveys. All of Loyola’s peer institutions showed
little or no change from 2016 to 2017. Moreover, there was virtually no change for any institution from
2008-2017. Loyola did achieved the fourth highest Peer Assessment Score of all the National Peer Group
institutions with a 3.0. This score is the highest for Loyola over the past 10 years. This factor, along with
graduation rates, is the heaviest weighted factor (each 22.5% of total score) and is the most important factor
driving the rankings. The assessment factor is based on the university’s perceived reputation. Loyola has
little to no control over how others perceive its reputation. However, it is clearly a factor that mostly
determines Loyola’s overall rank. The current weighting of the factors used by U.S. News suggests that
significant shifts in overall rank may occur with changes in reputation scores and graduation rates (including
under/over performance in graduation rates). Smaller changes are the result of the net total results from all
other factors with less weight.
Table 5
Note: ‘---‘ indicates prior ranking in terms of Tiers with nor rank
Peer Institution Name 2008 2009 2010 2011 2012 2013 2014 2015 2016 2017 2008-17 2016-17
Tulane Univers i ty 3.3 3.3 3.3 3.4 3.4 3.4 3.4 3.4 3.4 3.4 0.1 0
Fordham Univers i ty 3 3.1 3.1 3.1 3.2 3.2 3.2 3.2 3.2 3.2 0.2 0.0
American Univers i ty 2.9 2.9 2.9 3.0 3.0 3.0 3.0 3.1 3.0 3.1 0.2 0.1
Marquette Univers i ty 2.9 3.0 2.9 3.0 3.0 3.0 2.9 3.0 3.0 3.0 0.1 0
Loyola University 2.9 2.8 2.9 2.9 2.9 2.9 2.9 2.9 2.9 3.0 0.1 0.1
St. Louis Univers i ty 2.9 2.9 2.8 2.9 2.9 2.9 2.9 2.9 2.9 2.9 0 0
DePaul Univers i ty 2.8 2.8 2.8 2.8 2.8 2.8 2.8 2.8 2.8 2.9 0.1 0.1
Univ. of San Diego 2.7 2.7 2.6 2.8 2.7 2.8 2.8 2.8 2.8 2.9 0.2 0.1
Univ. of San Francisco 2.8 2.7 2.7 2.8 2.8 2.9 2.8 2.8 2.8 2.8 0 0
Univers i ty of Denver 2.7 2.6 2.7 2.7 2.8 2.8 2.7 2.8 2.8 2.8 0.1 0
Cathol ic Univers i ty 2.8 2.7 2.8 2.8 2.8 2.8 2.7 2.7 2.7 2.8 0 0.1
I l l inois Insti tute 2.8 2.7 2.7 2.8 2.8 2.7 2.7 2.7 2.7 2.8 0 0.1
St. John's Univers i ty 2.8 2.7 2.7 2.7 2.7 2.7 2.7 2.7 2.7 2.7 -0.1 0
Duquesne Univers i ty 2.6 2.5 2.6 2.7 2.6 2.7 2.5 2.6 2.6 2.7 0.1 0.1
Change Peer Assessment Score

7
Table 6 shows Loyola’s U.S. News Peer Group Graduation and Retention Rank results for the past ten
years. For the past five years Loyola’s improved graduation rates have increased Loyola’s graduation and
retention rank from 110 to 100. Showing declines for 2016 to 2017 are St. John’s University (-12),
University of Denver (-9), University of San Fransisco (-7) and Duquesne University (-5). The most
improved rank was for Marquette (from 70 to 60). The primary reason for Marquette’s increase was due
to its graduation performance rate. Since the graduation/retention factor includes predicted graduation rates
from ACT scores, Marquette had a predicted graduation rate of 72%, but reported an 80% graduation rate.
Thus, Marquette showed a performance of 8% more than expected. Loyola did fairly well. It had a predicted
graduation rate of 71% and an actual graduation rate of 74%--a performance of 3% more than expected.
Table 6
Graduation and Retention Rank
Change
Peer Institution Name 2008 2009 2010 2011 2012 2013 2014 2015 2016 2017 2008-17 2016-17
Marquette University 53 55 60 65 66 62 59 67 70 60 7 -10
Fordham University 53 55 53 59 56 63 65 67 70 68 15 -2
American University 79 78 76 76 71 69 74 73 74 72 -7 -2
Tulane University 73 70 73 76 76 85 83 86 74 72 -1 -2
Univ. of San Diego 73 74 76 76 82 82 83 82 80 82 9 2
University of Denver 81 78 76 81 78 75 77 79 80 89 8 9
Duquesne University Tier
3 86 88 83 82 85 87 86 87 92 --- 5
Loyola University 96 100 102 102 110 106 101 99 99 100 4 1
St. Louis University 67 70 76 83 90 91 91 94 99 100 33 1
Illinois Institute 109 104 99 100 104 106 101 108 111 102 -7 -9
DePaul University Tier 3 Tier 3 120 120 117 119 114 108 106 106 --- 0
Univ. of San Francisco Tier 3 104 107 108 104 98 101 103 106 113 --- 7
Catholic University 88 86 92 96 96 106 114 120 122 125 37 3
St. John's University Tier 3 Tier 3 138 148 152 155 163 166 165 177 --- 12
Note: ‘---‘ indicates prior ranking in terms of Tiers with nor rank

8
Table 7 shows Loyola’s U.S. News Peer Group Selectivity Rank results for the past ten years. The
selectivity factor is the combination of ACT scores (8% of total score), top 10% of high school class (3%
of total score), and admission rate (1% of total score). The majority of the peer group institutions showed
a decline in Selectivity Rank. Those with the greatest declines included St. John’s (34), American (21) and
Loyola (18). Loyola’s decline in rank was mostly due to declines in ACT scores (25th percentile) and a
higher admission rate. A few institutions did show improvement in the Selectivity Rank, although,
improvement was slight – Tulane (-3), IIT (-3), and Fordham (-1). The 10-year trand shows Loyola with
the greatest decline in Selectivity Rank at 28 followed by Marquette at 22. Tulane and Fordham showed
improvement at 6 and 7 respectively.
Table 7
Selectivity Rank
Change
Peer Institution Name 2008 2009 2010 2011 2012 2013 2014 2015 2016 2017 2008-17 2016-17
Tulane University 48 55 41 41 42 42 61 76 45 42 -6 -3
Illinois Institute of Technology 55 55 70 66 66 67 61 64 66 63 8 -3
Fordham University 78 70 71 72 71 69 64 69 72 71 -7 -1
St. Louis University 70 77 90 79 75 78 77 71 69 74 4 5
University of Denver 74 77 74 74 75 75 81 83 78 76 2 -2
American University 62 59 63 56 59 64 64 64 58 79 17 21
Univ. of San Diego 81 92 81 72 80 69 72 71 72 85 4 13
Marquette University 70 77 84 82 80 87 72 81 88 92 22 4
Loyola University 78 82 91 93 82 87 87 92 88 106 28 18
Univ. of San Francisco Tier
3 155 127 140 152 136 140 113 128 131 --- 3
DePaul University Tier
3 Tier
3 121 127 121 118 121 113 128 140 --- 12
Duquesne University Tier
3 150 148 146 145 136 137 142 137 151 --- 14
Catholic University 151 150 163 172 201 171 159 157 169 178 27 9
St. John's University Tier
3 Tier
3 175 165 169 213 172 165 164 198 --- 34
Note: ‘---‘ indicates prior ranking in terms of Tiers with nor rank
9
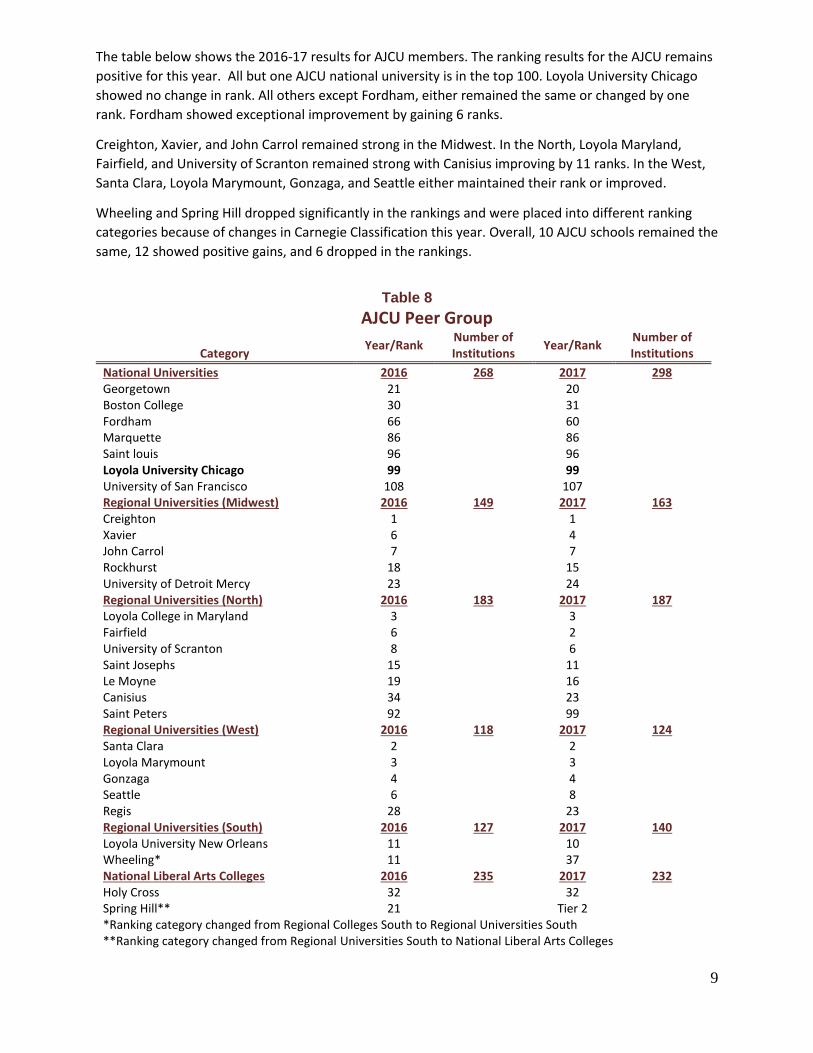
The table below shows the 2016-17 results for AJCU members. The ranking results for the AJCU remains
positive for this year. All but one AJCU national university is in the top 100. Loyola University Chicago
showed no change in rank. All others except Fordham, either remained the same or changed by one
rank. Fordham showed exceptional improvement by gaining 6 ranks.
Creighton, Xavier, and John Carrol remained strong in the Midwest. In the North, Loyola Maryland,
Fairfield, and University of Scranton remained strong with Canisius improving by 11 ranks. In the West,
Santa Clara, Loyola Marymount, Gonzaga, and Seattle either maintained their rank or improved.
Wheeling and Spring Hill dropped significantly in the rankings and were placed into different ranking
categories because of changes in Carnegie Classification this year. Overall, 10 AJCU schools remained the
same, 12 showed positive gains, and 6 dropped in the rankings.
Table 8
AJCU Peer Group
Category Year/Rank
Number of Institutions
Year/Rank Number of Institutions
National Universities 2016 268 2017 298 Georgetown 21 20 Boston College 30 31 Fordham 66 60 Marquette 86 86 Saint louis 96 96 Loyola University Chicago 99 99 University of San Francisco 108 107 Regional Universities (Midwest) 2016 149 2017 163 Creighton 1 1 Xavier 6 4 John Carrol 7 7 Rockhurst 18 15 University of Detroit Mercy 23 24 Regional Universities (North) 2016 183 2017 187 Loyola College in Maryland 3 3 Fairfield 6 2 University of Scranton 8 6 Saint Josephs 15 11 Le Moyne 19 16 Canisius 34 23 Saint Peters 92 99 Regional Universities (West) 2016 118 2017 124 Santa Clara 2 2 Loyola Marymount 3 3 Gonzaga 4 4 Seattle 6 8 Regis 28 23 Regional Universities (South) 2016 127 2017 140 Loyola University New Orleans 11 10 Wheeling* 11 37 National Liberal Arts Colleges 2016 235 2017 232 Holy Cross 32 32 Spring Hill** 21 Tier 2 *Ranking category changed from Regional Colleges South to Regional Universities South **Ranking category changed from Regional Universities South to National Liberal Arts Colleges

10
Table 9 shows additional ranking categories U.S. News uses to supplement the overall rankings. Of note,
Loyola’s undergraduate rankings for Best Value School, A+ for B Students, Highest Amount of Need-
Based Aid Awarded, On-line bachelor degree programs, High School Counselor Ratings, and Best
Undergraduate Business Programs were highly ranked.
Table 9
Undergraduate Rankings
Ranked Categories LUC Rank Out of Total # Inst. Percentile Rank
National Universities Overall Rank 99 298 66.8
Best Online Bachelors Degree Program 79 246 67.9
Most Debt 67 125 46.4
Best Value Schools 47 298 84.2 Highest Amount of Need-based Aid Awarded 52 254 79.5
High School Counselor Rankings 56 298 81.2
Best Undergraduate Business Programs 77 298 74.2
Freshmen Retention rate 116 298 61.1
Top 100 6-Year Graduation rates 96 100 ---- Economic Diversity (% receiving Pell Grants) 179 294 39.1
Most International Students 125 262 52.3
Classes with Fewer than 20 Students 139 295 52.9
Top Rank Group
Ranking Category LUC Rank Top Rank Group
A+ Schools for B Students Top 93
Best Schools for Veterans 64 Top 98

11
Table 10 shows the Loyola graduate programs that were ranked by U.S. News for 2016-17. The program
ranks are listed with percentile rank that show, of note among our ranked graduate programs, Clinical
Psychology, Nursing (along with the Doctoral Nursing Program (DNP), and Social Work. Loyola’s Law
School was highly ranked for Health Care Law, Trial Advocacy, and Best Part-Time Law School.
Table 10
Ranked Categories LUC Rank Out of Total # Inst. Percentile Rank
Arts & Sciences
Top Clinical Psychology Programs 87 224 61.2
Top Biological Sciences Programs 115 254 54.7
Top Psychology Programs 117 246 52.4
Top English Programs 91 152 40.1
Top Sociology Programs 78 117 33.3
Top History Programs 104 147 29.3
Professional
Top Nursing Programs 40 618 93.5
Top Social Work Programs 53 246 78.5
Top Education Programs 99 246 59.8
Top DNP Programs 36 150 76.0
Business
Ranking Category LUC Rank Top Rank Group
Best MBA PT Programs 43 Top 297
Best Supply Chain Logistics Programs 22 Top 22
Law
Best Healthcare Law Schools 8 Top 24
Best Trial Advocacy Schools 10 Top 20
Best Part-Time Law Schools 11 Top 80
Best Law Schools 72 Top 304
Top Rank Group Categories
Graduate Rankings

12
APPENDICES
13
How U.S. News Calculated the 2017 Best Colleges Rankings
By Robert Morse, Eric Brooks and Matt Mason Sept. 12, 2016
The host of intangibles that makes up the college experience can't be measured by a series of
data points. But for families concerned with finding the best academic value for their money, the
U.S. News Best Colleges rankings provide an excellent starting point for the search.
They allow you to compare at a glance the relative quality of institutions based on such widely
accepted indicators of excellence as first-year student retention and graduation rates and the
strength of the faculty. And as you check out the data for colleges already on your short list, you
may discover unfamiliar schools with similar metrics, and thus broaden your options.
Many factors other than those spotlighted here will figure in your decision, including location
and the feel of campus life; the range of academic offerings, activities and sports; and cost and
the availability of financial aid. But if you combine the information on usnews.com with college
visits, interviews and your own intuition, the U.S. News rankings can be a powerful tool in
your quest for the right college.
How the Methodology Works
The U.S. News ranking system rests on two pillars. The formula uses quantitative measures that
education experts have proposed as reliable indicators of academic quality, and it's based on U.S.
News' researched view of what matters in education.
First, regionally accredited schools are categorized by their mission, which is derived from the
breakdown of types of higher education institutions.
National Universities offer a full range of undergraduate majors, plus master's and doctoral
programs, and emphasize faculty research. National Liberal Arts Colleges focus almost
exclusively on undergraduate education. They award at least 50 percent of their degrees in the
arts and sciences.
Regional Universities offer a broad scope of undergraduate degrees and some master's degree
programs but few, if any, doctoral programs. Regional Colleges focus on undergraduate
education but grant fewer than 50 percent of their degrees in liberal arts disciplines; this category
also includes schools that have small bachelor's degree programs but primarily grant two-year
associate degrees.
Regional Universities and Regional Colleges are further divided and ranked in four geographical
groups: North, South, Midwest and West.
Once schools have been divided by category, U.S. News gathers data from each college on up to
15 indicators of academic excellence. Each factor is assigned a weight that reflects U.S. News'
judgment about how much that measure matters. Finally, the colleges and universities in each
category are ranked against their peers, based on their composite weighted score.

14
For more details on the variables used, see the "Ranking Model Indicators" section below.
U.S. News made a few changes for the 2017 edition of Best Colleges. First, U.S. News
recategorized colleges based on the Carnegie Classification of Institutions of Higher Education.
In February 2016, Carnegie, which is the most widely accepted classification system in U.S.
higher education, released official updates – called the "2015 Update" – including to the Basic
Classification used in the U.S. News rankings.
The Carnegie classification, which higher education researchers use extensively, has been the
basis of the Best Colleges ranking category system since our first rankings were published in
1983. The U.S. Department of Education and many higher education associations use the system
to organize their data and determine colleges' eligibility for grant money.
As a result of implementing the Carnegie system updates, around 12 percent of ranked schools
for the 2017 edition of Best Colleges have moved into different categories; for example, a
university categorized previously as a Regional University may now be a National University.
Besides the ranking category updates, U.S. News also made a change in the methodology,
specifically with how the class size ranking indicator was compiled for the 2017 edition of the
Best Colleges rankings.
Previously class size had two components: the proportion of classes with fewer than 20 students
(30 percent of the faculty resources score) and the proportion with 50 or more students (10
percent of the faculty resources score).
For the new rankings, U.S. News has created one class size index measure (40 percent of the
faculty resources score) that takes fuller advantage of all the data schools report on class size.
Small classes still count more than large classes in every case. As a result, this indicator is a
more nuanced factor than in the past.
Unranked Schools
Schools are unranked and listed separately by category if they have indicated that they don't use
SAT or ACT scores in admissions decisions for first-time, first-year, degree-seeking
applicants. Schools that have test-optional admissions policies for submitting ACT and SAT
scores are included in the rankings because ACT and SAT scores are still used in the admissions
process for the students who submit them.
In a few cases, schools are not ranked if too few respondents to the 2015 and 2016 peer
assessment surveys gave them ratings.
Other reasons institutions are not ranked include: a total enrollment of fewer than 200 students, a
large proportion of nontraditional students and no first-year students – as is the situation at so-
called upper-division schools.
As a result of these eligibility standards, many for-profit institutions have been grouped with the
unranked schools, because their bachelor's degree candidates are largely nontraditional students
in degree-completion programs, for example, or they don't use SAT or ACT scores in admissions
decisions.

15
In total, 162 colleges in the National Universities, National Liberal Arts Colleges, Regional
Universities and Regional Colleges categories are listed as unranked.
Data Sources
Most of the data come from the colleges. This year, 93 percent of the 1,374 ranked colleges and
universities surveyed returned their statistical information during the spring and summer 2016
data collection window.
A ranked college is defined as a college in the National Universities, National Liberal Arts
Colleges, Regional Universities and Regional Colleges categories that is numerically ranked or
listed as Rank Not Published.
In total, U.S. News has collected data on more than 1,800 colleges. While all the data appear on
usnews.com, only 1,374 schools are included in the rankings described in this methodology and
given a numerical rank or Rank Not Published designation.
We obtained missing data from a number of sources, including the National Collegiate Athletic
Association (graduation rates), the Council for Aid to Education (alumni giving rates) and the
U.S. Department of Education's National Center for Education Statistics (information on
financial resources, faculty, SAT and ACT admissions test scores, acceptance rates and
graduation and retention rates).
Estimates, which U.S. News does not display, may be used in the ranking calculation when
schools fail to report particular data points that are not available from other sources. Missing data
are reported as N/A in the ranking tables on usnews.com.
For colleges that were eligible to be ranked but refused to fill out the U.S. News statistical survey
in spring and summer 2016, we have made extensive use of the statistical data those institutions
were required to report to the National Center for Education Statistics, including such factors as
SAT and ACT scores, acceptance rates, number of faculty, student-faculty ratios, and graduation
and retention rates. These schools are footnoted as nonresponders.
Ranking Model Indicators
The indicators used to capture academic quality fall into a number of categories: graduation and
first-year student retention rates, assessment by administrators at peer institutions, faculty
resources, student selectivity, financial resources, alumni giving, graduation rate performance
and, for National Universities and National Liberal Arts Colleges only, high school counselor
ratings of colleges.
The indicators include input measures that reflect a school's student body, its faculty and its
financial resources, along with outcome measures that signal how well the institution educates
students.
The measures, their weights in the ranking formula and an explanation of each follow.
Graduation and retention rates (22.5 percent): The higher the proportion of first-year
students who return to campus for sophomore year and eventually graduate, the better a school is
apt to be at offering the classes and services that students need to succeed.

16
This measure has two components: six-year graduation rate (80 percent of the score) and first-
year retention rate (20 percent). The graduation rate indicates the average proportion of a
graduating class earning a degree in six years or less; we consider first-year student classes that
started from fall 2006 through fall 2009. First-year retention indicates the average proportion of
first-year students who entered the school in the fall 2011 through fall 2014 and returned the
following fall.
Undergraduate academic reputation (22.5 percent): The U.S. News ranking formula gives
weight to the opinions of those in a position to judge a school's undergraduate academic
excellence. The academic peer assessment survey allows top academics – presidents, provosts
and deans of admissions – to account for intangibles at peer institutions, such as faculty
dedication to teaching.
To get another set of important opinions on National Universities and National Liberal Arts
Colleges, U.S. News also surveyed 2,200 counselors at public high schools, each of which was a
gold, silver or bronze medal winner in a recent edition of the U.S. News Best High
Schools rankings. The counselors surveyed represent every state and the District of Columbia.
Each academic and counselor surveyed was asked to rate schools' academic programs on a scale
from 1 (marginal) to 5 (distinguished). Those who didn't know enough about a school to evaluate
it fairly were asked to mark "don't know."
The score used in the rankings is the average score of those who rated the school on the 5-point
scale; "don't knows" are not counted as part of the average. To reduce the impact of strategic
voting by respondents, U.S. News eliminated the two highest and two lowest scores each school
received before calculating the average score.
The academic peer assessment score in this year's rankings is based on the results from surveys
in spring 2015 and spring 2016.
Both the Regional Universities and Regional Colleges rankings rely on one assessment score, by
the academic peer group, for this measure in the rankings formula. In the case of National
Universities and National Liberal Arts Colleges, the academic peer assessment accounts for 15
percentage points of the weighting in the ranking methodology, and 7.5 percentage points go to
the high school counselors' ratings.
The results from the three most recent years of counselor surveys, from spring 2014, spring
2015 and spring 2016, were averaged to compute the high school counselor reputation score.
This was done to increase the number of ratings each college received from the high school
counselors and to reduce the year-to-year volatility in the average counselor score.
Ipsos Public Affairs collected the data in spring 2016. Of the 4,635 academics who were sent
questionnaires, 39 percent responded. This response rate is down very slightly from the 40
percent response rate in spring 2015 and the 42 percent response rate to the surveys conducted in
spring 2014 and spring 2013.
The counselors' one-year response rate was 9 percent for the spring 2016 surveys, up slightly
from 7 percent in spring 2015.

17
Faculty resources (20 percent): Research shows that the more satisfied students are about their
contact with professors, the more they will learn and the more likely they are to graduate. U.S.
News uses five factors from the 2015-2016 academic year to assess a school's commitment to
instruction.
Class size is 40 percent of this measure. Schools receive the most credit in this index for their
proportion of undergraduate classes with fewer than 20 students. Classes with 20-29 students
score second highest; those with 30-39 students, third highest; and those with 40-49 students,
fourth highest. Classes that have 50 or more students receive no credit.
Faculty salary (35 percent) is the average faculty pay, plus benefits, during the 2014-2015 and
2015-2016 academic years, adjusted for regional differences in the cost of living using indexes
from the consulting firm Runzheimer International. U.S. News also weighs the proportion of
professors with the highest degree in their fields (15 percent), the student-faculty ratio (5
percent) and the proportion of faculty who are full time (5 percent).
Student selectivity (12.5 percent): A school's academic atmosphere is determined in part by
students' abilities and ambitions.
This measure has three components. U.S. News factors in the admissions test scores for all
enrollees who took the critical reading and math portions of the SAT and the composite ACT
score (65 percent of the selectivity score).
U.S. News also considers the proportion of enrolled first-year students at National Universities
and National Liberal Arts Colleges who graduated in the top 10 percent of their high school
classes or the proportion of enrolled first-year students at Regional Universities and Regional
Colleges who graduated in the top quarter of their classes (25 percent).
The third component is the acceptance rate, or the ratio of students admitted to applicants (10
percent).
The data are all for the fall 2015 entering class. While the ranking calculation takes account of
both the SAT and ACT scores of all entering students, the ranking tables on usnews.com display
the score range for whichever test most students took.
U.S. News use footnotes online to indicate schools that did not report to U.S. News the fall 2015
SAT and ACT scores for all first-time, first-year, degree-seeking students for whom the schools
had data. Schools sometimes fail to report SAT and ACT scores for students in these specific
categories: athletes, international students, minority students, legacies, those admitted by special
arrangement and those who started in summer 2015.
U.S. News also uses footnotes to indicate schools that declined to tell U.S. News whether all
students with SAT and ACT test scores were represented.
For schools that did not report all scores or that declined to say whether all scores were reported,
U.S. News reduced the value of their SAT and ACT scores in the Best Colleges ranking model
by 15 percent. This practice is not new; since the 1997 rankings, U.S. News has discounted the
value of such schools' reported scores in the ranking model, because the effect of leaving
students out could be that lower scores are omitted.
18
If a school told U.S. News that it included all students with scores in its reported SAT and ACT
scores, then those scores were counted fully in the rankings and were not footnoted.
If less than 75 percent of the fall 2015 entering class submitted SAT and ACT scores, their test
scores were discounted by 15 percent in the ranking calculations. U.S. News also used this policy
in the 2016 edition of the rankings.
Financial resources (10 percent): Generous per-student spending indicates that a college can
offer a wide variety of programs and services. U.S. News measures financial resources by using
the average spending per student on instruction, research, student services and related
educational expenditures in the 2014 and 2015 fiscal years. Spending on sports, dorms and
hospitals doesn't count.
Graduation rate performance (7.5 percent): This indicator of added value shows the effect of
the college's programs and policies on the graduation rate of students after controlling for
spending and student characteristics, such as test scores and the proportion receiving Pell Grants.
U.S. News measures the difference between a school's six-year graduation rate for the class that
entered in 2009 and the rate U.S. News had predicted for the class.
If the school's actual graduation rate for the 2009 entering class is higher than the rate U.S. News
predicted for that same class, then the college is enhancing achievement, or overperforming. If a
school's actual graduation rate is lower than the U.S. News prediction, then it is
underperforming.
Alumni giving rate (5 percent): This reflects the average percentage of living alumni with
bachelor's degrees who gave to their school during 2013-2014 and 2014-2015, which is an
indirect measure of student satisfaction.
To arrive at a school's rank, U.S. News first calculated the weighted sum of its standardized
scores. The final scores were rescaled so that the top school in each category received a value of
100, and the other schools' weighted scores were calculated as a proportion of that top score.
Final scores were rounded to the nearest whole number and ranked in descending order. Schools
that are tied appear in alphabetical order and are marked as tied on all ranking tables.
Check out usnews.com over the coming year, since we may add content to the Best Colleges
pages as we obtain additional information. And as you mine these tables for insights – where
your SAT or ACT scores might win you some merit aid, for example, or where you will be apt to
get the most attention from professors – keep in mind that they provide a launching pad, not an
easy answer.