Embed Size (px)
Citation preview

Lower Cannon River
Turbidity TMDL Implementation Plan
October 2009
Submitted to the Minnesota Pollution Control Agency
by the Cannon River Watershed Partnership
wq-iw9-04c


Preface
This implementation plan was written by the Cannon River Watershed Partnership with input and assistance from the citizens, farmers, trade associations, Midwest Grasslands, the Dakota and Goodhue Soil and Water Conservation Districts (SWCDs), Dakota County Parks, the Natural Resource Conservation Service (NRCS), the cities of Red Wing and Cannon Falls, the Metropolitan Council, the Minnesota Pollution Control Agency, the Minnesota Department of Natural Resources, and the Board of Water and Soil Resources. Two meetings were held in August and September of 2009 to gather input and review the draft document. The Cannon River Watershed Partnership would like to thank all who committed time and effort to make this planning process successful. A list of meeting participants follows.
Name Affiliation Wayne Anderson MPCA – St. Paul
Khalil Ahmed MPCA - Rochester
Donald Banks Goodhue County SWCD Supervisor, CRWP Board of Directors
Karl Bischoff Vasa resident/ CRWP member and volunteer
Travis Bistodeau Dakota County SWCD staff
Paul Drotos City of Red Wing
Jack Frost Metropolitan Council
Warren Formo Minnesota Agricultural Water Resources Coalition
Phillip Hammes Cannon Falls City Council
Ross Hoffmann CRWP staff
Brad Hovel Cannon Falls resident/farmer
Nancy Hovel Cannon Falls resident/farmer
Tim Howie Dennison resident/farmer
Beth Kallestad CRWP staff
Beau Kennedy Goodhue County SWCD/Water Planner
Elise Knapp Welch resident, Friends of Lower Cannon River
Howard Moechnig Midwest Grasslands, retired NRCS grazing specialist
B-J Norman Vasa resident, CRWP member and volunteer
Ben Norman Vasa resident, CRWP member and volunteer
Bruce Peterson Northfield, farmer
George Rehm Cannon Falls resident, retired U of M Extension
Michelle Schaefers Board of Water and Soil Resources
Keith Schrader Nerstrand resident/farmer
Jack Weber Cannon Falls resident/farmer
Doug Weber Cannon Falls resident/farmer
Scott E. Weber Rosemount resident/farmer
John Weber Cannon Falls resident/farmer

Executive Summary ........................................................................................................................ 1
TMDL Report Summary ................................................................................................................. 2
Project History ........................................................................................................................................................2
Watershed Characteristics ......................................................................................................................................3
Subwatersheds ....................................................................................................................................................3
Byllesby Reservoir Consideration ..........................................................................................................................6
Lake Pepin TMDL Consideration ..........................................................................................................................7
Turbidity Impairment .............................................................................................................................................7
Turbidity .............................................................................................................................................................7
Source Assessment .............................................................................................................................................7
Measurable Water Quality Goals .......................................................................................................................8
Turbidity Allocations (expressed in TSS) and Reductions.................................................................................9
Priority Management Areas .......................................................................................................... 12
Research ............................................................................................................................................................... 12
Research Underway .......................................................................................................................................... 12
Future Research ................................................................................................................................................ 13
Recent Activities ........................................................................................................................... 16
Dakota County SWCD ......................................................................................................................................... 16
North Cannon River Watershed Management Organization ................................................................................ 17
Cannon River Watershed Partnership ................................................................................................................... 17
Goodhue SWCD ................................................................................................................................................... 21
BMP Summary ..................................................................................................................................................... 23
Monitoring Summary .................................................................................................................... 24
Management Alternatives ............................................................................................................. 26
Nonpoint Sources ................................................................................................................................................. 26
Structural Practices ........................................................................................................................................... 26
Vegetative Practices ......................................................................................................................................... 27

Point Sources ........................................................................................................................................................ 30
Municipal & Industrial Discharges................................................................................................................... 30
Urban Stormwater ............................................................................................................................................ 30
Action Items .................................................................................................................................. 32
Strategy A: Field Erosion Control ....................................................................................................................... 32
Strategy B: Grazing ............................................................................................................................................. 34
Strategy C: Ravine Erosion Control ..................................................................................................................... 34
Strategy D: Stream Bank and Bluff Erosion Control ........................................................................................... 34
Strategy E: Ordinances ........................................................................................................................................ 35
Strategy F: Urban Stormwater .............................................................................................................................. 35
Strategy G: Tracking and Monitoring ................................................................................................................. 36
Strategy H: Education and Outreach ................................................................................................................... 36
Strategy I: Evaluation .......................................................................................................................................... 37
Roles and Responsibilities of Project Partners ..................................................................................................... 38
Adaptive Management Process ..................................................................................................... 40
Budget ........................................................................................................................................... 40
References ..................................................................................................................................... 41
Appendices .................................................................................................................................... 42
Appendix A – Maps ...................................................................................................................... 43
Appendix B – Monitoring Activities ............................................................................................ 61
Appendix C – Grazing and Buffer Summaries ............................................................................. 62
Appendix D – GIS Resources (CD available upon request) ......................................................... 66

Figures and Tables
Figure 1 – Cannon River Watershed and Major Watershed Lobes
Figure 2 – Lower Cannon River Watershed
Figure 3 – Turbidity/TSS relationship (1995-2004 MPCA, LTRMP, and CRWP data)
Figure 4 – Dakota County Tillage 2007 Transect – Crop Type
Figure 5 – Dakota County Tillage 2007 Transect – Tillage Type
Figure 6 – Goodhue County Tillage 2007 Transect – Crop Type
Figure 7 – Goodhue County Tillage 2007 Transect – Tillage Type
Figure 8 – Landuse statistics for shoreland land within 300 feet of the stream centerline.
Figure 9 – Landuse statistics for shoreland land within 50 feet of the stream centerline.
Figure 10 – Example of shoreland mapping in Goodhue County; various landuses colored by their MLCCS code.
Figure 11 – Progression of streambank erosion repair with cedar trees.
Figure 14 – 2002-2009 BMPs in the Lower Cannon River Watershed
Figure 15 – Monitoring sites in the Lower Cannon River watershed
Figure 16 – Mean Daily Flow on Cannon River at Welch, MN Figure 17 – Example of Stream Shoreland Buffer
Figure 18 – Example of No-Till and Conventional Tillage Practices
Table 1 – Subwatersheds of the Lower Cannon River Watershed
Table 2 – Total Daily Loading Capacities, Wasteload and Load Allocations (expressed as tons/day TSS)
Table 3 – Comparison of 90th percentile loading capacity to capacity at the mid-point of the zone.
Table 4 – Goodhue SWCD BMP Summary 2005-2009
Table 5 – TSS data at LTRMP site and Welch site on Cannon River

Executive Summary The federal Clean Water Act requires states to assess the quality of their surface waters to determine if they are meeting state water quality standards. In Minnesota, the Minnesota Pollution Control Agency (MPCA) is responsible for addressing this requirement. Waters that do not meet standards for a given pollutant are added to the state’s 303(d) impaired waters list. Each impaired water requires a Total Maximum Daily Load (TMDL) study to further understand the level of pollution present, determine how much pollution the water can handle and still meet the water quality standards, and estimate pollutant reductions needed to meet the standards.
This project began with two reaches of the Cannon River being added to the impaired waters list due to aquatic life (turbidity) impairment. The Cannon River, HUC boundary in Rice Lake Bottoms to Vermillion Slough/Mississippi River, AUID 07040001-511, was placed on the 303(d) list for aquatic life in 1996 based on data collected at the Long-Term Resource Monitoring Program (LTRMP) site. The Cannon River, Pine Creek to Belle Creek, AUID 07040002-502, was added in 2004 for aquatic life based on data collected by the Cannon River Watershed Partnership (CRWP) and Metropolitan Council. These reaches are referred to as the “confluence reach” and the “Pine to Belle” reach respectively.
The Cannon River Watershed Partnership (CRWP) received a grant from the MPCA in 2003 to develop the Lower Cannon River Turbidity TMDL. CRWP worked to compile existing data, collect additional samples, and coordinate a technical committee and public meetings. MPCA staff completed the TMDL document and initiated a public review of the work. The TMDL was approved by the US Environmental Protection Agency in July 2007. Work on the Implementation Plan began in May 2009.
The TMDL study sets some significant load reductions for sediment in the Lower Cannon River watershed. The water quality goal is Total Suspended Solids (TSS) values of 44 mg/L or less. The reduction scenarios in the TMDL are based on a load duration curve from low flow to high flow. The most dramatic reductions are required during high flow conditions: 82% at the confluence reach and 49% at the Pine to Belle reach. Mid range flows require a 39% reduction at the confluence reach and an 8% reduction at the Pine to Belle reach. Under low flow conditions no reductions are needed.
Nonpoint sources are the major contributor of sediment in the Lower Cannon River watershed. While the TMDL gives a load allocation for nonpoint sources, it does not identify in detail priority sources or geographic areas. An important first step in implementation will be to conduct more research to better understand sediment sources. Most of the action steps in this plan have been steered by existing principles of soil conservation that are appropriate to apply in southeast Minnesota; the focus is on reducing sediment from fields, ravines, bluffs, and stream banks. Modifying hydrology will also be important as the volume and speed of water affects sediment movement.
The turbidity impairment in the Lower Cannon River is a long-standing problem that will require long-term management. This implementation plan is part of a greater One Water Strategy that is being developed for the entire Cannon River watershed. This strategy will promote further and better understanding of appropriate land management according to the progress in research inventory work and monitoring. As such, implementation of BMPs in the Lower Cannon watershed will be an adaptive process. Addendums to this plan are anticipated and necessary.
This plan is designed to guide implementation activities for the next ten years. Progress should be reviewed at least annually by the stakeholders listed above with input from the public to assess progress.
1

TMDL Report Summary Project History Interested citizens began monitoring sites on the Little Cannon River and on Belle Creek in 1999, well before the project began. The TMDL utilized data collected by these and other citizen stream monitors in listing the reaches on the 303(d) Impaired Waters list. The Cannon River Watershed Partnership (CRWP) received funding from the Minnesota Pollution Control Agency (MPCA) to develop the Lower Cannon River Turbidity Total Maximum Daily Load (TMDL) study in 2003. The project began with a collection and assessment of existing turbidity and sediment data in the watershed. During this data mining process, project partners and volunteers collected more water quality samples, field measurements and observations. As recommended in the MPCA’s draft work plan for the southeastern Minnesota sediment study, devoting the first stage of the project to a survey of information allowed us to understand existing data, and fill any gaps with water quality monitoring the second year of the project. After the second field season (2004) we began the load determination process and the writing of the TMDL study document. The technical committee began meeting in July, 2005. Public participation in the TMDL formally began at the first Steering Committee meeting June 6, 2003. Discussions focused on the data to be used, modeling and results, aquatic biology, erosion potential, sources of sediment, and the determination of load allocations.
A draft document was submitted by CRWP to the MPCA in June 2006. After public comment and review by US EPA, the TMDL was approved by the MPCA on July 13, 2007. This implementation plan was developed in the summer of 2009.
2

Watershed Characteristics The Cannon River Watershed includes approximately 941,000 acres (~1470 square miles) of primarily agricultural landscape. Because it is a relatively large watershed, subwatershed lobes are often referenced: Straight River Watershed, Upper Cannon River Watershed, Middle Cannon River Watershed, and the Lower Cannon River Watershed. Table 1 describes the land area and Figure 1 is a map of the subwatershed areas.
Figure 1 – Cannon River Watershed and Major Watershed Lobes
Subwatersheds The Little Cannon River joins the Cannon River in the city of Cannon Falls; downstream are the confluences of Pine Creek and Trout Brook. The next major tributary is Belle Creek. The Cannon River meets the Mississippi River in Red Wing, near the Wisconsin-Minnesota border. Table 1 displays land area information. Figure 2 is a map of the entire Lower Cannon watershed. Maps of the individual subwatersheds are included in Appendix A.
3

Table 1 – Subwatersheds of the Lower Cannon River Watershed
Subwatershed Acres Percent of watershed Note
Little Cannon River 60,988 29% Designated trout stream
Belle Creek 50,353 24%
Trout Brook 17,860 9% Designated trout stream
Spring Creek 17,327 8% Designated trout stream
Pine Creek 14,742 7% Designated trout stream
Unnamed watersheds 46,375 22%
LCRW Total 207,645
Little Cannon River The Little Cannon River is primarily in Goodhue County, with a small portion in Rice County. It is the largest subwatershed in the Lower Cannon River watershed. The city of Nerstrand (population ~ 236 ) is in the headwaters area, the town of Sogn (population ~ 20) is in the center and the city of Cannon Falls (population ~ 3876) is at the mouth of the river where it joins the Cannon River at river mile 25. Other than these three areas the remainder of the watershed consists of primarily agricultural land, pasture, and forest. The watershed drains approximately 96 square miles. Channel slopes range from 52.8 (f/mile) on Butler Creek to 13.1 (f/mile) on a portion of the Little Cannon (Sanocki, 1999). Maximum elevation is ~1200 feet and the minimum is ~820 feet. Reaches in the upper portion are designated as Class 2A Trout Stream.
Belle Creek The entire Belle Creek drainage lies in Goodhue County and includes no incorporated cities – only small communities such as Vasa, Belle Creek and White Rock. The watershed includes ~ 850 acres (1.7%) of public land (State of MN and MN DNR) in the bottom third of the watershed. It enters the Cannon River at river mile 11 about a mile downstream from the village of Welch. This watershed drains about 75 square miles and has one of the steepest gradients of all of the Cannon River tributaries at about 14 feet per mile. It is a 4th order stream and is primarily agricultural in the headwaters and forest from the mid reach down to the mouth There are several impoundments in the headwaters which were built from 1976 - 1983 to help control the flow during periods of heavy precipitation. Prior to the installation of these structures, the sediment load at the Belle Creek outlet was estimated at approximately 44,000 tons annually (Major, 1974). At the time they were installed, it was estimated that the structures would help to reduce sediment loading downstream by approximately 3,000 tons annually.
4

Figure 2 – Lower Cannon River Watershed
Trout Brook Nearly all of the Trout Brook drainage lies in Dakota County. It flows through Miesville Ravine Park and joins the Cannon River at the Dakota-Goodhue County line. The Trout Brook watershed includes two cities: New Trier (population ~ 100) in the western lobe, and Miesville (population ~100-150) in the northeastern lobe. Only 8.8 miles are defined as perennial stream and are primarily spring fed. Trout Brook can be a “flashy stream” when snowmelt or rain on the upper portions of the sub-watershed cause the water to rise quickly and become turbid. In its 1999 survey, the MN DNR called the Miesville branch “Trout Brook” and the New Trier branch “Tributary to Trout Brook”. The trout stream designation extends from the mouth of the stream, past the confluence of these two branches ~0.8 miles up the New Trier branch only. The entire length of the designated stretch includes well-forested flood plains and vegetative cover on the stream banks. However, the North Cannon River Watershed Management Organization 2003 Management Plan noted shifting sands in the streambed that have resulted in a significant absence of deep holes, and consequently, less cover for fish species. A turbidity TMDL study for Trout Brook is planned to begin in 2011 and will be led by the Dakota SWCD.
5

Spring Creek Spring Creek is the second smallest of the subwatersheds. It is located in the eastern most portion of the watershed in Goodhue County and ends in the City of Red Wing (population ~ 16,211). This watershed drains approximately 27 square miles with a channel slope of 24 f/mile (Sanocki, 1999). Maximum elevation ~ 1078 feet and minimum is ~700 feet. Land use is primarily agricultural (70%) and pasture/range land (29%). The Richard J. Dorer Memorial Hardwood State Forest extends into this subwatershed. While Spring Creek is considered a part of the Lower Cannon watershed, it actually joins the Cannon River downstream of the two impaired river reaches.
Pine Creek Most of the Pine Creek drainage lies in Dakota County (~90%) while the remainder of the acreage is in Goodhue County. The majority of the watershed lies in three townships: Hampton, Douglas, and Cannon Falls. Pine Creek joins the Cannon River approximately 0.7 stream miles downstream of the Goodhue County 17 bridge. During the dry season, the stream flow is made up mostly of ground water and its temperature is quite cool and the water is very clear. Turbidity levels are generally below the state standards (10 NTU for Class 2A waters), however during rainfall events samples have been taken that exceed the standards (NCRWMO,2003). Pine Creek is divided into two separate classes according to Minnesota Rules Chapter 7050. Upstream of Hwy 52, the creek is classified as “2C”, which “shall permit the propagation and maintenance of a healthy community of indigenous fish and association aquatic life, and their habitats, and shall be suitable for boating and other forms of aquatic recreation. Below Hwy 52 Pine Creek is a State designated trout stream and classified as “2A” in Chapter 7050. Here the creek “shall be such as to permit the propagation and maintenance of a healthy community of cold water sport or commercial fish and associated aquatic life, and their habitats, and shall be suitable for aquatic recreation of all kinds, including bathing (swimming).( NCRWMO, 2003)
Byllesby Reservoir Consideration As described previously, the Cannon River watershed is often divided into four major subwatersheds; the Straight River, Upper Cannon, Middle Cannon, and Lower Cannon. The Lower Cannon is the area downstream of The Byllesby Reservoir. The Lower Cannon subwatershed is approximately 22% of the 1470 square miles that make up the entire Cannon River watershed.
The two impaired river reaches addressed in this report are part of the Lower Cannon. An initial premise of this project was that the Byllesby Reservoir serves as a “reset point” for the Cannon River’s water quality. The idea is that the Byllesby Reservoir traps and retains much of the sediment that may be coming from the Straight, Upper, and Middle watersheds. Consequently, turbidity is reduced just downstream of the reservoir, and increases again mainly as a function of sources in the Lower Cannon watershed. While substantial amounts of sediment are being retained in the Byllesby Reservoir, it is an oversimplification to describe it as a reset point. Under certain conditions (i.e. high flows) large amounts of sediment are transported through the reservoir into the Lower Cannon. The precise amounts are not well known. The Byllesby Reservoir also impacts flow in the Lower Cannon, although to a lesser degree than sediment. Unlike sediment, virtually all water entering the Byllesby Reservoir eventually moves downstream, even though there is some temporary storage that varies due to a number of factors. The exact nature of this storage is not completely understood. In this TMDL study we found that the greatest sediment reductions are needed at times of high flow conditions. It is these conditions that are most likely to result in sediment being pushed through the reservoir and dam.
Given the uncertainty regarding the sediment and flow effects of the Byllesby Reservoir on the Lower Cannon, the decision was made to not attempt to explicitly account for these effects in the TMDL allocations. The implication of this is that pollutant sources upstream of the Byllesby Reservoir will not be “allowed” to discharge more turbidity-causing load simply because some of it may be retained in the Byllesby Reservoir. At the same
6

time, it is still the case that pollutant sources downstream of the Byllesby Reservoir will have a more immediate impact on turbidity in the Lower Cannon. As such, efforts to reduce or eliminate sources of turbidity should be focused on the Lower Cannon and its tributaries: the Little Cannon River, Trout Brook, Pine Creek, Spring Creek, and Belle Creek.
Lake Pepin TMDL Consideration A separate TMDL study for turbidity and excess nutrients is currently underway for Lake Pepin, a lake within the Mississippi River, located several miles downstream of the confluence of the Cannon and Mississippi Rivers. The Lake Pepin TMDL study will require reductions in sediment and nutrients from the Cannon River watershed. The Lower Cannon Turbidity TMDL will require greater pollutant load reductions than those required by the Lake Pepin TMDL study. It is anticipated that the Lake Pepin TMDL study will provide additional implementation guidance, especially with respect to the MS4 communities.
TurbidityTurbidity Impairment
Turbidity is a measure of opacity, or the degree to which light is scattered or absorbed by water. Turbidity is typically expressed in nephelometric turbidity units (NTUs). Total suspended solids (TSS) is a closely related mass-based measure of water quality, generally expressed as milligrams per liter (mg/l). Light scatter and absorption is strongly influenced by solid material suspended in the water column – hence the close relationship between turbidity and TSS.
Source Assessment As part of the TMDL load allocation process a source inventory was developed. Potential sources of sediment to the Lower Cannon river include: National Pollutant Discharge Elimination System (NPDES) permit holders – municipal waste water treatment plants, industrial facilities, and MS4 cities, as well as nonpoint sources – natural background, agriculture (crops and livestock grazing), aggregate mining, unpaved roads, stream bank and stream bed, and stormwater from communities that are not permitted MS4 dischargers. The point sources in the watershed contribute approximately 4.7 tons/day of sediment to the river based on their permit limits. Nonpoint sources dominate the sediment load, contributing approximately 1300 tons/day during high flow conditions. An assessment of nonpoint sources was not part of the TMDL study process beyond recognizing general categories.
Critical conditions based on needed TSS load reductions occur during higher flows (see Section 3.2 of TMDL). Other than the April-October “open water” period, when TSS loads are somewhat higher, there does not appear to be an additional strong seasonal effect (see Section 3.3 of TMDL). The impact of the April-June period, when row crop land is arguably most vulnerable to soil erosion, was evaluated. No clear effect was observed.
Citizen stream monitoring data are available at a site on the Cannon River approximately 1 mile downstream of the Byllesby Reservoir dam from 2003 – 2008. A total of 135 water clarity values were collected during this time with a 60 cm transparency tube. For assessment purposes a transparency tube reading of 20 cm has been determined to be equivalent to 25 NTU. The water clarity data downstream of the dam show 127 of 135 values greater than 20 cm. The median result was 45 cm and the mean was 43. Another monitoring site located at 9th Street North in Cannon Falls has TSS data from 2003 and 2004. A total of 35 samples were collected. The values range from 2 – 28 mg/L. None exceed the 44 mg/L level that we are striving to attain in the impaired reaches. These data indicate that the water clarity and sediment load at sites close to the outflow of the Byllesby Reservoir are meeting water quality standards with respect to turbidity for the time periods sampled and suggest that most of the turbidity impairment on the Lower Cannon is coming from sources within the Lower Cannon River watershed. Monitoring will continue at these sites to further assess water quality over time.
7

Measurable Water Quality Goals In the Cannon River watershed, the most significant drivers of the turbidity impairment are nonpoint source (including natural background) sediment loads: those from upland sources, streambanks, and stream channels. Soil erosion and sediment delivery are commonly expressed in terms of annual or daily mass loads (tons/year or tons/day). Likewise, to express allowable pollutant loads and required load reductions, a turbidity TMDL must document the relationship between turbidity and suspended solids (a measurable, mass parameter). In this respect, the wasteload and load allocations, and any point or nonpoint source load reductions that may be necessary to meet the allocations, will be expressed in terms that permit holders, agricultural professionals, and the construction/development industry can understand and implement.
Figure 3 shows the relationship between TSS and turbidity for the water samples collected by the MPCA, CRWP and LTRMP. Based on the regression depicted in Figure 3, 44 mg/l is the TSS “equivalent” of the 25 NTU water quality standard. A more detailed explanation of how this TSS value was chosen can be found in the TMDL study document.
Figure 3 – Turbidity/TSS relationship (1995-2004 MPCA, LTRMP, and CRWP data)
y = 1.9447x0.9703
R2 = 0.8448
1
10
100
1000
10000
0.1 1 10 100 1000 10000
Turbidity (NTU)
TSS
(mg/
l)
25 NTU = 44 mg/l TSS
8

Turbidity Allocations (expressed in TSS) and Reductions The process for calculating the allocations was as follows:
WASTELOAD ALLOCATION
• The sum of permitted TSS loads from all wastewater treatment and industrial facilities with numeric discharge limits for TSS was assigned to that portion of the wasteload allocation for the two impaired reaches.
• The allocation for the remaining wasteload sources (MS4, construction, and industrial stormwater) was determined based on the estimated percentage of land in the impaired reach watersheds affected by these uses. For example, if 3% of the watershed is covered by communities subject to MS4 permit requirements, then 3% of the available loading capacity is assigned to those communities. There is an equitable nature to this approach in that it holds urban and industrial stormwater sources to the same “standard” as rural and agricultural sources.
LOAD ALLOCATION
• The load allocation includes nonpoint sources that are not subject to NPDES permit requirements, as well as “natural background” sources. These include sources of TSS such as soil erosion from cropland, sediment-laden runoff from communities not covered by NPDES permits, and streambed and streambank erosion resulting from human-induced hydrologic changes and disturbance of stream channels and riparian areas. Natural background sources of TSS would include generally low levels of soil erosion from both stream channels and upland areas. The load allocation expressed in Table 2 is simply the loading capacity that remains after wasteload allocation and margin of safety have been subtracted.
• Ideally, the load allocation could be broken down into sub-categories such as natural background, cropland erosion, streambed and streambank erosion, gully formation, etc. Or, it could be broken down by subwatershed (e.g. Little Cannon River, etc.). Unfortunately, current understanding of the different source or subwatershed contributions to turbidity in the Cannon River watershed is not sufficient for such numerical breakdowns. Nevertheless, the water quality and watershed analysis completed in this study, combined other literature, is sufficient to allow for a qualitative discussion of the importance of different sources and subwatersheds. As mentioned previously in the Turbidity Source Assessment section, more work remains to be done in this area.
Table 3 compares the 90th percentile TSS load for each of the flow zones to the loading capacity at the mid-point of the flow zone. The difference between these two sets of numbers produces the estimated percent reduction in TSS load that will be necessary for the Lower Cannon to be removed from the impaired waters list (i.e. fewer than 10% of samples exceed 25 NTU). These reductions should not be confused with the target of the wasteload and load allocations, which is to meet the 25 NTU standard on all days. Nevertheless, the reduction percentages do describe a scenario under which the Lower Cannon would no longer be considered impaired. It must be noted that these percent reduction figures may only roughly correspond to certain potential source reductions. For example, a 25 % reduction in soil erosion from cropland or constructions sites may or may not produce a directly corresponding reduction of instream TSS loads. Many variables, which can be quite difficult to measure and understand, influence such relationships.
9

Table 2 – Total Daily Loading Capacities, Wasteload and Load Allocations (expressed as tons/day TSS)
Watershed Areas (square miles)
Welch = 1340
Confluence = 1470
Pine-Belle Reach = 1386
Flow Zone
High Flows Moist Conditions
Mid-Range Flows
Dry Conditions Low Flows
values expressed as tons/day TSS
Cannon River, HUC boundary in Rice Lk Bottoms to Vermillion Slough/ Mississippi R, (AUID: 07040001-511) – referred to in report as Confluence reach
Total Daily Loading Capacity 419 147 83 50 32
Wasteload Allocation
Wastewater Treatment and Industrial Facilities with Numeric Discharge Limits for TSS
4.7 4.7 4.7 4.7 4.7
MS4 Communities 8.1 2.9 1.9 1.0 0.5
Construction Stormwater (NPDES) 2.7 1.0 0.6 0.3 0.2
Industrial Stormwater (NPDES) 1.4 0.5 0.3 0.2 0.1
Load Allocation 258 93 61 32 15
MOS 144 45 14 12 12
Cannon River, Pine Creek to Belle Creek (AUID: 07040002-511)
Total Daily Loading Capacity 392 138 77 46 30
Wasteload Allocation
Wastewater Treatment and Industrial Facilities with Numeric Discharge Limits for TSS
4.7 4.7 4.7 4.7 4.7
MS4 Communities 7.6 2.7 1.8 0.9 0.4
Construction Stormwater (NPDES) 2.5 0.9 0.6 0.3 0.1
Industrial Stormwater (NPDES) 1.3 0.5 0.3 0.2 0.1
Load Allocation 241 87 57 29 14
MOS 135 42 13 11 11
Assumptions for stormwater wasteload allocations:
• MS4 communities will comprise 3% of the land area of the respective impaired reach watershed areas • Construction stormwater sites will comprise 1% of the land area of the respective impaired reach watersheds • Industrial stormwater sites will comprise 0.5% of the land area of the respective impaired reach watersheds
10

Table 3 – Comparison of 90th percentile loading capacity to capacity at the mid-point of the zone.
• capacity is mid-point for flow zone
• current load is 90th percentile value for flow zone
Flow Zone
High Flows Moist Conditions
Mid-Range Flows
Dry Conditions
Low Flows
values expressed as tons/day TSS
Confluence
07040001-511
Capacity 411 145 81 49 31
Current Load 2264 591 132 61 20
% Red. Needed 82% 76% 39% 20% 0%
Pine-Belle
07040002-502
Capacity 381 134 75 45 29
Current Load 748 183 81 16 5
% Red. Needed 49% 27% 8% 0% 0%
11

Priority Management Areas A detailed source assessment of the nonpoint sources in the Lower Cannon River watershed has not been completed to date. However, we do have some general knowledge of priority areas in the Lower Cannon now. Approximately 64% of the land in the watershed is considered highly erodible land (HEL). Highly erodible land is determined by using the equation as established in the 1985 Farm Bill:
R•K•LS/T = HEL value where:
R = rainfall and runoff,
K = the degree to which the soil resists water erosion,
LS = the effects of slope length (L) and steepness (S), and
T = tolerable soil loss.
An HEL value of 8 or above classifies the land as highly erodible (personal communication, Laurie Svien, NRCS, Rochester, MN September 15, 2009)
The subwatershed maps in Appendix A show HEL land in pink (data provided by Dakota SWCD and Goodhue County SWCD). As HEL land is more likely to erode these areas should be given high priority.
The upper portion of the Trout Brook watershed is of concern. The soils, topography and farming practices in this subwatershed have the potential to create significant runoff that can lead to erosion and enlarged gullies.
Research In order to truly define priority management areas, it is important to spend some time determining sediment sources in order to better manage them. “We must move away from random acts of conservation and provide solid, convincing evidence to land managers of the hydrologic pathways and processes that are driving poor water quality.” (Magner,2008). The following are some suggestions for
ay as well as additional research that could be helpful. research that is underwResearch Underway Little Cannon River A reliable means of identifying problem areas in a watershed is through long-term water quality monitoring. Continuous water quality monitoring at multiple locations throughout the watershed is optimal, but difficult to sustain. Another option is to implement models to gain a more comprehensive understanding of the various processes occurring in a watershed that affect water quality. Hydrologic modeling is not a replacement for water quality monitoring; rather it is a complementary effort that utilizes the flow and water quality data already collected for model calibration. This improves the accuracy of the model in predicting the impact of land management changes and/or climate on runoff, water quality, and nutrient and sediment transport. As the availability of monitoring data increases, models can be updated for improved accuracy.
12

A simulation study using the SWAT (Soil Water Assessment Tool) model in the Little Cannon watershed has been initiated to gain a better understanding of water quality issues – including sediment sources – in the watershed. In SWAT, a watershed is divided into multiple subwatersheds, which are then further subdivide into hydrologic response unit (HRUs) that consist of homogeneous land use, management, and soil characteristics. Flow generation, sediment yields, and nonpoint-source loadings from each HRU in a subwatershed are summed, and resulting loads are routed through channels, ponds, and/or reservoir to the watershed outlet. Key components of SWAT include hydrology, plant growth, erosion, nutrient transport, and transformation, pesticide transport, and management practices.
The outcome of this effort will help us to quantify relationships between specific land use practices, hydrology, and generation of sediment, nitrate, phosphorus loads. This information will aid in implementing BMPs where they have the greatest impact and thus further the pursuit of load reductions aimed at meeting the total maximum daily loads (TMDLs) for the impaired reaches. Results from this
ailable in early 2010 and will be added as an addendum to this implementation plan. effort should be avFuture Research Riparian Channel Assessment and Inventory Based on information provided by the Goodhue and Dakota County SWCDs (and LiDAR data if available), perennial and intermittent river, stream and ravine corridors will be examined to identify and prioritize “sediment source spots” (S3). S3s are defined as locations either within a channel or in the adjacent riparian zone that are currently eroding or are at risk of eroding and delivering fine-grained sediment to the Lower Cannon River. Once identified, each S3 will be ground-truthed and ranked according to the severity of the site, restoration potential and landowner cooperation. Additionally, this information will be incorporated into a larger database of upland sediment sources for modeling, sediment budget development and evaluating the future effectiveness of BMP actions throughout the Lower Cannon River watershed. For example, sites that deliver large amounts of cohesive soil to a perennial flowing stream under varying climatic conditions will be ranked high. Further, given a fair presentation of the problem to the landowner and the landowner’s willingness to fix the problem will result in bonus points to implement a BMP(s) as soon as feasible based on the availability of implementation funds. Most BMP actions will require some level of vegetative management in the riparian corridor and streambank; however, some in-channel rock structures and earth movement may be needed to better manage sediment continuity and reduce the amount of suspended sediment in the water column. Each high priority S3 will have an initial BMP action plan with estimated costs to stabilize or restore the S3.
Tillage Survey Tillage surveys in the watershed were last completed in 2007 by the Dakota and Goodhue SWCD staff. These surveys provide information regarding crop type and tillage method at grid points in the watershed. Maps displaying tillage by crop type, and tillage by residue are provided in Appendix A. Figures 4 and 5 depict crop type and residue in Dakota County and Figures 6 and 7 summarize these data for Goodhue County. The data indicate that for both counties corn and soybeans are the predominant crops with small acreages of hay, grass, and alfalfa. Mulch and reduced tillage are practiced on approximately half of the acres in the two counties. These transects depict a snapshot of the cropping systems in the watershed. In order to better assess implemented practices and thus understand potential for improvement, a more complete survey of the entire Lower Canon watershed should be completed to collect this information on all fields that can be viewed from roadways.
13

Figure 4 – Dakota County Tillage 2007 Transect – Crop Type
Figure 5 – Dakota County Tillage 2007 Transect – Tillage Type
14

Figure 6 – Goodhue County Tillage 2007 Transect – Crop Type
Figure 7 – Goodhue County Tillage 2007 Transect – Tillage Type
15

Gully and Ravine Mapping Gullies and ravines are sources of sediment to the Cannon River. Using GIS mapping, LiDAR data, and ground truthing, a map and inventory of all the gullies and ravines in the Lower Cannon River watershed should be compiled so that they can be addressed. The map can be updated annually based on where fixes have been made as a way to track progress.
Recent Activities This document is the Implementation Plan for the Lower Cannon River Turbidity TMDL. However, it should be noted that watershed management and soil conservation are constantly pursued by various entities in the Cannon River watershed. The Soil and Water Conservation Districts (SWCDs), and Natural Resource Conservation Service (NRCS), County Water Planning offices, municipal stormwater staff and others are hard at work. This plan should further guide, support and enhance their efforts. A sampling of some local activity is presented below.
Dakota County SWCD Two streambank restoration projects have been completed along Trout Brook. They were both designed and supervised by the Dakota County SWCD after DNR permits were obtained. The first was in 1988, in the furthest downstream section of the Brook. Serious streambank erosion was occurring there in the Zumbro sand, concentrated beneath the NSP power line, likely started or aggravated by vegetation suppression efforts beneath the power line. Consensus was that without remedial action, that Trout Brook would soon erode a new channel straight south into the Cannon River. About 50 yards of streambank was armored with hand-fitted limestone rocks, covering a geotextile fabric. River birch saplings and potted prairie grasses were planted. The project was overdesigned to accommodate six “fish habitat” boulders (each about 10 cubic feet) placed in the middle of the stream channel. The second project was completed in 2005, about ½ mile upstream from the Cannon River. Stormwater runoff from an 80-acre field (later purchased and planted to prairie) coursed down a ravine toward the valley floor. Instead of fanning out and soaking into the ground, the stormwater breached the natural streambank levee and eroded a new ravine approximately 40 feet deep, 20 yards wide, and 60 yards long. This gully was refilled with earth material, revegetated, and stormwater runoff from upland sources was channeled to again run northward in the floodplain instead of directly into Trout Brook.
The Dakota SWCD completed a two-year project aimed at inventorying and assessing the condition of wetlands and streams in the Vermillion and Cannon River Watersheds. The project was funded through the Vermillion River Watershed Joint Powers Organization, North Cannon Watershed Management Organization, and the Metropolitan Council. Existing electronic data in the Geographic Information System (GIS) were out-of-date or unsystematic and cannot help us adequately evaluate the exact location of all our surface waters and the buffers or filter strips that may already exist to protect them. An important function of this project was to create a new water GIS map and database for Dakota County that includes all the small and intermittent tributaries and wetlands as well as the larger streams and waterbodies. These data can then be continuously updated as projects and fieldwork occur over time. Ultimately, water quality data from specific watersheds will be integrated with the completed assessment in order to anticipate and prioritize future protection efforts. (Dakota SWCD Newsletter, Fall 2007) In August 2009, the Dakota SWCD was awarded a 319 grant to carry out the North Cannon River Bacteria Reduction project. While a focus of the project is bacteria reduction, sediment reduction will
16

occur as well. With 241 miles of streams running through this watershed, chances of surface water contamination are high in areas with little or no conservation measures. While many agricultural producers install and maintain best management practices (BMPs) on their land, more involvement and prioritization of conservation practices is needed to improve water quality in this area.
There are many different BMPs used to help keep soil and polluted runoff from reaching streams and lakes. Filter strips, or buffers areas adjacent to waterways, provide several environmental benefits including slowing or stopping overland runoff from reaching the waterbody, protecting streambanks from erosion, providing wildlife habitat, and shading and cooling the water in the stream. This project adds another environmental benefit to filter strips: biomass production for alternative energy. Dakota County landowners have a unique opportunity to sell grasses and other biomass to local energy companies for use as biofuels.
While filter strips are sometimes installed by producers, there are many riparian areas without these protective strips of vegetation. This project will allow landowners to choose from a variety of filter strip program options. The ability to harvest and use filter strip grasses as biomass for alternative energy, hay for livestock feed, or other uses is likely to be a popular alternative to other programs. Harvestable filter strips can effectively trap bacteria, nutrients and solids away from streams (a minimum stubble height is required within the strip), but it allows the flexibility and economic balance sought by many landowners.
The project will provide private landowners with technical assistance, incentive payments or cost share to install voluntary conservation practices that provide water quality benefits. Individual project funding will be considered through resolution by the SWCD Board of Supervisors through their established policy and programs.
North Cannon River Watershed Management Organization On January 25, 2007 the WMO Board approved an agreement with the Dakota County SWCD to use WMO funding to supplement federal, state, and other local funding sources for the establishment of best management practices through the SWCD’s Incentive Payment Practices (IPP) Program. In 2007 the IPP Program established 7 projects within the North Cannon River watershed, including 3 filter strips (totaling 20 acres) and 4 grassed waterways.
Cannon River Watershed Partnership In mid-2009, Goodhue County’s DNR public waters land use was mapped by CRWP to better identify shoreland areas in need of buffers. At this time, the State of Minnesota and Goodhue County require a 50 foot wide buffer on all public rivers and streams.
The Shoreland Mapping Project, (administered by the Whitewater Watershed Project and funded by the Environment and Natural Resources Trust Fund) examined all DNR public (protected) waters within Goodhue County. These waters were retraced and all land use outlined at a scale 1:4,000 and coded within 300 feet of the waterway’s centerline. This information was coded using the Minnesota Land Cover Classification System (MLCCS), a common land classification system used in Minnesota.
Upon completion, percentages of landuse types were calculated for Goodhue County shoreland; these data are presented in Figures 8 and 9.
17

Figure 8 – Landuse statistics for shoreland land within 300 feet of the stream centerline.
18

Figure 9 – Landuse statistics for shoreland land within 50 feet of the stream centerline.
19

These data indicated that the major land cover in the shoreland areas of Goodhue County is forest, grassland, cropland, and planted or maintained grasses. Of most concern is the percentage of cropland within 50 feet of the stream centerline, which these data estimates at only 4.42% on public (protected) waterways. This is approximately 276 acres currently in cropland.
This information will allow Goodhue County and other officials, landowners, and resource professionals to readily identify the areas in need of greatest assistance – thus providing a sound starting point for targeting best management practices. An example of a portion of the mapped area is shown in Figure 10. A copy of the Goodhue County shoreland land use map is attached in electronic format.
Figure 10 – Example of shoreland mapping in Goodhue County; various landuses colored by their
MLCCS code.
20

Goodhue SWCD A summary of BMP’s that the Goodhue SWCD designed /assisted with the design of and provided cost share from 2005 – 2009 are provided in Table 4.
Not all erosion reduction projects require a lot of dollars and design work. The SWCD has been assisting with some low cost and “low tech” solutions to stream bank erosion by installing cedar tree revetments. Placing fallen cedar trees, at or below the bankful elevation can divert flow away from the eroding banks. The trees are placed with the trunk facing up stream and have an overlap of about 2 feet. Each tree is anchored into the bank at a 45 degree angle with duckbill anchors. The erosive current along the outside bend of a stream is then diverted to the center of the stream allowing sedimentation and vegetation to establish between the cedars and the streambank. Cedar tree revetments can offer a low cost solution to an eroding bank if installed properly. Figures 11 -13 are photographs of a revetment project.
Table 4 – Goodhue SWCD BMP Summary 2005-2009
Best Management Practice
2005 2006 2007 2008 2009
Grade Stabilization Structure - 410
3 4 8 2
Grassed Waterway - 412
5 6 3 9 8
Pond - 378 1 1
Terrace - 600 10 18 2
Water and Sediment Control Basin - 638
4 16 12
Diversion - 362 1 1
Critical Area Planting - 362
1
Windbreak/Shelterbelt Establishment - 380
1
Total BMPs 23 30 30 25 8
21

Figure 11 – Progression of streambank erosion repair with cedar trees.
22

BMP Summary Figure 14 shows the locations of BMPs installed since 2002 in the watershed (data were provided by the Board of Water and Soil Resources via their E-Link database in August 2009). This gives a good summary of recent work. Using this information, coupled with knowledge of HEL areas will be useful in focusing installation of future BMPs.
Figure 14 – 2002-2009 BMPs in the Lower Cannon River Watershed
23

Monitoring Summary The lower lobe of the Cannon River watershed starts from the Byllesby Reservoir dam outlet; it flows east to the Mississippi River in Red Wing. Over this 26 mile reach there are four major tributaries: Pine Creek, Trout Brook, Belle Creek and Little Cannon River that contribute flow, sediment and nutrients to the Cannon River. Water quality data, including (among other parameters) transparency, total suspended solids, total suspended volatile solids, total dissolved solids, turbidity and flow have been collected at a number of sites over a range of years. Figure 15 provides geographical reference of the monitoring locations in the basin. The Lower Cannon River Watershed is fortunate to have several valuable long-term monitoring assets: a USGS gauging station at Welch, a Metropolitan Council monitoring site (also at Welch), a LTRMP monitoring site at the river mouth, and two DNR flood warning gauges on the Little Cannon River. Going forward, monitoring should be designed around these key components. A table is provided in Appendix B that summarizes current and future watershed monitoring and the parameters measured.
Figure 15 – Monitoring sites in the Lower Cannon River watershed
Table 5 provides a summary of data through the 2008 monitoring season. Figure 16 updates the mean daily flow data at the Welch site. The years 2006 – 2008 were dry with the exception of several large events in late summer and fall of 2007.
24

Table 5 – TSS data at LTRMP site and Welch site on Cannon River
AUID 07040001-511 07040002-502 Reach Confluence Pine-Belle Sample Location and Source
Samples taken from boat at the confluence through LTRMP
Sample taken at Welch by MCES, MPCA and CRWP
Time Period 1/2/95- 10/22/08 10/26/95-10/14/08 N 261 190 Minimum (mg/L) 1 1 Median (mg/L) 22.9 16 Mean (mg/L) 61.7 81 Maximum (mg/L) 1889 2900
Figure 16 – Mean Daily Flow on Cannon River at Welch, MN
25

Management Alternatives This section of the report describes management alternatives for nonpoint and point sources of sediment. Following the background narrative is a list of potential action items. Projects aimed at addressing the turbidity impairments in the Lower Cannon River should be designed according to these action items. However, it should be noted that this implementation strategy is adaptive – the list should not be considered final or unchangeable. As sediment dynamics in the watershed are further understood, the recommended actions will be amended. Our overall goal is to meet the TMDL, and thus support designated uses, and ultimately delist the impaired reaches of the Cannon River.
Nonpoint Sources Nonpoint sources are those that contribute sediment that does not come through a “pipe” or point source. They include: forested and other natural areas, roads and rural communities, farm fields, and stream bank erosion. There are many management options that could be used to handle these sources. The following is a list of some possibilities. Specific practices should be designed by local land use
erators/owners. managers and land opStructural Practices Terraces Terraces break long slopes into shorter ones. As water makes its way down a hill, terraces serve as small dams to intercept water and guide it to an outlet. Terraces can be effective at reducing overland runoff that carries sediment and nutrients. (Rock County SWCD, 2008).
Water and Sediment Control Basins A water and sediment control basin is an embankment that is built across a depressional that concentrates water runoff. These basins trap sediment and water running off farmland above the structure. These structures help reduce gully erosion by controlling water flow within a drainage area. (Rock County SWCD, 2008)
Stream J-hooks and Rock Weirs Stream barb or J-hooks are installed where stream bank erosion is occurring. When installed, the barbs re-direct the energy of the stream bank into the channel, reducing further stream bank erosion and creating habitat. Rock weirs help prevent further head cutting in the stream. (Rock County SWCD, 2008)
Stream Crossings Stream crossings can be used as part of rotational grazing and to allow cattle to access a stream with limited impact on streambanks.
Diversions A diversion alters the path of water flow from an area of high velocity and concentration, to a stable and lower velocity water course to reduce erosion. Diversions are often used to move concentrated water flow around open feedlots. They are also used to divert water around gullies that are encroaching into agricultural fields. (Beau Kennedy, Goodhue SWCD, 2009)
26

Vegetative Practices Grazing Grazing lands in the Lower Cannon River Watershed account for less than 10% of the land. Much of the pasture land is located in areas that are unsuited to crop production. This includes areas that are too steep, too wet, too stony or rocky, or too droughty to either support plant growth or to allow for normal farming operations. Some areas are wooded, having never been cleared for farming. Flood plains are often used for pasture.
The number of acres devoted to grazing use has diminished over the last 30 years. Some herds are confined to buildings that would have been pastured in years past, especially dairy herds. A well managed grazing operation can be a BMP in that it can feature many acres of perennial cover and thus provide good opportunity for water infiltration and runoff control.
A more detail summary of grazing issues in the Lower Cannon watershed can be found in Appendix C.
Wetland Restorations Wetlands are natural swamps, bogs, sloughs, potholes or marshes that have saturated soils and water loving plants. Wetlands are important as they provide wildlife habitat, provide for groundwater recharge, and serve as natural filters and reduce the rate of overland flow of stormwater runoff for agricultural and urban runoff. This cuts down on soil erosion and flooding. (Rock County SWCD, 2008)
Buffers Shoreland buffers are an effective and low-cost method of reducing the amount of sediment entering surface water. Buffers are areas of continuous, perennial vegetation that run parallel to a waterway that slow down upland field runoff and allows sediment and associated pollutants to be filtered out before entering surface water.
Figure 17 – Example of Stream Shoreland Buffer
27

Buffers are a common conservation practice in agricultural areas and have a proven record of reducing sediment and associated pollutants from surface drainage. However, their effectiveness depends on several factors and should be taken into consideration during implementation. These factors include buffer width, field area, surface soil condition, slope, and soil texture; these will dictate buffer size. Additional variables such as continuity, vegetation type, and intended use should also be considered.
Buffer width is the most important factor. State and many county rules require a minimum buffer width of 50 feet measured perpendicular to the ordinary high water mark on state protected waterways (Minnesota Rules 6120.3300).
A buffer of no less than 50 feet regardless of other factors should be in place on all state protected waterways
Floodplain connectivity It is important to maintain the connections between stream channels and their floodplains and to look for opportunities to reconnect where possible. This connectivity allows the stream to overflow its banks at times of high flow and dissipate energy rather than scouring the stream channel. Intact natural vegetation enhances floodplain ecosystems and encourages sediment deposition.
Grassed Waterways A grassed waterway is a natural drainage that is graded and shaped to form a smooth, bowl shaped channel. This area is seeded to sod forming grasses. Runoff water that flows down the drainage way flows across the grass rather than tearing away soil and forming a gully. An outlet is often installed to stabilize the waterway and prevent gully formation. The grass protects the drainage way and can act as a filter. (Rock County SWCD, 2008)
28

Conservation Tillage and Residue Management Organic matter is dramatically reduced when heavy tillage incorporates oxygen into the soil and disaggregates, or breaks up, the soil. Once the soil is disaggregated, it is exposed to wind and water erosion, which further deplete the organic material in the most productive few inches of topsoil.
Conservation tillage is a cost-effective way to build organic matter and reduce field runoff of sediment. In times of increasing fuel and equipment costs, these methods of reduced tillage and fewer trips over the field provide considerable financial benefit to the producer. No-till farming has also been shown to dramatically reduce fuel and equipment costs while providing an effective means to reduce erosion. Figure 18 depicts adjacent no-till and conventionally tilled fields.
The University of Minnesota Extension Service publication, Tillage Best Management Practices for Water Quality Protection in Southeastern Minnesota can serve as an effective tool in facilitating changes in tillage practices. Conservation tillage is an effective tool that can be used to reduce runoff and sediment loading in the Lower Cannon River watershed. The Extension Service publication mentioned above can be viewed here:
http://www.extension.umn.edu/distribution/cropsystems/DC7694.html
Figure 18 – Example of No-Till and Conventional Tillage Practices
29

Point Sources Municipal & Industrial Discharges Sediment loading from traditional point sources in the Lower Cannon River watershed is controlled by permit limits. Wastewater treatment and industrial facilities have discharge limits prescribed in their permits that are monitored on a routine basis. If these facilities expand or grow in number, the TMDL wasteload allocations will be taken into consideration when setting permit limits. Compliance with
ill constitute management for these sources. discharge permits wUrban Stormwater Water that runs off urban land after a rainfall or snowmelt event is considered urban stormwater. Pervious surfaces allow stormwater to infiltrate into the ground whereas impervious surfaces and saturated soils cause the water to runoff. As the water flows it may pick up pollutants from the surface such as sediment, pesticides, chemicals, nutrients, and fecal material. For the purposes of this plan, we are most concerned with sediment as well as the increased volume and speed of water being discharged from stormwater outfalls. This increased volume and speed of water may be having a significant localized impact on the stream banks and their sediment contributions.
Regulation A municipal separate storm sewer system (MS4) is a conveyance or system of conveyances (roads with drainage systems, municipal streets, catch basins, curbs, gutters, ditches, man-made channels, storm drains) that is:
− Owned or operated by a state, city, town, borough, county, parish, district, association, or other public body (created by or pursuant to State law) having jurisdiction over disposal of sewage, industrial wastes, stormwater, or other wastes, including special districts under State law such as a sewer district, flood control district or drainage districts, or similar entity, or an Indian tribe or an authorized Indian tribal organization, or a designated and approved management agency under section 208 of the Clean Water Act that discharges to waters of the United States;
− Designed or used for collecting or conveying stormwater; − Not a combined sewer; and − Not part of a publicly owned treatment works.
In Minnesota, stormwater discharges from MS4s are regulated through the use of National Pollutant Discharge Elimination System (NPDES) permits. NPDES permits are legal documents. Through this permit, the owner or operator is required to develop a stormwater pollution prevention program (SWPPP) that incorporates best management practices (BMPs) (MPCA, MS4 web page). Phase I of the program covers large municipalities (population 100,000 or greater) such as Minneapolis and St. Paul. Phase II of the NPDES rules covers MS4s located in “urbanized areas” and on a case-by-case basis those MS4s located outside of urbanized areas.
30

A General Permit for stormwater discharge (Permit No. MNR040000) went into effect on June 1, 2006. The MS4 permit has six program elements that are called “minimum control measures” which the permittee must implement:
1. Public Education and Outreach
2. Public Participation/Involvement
3. Illicit Discharge Detection and Elimination
4. Construction Site Runoff Control
5. Post Construction Runoff Control
6. Pollution Prevention/Good Housekeeping
Permittees need to evaluate the effectiveness of their chosen BMPs to determine whether the BMPs are reducing the discharge of pollutants from their systems to the “maximum extent practicable”.
In the Lower Cannon River watershed, the City of Red Wing is currently the only MS4 community that discharges stormwater runoff into the Cannon River (via the Cannon River bottoms wetlands). The vast majority of Red Wing’s stormwater is discharged into the Mississippi River. Red Wing has amended its SWPPP to address the Cannon River as an Outstanding Resource Value Water (ORVW). Red Wing has also updated ordinances and building codes to address the Cannon River’s ORVW classification and has been working with the MPCA to comply with rules associated with discharges to waters with prohibited or restricted discharges.
The City of Cannon Falls is also located in the Lower Cannon River watershed. While it is not yet a MS4 community, it may be in the future. Regardless of the permit status, Cannon Falls can still implement practices to reduce their stormwater impact on the Cannon River.
While the focus of management for this implementation plan is the Lower Cannon River, there are other MS4 cities upstream of the Byllesby Reservoir in the Cannon River watershed: Northfield, Faribault, Owatonna, and Waseca. Urban stormwater load reductions in these communities will have positive impacts on the river system as a whole, including the Lower Cannon River.
31

Action Items The TMDL calls for significant reductions in sediment loading, particularly during high flow conditions. The goal is to achieve the water quality standard of 44 mg/L TSS. This will be accomplished through land use and hydrology management measures with a focus on sediment sources from fields, ravines, stream bluffs and stream banks. As the implementation process will adapt over time, we are establishing a short term goal of achieving a 30% reduction in sediment loading by 2020.
The following is a list of potential action items developed using existing water plans and input from stakeholders.
Strategy A: Field Erosion Control Action A-1: Conduct tillage survey of all fields in the watershed to enhance the data collected by the SWCDs and give baseline information for areas to target for possible changes to tillage practices. Possible Partners: Dakota and Goodhue SWCDs, CRWP Timeframe: Year 1, Year 5, Year 10 Action A-2: Using GIS and ground truthing, map the location of gullies in the watershed. Update map as gullies are repaired or created. Possible Partners: Dakota and Goodhue SWCDs, CRWP Timeframe: Year 1-2, updated every 2 years Action A-3: Provide technical assistance and incentives for installation of buffers and grassed waterways. Possible Partners: Dakota and Goodhue SWCDs and NRCS, Landowners, Timeframe: Years 1-10
Action A-4: Assist landowners in installation of buffers through funding that does not require enrollment in a government program. Use riparian inventory work to target buffer installations. Possible Partners: CRWP, Dakota and Goodhue SWCDs, Landowners, Trade organizations Timeframe: Years 1-10 Action A-5: Provide technical assistance and cost share for restoration of drained/degraded wetlands. Possible Partners: Dakota and Goodhue SWCDs and NRCS, Landowners, US Fish and Wildlife Service, Hunting/Wildlife Organizations Timeframe: Years 1-10
Action A-6: Encourage landowners to adopt conservation tillage and no-till practices. Assist landowners in establishing and demonstrating conservation tillage methods that are cost-effective and environmentally friendly, especially in areas where hay production has decreased and corn and soybean rotations have increased. Utilize results from tillage transects to target high risk areas. Possible Partners: Dakota and Goodhue SWCDs, NRCS, University of Minnesota Extension, CRWP, Landowners who use these practices already Timeframe: Years 1-10
32

Action A-7: Provide a cash incentive for conservation tillage or high residue management for 3 years in addition to the cost share provided by the EQIP program. Possible Partners: Dakota and Goodhue SWCDs, NRCS Timeframe: Years 1-10 Action A -8: Design, install, and provide cost share in addition to existing programs for terraces where appropriate. Possible Partners: Dakota and Goodhue SWCDs, NRCS, Landowners, CRWP Timeframe: Years 1-10 Action A-9: Design, install and provide cost share in addition to existing programs for sediment control basins where appropriate. Possible Partners: Dakota and Goodhue SWCDs, NRCS, Landowners, CRWP Timeframe: Years 1-10 Action A-10: Design, install and provide cost share in addition to existing programs for diversions where appropriate. Possible Partners: Dakota and Goodhue SWCDs, NRCS, Landowners, CRWP Timeframe: Years 1-10 Action A-11: Partner with Pheasants Forever/non-profit organizations to support landowners who want to establish prairies. Possible Partners: Dakota and Goodhue SWCDs, Pheasants Forever, CRWP, Landowners Timeframe: Years 1-10 Action A-12: Work with the County Public Works in establishing prairies on a total of 20 acres of public lands and harvest native seeds for low-cost distribution. Possible Partners: Dakota and Goodhue County Public Works, CRWP Timeframe: Years 1-10 Action A-13: Promote/establish woodlots/forests on marginal agricultural lands. Possible Partners: Dakota and Goodhue SWCDs, NRCS, University of Minnesota Extension, Landowners/Operators Timeframe: Years 1-10 Action A-14: Promote cover crops on canning and silage fields. Possible Partners: Dakota and Goodhue SWCDs, University of Minnesota Extension, CRWP Timeframe: Years 1-10
Action A-15: Assist landowners in finding markets for hay and other perennial crops that can be grown on buffer areas (similar to Working Lands Initiative) Possible Partners: Trade organizations, CRWP, SWCDs Timeframe: Years 1-10
33

Strategy B: Grazing Action B-1: Promote/establish grazing and cover crops practices on agricultural lands. Possible Partners: Dakota and Goodhue SWCDs, NRCS, University of Minnesota Extension, Landowners/Operators Timeframe: Years 1-10 Action B-2: Design, install and provide cost share in addition to existing programs for fencing and watering stations as part of a managed grazing system. Possible Partners: Dakota and Goodhue SWCDs, NRCS, Landowners, CRWP. Timeframe: Years 1-10
Strategy C: Ravine Erosion Control Action C-1: Using GIS, LiDAR and ground truthing, inventory and map the location of ravines in the watershed. Update map as the landscape changes. Possible Partners: Dakota and Goodhue SWCDs, CRWP Timeframe: Year 1-2, updated every 2 years Action C-2: Identify funding sources to address ravine problem, possibly through the NRCS Driftless Area Initiative. Possible Partners: NRCS, Landowners, CRWP Timeframe: Years 1-10 Action C-3: Design and install ravine erosion control structures. Possible Partners: Dakota and Goodhue SWCDs, NRCS, Landowners Timeframe: Years 1-10
Strategy D: Stream Bank and Bluff Erosion Control Action D-1: Conduct riparian channel assessment and inventory. Possible Partners: University of Minnesota, Dakota and Goodhue SWCDs, CRWP Timeframe: Years 1-5
Action D-2: Evaluate existing forested buffers for tree types to prioritize areas that could be revegetated with trees or grasses that have deeper root systems. Possible Partners: University of Minnesota, Dakota and Goodhue SWCDs, CRWP, Timeframe: Years 1-5 Action D-3: Use stream assessment data to determine sites that are priorities for restoration using practices such as J-hooks, rock weirs, stream crossings, and other restoration methods. Design, install and provide cost share in addition to existing programs for this work. Possible Partners: Dakota and Goodhue SWCDs, NRCS, DNR, Trout Unlimited, Landowners Timeframe: Years 3-10
34

Strategy E: Ordinances Action E-1: Enforce the County Shoreland Ordinances. Possible Partners: Dakota and Goodhue SWCDs, SWCD, Dakota and Goodhue County Attorneys, Dakota and Goodhue County Planning and Zoning Timeframe: Years 1-5
Action E-2: Review the potential use of county soil loss ordinance to address sources of sediment on an ongoing basis. Possible Partners: Dakota and Goodhue SWCDs, Dakota and Goodhue County Attorneys, Dakota and Goodhue County Planning and Zoning Timeframe: Years 1-5
Strategy F: Urban Stormwater Action F-1: Provide long-term maintenance for detention basins in urban, suburban and highway settings to reduce sedimentation in local streams and water bodies. Possible Partners: Dakota and Goodhue SWCDs, MNDOT, County Highway Departments, Cannon Falls Public Works, Red Wing Public Works Timeframe: Years 1-10 Action F-2: Provide general stormwater education to residents, especially in urban areas. Possible Partners: City of Cannon Falls, City of Red Wing, Dakota SWCD, Goodhue SWCD, CRWP Timeframe: Years 1-10 Action F-3: Provide education, design, and installation assistance and cost-share funding for stormwater reduction practices. Possible Partners: City of Cannon Falls, City of Red Wing, Dakota SWCD, Goodhue SWCD, CRWP Timeframe: Years 1-10 Action F-4: Adopt local erosion control ordinances to control soil erosion from construction sites. Possible Partners: North Cannon River Watershed Management Organization, Dakota SWCD, member communities Timeframe: Years 1-5 Action F-5: Identify and repair erosion-prone land areas owned by the cities of Cannon Falls and Red Wing. Possible Partners: City of Cannon Falls, City of Red Wing, Dakota SWCD, Goodhue SWCD, CRWP Timeframe: Year 1-5
Action F-6: Provide training to city and county staff to help reduce stormwater pollution caused by park maintenance, fleet and building maintenance, new construction and land disturbances, outfall inspections, and storm sewer system maintenance. Possible Partners: City of Cannon Falls, City of Red Wing, Goodhue County, Dakota County Timeframe: Years 1-10
35

Action F-7: Develop and implement street sweeping practices to reduce sediment loading. Possible Partners: City of Cannon Falls, City of Red Wing, Timeframe: Years 1-10
Strategy G: Tracking and Monitoring Action G-1: Develop and staff land use tracking system for each of the major sediment sources. Possible Partners: MPCA, Dakota and Goodhue SWCDs and counties, CRWP Timeframe: Years 1-10 Action G-2: Develop and staff stream channel condition tracking system. Possible Partners: MPCA, Dakota and Goodhue SWCDs and counties, CRWP Timeframe: Years 1-10 Action G-3: Establish dedicated gauging stations at or near tributary confluence points. These stations can be used to derive discharge curves to allow for a more precise estimation of sediment loads. Appendix B of this report details the existing monitoring that is established in the watershed. In order to evaluate trends and changes it will be necessary to conduct long term water monitoring. Such an effort should be built around existing long term sites (Met Council, LTRMP, USGS, flood warning gauges, CSMP). Possible Partners: USGS, DNR, Metropolitan council, CRWP, Dakota and Goodhue County SWCDs and MPCA. Timeframe: Years 1-10.
Action G-4: Continue to support and expand volunteer monitoring in the watershed – utilizing both the Citizen Stream Monitoring Program (CSMP) and CRWP’s volunteer monitoring network. Possible Partners: Dakota and Goodhue SWCD, CSMP volunteers, CRWP volunteer monitors, and MPCA. Timeframe: March-October, Years 1-10
Action G-5: Integrate future condition and effectiveness monitoring with the MPCA Intensive Watershed Monitoring effort and the developing One Water Strategy. Possible Partners: MPCA, Dakota, Rice, Steele, Goodhue, Waseca, Rice and Le Sueur SWCD. Timeframe: Tentatively scheduled for 2011 Action G-6: Conduct BMP effectiveness monitoring, focusing in areas of high erosion risk within the major tributary watersheds of the Lower Cannon River. Various scales should be considered for BMP effectiveness monitoring; a focus should be on the field scale. Possible Partners: Dakota and Goodhue SWCD and CRWP staff Timeframe: Based on BMP implemented, typically pre/post BMP.
Strategy H: Education and Outreach Action H-1: Conduct an educational/informational effort to inform all citizens of county zoning ordinance requirements for permanent vegetation. Use newspaper or other media to further awareness. Possible Partners: SWCD, County Water Planner, CRWP Timeframe: Every other year
36

Action H-2: Create and install informational signage on stream bank erosion issues at water access points along the Little Cannon River, Belle Creek, Trout Brook and the Cannon River. Possible Partners: Dakota and Goodhue SWCDs Timeframe: Years 1-5 Action H-3: Provide leadership and staff time to market and implement long-term easements on targeted marginal agricultural lands that have been identified by local/regional priority efforts. Possible Partners: Dakota and Goodhue SWCDs, NRCS, CRWP Timeframe: Years 1-10 Action H-4: Meet with farmers to discuss the level of interest and the current barriers to implementing best management practices. Possible Partners: CRWP, Dakota and Goodhue SWCDs, NRCS, Trade Organizations Timeframe: Years 1-10 Action H-5: Utilize social indicators as a tool for assessing interest in adopting practices, barriers to adoption, and best approaches (Action H-4). Possible Partners: CRWP, SWCDs, Extension, St. Olaf College, MPCA Timeframe: Years 1-2 conduct study, Year 3 assess results, Years 4-10 implement findings
Action H-6: Create a page on the CRWP website with resource links and progress updates. Possible Partners: CRWP, all partners to provide updates Timeframe: Years 1-10 Action H-7: Distribute updates on project activities through partner newsletters on a semi-annual basis. Possible Partners: CRWP, all partners to provide updates and publish information Timeframe: Years 1-10
Strategy I: Evaluation Action I-1: Review county water plans, municipal stormwater plans, SWCD plans, etc. to ensure that priority sediment issues are addressed in a coordinated fashion through local government. Possible Partners: Dakota and Goodhue SWCDs, City of Red Wing, Dakota and Goodhue Counties, CRWP Timeframe: Years 1-2
Action I-2: Convene advisory group semi-annually to discuss progress on action items, changes, and future work needed. Possible Partners: Dakota and Goodhue SWCDs, NRCS, MPCA, CRWP, Extension, citizen members, Trade Organizations, Others Timeframe: Years 1-10
37
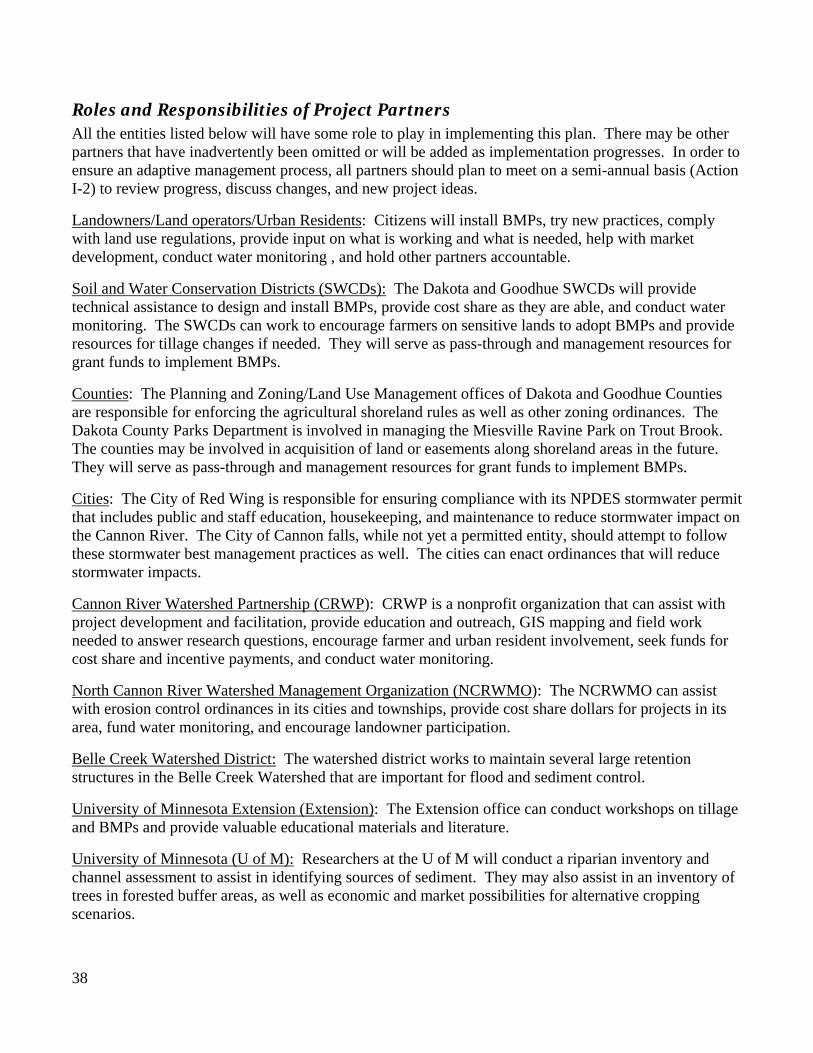
Roles and Responsibilities of Project Partners All the entities listed below will have some role to play in implementing this plan. There may be other partners that have inadvertently been omitted or will be added as implementation progresses. In order to ensure an adaptive management process, all partners should plan to meet on a semi-annual basis (Action I-2) to review progress, discuss changes, and new project ideas.
Landowners/Land operators/Urban Residents: Citizens will install BMPs, try new practices, comply with land use regulations, provide input on what is working and what is needed, help with market development, conduct water monitoring , and hold other partners accountable.
Soil and Water Conservation Districts (SWCDs): The Dakota and Goodhue SWCDs will provide technical assistance to design and install BMPs, provide cost share as they are able, and conduct water monitoring. The SWCDs can work to encourage farmers on sensitive lands to adopt BMPs and provide resources for tillage changes if needed. They will serve as pass-through and management resources for grant funds to implement BMPs.
Counties: The Planning and Zoning/Land Use Management offices of Dakota and Goodhue Counties are responsible for enforcing the agricultural shoreland rules as well as other zoning ordinances. The Dakota County Parks Department is involved in managing the Miesville Ravine Park on Trout Brook. The counties may be involved in acquisition of land or easements along shoreland areas in the future. They will serve as pass-through and management resources for grant funds to implement BMPs.
Cities: The City of Red Wing is responsible for ensuring compliance with its NPDES stormwater permit that includes public and staff education, housekeeping, and maintenance to reduce stormwater impact on the Cannon River. The City of Cannon falls, while not yet a permitted entity, should attempt to follow these stormwater best management practices as well. The cities can enact ordinances that will reduce stormwater impacts.
Cannon River Watershed Partnership (CRWP): CRWP is a nonprofit organization that can assist with project development and facilitation, provide education and outreach, GIS mapping and field work needed to answer research questions, encourage farmer and urban resident involvement, seek funds for cost share and incentive payments, and conduct water monitoring.
North Cannon River Watershed Management Organization (NCRWMO): The NCRWMO can assist with erosion control ordinances in its cities and townships, provide cost share dollars for projects in its area, fund water monitoring, and encourage landowner participation.
Belle Creek Watershed District: The watershed district works to maintain several large retention structures in the Belle Creek Watershed that are important for flood and sediment control.
University of Minnesota Extension (Extension): The Extension office can conduct workshops on tillage and BMPs and provide valuable educational materials and literature.
University of Minnesota (U of M): Researchers at the U of M will conduct a riparian inventory and channel assessment to assist in identifying sources of sediment. They may also assist in an inventory of trees in forested buffer areas, as well as economic and market possibilities for alternative cropping scenarios.
38

Minnesota Pollution Control Agency (MPCA): Staff at MPCA will be responsible for an intensive monitoring effort in the watershed every ten years. They will also develop and implement a One Water Strategy in the basin, which will guide monitoring, assessment, TMDL work and implementation in the future.
Minnesota Department of Natural Resources (DNR): The DNR may provide expertise in streambank restoration projects. DNR is also working on maintaining and increasing easements on the Cannon River through the Wild and Scenic River program. Staffs from the Lake City area office are responsible for permitting activities that occur within the Ordinary High Water level of the streams and river. They are also responsible for collecting water samples at the Long Term Resource Monitoring Program (LTRMP) site at the confluence with the Mississippi River for the USGS.
Minnesota Department of Agriculture (MDA): MDA will provide education and conduct research on BMPs to further steer implementation of conservation practices in the basin.
Board of Water and Soil Resources (BWSR): BWSR will provide technical assistance, award Clean Water Fund grants for implementation work, and provide direction on projects.
Metropolitan Council: The Metropolitan Council operates a continuous stream monitoring station on the Cannon River at Welch.
Natural Resource Conservation Service (NRCS): NRCS staff will provide technical assistance and cost share to design and install practices for landowners who enroll in federally funded programs such as EQIP.
US Fish and Wildlife Service (USFWS): The USFWS may be able to assist with wetland and wildlife habitat restoration.
US Geological Survey (USGS): The USGS operates a continuous flow monitoring station at Welch and is a partner in the LTRMP site at the mouth of the Cannon River. They may be able to support sediment budgeting exercises or provide technical assistance to partners working to further understand sediment dynamics in the basin.
Trade Organizations/Commodity Groups: Organizations made up of farmers, implement dealers, farm cooperatives, and technical service providers can provide information, direction and encouragement to farmers to install BMPs where possible and to try new practices and methods. They can assist in the development of markets for crops or livestock that are part of this management strategy.
39

Adaptive Management Process The turbidity impairment in the Lower Cannon River is a long-standing problem that will require long-term management. This implementation plan is part of a greater One Water Strategy that is being developed for the entire Cannon River watershed. This strategy will promote further and better understanding of appropriate land management according to the progress in research inventory work and monitoring. As such, implementation of BMPs in the Lower Cannon watershed will be an adaptive process. Addendums to this plan are anticipated and necessary.
This plan is designed to guide implementation activities for the next ten years. Progress should be reviewed at least annually by the stakeholders listed above with input from the public to assess progress. Changes should be made if needed based on what is reported. Targeting best management practices to the areas contributing the most sediment should be the main goal.
Budget Give the relative lack of precision with respect to the scope and scale of work required to address these impairments it is not feasible to generate a detailed budget. As the watershed is further understood and the management process is adapted, a budget will become attainable. At this point, the stakeholders will rely on local governmental units to generate project budgets according to their professional judgment.
40

References Bentrup, G. (2008). Conservation Buffers: Design Guidelines for Buffers, Corridors, and Greenways. Lincoln, NE: National Agroforestry Center, United States Department of Agriculture.
Cannon River Watershed Partnership, Minnesota Pollution Control Agency (2007). Total Maximum Daily Load Evaluation of Turbidity Impairments in the Lower Cannon River (EPA approved July 13, 2007). St. Paul, MN: Minnesota Pollution Control Agency.
Cannon River Watershed Partnership, Minnesota Pollution Control Agency (2007). Revised Regional Total Maximum Daily Load Fecal Coliform Bacteria Impairments in the Lower Mississippi River Basin of Southeast Minnesota – Implementation Plan. St. Paul, MN: Minnesota Pollution Control Agency.
Dakota County Soil and Water Conservation District (2007). Wetland Assessment Nears Completion: Dakota County Soil and Water Conservation District News and Notes, 26(2). Retrieved from http://www.dakotaswcd.org/pdfs/NewsNotesFall2007.pdf
Magner, J. A. (2008). TISWA Tailored Integrated Stream Watershed Assessment: Intro to Watershed Hydrologic & Fluvial Systems Workshop Manual. Mankato, MN: Minnesota State University Water Resources Center. Unpublished work. North Cannon River Watershed Management Organization (2003). North Cannon River Watershed Management Organization Plan.
North Cannon River Watershed Management Organization (2008). 2007 Annual Report and 2008 Budget.
Rock County Soil Water Conservation District/Land Management Office (2008). Rock River Fecal Coliform and Turbidity TMDL Implementation Plan (EPA approved April 23, 2008). St. Paul, MN: Minnesota Pollution Control Agency.
41

42
Appendices
Appendix A – Maps
Appendix B – Monitoring activities table
Appendix C – Buffer and Grazing Summaries
Appendix D – GIS resources (CD Available Upon Request)

Appendix A – Maps
43

44

45

46

47

48

49

50

51

52

53

54

55

56

57

58

59

60 0 6

Appendix B – Monitoring Activities
Agency Contact Sample location Location ID Parameters Timeline CommentsCRWP Lucas Bistodeau Little Cannon S005-496 TKN, TP, NO3, Chlor-a, Trans, temp 2009-2011 SWAG project CRWP Lucas Bistodeau Little Cannon S005-497 TKN, TP, NO3, Chlor-a, Trans, temp 2009-2011 SWAG project CRWP Lucas Bistodeau Belle Creek S004-388 TKN, TP, NO3, Chlor-a, Trans, temp 2009-2011 SWAG project CRWP Lucas Bistodeau Belle Creek S004-398 TKN, TP, NO3, Chloro-a, temp, D.O., and pH 2009-2011 SWAG project
MN dept of AG Dave Tollefson Lil Cannon S004-512 Pest, NO3, TP/OP, trans, DO, pH, TKN, TSS, Turb, E.coli until 2011
Goodhue SWCD Beau Kennedy Little CannonLC1, LC2, LC3, LC4, LC5, LC6, LC7, LC8, LC9 (old), LC10, LC9 (new )
E.Coli, Transparency , state, some field measures YSI meter 2008-2009 Clean Water Legacy Project
Goodhue SWCD Beau Kennedy Butler Crk S004-804 Trans, DO, pH, TKN, NO3, TP, TSS, Turb, E. coli 2008-2009 SWAG Goodhue SWCD Beau Kennedy Unnamed trib to Belle Crk S004-805 Trans, DO, pH, TKN, NO3, TP, TSS, Turb, E. coli 2008-2009 SWAG Goodhue SWCD Beau Kennedy Spring Creek S004-806 Trans, DO, pH, TKN, NO3, TP, TSS, Turb, E. coli 2008-2009 SWAG
MPCA (and others) (multiple) Cannon Riv er at Weld S000-003 Multiple parameters to include Transparenc and TSS 1953-2009 site has been monitored through multiple projectsMPCA Tiffany Schauls Little cannon S004-511 Multiple parameters to include Transparenc and TSS 2007-2009 part of Lake Pepin TMDL
MPCA Brenda AsmusIntensiv e Watershed Monitoring
Too be determined Water quality , inv ertebrate ID, Fish ID, 2011Project is subject to change due to budget restrictions
MN DNR Rob Burdis Cannon Riv er LTRMP site VM00.1M, at
confluence w ith MississpiTSS, Temp, DO, PH, Conductiv ity , P, Nitrogen, etc.
April - August biw eekly , Sept -Nov , Jan, Mar Monthly
Part of Upper Midw est Env ironemtnal Sciences Center/USGS w ork
Met council Scott Schellhaass Cannon riv er-mile 4 TDS, TSV, TSS, TP, Turbidity , TKN and Chlorophy ll-a 2000-2007Met council Scott Schellhaass Cannon Riv er- mile 11 Flow , E. coli, Chlorophy ll-a, Nitrate-nitrogen, Stage, TSS, TSVS, Turbidity and TP 2004-2009
Dakota SWCD for NCWMO Travis Bistodeau Pine Creek S002-530, S004-258gage height, DO, Temp, pH, Trans, TKN, NO3, Alka, TP, DP, TSS, TVS, Turb, Conduc and Fecal coliform
2006, 2010 Rotate monitoring w ith Chub and Mud CRK
Travis Bistodeau Trout BrookS002-536, S002-537, S001-936
gage height, DO, Temp, pH, Trans, TKN, NO3, Alka, TP, DP, TSS, TVS, Turb, Conduc and Fecal coliform
2006, 2010 Rotate monitoring w ith Chub and Mud CRK
Citizen Stream Monitoring Program (CSMP)
CSMP Volunteer Little CannonS001-436
Transparency , Temperature, Appearance, Recreational Suitability 1999-2008
CSMP Volunteer Little Cannon S001-939 Transparency , Temperature, Appearance, Recreational Suitability 2002-2008CSMP Volunteer Pine Creek S002-530 Transparency , Temperature, Appearance, Recreational Suitability 2003-2007CSMP Volunteer Trout Brook S002-537 Transparency , Temperature, Appearance, Recreational Suitability 2003-2006CSMP Volunteer Trout Brook S002-536 Transparency , Temperature, Appearance, Recreational Suitability 2003-2006CSMP Volunteer Trout Brook S001-936 Transparency , Temperature, Appearance, Recreational Suitability 2003-2006CSMP Volunteer Belle Creek S002-532 Transparency , Temperature, Appearance, Recreational Suitability 2003-2008CSMP Volunteer Belle Creek S001-348 Transparency , Temperature, Appearance, Recreational Suitability 1999-2008CSMP Volunteer Belle Creek S002-529 Transparency , Temperature, Appearance, Recreational Suitability 2003-2008CSMP Volunteer Belle Creek S002-528 Transparency , Temperature, Appearance, Recreational Suitability 2003-2007CSMP Volunteer Belle Creek S004-388 Transparency , Temperature, Appearance, Recreational Suitability 2007-2008CSMP Volunteer Cannon Riv er S001-766 Transparency , Temperature, Appearance, Recreational Suitability 2001-2008CSMP Volunteer Cannon Riv er S002-475 Transparency , Temperature, Appearance, Recreational Suitability 2003-2006
* Other monitoring is taking place in the w atershed. These sites are those that hav e or hav e recently been used to collected data for TSS, Turbidty , or Transparency
Surface Water Monitoring Sites - Lower Cannon River Watershed
61

62
Appendix C – Grazing and Buffer Summaries
Grazing Summary by Howard Moechnig, Midwest Grasslands, September 2009 Grazing lands in the Lower Cannon River Watershed utilize less than 10% of the land within this watershed. Much of the pasture land is located in areas that are unsuited to crop production. This includes areas that are too steep, too wet, too stony or rocky, or too droughty to either support plant growth or to allow for normal farming operations. Some areas are wooded, having never been cleared for farming. Flood plains are often used for pasture.
The number of acres devoted to grazing use has diminished over the last 30 years. Fewer herds of livestock are on farms as agriculture has shifted to more row crop production. Some herds are confined to buildings that would have been pastured in years past, especially dairy herds.
A recent trend in livestock agriculture has been to keep livestock on pasture. Some producers are finishing beef on pasture, and some dairy herds utilize pasture to provide a significant portion of the livestock ration. These grazing operations normally use land of high quality that would normally be utilized for production of annually tilled crops. While this is not happening on a widespread scale, it is occurring in this watershed. The future of this trend is tied directly to the economic feasibility of livestock production, as well as the economic feasibility of commodity crop production.
Another factor to consider is the trend of food consumers to purchase locally grown foods. If this trend continues there will be increased livestock production on well managed pastures on high quality land. This is particularly suited for small acreages with sheep or goats.
Pastures vary considerably in the kind of management applied to them. Two ends of the spectrum are described below: Managed Rotational Grazing With this grazing management system the livestock are confined to a small portion of a pasture (paddock) for a relatively short period of time, normally 1-6 days. The livestock are rotated to new forages on this basis and not allowed to roam wherever they want in the pasture. This allows for the grazed forages to have a “rest” period so that they may recover from the grazing event. It takes at least six paddocks to achieve this rest period.
This method of grazing management has many advantages to the producer, including better forage production and improved livestock performance.
Environmentally, this type of grazing system is superior to continuous grazing (described below) in that rainfall is more likely to infiltrate into the soil than run off the landscape. In addition, the manure form grazing animals is more uniformly distributed over the pasture, making better use of the nutrients. Combined with the reduced runoff of rainfall, it is an effective method of reducing manure and nutrient contamination of surface waters.
This method of grazing requires a fair amount of infrastructure over the continuous grazing systems. Additional fences are required to subdivide the pastures into paddocks. Water pipelines and water tanks are required to provide fresh water to the livestock on the pasture in each of the paddocks. To have livestock walking for water will lead to more trailing and more erosion, will lead to poor distribution of the livestock manure on the land, and will reduce livestock performance. Therefore, having adequate water available is essential.

63
Continuous Grazing This system of grazing management (or lack of management) is common. It involves allowing the livestock to have access to the entire pasture for the full grazing season. Pastures managed in this manner will have more soil erosion associated with them, will have higher rates of runoff from rainfall events, will have poorer forage yield, and will provide lower livestock performance than those with managed rotational grazing.
There are pastures in the watershed that have some sort of rotational grazing system, but not to the intensity that would make a significant improvement in terms of improving or protecting surface water quality. A well designed grazing system will have at least six paddocks (better if it is more), a grazing period in each paddock not exceeding six days (better if it is fewer days), and will have the watering system in place that will provide water in each paddock.
It should be pointed out that the grazing situation on each farm is unique and that a system needs to be designed for each situation. Major factors affecting the design of a managed rotational grazing system include annual stocking rate, kind and class of livestock, production model of the livestock enterprise, and integration of the livestock enterprise into the whole farming business.
No more than 10% of the existing pastures in the watershed are grazed under a managed rotational grazing system. This is due to a number of factors. The most significant include:
1.) The cost of fence and watering systems is a deterrent, although the Natural Resources Conservation Service has cost share funds available to defray these costs through the Environmental Quality Incentives Program (EQIP). Costs for each system are variable depending upon the complexity of the system. Costs can range from $75/acre to $200/acre, with $120/acre being about average.
2.) Lack of interest, by producers, in changing the system they already have in place. 3.) Uncertainty regarding the future of the livestock industry.
Assistance is available from the Natural Resources Conservation Service to plan and design managed rotational grazing systems. Private consultants are also available to do the same. Common references that will familiarize producers with managed rotational grazing systems and provide planning guidance include:
1.) Grazing Systems Planning Guide, Kevin Blanchet, Howard Moechnig, and Jodi DeJong-Highes. University of Minnesota, Natural Resources Conservation Service, and Minnesota Board of Water and Soil Resources. Available from Local NRCS offices and the University of Minnesota Extension Service (BU–07606–S) at www.extension.umn.edu
2.) Pasture for Profit, Dan Undersander, Beth Albert, Dennis Cosgrove, Dennis Johnson, and Paul Peterson. Available at Cooperative Extension Publishing (A3529) at 1-877-947-7827.
3.) Managing Grazing in Stream Corridors, Howard Moechnig (Midwest Grasslands). Minnesota Department of Agriculture. Available by calling (651)201-6012, or by going to the MDA website at www.mda.state.mn.us

64
Buffer Summary by Ross Hoffmann, Cannon River Watershed Partnership, September 2009 Shoreland buffers are an effective and low-cost method of reducing the amount of sediment entering surface water. Buffers are areas of continuous, perennial vegetation that run parallel to a waterway that slows down upland field runoff and allows sediment and associated pollutants to be filtered out before entering surface water.
Buffers are a common conservation practice in agricultural areas and have a proven record of reducing sediment and associated pollutants from surface drainage. However, their effectiveness depends on several factors and should be taken into consideration during implementation. These factors include buffer width, field area, surface soil condition, slope, and soil texture; these will dictate buffer size. Additional variables such as continuity, vegetation type, and intended use should also be considered.
− Buffer width is the most important factor. State and many county rules require a minimum buffer width of 50 feet measured perpendicular to the ordinary high water mark on state protected waterways. A buffer of no less than 50 feet regardless of other factors should be in place on all state protected waterways.
On waterways that are not state protected and on those state protected waterways where field conditions may dictate a larger buffer, the factors below can be used to further determine the appropriate buffer size.
− Field area is the total area that drains toward a specific stream reach. The ratio between the field area and the area in buffer should be 70:1 to 50:1 to determine minimum buffer area.
− Surface soil condition is the erosiveness of the soil in relation to how the soil is managed. Increased residue reduces sediment loss from surface drainage. A change in upland tillage practices that increases residue and reduces sediment load to the buffer is recommended.
− Greater field slope increases the velocity of surface runoff. Increased velocity allows runoff to carry more sediment and reduces buffer effectiveness. Implement conservation practices like terracing to slow upland runoff velocity and increase buffer width in areas of greatest slope. All standards for HEL should be met first.
− Soil texture relates to soil particle size. Soils with smaller particle size will more easily erode and drain slower than soils with larger particle size. Buffer width should be increased and thicker vegetation planted where fine soil texture is present to lower runoff velocity and allow smaller soil particles to settle out.
A tool that assembles all of the variables mentioned above to provide an appropriate buffer size for a specific location is available from the USDA. This tool is available in Bentrup’s Conservation Buffers: Design Guidelines for Buffers, Corridors, and Greenways (2008). In addition to this tool, NRCS standards for contour buffer strips (332), riparian herbaceous cover (390), riparian forest buffer (391), and filter strips (393) provides important planning and background information for buffer installation.
Three other factors should be considered in addition to the above; buffer continuity, vegetation type, and intended use.
− Continuity is required for the buffer to perform as designed. Erosion that is allowed to concentrate in one area, such as happens during gully formation, will make the buffer ineffective as runoff favors this route. A contiguous buffer of a minimum width with no gaps in shoreland coverage is needed for it to be effective.

65
− Vegetation should always be perennial. Grasses that grow densely with large and deep root masses are favored for better surface and shallow subsurface filtering. Tree, shrubs, and grasses native to the area and soil type are also recommended. Trees and shrubs can provide a degree of bank stabilization, but should not inhibit growth beneath the canopy. Invasive or non-native species should be removed.
− A buffer can be used for haying, pasturing, biomass production, and for many other uses if not enrolled in a conservation program that dictates otherwise. Use for habitat or hunting will require a wider buffer than needed for only water quality. In addition, vegetation type and placement should also be considered when used for habitat. Buffers can provide a turn-around area for equipment; however, frequent equipment use such as this beyond seasonal will reduce buffer effectiveness due to compaction.

66
Appendix D – GIS Resources (CD available upon request)