Embed Size (px)
Citation preview

Low PressureSewer Systems
UsingEnvironment One
Grinder Pumps

1
ContentsIntroduction ..........................................................................................................................................3
Advantages of LPS Systems ..............................................................................................................3
Description and Operation ..................................................................................................................3
Pump Operation ..................................................................................................................................4
Pump Type ..........................................................................................................................................4
Motor Selection....................................................................................................................................5
Power Outages ...................................................................................................................................7
Power Consumption ...........................................................................................................................7
LPS System Design ............................................................................................................................9
Information Required ...........................................................................................................................9
Grinder Pump Station Size Selection ..................................................................................................9
Grinder Pump Placement ..................................................................................................................10
Pipe Selection ...................................................................................................................................10
System Layout .................................................................................................................................. 11
Zone Designations ............................................................................................................................12
Completion of Pipe Schedule and Zone Analysis ..............................................................................14
Review ..............................................................................................................................................17
References .......................................................................................................................................22
Manufacturer Evaluation List .............................................................................................................30

2

3
IntroductionE/One low pressure sewer (LPS) systems offer the designer new freedom in solving many problemsituations that have defied reasonably economical solutions using the conventional approach.
Each LPS system design should be considered on the basis of its own unique circumstances. Onsuch a basis, a sound choice between gravity and low pressure systems can be made.
General criteria aid the engineer in making a preliminary choice between several alternative sys-tems: entirely low pressure, entirely gravity, entirely vacuum or a combination of systems. Thesecriteria are presented and are intended to serve as a general guide. The final decision and designare the responsibility of the project consulting engineer, whose knowledge of local conditions,including construction costs, regulatory requirements and the client’s particular needs, become vitalto the preparation of the final designs and specifications.
Advantages of LPS SystemsLPS systems have low initial (front end) cost compared to gravity systems, which have nearly all thetotal investment allocated in the first stage. With the LPS system, grinder pump costs are incurredonly as construction progresses. These costs will be deferred for many years in certain types ofdevelopment programs.
An LPS system is not subject to infiltration from ground water or from surface storm water enteringthrough leaking pipe joints and manholes. With zero infiltration, treatment plants need not be sizedto handle the peak flow rates caused by infiltration. Treatment efficiencies can be more consistent,and treatment plant operating costs decrease.
An LPS system may become the critical factor in determining whether “marginal” land can beeconomically developed. Many attractive sites have been considered unsuitable for developmentbecause of the excessive costs typically associated with conventional sewer systems — sites withhilly terrain, land with negligible slope, high water tables, poor percolation characteristics, rock,seasonal occupancy or low population density.
Many communities are planning to convert from septic tanks to central sewage collection andtreatment systems to minimize health hazards and/or environmental deterioration. The majorreduction in cost and the simplicity of installation of an LPS system have strong appeal for suchcommunity improvement programs. Small-diameter pipe pressure mains can be laid along existingroadways with minimum disruption to streets, sidewalks, lawns, driveways and underground utilities.Surface restoration costs are similarly minimized. Sewage delivered to the treatment plant (becauseit contains no infiltration) is more uniform in “strength,” the volume is smaller, and peaks are greatlyreduced.
Description and OperationGrinder pumps of approved design accomplish all pumping and sewage-grinding processes forsmall-diameter LPS systems.
The system consists of conventional drain, waste and vent (DWV) piping within the residenceconnected to the grinder pump inlet. The grinder pump may be installed above or below grade,indoors or outdoors. Depending on flow factors and model used, it may serve one or more resi-

4
dences, or several families in the case of apartment buildings.
Grinder pumps discharge a finely ground slurry into small–diameter pressure piping. In a completelypressurized collection system, all the piping downstream from the grinder pump (including lateralsand mains) will normally be under low pressure. Pipe sizes will start at 1 1/4 inches for houseconnections (compared to 4 or 6 inches in gravity systems) and will be proportionally smaller thanthe equivalent gravity pipeline throughout the system. All pipes are arranged as zone networkswithout loops.
Depending on topography, size of the system and planned rate of buildout, appurtenances mayinclude valve boxes, flushing arrangements, air release valves at significant high points, checkvalves and full-ported stops at the junction of each house connection with the low pressure sewermain.
Pump OperationLow pressure sewer systems have become feasible with the availability of the Environment Onegrinder pump, the reliability of which has been proven in almost 40 years of service. The grinderpump station provides adequate holding capacity, reliable grinding and pressure transport of a fineslurry to an existing gravity sewer, pump station or directly to a wastewater treatment plant.
In operation, the grinder pump station will handle sewage and many items that should not, but oftendo, appear in domestic wastewater. For example, plastic, wood, rubber and light metal objects canbe routinely handled without jamming the grinder or clogging the pump or piping system. The grinderpump will discharge this slurry at a maximum rate of 15 gpm or 11 gpm at a pressure of 40 psig.Transporting sewage several thousand feet to a discharge point at a higher elevation is possible aslong as the sum of the static and friction losses does not exceed design limits of 185 feet TDH (80psig).
The grinder pump is actuated when the depth of the sewage in the tank reaches a predetermined“turn-on” level, and pumping continues until the “turn off” level is reached. The pump’s running timeis short, power consumption is low, and long pump life is ensured. The unit is protected againstbackflow from discharge lines by an integral check valve. Several grinder pump station models areavailable to satisfy various total and peak demand conditions.
Pump TypeThe semi-positive displacement pump in the grinder pump station has a nearly vertical H-Q curve.This is the best type of pump for successful parallel operation of many pumps into a system ofcommon low pressure mains. Since each pump will be located at a different point along commonlow pressure mains and at various elevations, each pump should operate in an efficient and predict-able manner, whether one pump or numerous pumps are operating at a given moment; the pumpsin such a system do not have a single fixed “operating point,” but must operate consistently over awide range of heads that are continually, and often rapidly, changing.
The Environment One grinder pump has the capability of operating above the LPS system designcriteria of 80 psig, or 185 feet (Figure 1). Based on the maximum daily number of pumps operatingsimultaneously (Table 3) versus the number of pumps connected to the system at the design pres-sure of 185 feet, the capability to operate significantly above the system’s design pressure is man-datory in order for the system to operate properly during the approximately bimonthly peaks when

5
the “absolute maximum” numbers of pumps are operating. This feature also ensures that pumpingwill continue under those conditions when higher–than–normal pressure occurs in the pipeline.
System designs with calculated heads approaching the upper limits of recommended heads shouldbe reviewed by Environment One application specialists. Contact your local Environment OneRegional Sales Office or authorized distributor for a no-cost, computerized review of your design.
Occasionally during “normal” operation, there will be short periods when higher-than-design pres-sures will be experienced. These can result from a variety of causes including solids buildup (ob-structions) or air bubbles.
Deposits of solids or air accumulation will be purged from the line since the pump continues toproduce an essentially constant flow, even though the cross section of the pipeline has temporarilybeen reduced. Higher velocities through the reduced cross section will provide the scouring actionneeded to correct such conditions as soon as they start to appear.
These higher–than–expected pressure conditions are transitory occurrences. The only requirementis that no damage be done to the pumping equipment, pipelines or appurtenances during theseoccasional short periods. Environment One grinder pumps are driven by motors rated for continu-ous operation at 104 F/40 C above ambient temperature. They can operate at 50 percent aboverated pressure for at least 5 minutes without excessive temperature rise. Based on the Albany, NewYork, demonstration project4, for this type of overload to last even as long as one minute would berare.
Motor SelectionA grinder pump station is an electromechanical system that depends on electric power for its operat-ing, control and alarm functions. The design and selection of Environment One’s pump, motor,grinder and level–sensing controls were accomplished by optimizing the wastewater transportfunction of the unit within the necessary constraints for unattended, trouble–free operation in aresidential environment.
A single grinder pump core is common to all models of Environment One grinder pumps (modelsDH071, DH151, DH152, DH272 and DH502). This central core contains all of the working andcontrol elements of the unit and is powered by a 1 hp, 240v (or 120v), 1,725 rpm capacitor start,thermally protected induction motor. Each of these motor features was carefully considered in thedesign of the grinder pump station.
The pump should be considered as a residential appliance. For this reason, performing the grindingand pumping functions using no more than 1 hp to permit occasional use at 120v in older homes notwired for 240v is desirable. In order to achieve the high heads desired and provide constant flow atvarying heads, the 1-hp motor is coupled to a pump of semi-positive displacement design (Figure 1).
At a rating of 1 hp and 1,725 rpm, the Environment One grinder pump develops more than 8.4 foot-pounds of torque. Motors used to drive centrifugal pumps are often rated at 2.0 hp at 3,450 rpm andmay produce less torque. When handling residential sewage, grinding torque may be demandedduring any portion of the starting or running cycle. When the pump stops (controlled by level) in themidst of grinding hard objects (e.g. tongue depressors, plastic items, etc.), it must, upon restarting,be able to provide sufficient torque to the grinder to overcome the resistance of any object remainingfrom the previous cycle.

6
Grinder Pump Performance Characteristics
Figure 1
7
Power OutagesEnvironment One grinder pump stations have adequate excess holding capacity to provide waste-water storage during most electrical power outages (Figure 2). This excess holding capacity isshown on curve A. Data from the Federal Power Commission on national electrical power outagesis plotted as a cumulative distribution function (curve B). Note that only volume above the normal“turn-on” level was counted as available storage. The average flow of 1.54 gallons/hour/person isbased on the actual measured flow over a one-year period at the Albany Demonstration Project4.
The local electrical power utility should be contacted to obtain a history on the power interruptions ofthe feeder(s) scheduled to serve the low pressure sewer site. From this data, curve B should bereplotted to reflect local conditions. In those rare local areas where the frequency and/or the durationof outages exceed 7.5 hours, the use of Model DH151, with its greater holding capacity than that ofthe DH071, could be considered.
When power has been restored after a power outage, it is likely that nearly all the pumps in thesystem will try to operate simultaneously. Under these conditions, the dynamic head loss compo-nent of the total head will rise significantly. A number of pumps in the system would see a total backpressure high enough to cause the thermal overload protectors to automatically trip in a few min-utes. Operation under conditions that could cause damage to the pumps or the system would beavoided. While these pumps are offline, other pumps in the system would be able to empty theirtanks. After one to two minutes, the group that tripped off on thermal overload would cool and restart.The system back pressure would have been reduced and the group would be able to pump downnormally. This process repeats itself automatically under the influence of each unit’s own thermalprotector, reliably restoring the system to normal operation.
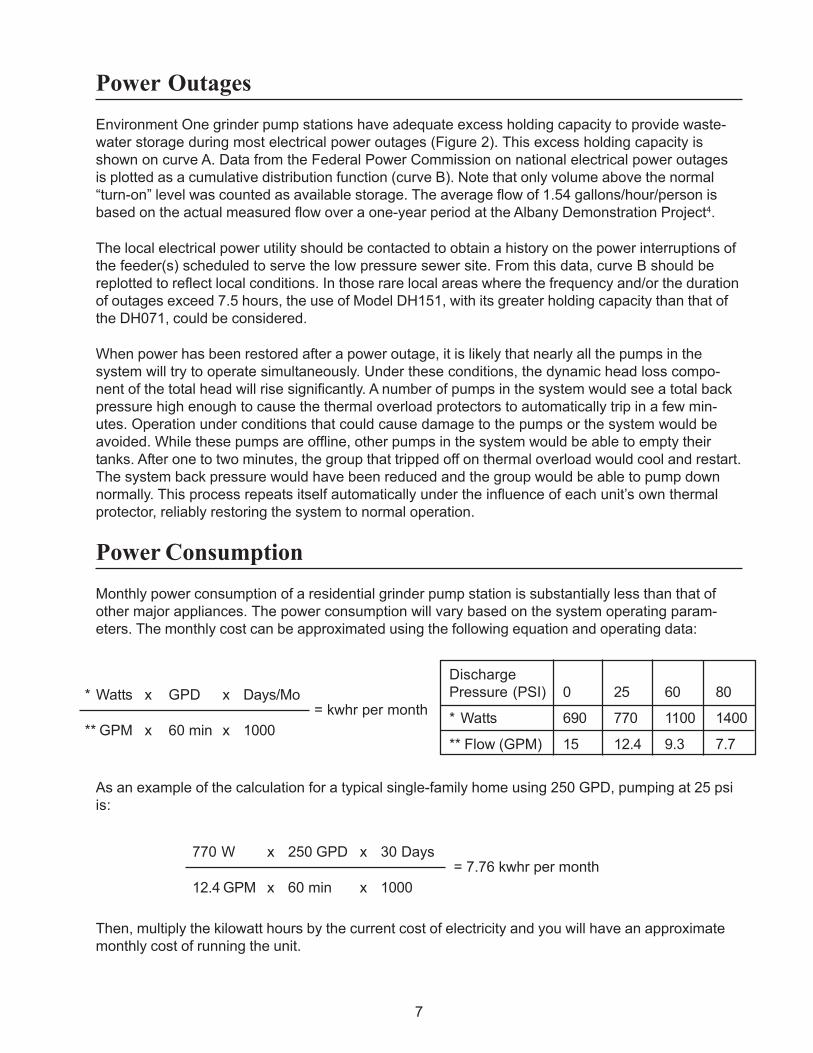
Power ConsumptionMonthly power consumption of a residential grinder pump station is substantially less than that ofother major appliances. The power consumption will vary based on the system operating param-eters. The monthly cost can be approximated using the following equation and operating data:
As an example of the calculation for a typical single-family home using 250 GPD, pumping at 25 psiis:
Then, multiply the kilowatt hours by the current cost of electricity and you will have an approximatemonthly cost of running the unit.
770 W x 250 GPD x 30 Days
12.4 GPM x 60 min x 1000= 7.76 kwhr per month
DischargePressure (PSI) 0 25 60 80
* Watts 690 770 1100 1400
** Flow (GPM) 15 12.4 9.3 7.7
= kwhr per month* Watts x GPD x Days/Mo
** GPM x 60 min x 1000

8
Relationship of GP Storage Capacityto Power Outage Experience
Figure 2

9
LPS System DesignOnce the initial analysis of a project has confirmed the feasibility of using the low-pressure ap-proach, the completion of a preliminary system design is straightforward. This is primarily a result oftwo characteristics of E/One’s semi-positive displacement pump: near-constant flow over the entirerange of operating pressures and the ability of the pump to handle transient overpressures.
The balance of this section outlines a systematic approach to LPS system design, leading frompump model and pipe selection to a detailed zone and system analysis.
Information RequiredThe information that should be assembled prior to initiation of the LPS system design includes:
• Topography map• Soil conditions• Climatic conditions (frost depth, low temperature and duration)• Water table• Applicable codes• Discharge location• Lot layout (with structures shown, if available)• Total number of lots• Dwelling type(s)• Use and flow factors (seasonal occupancy or year-round, appliances, water supply
sources)• Area development sequence and timetable
Grinder Pump Station Size SelectionUse this table to select grinder pump models for the types of occupancy to be served.
Model Recommended Flow (gpd) Adequate for Managing …
DH071 up to 700 Flow from one average single-family home, and upto two average, single-family homes where codesallow and with consent of the factory.
DH151 up to 1,500 Flow from up to two average single-family homes,and up to six average, single-family homes wherecodes allow and with consent of the factory.
DH152 up to 3,000 Flow from up to four average single-family homes,and up to 12 average, single-family homes withconsent of the factory.
DH272 up to 5,000 Flow from up to six average single-family homes,and up to 20 average, single-family homes withconsent of the factory.
DH502 up to 6,000 Flow from up to nine average single-family homes,

10
and up to 24 average, single-family homes withconsent of the factory.
Considerations include:
• Wetwell and discharge piping must be protected from freezing• Model and basin size must be appropriate for incoming flows, including peak flows• Appropriate alarm device must be used• Suitable location
Daily flows above those recommended may exceed the tank’s peak flow holding capacity and/orshorten the interval between pump overhauls. The company should be consulted if higher inflowsare expected.
The final selection will have to be determined by the engineer on the basis of actual measurementsor best estimates of the expected sewage flow.
Grinder Pump PlacementThe most economical location for installation of the grinder pump station is in the basement of thebuilding it will serve. However, due consideration must be given when choosing an indoor location. Ifthere is a risk of damage to items located in the basement level, other provisions should be madeduring basement installation or an outdoor unit should be considered.
Considerations such as ownership of the pumps by a municipality or private organization and/or theneed for outdoor accessibility frequently dictate outdoor, in-ground installations. For outdoor installa-tions, all GP models are available with high density polyethylene (HDPE) integral accesswaysranging in height up to 10 feet. By keeping the unit as close as possible to the building, the lengths ofgravity sewer and wiring will be minimized, keeping installation costs lower while reducing thechances of infiltration in the gravity flow section.
AC power from the building being served should be used for the grinder pump. Separate powersources add to installation and O&M costs, decrease overall reliability and frequently represent anaesthetic issue.
When two dwellings are to be served by a single unit, the station is usually placed in a positionrequiring the shortest gravity drains from each home. With multi-family buildings, more than onegrinder pump may be required.
Pipe SelectionThe final determination of the type of pipe to be used is the responsibility of the consulting engineer.In addition, the requirements of local codes, soil, terrain, water and weather conditions that prevailwill guide this decision.
Although pipe fabricated from any approved material may be used, most LPS systems have beenbuilt with PVC and HDPE pipe. Continuous coils of small-diameter, HDPE pipe can be installed withautomatic trenching machines and horizontal drilling machines to sewer areas at lower cost.

11
Table 1 compares the water capacity of two types of PVC pipe commonly used: SDR-21 and Sch40, and one type of HDPE, SDR-11. All three have adequate pressure ratings for low pressuresewer service.
Although both types of PVC pipes are suitable, the three parameters compared in Table 2 illustratewhy SDR-21 is suggested as a good compromise between capacity, strength, friction loss charac-teristics and cost.
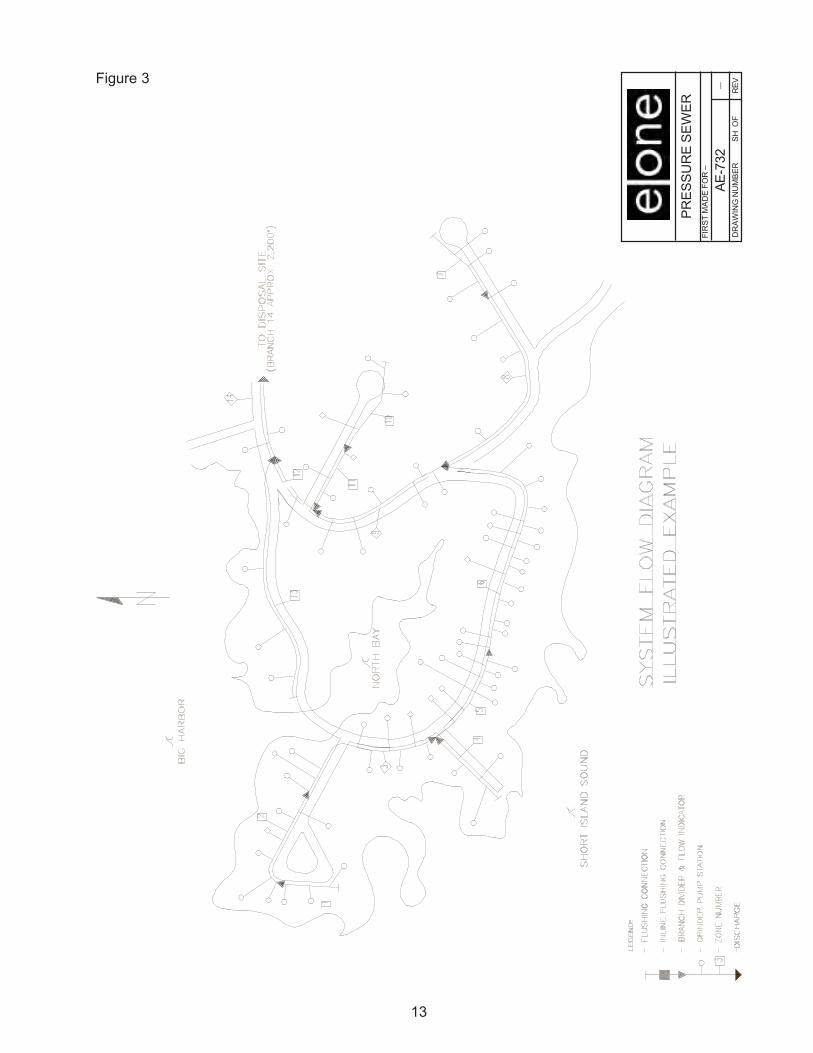
System LayoutA preliminary sketch of the entire pressure sewer system should be prepared (Figure 3). Pumpmodels should be selected and their location (elevation) should be noted. The location and directionof flow of each lateral, zone and main, and the point of discharge should be shown.
The system should be designed to give the shortest runs and the fewest abrupt changes in direc-tion. “Loops” in the system must be avoided as they lead to unpredictable and uneven distribution offlow.
Although not shown in Figure 3, the elevation of the shutoff valve of the lowest-lying pump in eachzone should be recorded and used in the final determination of static head loss. Since EnvironmentOne grinder pumps are semi-positive displacement and relatively insensitive to changes in head,precisely surveyed profiles are unnecessary.
Air/vacuum valves, air release valves and combination air valves serve to prevent the concentrationof air at high points within a system. This is accomplished by exhausting large quantities of air as thesystem is filled and also by releasing pockets of air as they accumulate while the system is inoperation and under pressure. Air/vacuum valves and combination air valves also serve to prevent apotentially destructive vacuum from forming.
Air/vacuum valves should be installed at all system high points and significant changes in grade.Combination air valves should be installed at those high points where air pockets can form. Airrelease valves should be installed at intervals of 2,000 to 2,500 feet on all long horizontal runs thatlack a clearly defined high point.
Table 1PIPE WATER CAPACITY
Gallons/100 feet of Pipe Length
1 1/4 7.8 9.2 7.41 1/2 10.6 12.1 9.92 17.4 18.8 15.42 1/2 23.9 27.6 —3 38.4 40.9 33.54 66.1 67.5 55.35 103.7 103.1 84.56 150.0 146.0 119.98 260.0 249.0 203.2
SDR 11HDPE
Nominal PipeSize (in.)
Sch 40PVC
SDR 21PVC
Table 2PVC PIPE COMPARISONS
Nominal Pipe Size = 2 in.
Parameter Sch 40 SDR 21
Wall Thickness, in. 0.154 0.113
Inside Diameter, in. 2.067 2.149
50 gpm Friction 4.16 3.44Loss, ft/100 ft

12
Air relief valves should be installed at the beginning of each downward leg in the system that exhibitsa 30-foot or more drop. Trapped pockets of air in the system not only add static head, but alsoincrease friction losses by reducing the cross sectional area available for flow. Air will accumulate indownhill runs preceded by an uphill run.
Long ascending or descending lines require air and vacuum or dual-function valves placed at ap-proximately 2000-foot intervals. Long horizontal runs require dual function valves placed at approxi-mately 2000-foot intervals.
Pressure air release valves allow air and/or gas to continuously and automatically released from apressurized liquid system. If air or gas pockets collect at the high points in a pumped system, thenthose pressurized air pockets can begin to displace usable pipe cross section. As the cross sectionof the pipe artificially decreases, the pump sees this situation as increased resistance to its ability toforce the liquid through the pipe.
Air relief valves at high points may be necessary, depending on total system head, flow velocity andthe particular profile. The engineer should consult Environment One in cases where trapped air isconsidered a potential problem.
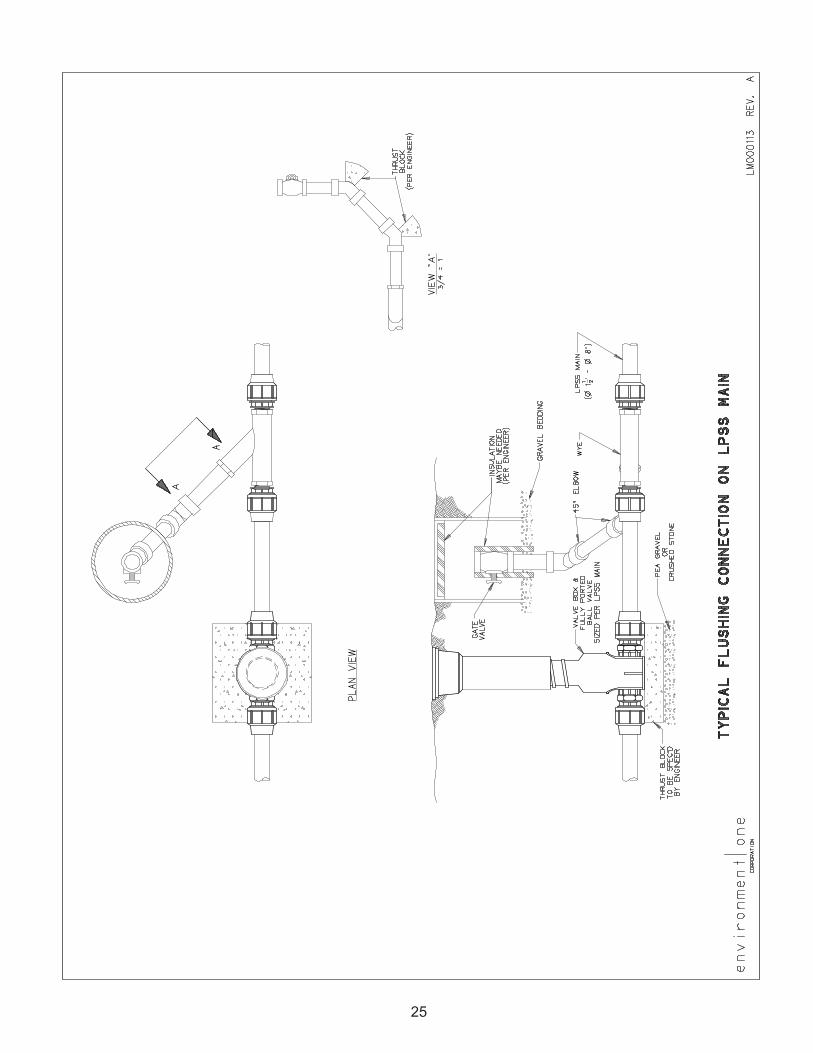
Cleanout and flushing stations should be incorporated into the pipe layout. In general, cleanoutsshould be installed at the terminal end of each main, every 1,000 to 1,500 feet on straight runs ofpipe, and whenever two or more mains come together and feed into another main.
Zone DesignationsThe LPS system illustrated in Figure 3 contains 72 pumps and is divided into 14 individually num-bered zones. Division into zones facilitates final selection of pipe sizes, which are appropriate inrelation to the requirements that flow velocity in the system is adequate and that both static anddynamic head losses are within design criteria. Assignment of individual zones follows from therelationship between the accumulating total number of pumps in a system to the predicted numberthat will periodically operate simultaneously (Table 3).
Table 4 was initially developed after careful analysis of more than 58,000 pump events in a 307-dayperiod during the Albany project (4). It was extended for larger systems by application of probabilitytheory. The validity of this table has since been confirmed by actual operating experience withthousands of large and small LPS systems during a 34-year period.
Using Figure 3, the actual exercise of assigning zones is largely mechanical. The single pumpfarthest from the discharge point in any main or lateral constitutes a zone. This and downstreampumps along the main are accumulated until their aggregate number is sufficient to increase thenumber of pumps in simultaneous operations by one, i.e., until the predicted maximum flow in-creases by 11 gpm.
Figure 3 shows that zones 1, 2 and 3 end when the number of pumps connected total 3, 6 and 9,and the number of pumps in daily simultaneous operation are 2, 3 and 4, respectively.
Any place where two or more sections of main join, or where the outfall is reached, also determinesthe end of a zone. This design rule takes precedence over the procedure stated above, as seen in
13
Figure 3
PRES
SUR
E SE
WER
FIR
ST
MA
DE
FO
R –
AE-7
32–
DR
AW
ING
NU
MB
ER
SH
OF
REV

14
zones 3, 4, 6, 8, 9, 11, 12, 13 and 14.
Completion of Pipe Scheduleand Zone AnalysisThe data recorded on the System Flow Diagram(Figure 3) is then transferred to Table 4.
Table 4 Column No. Designation
1 Zone Number2 Connects to Zone3 Number of Pumps in
Zone4 Accumulated
Pumps in Zone11 Length of Main this
Zone in Feet
Column 4 is completed by referring to Table 3,where the maximum number of pumps in simul-taneous operation is given as a function of thenumber of pumps upstream from the end of theparticular zone. The output of each zone will varyslightly with head requirements, but under typicalconditions, the flow is approximately 11 gpm.Calculate the maximum anticipated flow for eachzone by multiplying the number of simultaneousoperations in Column 7 by 11 gpm and recordthe results in Column 8.
To complete columns 9, 10, 12 and 13, refer toFlow Velocity and Friction Head Loss table for thetype of pipe selected — in this case, Table 5 forSDR-21. It will be seen that the engineer willfrequently be presented with more than oneoption when selecting pipe size. Sometimes acompromise in pipe size will be required to meetpresent needs as well as planned future develop-ment. As a general rule, pipe sizes should beselected to minimize friction losses while keep-ing velocity near or above 2 feet per second.
For example, Zone 1 has a maximum of twopumps running (Column 7). Table 5 offers achoice of 1.25-inch, 1.5-inch or 2-inch pipe. 1.5-inch pipe is selected since flow velocity equals
1617181920
Table 3MAXIMUM NUMBER OF GRINDER
PUMP CORES OPERATING DAILY
Number of GrinderPump Cores Connected
Maximum DailyNumber of Grinder
Pump Cores OperatingSimultaneously
12–34–9
10–1819–30
31–5051–8081–113
114–146147–179
180–212213–245246–278279–311312–344
345–377378–410411–443444–476477–509
510–542543–575576–608609–641642–674
675–707708–740741–773774–806807–839
840–872873–905906–938939–971
972–1,004
12345
6789
10
1112131415
2122232425
2627282930
3132333435

15
35
918
200
114
442.
03.
8963
02.
6316
.56
63.1
440
535
98.1
4
12
33
200
112
221.
53.
0420
52.
154.
4173
.41
4010
3010
3.41
23
69
200
113
332.
02.
9238
01.
545.
8669
.00
4010
3099
.00
45
33
200
112
221.
53.
0431
02.
158.
4653
.25
405
3588
.25
56
930
200
115
553.
02.
2480
00.
604.
8346
.58
405
3581
.58
69
1747
200
116
663.
02.
691,
000
0.85
8.46
41.7
540
535
76.7
57
83
320
011
222
1.5
3.04
175
2.15
3.77
49.5
640
535
84.5
68
94
720
011
333
2.0
2.92
810
1.54
12.5
045
.80
4030
1055
.80
912
660
200
117
773.
03.
1452
01.
125.
8533
.30
4010
3063
.30
1011
33
200
112
221.
53.
0423
02.
154.
9537
.03
4010
3067
.03
1112
36
200
113
332.
02.
9230
01.
544.
6332
.08
4010
3062
.08
1214
167
200
117
773.
03.
1424
01.
122.
7027
.45
4010
3057
.45
1314
33
200
112
221.
53.
0498
52.
1521
.19
45.9
440
535
80.9
414
142
7220
011
777
3.0
3.14
2,20
01.
1224
.75
24.7
540
3010
34.7
5
PREL
IMIN
ARY
LO
W-P
RES
SUR
ESE
WER
SYS
TEM
PIP
E SC
HED
ULE
AN
D Z
ON
E A
NA
LYSI
S O
F:
Illus
trate
d E
xam
ple
Tabl
e 4
Env
ironm
ent/O
neCO
RPO
RATI
ON
AE
SHEE
T NO.
OFR
EV
DATE
: 4A
CC
UM
.PU
MPS
IN Z
ON
E
5G
AL/
DAY
PER
CORE
6M
AX.
FLO
WPE
RC
OR
E
7M
AX
.SI
M O
PS
8M
AX.
FLO
W(g
pm)
9PI
PESI
ZE (i
n)
10M
AX
.VE
LOC
ITY
(FPS
)
11LE
NGTH
OF
MA
INTH
ISZO
NE
12FR
ICTI
ON
LOSS
FAC
TOR
(ft/1
00 ft
)
13FR
ICTI
ON
LOSS
THIS
ZO
NE
14A
CC
UM
.FR
ICTI
ON
LOSS
(ft)
15M
AX
.M
AIN
ELEV
.
16 MIN
.PU
MP
ELEV
.
17S
TATI
CHE
AD(f
t)
18TO
TAL
DYN
AM
ICHE
AD(f
t)
3 NO.
PUM
PSIN
ZO
NE
BY:
PIPE
:
PREP
ARED
FOR:
1ZO
NE
NO
.
2CO
NN.
TO
ZONE
SD
R 2
1 P
VC

16
3.04 ft/sec and friction loss equals 2.15 ft/100 ft. Since the zone is 205 feet in length (Column 11),the total friction loss (Column 13) is:
HF = (2.15 ft/100 ft)(205 ft) = 4.41 ft
For Zone 14, with 72 upstream pumps, it is seen that a maximum of seven pumps can be runningsimultaneously. Table 5 provides options of:
3-inch pipe: V = 3.14 ft/sec; HF = 1.12 ft/100 ft
or
4-inch pipe: V = 1.90 ft/sec; HF = 0.33 ft/100 ft
The smaller-diameter 3-inch pipe is selected because of the increased velocities, especially with theTDH below 185 feet. A choice of 3-inch pipe would lead to a friction loss in this zone of:
HF = (1.12 ft/100 ft) (2200 ft) = 24.75 ft
Accumulated friction loss (Column 14) for each zone is next determined by adding the friction lossfor each zone from the system outfall (Zone 14) to the zone in question. Thus, from Figure 3 it isseen that the accumulated friction loss for Zone 1 is:
Zone Number Friction Loss (ft)14 24.7512 2.70
9 5.85 6 8.46 5 4.83 3 16.56 2 5.86 1 4.41
73.41 ft = Accumulated friction loss, Zone 1
The same summation is completed for each zone.
To complete the hydraulic analysis, refer to the drawing contours and record in Column 15 themaximum line elevation between the point of discharge and the zone under consideration. In Column16, record the elevation of the lowest pump in the zone. Subtract the values in Column 16 from

17
those in Column 15 and record only positive elevation differentials in Column 17. Add the values inColumn 14 to those in Column 17 and record the total in Column 18 to show the maximum combi-nation of friction and static head a pump will experience at any given point in the system.
ReviewThe accumulated data in Table 4 should finally be reviewed for conformity with the criteria of flowvelocity greater than or equal to 2.0 ft/sec and total design head less than or equal to 185 feet. If thesystem pressure exceeds 92 feet, the number of cores operating will remain the same and the flowfrom each pump will be reduced from 11 gpm to 9 gpm.
Data should be reviewed to determine whether system improvements could result from constructionmodifications. As an example, deeper burial of pipe in one or two critical high-elevation zones mightbring the entire system into compliance with design criteria. Environment One should be consultedin marginal cases and/or concerning:
• Odor control issues• Frost protection issues• Excessive static head conditions• Excessive total dynamic head conditions• Unusual applications

18

19
Table 5SDR 21 PVC PIPE
Flow Velocity and Friction Head Loss vs Pumps in Simultaneous Operation (C = 150)
1 1/4 in. 1 1/2 in. 2 in. 2 1/2 in. 3 in. 4 in. 5 in. 6 in. 8 in.
N V HF V HF V HF V HF V HF V HF V HF V HF V HF N123456789
1011121314151617181920212223242526272829303132333435363738394041424344454647484950
123456789
1011121314151617181920212223242526272829303132333435363738394041424344454647484950
1.993.995.987.97
1.154.168.82
15.02
1.523.044.566.08
0.602.154.567.77
1.952.923.894.87
0.731.542.633.97
5.846.81
5.577.41
1.992.663.32
0.611.041.57
3.994.655.325.986.64
2.202.933.754.665.67
1.792.242.693.143.594.044.494.935.385.836.28
0.400.600.851.121.441.792.182.603.053.544.06
1.902.172.442.712.983.253.523.804.074.344.614.885.155.425.695.966.24
0.330.420.530.640.760.901.041.191.361.531.711.902.102.312.532.762.99
1.952.132.312.482.662.843.023.193.373.553.733.904.084.264.444.614.794.975.155.325.505.685.866.036.21
0.270.320.370.430.48 1.88 0.210.550.610.680.750.820.900.981.071.161.251.341.441.541.641.751.861.972.082.202.32
2.002.132.252.382.502.632.752.883.003.133.253.383.503.633.753.884.014.134.264.384.514.634.764.885.015.135.265.385.515.635.765.886.016.136.26
0.230.260.290.320.350.390.420.460.490.530.570.610.660.700.750.790.840.890.940.991.051.101.161.211.271.331.391.451.521.581.651.721.781.851.92
1.992.072.142.21
0.170.180.190.21
2.292.362.442.512.582.662.732.812.882.953.033.103.173.253.323.403.473.543.623.69
0.220.230.250.260.280.290.300.320.340.350.370.390.400.420.440.460.470.490.510.53
N = Number of pumps operating at 11 gpmV = Flow velocity in ft/secHF = Friction head loss in ft/100 ft of pipe
A = = cross-sectional flow, sq. in.
C = 150q = flow in gallons per minuted = I.D. of pipe in inches =
[average O.D. - (2 x min. wall thickness]
d2π4
100C
q 1.852
d 4.8655[ ]V = .3208
Head Loss CalculationsFrom Modified Hazen - Williams Formula
HF = .2083 ( ) x1.852
qA

20
Table 6SCHEDULE 40 PVC PIPE
Flow Velocity and Friction Head Loss vs Pumps in Simultaneous Operation (C = 150)
1 1/4 in. 1 1/2 in. 2 in. 2 1/2 in. 3 in. 4 in. 5 in. 6 in. 8 in.
N V HF V HF V HF V HF V HF V HF V HF V HF V HF N123456789
1011121314151617181920212223242526272829303132333435363738394041424344454647484950
123456789
1011121314151617181920212223242526272829303132333435363738394041424344454647484950
N = Number of pumps operating at 11 gpmV = Flow velocity in ft/secHF = Friction head loss in ft/100 ft of pipe
2.364.727.08
1.746.28
13.31
1.733.475.206.93
0.822.976.29
10.71
1.052.103.154.215.26
0.240.881.863.184.80
6.31 6.73
1.472.212.953.684.425.165.896.63
0.370.791.342.022.833.774.836.01
1.912.392.873.343.824.304.78
0.460.700.991.311.682.092.54
5.255.736.21
3.033.564.13
1.942.222.492.773.053.333.603.884.164.444.714.995.275.545.826.10
0.350.450.560.680.810.951.101.261.431.621.812.012.222.442.672.91
1.942.122.292.472.652.823.003.173.353.533.703.884.064.234.414.594.764.945.115.295.475.645.826.006.17
0.270.320.370.420.480.540.600.670.740.810.890.971.051.141.231.321.421.521.621.721.831.942.062.172.29
1.952.082.202.322.442.562.692.812.933.053.173.303.423.543.663.793.914.034.154.274.404.524.644.764.885.015.135.255.375.495.625.745.865.986.11
0.220.250.270.300.330.360.400.430.470.500.540.580.620.660.700.750.790.840.890.940.991.041.091.151.201.261.311.371.431.491.561.621.681.751.81
1.982.052.122.192.262.332.402.472.542.612.682.752.822.892.963.033.113.183.253.323.393.463.53
0.160.170.190.200.210.220.230.250.260.270.290.300.320.330.350.360.380.390.410.430.440.460.48
A = = cross-sectional flow, sq. in.
C = 150q = flow in gallons per minuted = I.D. of pipe in inches =
[average O.D. - (2 x min. wall thickness]
d2π4
100C
q 1.852
d 4.8655[ ]V = .3208 q
A
Head Loss CalculationsFrom Modified Hazen - Williams Formula
HF = .2083 ( ) x1.852

21
Table 7SDR 11 HDPE PIPE
Flow Velocity and Friction Head Loss vs Pumps in Simultaneous Operation (C = 155)
1 1/4 in. 1 1/2 in. 2 in. 3 in. 4 in. 5 in. 6 in. 8 in.
N V HF V HF V HF V HF V HF V HF V HF V HF N123456789
1011121314151617181920212223242526272829303132333435363738394041424344454647484950
123456789
1011121314151617181920212223242526272829303132333435363738394041424344454647484950
N = Number of pumps operating at 11 gpmV = Flow velocity in ft/secHF = Friction head loss in ft/100 ft of pipe
2.474.957.42
1.846.63
14.04
1.863.725.587.44
0.923.327.0311.98
2.383.574.765.95
1.122.374.046.11
7.14 8.56
1.642.192.743.293.834.384.935.486.03
0.360.610.921.301.722.212.753.343.98
1.992.322.652.983.313.653.984.314.644.975.305.635.976.30
0.380.510.650.810.981.171.381.601.832.082.352.632.923.23
1.952.172.392.602.823.043.253.473.693.904.124.344.564.774.995.215.425.645.866.07
0.290.350.420.490.570.650.740.840.941.041.151.271.391.511.641.771.912.062.212.36
1.992.142.29
0.240.280.32
2.452.602.752.903.063.213.363.523.673.823.984.134.284.434.594.744.895.055.205.355.505.665.815.966.12
0.360.400.440.490.540.590.640.700.760.820.880.941.011.081.151.221.291.371.441.521.601.691.771.861.95
1.982.082.172.262.352.442.532.622.712.802.892.983.073.163.253.343.433.523.613.703.793.883.974.064.154.244.334.424.51
0.180.190.210.230.240.260.280.300.320.340.360.380.400.420.440.470.490.520.540.570.590.620.650.670.700.730.760.790.82
A = = cross-sectional flow, sq. in.
C = 150q = flow in gallons per minuted = I.D. of pipe in inches =
[average O.D. - (2 x min. wall thickness]
d2π4
100C
q 1.852
d 4.8655[ ]V = .3208 q
A
Head Loss CalculationsFrom Modified Hazen - Williams Formula
HF = .2083 ( ) x1.852

22
References1. Carcich, I., Hetling, L.J., and Farrell, R.P. “A Pressure Sewer System Demonstration,” EPA-R2-72-091, Office of Research and Monitoring, U.S. Environmental Protection Agency, Washington,D.C., November 1972.
2. Farrell, R.P. “Long-Term Observation of Wastewater Observation Stations,” TM-2, AmericanSociety of Civil Engineers, April 1968.
3. “Handbook of PVC Pipe: Design and Construction,” Uni-Bell PVC Pipe Association, Dallas,Texas, Second Edition, 1982.
4. Hicks, T.G., and Edwards, T. W. “Pump Application Engineering,” McGraw Hill, New York, 1971.
5. Stepanoff, A.J. “Centrifugal and Axial Flow Pumps,” John Wiley and Sons, New York, 1948.
6. Tucker, L.S. “Hydraulics of a Pressurized Sewerage System and Use of Centrifugal Pumps,” TM-6, American Society of Civil Engineers, 1967.
7. Tucker, L.S. “Sewage Flow Variations in Individual Homes,” TM-2, American Society of CivilEngineers, February 1967.
8. Waller, D.H. “Peak Flow of Sewage from Individual Homes,” TM-9, American Society of CivilEngineers, January 1968.

23
TYPICAL INDOOR INSTALLATION

24
25
26

27

28

29

30
Manufacturer Evaluation ListGeneral Requirements for Low Pressure Sewer Systems• Local fast-response service and maintenance organization has been des-
ignated• Manufacturers of all equipment specified for the system have supplied all
installation details• Warranties for all equipment specified for the system have been evaluated• Fast replacement parts availability for all equipment in the system has been
ensured by each equipment manufacturer• User instructions have been supplied to homeowners
• Designated for the specific purpose of grinding and pumping domestic waste-water
• Suitable for parallel operation in a system containing thousands of pumpsconnected to a common discharge line
• Has a history of reliable operation• Compatible with existing power sources and provides economical opera-
tion• Simple to service and troubleshoot, easily accessible for removal of grinder
pump core; designed with simple wiring and controls; easily disassembledand reassembled
• Warranty covering parts and labor for a reasonable length of time• Supported by a thoroughly detailed installation manual, service manual and
facilities for service training
• Canadian Standards Association• Underwriters Laboratories, Inc.• National Sanitation Foundation
• Non-clogging pump• Non-jamming grinder• Anti-siphon valve integral with grinder pump• All valves of non-clogging design: integral check valve, anti-siphon valve
and redundant check valve• High-level warning alarm
• Low rpm (1,725)• Overload protection, built-in, automatic reset• High torque, low starting current
• Self scouring• Completely sealed• Non-corroding material
• Non-fouling type• No moving parts in contact with sewage
• Completely protected• Simple to service or replace• UL-listed alarm panel
Service andMaintenanceCheck List
Certifications
Required Features
Motor
Grinder Pump
Level SensingControl
Tank
Motor Controls

Environment One Corporation2773 Balltown RoadNiskayuna, New York USA 12309–1090
Voice: (01) 518.346.6161Fax: 518.346.6188
www.eone.com LM000353 Rev. A060208
A Precision Castparts Company