Embed Size (px)
Citation preview

Page 1 of 49
Fruit and Vegetable Programs Processed Products Branch
Lot Single Sampling Plan Attribute January 2011
LOT SINGLE SAMPLING PLAN (ATTRIBUTES) Sampling Plan and Acceptance Criteria The table below shows the applicable sample size and acceptance number, depending on the lot size.
CONTAINER SIZE LOT SIZE (NUMBER OF CASES)
Less than 7/16 ounce 3,000 or Less
3,001 to 12,000
12,001 to 39,000
39,001 to 84,000
84,001 to 145,000
7/16 ounce and above 1,500 or Less
1,501 to 6,000
6,001 to 19,500
19,501 to 42,000
42,001 to 72,500
LOT INSPECTION: Sample Size (No. of Sample Units) Acceptance Number
3 0
6 1
13 2
21 3
29 4
ON-LINE IN-PLANT INSPECTION: Sample Size (No. of Sample Units) Acceptance Number
3 0
6 1
6 1
13 2
21 3
Lot Single Sampling Plan (Attributes) Use the lot single sampling plan (attributes) when the purpose is to:
1. Accept or reject a lot stored in a public warehouse, freezer storage, plant warehouse, truck or rail car, or other similar storage;
2. Accept or reject the entire production from a basic grading period as one lot.
Sample units may be drawn from either the production line or the warehouse;
3. Perform an appeal inspection (attributes only); or 4. Grade an unofficial sample.
Note: You may not use the lot plan to accept or reject portions of a lot (e.g., codes, pallets, etc.), unless you sample each portion and treat it as a lot.

Page 2 of 49
Fruit and Vegetable Programs Processed Products Branch
Lot Single Sampling Plan Attribute January 2011
A.
How to draw the sample
1. Follow the general procedures and instructions as outlined in this manual and Inspection Aid No. 42 (maximum lot size is limited). Draw the number of sample units as indicated by these procedures, except as outlined below.
2. The minimum sample size is the entire contents of 6 containers. The
maximum sample size is the entire contents of 29 containers. The sample sizes are as follows:
CONTAINER SIZE MINIMUM SAMPLE SIZE NO. OF SAMPLE UNITS
INSTITUTIONAL (e.g., No. 10, gallon, 2-½ lb., etc.)
Entire contents 3, 6, 13, 21, or 29 1/
CONSUMER (e.g., No. 300, No. 303, 2-½,10 oz, 20 oz, etc.)
Entire contents 6, 13, 21, or 29 1/
BULK (e.g., tote bins, 30 lb. case, etc.)
Subsamples 6, 13, 21, or 29 1/
1/ The minimum sample size that can be inspected is 36 units of product. B.
How to evaluate a sample
1. Non-quality factors. Make all non-quality factor determinations that are required for the product on a container-by-container basis.
Example 1: Tally sheet showing only non-quality factors
Container Code ABC KLM NOP RST
Net Weight (Grams) 455 454 452 456 455 454
Vacuum 3 4 3 3 4 4
Drained Weight (grams) 297 283 289 269 297 286
Sirup (degrees Brix) 20 20 21 21 19 20
Designation Heavy
Style Halves
Count 7 6 6 7 5 7

Page 3 of 49
Fruit and Vegetable Programs Processed Products Branch
Lot Single Sampling Plan Attribute January 2011
2. Quality factors.
a. Prerequisite quality factors. Evaluate and record each prerequisite quality factor applicable for the product. Make these decisions on a container-by-container basis. Record the prerequisite grades as either grade A, grade B, grade C, or Substandard.
Example 2: Tally sheet showing only prerequisites
P R E
Brightness A A A A A B
Flavor and Odor A A A A A A
Peel A A B A A A
Uniformity of Size A A A A A A
b. Classified defects. After the non-quality factors and prerequisite quality factors have been evaluated and recorded, the individual containers lose their identity for the purpose of classifying defects. Use the entire contents of all of the containers in the sample.
(1) Starting with the first container, arrange all of the product in a
straight line (or lines). Go to the second container and add those units of product to the end of the line where the first container stopped. Do the same for all additional containers in the sample, until all of the units of product are arranged in order.
Example 3: Arranging the sample
1
plus 1st can 2nd can
plus remaining containers and units of product
2 3 4 5 6
Include all associated material (EVM, pits, vines, chaff, etc.)
7

Page 4 of 49
Fruit and Vegetable Programs Processed Products Branch
Lot Single Sampling Plan Attribute January 2011
(2) Count the total number of units of product in the sample.
Follow the appropriate U.S. standard to determine whether broken units are to be reassembled; and whether associated material is to be included in the count.
Example 4: Showing the total sample of pear halves
1 2 3 4 5 6 7 8 9 10 11 12 13 14 15 16
This illustration shows a total count of 16 units.
(3) Adjust the total number of units of product in the sample to
correspond with the sampling plan.
Page 5 of 49
Fruit and Vegetable Programs Processed Products Branch
Lot Single Sampling Plan Attribute January 2011
Example 5: Adjusting the sample to the sampling plan.
TABLE XV
LOT SINGLE SAMPLING PLANS STANDARD SAMPLE UNIT SIZE = 6
NUMBER OF SAMPLE UNITS 6 13 21 29
ACCEPTANCE NUMBERS Quality Levels Expressed as Defects per Hundred Units or Percent Defective
AQL 1.0 1 2 3 4 1.5 1 3 4 5 2.5 3 4 6 8
Standard Sample Unit Size (6) times Number of Sample Units (6) = 36 units of product to examine. Arrange the total number of sample units as shown in Example 4 above, and evaluate the first 36 units of product in the sample.
(4) Follow the U.S. standards or other specifications to classify the
defects in the sample.
Page 6 of 49
Fruit and Vegetable Programs Processed Products Branch
Lot Single Sampling Plan Attribute January 2011
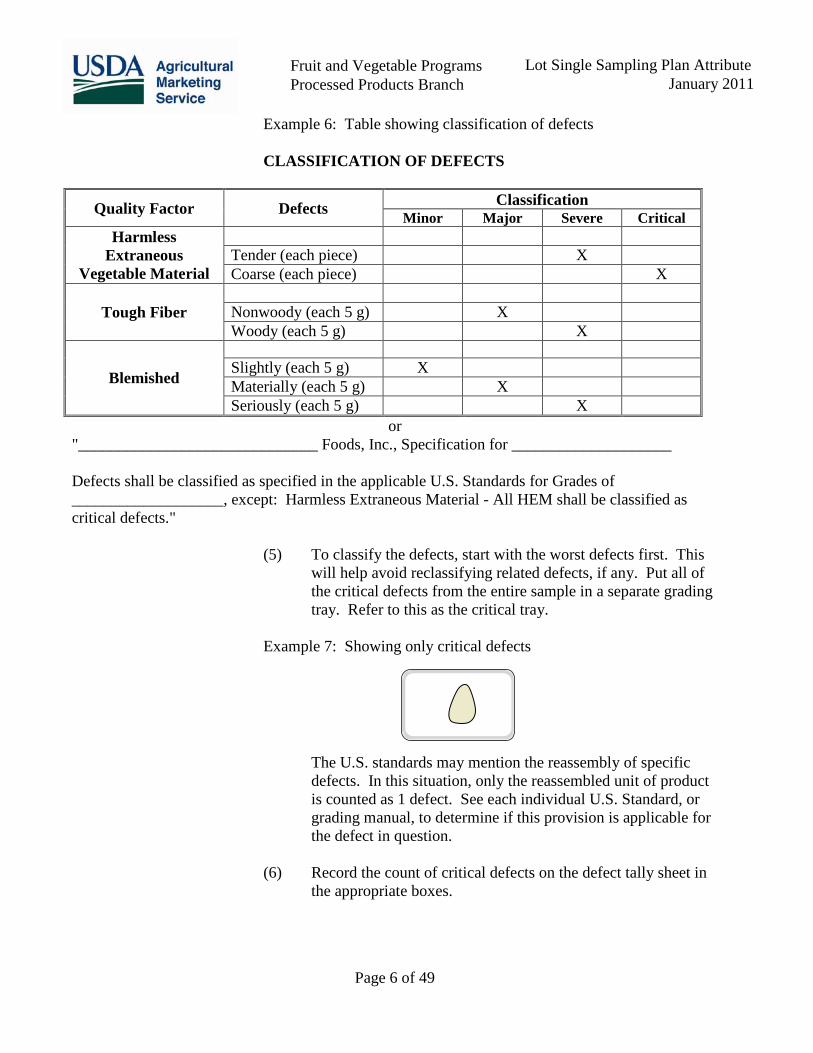
Example 6: Table showing classification of defects CLASSIFICATION OF DEFECTS
Quality Factor Defects Classification Minor Major Severe Critical
Harmless Extraneous
Vegetable Material
Tender (each piece) X Coarse (each piece) X
Tough Fiber
Nonwoody (each 5 g) X Woody (each 5 g) X
Blemished
Slightly (each 5 g) X Materially (each 5 g) X Seriously (each 5 g) X
or "______________________________ Foods, Inc., Specification for ____________________ Defects shall be classified as specified in the applicable U.S. Standards for Grades of ___________________, except: Harmless Extraneous Material - All HEM shall be classified as critical defects."
(5) To classify the defects, start with the worst defects first. This
will help avoid reclassifying related defects, if any. Put all of the critical defects from the entire sample in a separate grading tray. Refer to this as the critical tray.
Example 7: Showing only critical defects
The U.S. standards may mention the reassembly of specific defects. In this situation, only the reassembled unit of product is counted as 1 defect. See each individual U.S. Standard, or grading manual, to determine if this provision is applicable for the defect in question.
(6) Record the count of critical defects on the defect tally sheet in
the appropriate boxes.
Page 7 of 49
Fruit and Vegetable Programs Processed Products Branch
Lot Single Sampling Plan Attribute January 2011
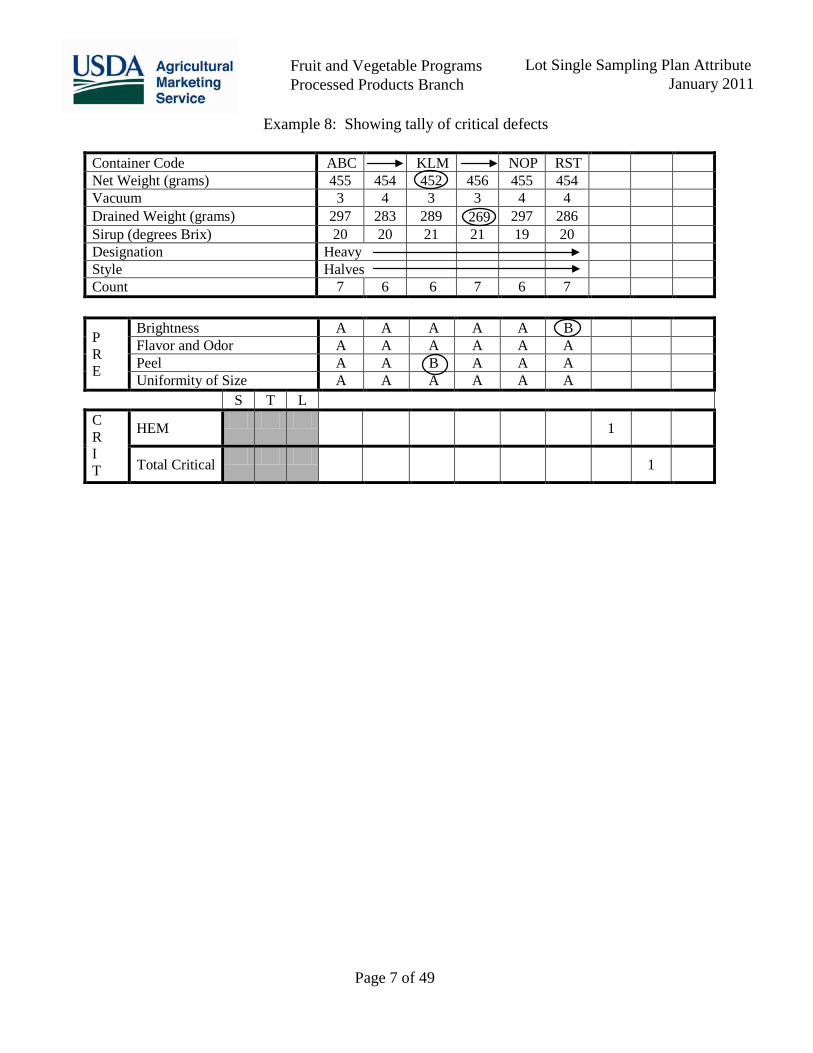
Example 8: Showing tally of critical defects
Container Code ABC KLM NOP RST Net Weight (grams) 455 454 452 456 455 454 Vacuum 3 4 3 3 4 4 Drained Weight (grams) 297 283 289 269 297 286 Sirup (degrees Brix) 20 20 21 21 19 20 Designation Heavy Style Halves Count 7 6 6 7 6 7
P R E
Brightness A A A A A B Flavor and Odor A A A A A A Peel A A B A A A Uniformity of Size A A A A A A
S T L C R I T
HEM 1
Total Critical 1
Page 8 of 49
Fruit and Vegetable Programs Processed Products Branch
Lot Single Sampling Plan Attribute January 2011
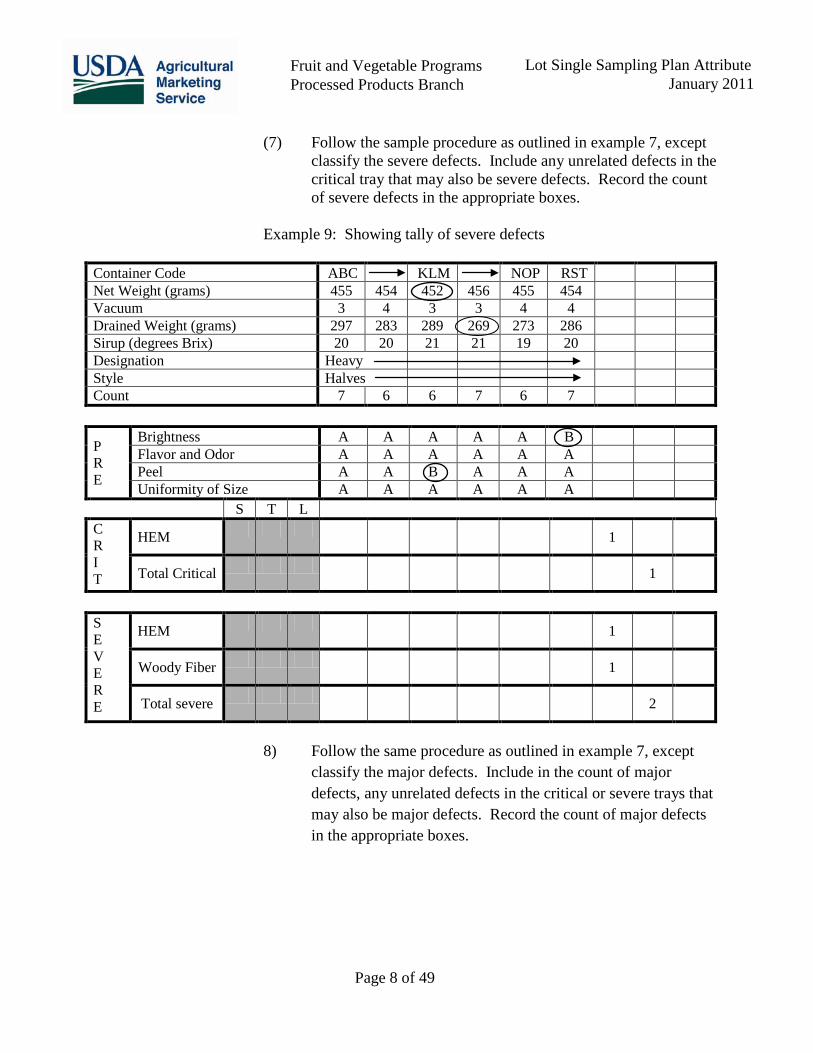
(7) Follow the sample procedure as outlined in example 7, except
classify the severe defects. Include any unrelated defects in the critical tray that may also be severe defects. Record the count of severe defects in the appropriate boxes.
Example 9: Showing tally of severe defects
Container Code ABC KLM NOP RST Net Weight (grams) 455 454 452 456 455 454 Vacuum 3 4 3 3 4 4 Drained Weight (grams) 297 283 289 269 273 286 Sirup (degrees Brix) 20 20 21 21 19 20 Designation Heavy Style Halves Count 7 6 6 7 6 7
P R E
Brightness A A A A A B Flavor and Odor A A A A A A Peel A A B A A A Uniformity of Size A A A A A A
S T L C R I T
HEM 1
Total Critical 1
S E V E R E
HEM 1
Woody Fiber 1
Total severe 2
8) Follow the same procedure as outlined in example 7, except
classify the major defects. Include in the count of major defects, any unrelated defects in the critical or severe trays that may also be major defects. Record the count of major defects in the appropriate boxes.

Page 9 of 49
Fruit and Vegetable Programs Processed Products Branch
Lot Single Sampling Plan Attribute January 2011
Example 10: Showing tally of major defects
Container Code ABC KLM NOP RST Net Weight (grams) 455 454 452 456 455 454 Vacuum 3 4 3 3 4 4 Drained Weight (grams) 297 283 289 269 297 286 Sirup (degrees Brix) 20 20 21 21 19 20 Designation Heavy Style Halves Count 7 6 6 7 6 7
P R E
Brightness A A A A A B Flavor and Odor A A A A A A Peel A A B A A A Uniformity of Size A A A A A A
S T L C R I T
HEM 1
Total Critical 1
S E V E R E
HEM 1
Woody Fiber 1
Total severe 2
M A J O R
Beemished 2
Norwoody Fiber 1
Total Major 3
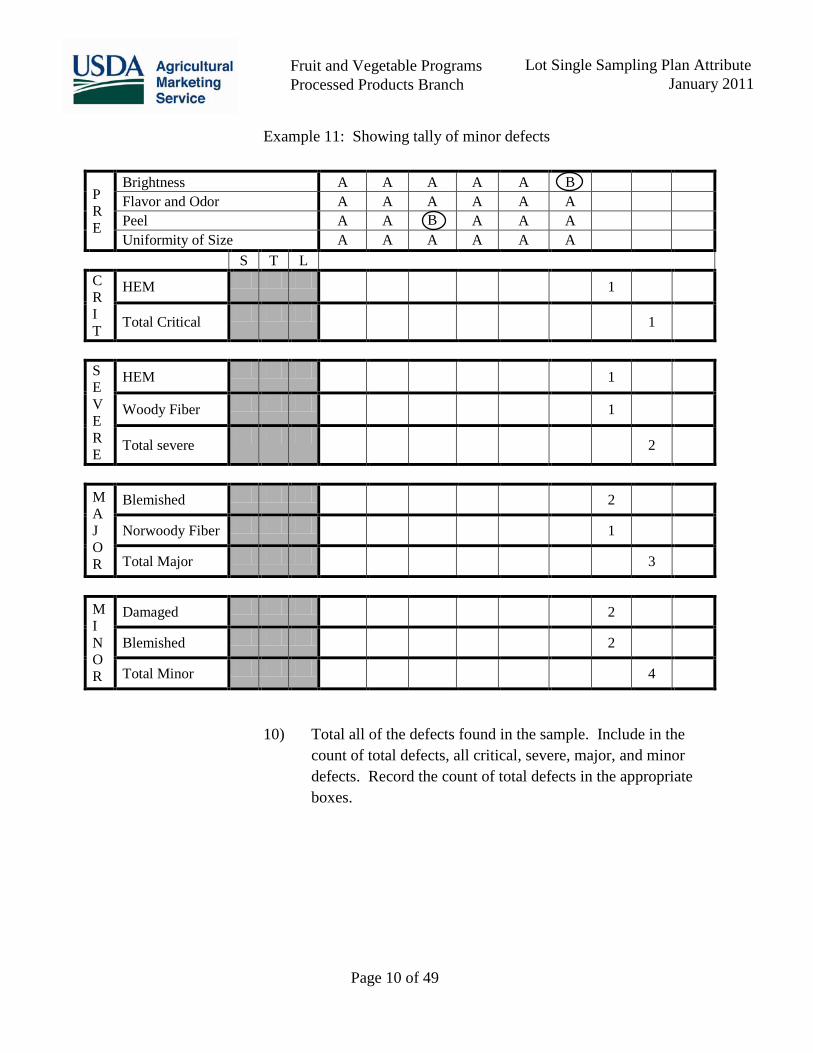
9) Follow the same procedure outlined in example 7, except classify the minor defects. Include in the count of minor defects, any unrelated defects in the critical, severe, or major trays that are also minor defects. Record the count of minor defects in the appropriate boxes.
Page 10 of 49
Fruit and Vegetable Programs Processed Products Branch
Lot Single Sampling Plan Attribute January 2011
Example 11: Showing tally of minor defects
P R E
Brightness A A A A A B Flavor and Odor A A A A A A Peel A A B A A A Uniformity of Size A A A A A A
S T L C R I T
HEM 1
Total Critical 1
S E V E R E
HEM 1
Woody Fiber 1
Total severe 2
M A J O R
Blemished 2
Norwoody Fiber 1
Total Major 3
M I N O R
Damaged 2
Blemished 2
Total Minor 4
10) Total all of the defects found in the sample. Include in the count of total defects, all critical, severe, major, and minor defects. Record the count of total defects in the appropriate boxes.

Page 11 of 49
Fruit and Vegetable Programs Processed Products Branch
Lot Single Sampling Plan Attribute January 2011
Example 12: Showing tally of total all classes of defects
P R E
Brightness A A A A A B Flavor and Odor A A A A A A Peel A A B A A A Uniformity of Size A A A A A A
S T L C R I T
HEM 1
Total Critical 1
S E V E R E
HEM 1
Woody Fiber 1
Total severe 2
M A J O R
Blemished 2
Norwoody Fiber 1
Total Major 3
M I N O R
Damaged 2
Blemished 2
Total Minor 4
Total All Classes 10 10
Double Check
c. Other defects, if any. Some U.S. standards or special procedures may
have defects not classified as minor, major, severe, or critical. However follow the general procedures in this manual to tally the number of nonconforming units of product found in the sample.

Page 12 of 49
Fruit and Vegetable Programs Processed Products Branch
Lot Single Sampling Plan Attribute January 2011
Example 13: Other defects
G R A D E
A
Substandard Units 2 CUSUM 0.4 0.8 0.8
Grade “C” Units 5 CUSUM 1 1.8 2.6
Grade “B” Units 10 Total “B” “C” “SSTD” 17
CUSUM 2 15 6
Example 14: Other defects

Page 13 of 49
Fruit and Vegetable Programs Processed Products Branch
Lot Single Sampling Plan Attribute January 2011
How to assign a grade to a sample
A. Prerequisite quality factors. All prerequisite quality factors must meet the requirements of the grade that is assigned.
Example 15: Showing prerequisite quality factors
P R E
Brightness A A A B A A Flavor and Odor A A A A A A Peel A A A A A A Uniformity of Size A A A A A A
S T L
Sample Unit Grade A A A B A A
Final Grade Could grade NO higher than Grade B

Page 14 of 49
Fruit and Vegetable Programs Processed Products Branch
Lot Single Sampling Plan Attribute January 2011
Example 16: Showing prerequisite quality factors
P R E
Brightness A A A A A A Flavor and Odor A A A A A A Peel A A A A A C Uniformity of Size A A A A A A
S T L
Sample Unit Grade A A A A A C
Final Grade Could grade NO higher than Grade C

Page 15 of 49
Fruit and Vegetable Programs Processed Products Branch
Lot Single Sampling Plan Attribute January 2011
B. Classified quality factors. The defects in the sample shall not exceed the acceptance
numbers for "total all classes," "major," "severe," and "critical" classifications.
1. Refer to the appropriate product standards (or other specifications) to obtain the published AQLs for each grade level.
Example 17: Showing AQLs for each grade level
GRADE A GRADE B GRADE C Total 1/ Maj Sev Crit Total 1/ Maj Sev Crit Total 1/ Maj Sev Crit
AQL2/ 12.5 4.0 1.5 1.0 20.0 6.5 4.0 1.5 25.0 10.0 6.5 2.5
1/ Total = Minor + Major + Severe + Critical 2/ AQL expressed as defects per 100 units
or
“___________________ Foods, Inc., Product specification for Frozen (or canned) _______________, Second Label: Total 1/ Maj Sev Crit AQL2/ 12.5 4.0 1.5 1.0
1/ Total = Minor + Major + Severe + Critical 2/ AQL expressed as defects per 100 units
Page 16 of 49
Fruit and Vegetable Programs Processed Products Branch
Lot Single Sampling Plan Attribute January 2011
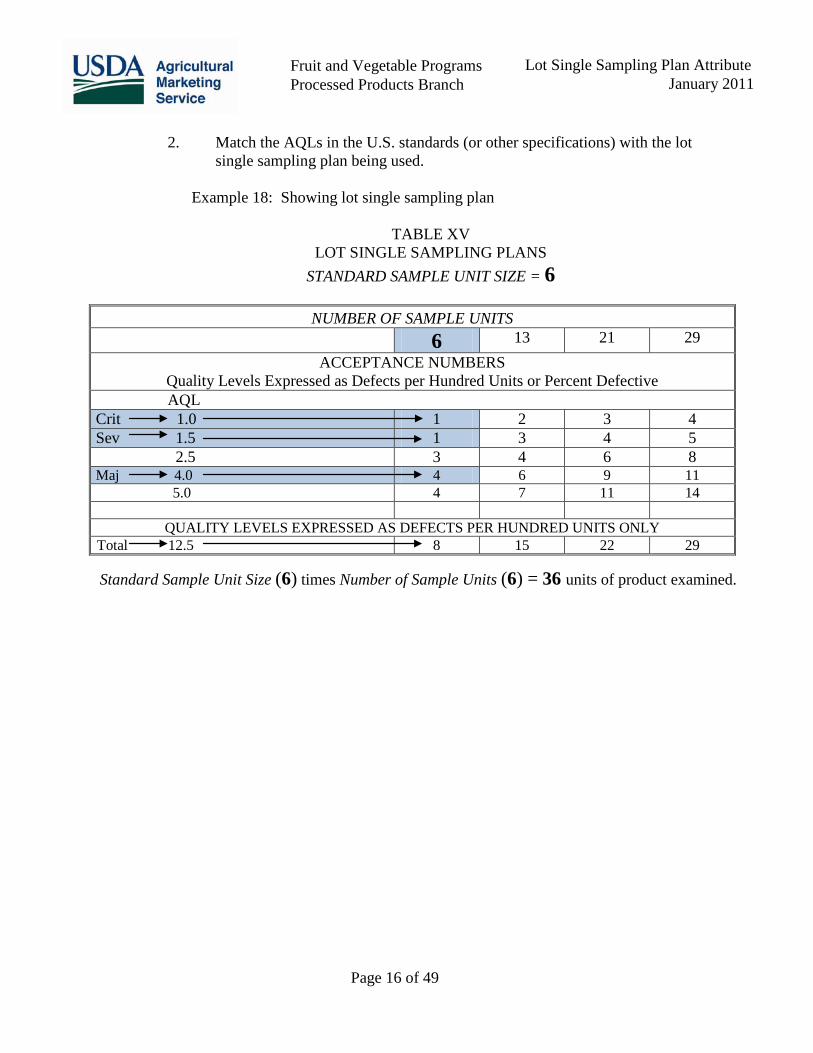
2. Match the AQLs in the U.S. standards (or other specifications) with the lot
single sampling plan being used.
Example 18: Showing lot single sampling plan
TABLE XV LOT SINGLE SAMPLING PLANS
STANDARD SAMPLE UNIT SIZE = 6
NUMBER OF SAMPLE UNITS 6 13 21 29
ACCEPTANCE NUMBERS Quality Levels Expressed as Defects per Hundred Units or Percent Defective AQL
Crit 1.0 1 2 3 4 Sev 1.5 1 3 4 5 2.5 3 4 6 8 Maj 4.0 4 6 9 11 5.0 4 7 11 14
QUALITY LEVELS EXPRESSED AS DEFECTS PER HUNDRED UNITS ONLY Total 12.5 8 15 22 29
Standard Sample Unit Size (6) times Number of Sample Units (6) = 36 units of product examined.

Page 17 of 49
Fruit and Vegetable Programs Processed Products Branch
Lot Single Sampling Plan Attribute January 2011
3. Compare the acceptance numbers from the lot single sampling plan being
used to the number of defects that you've found in the sample. Example 19: Showing defect tally and acceptance numbers
Container Size 24/303 B/B E/L
P R E
Brightness A A A A A A Flavor and Odor A A A A A A Peel A A A A A A Uniformity of Size A A A A A A
S T L C R I T
HEM 1
Total Critical 1
S E V E R E
Short Stem 1
Fibrous
Total Severe 1
M A J O R
Gouged 2
Blemished 1
Total Major 3
M I N O R
Damaged 1
Blemished 1
Total Minor 2
Total All Classes 7 7
Sample Unit Grade A A A A A A
Final Grade A
AQL
1.0
4.0
12.5
Acceptance No.
1
4
8
1.5
1

Page 18 of 49
Fruit and Vegetable Programs Processed Products Branch
Lot Single Sampling Plan Attribute January 2011
Example 20: Mold count record
Acceptance No. is 4/50 fields
Page 19 of 49
Fruit and Vegetable Programs Processed Products Branch
Lot Single Sampling Plan Attribute January 2011
APPENDIX
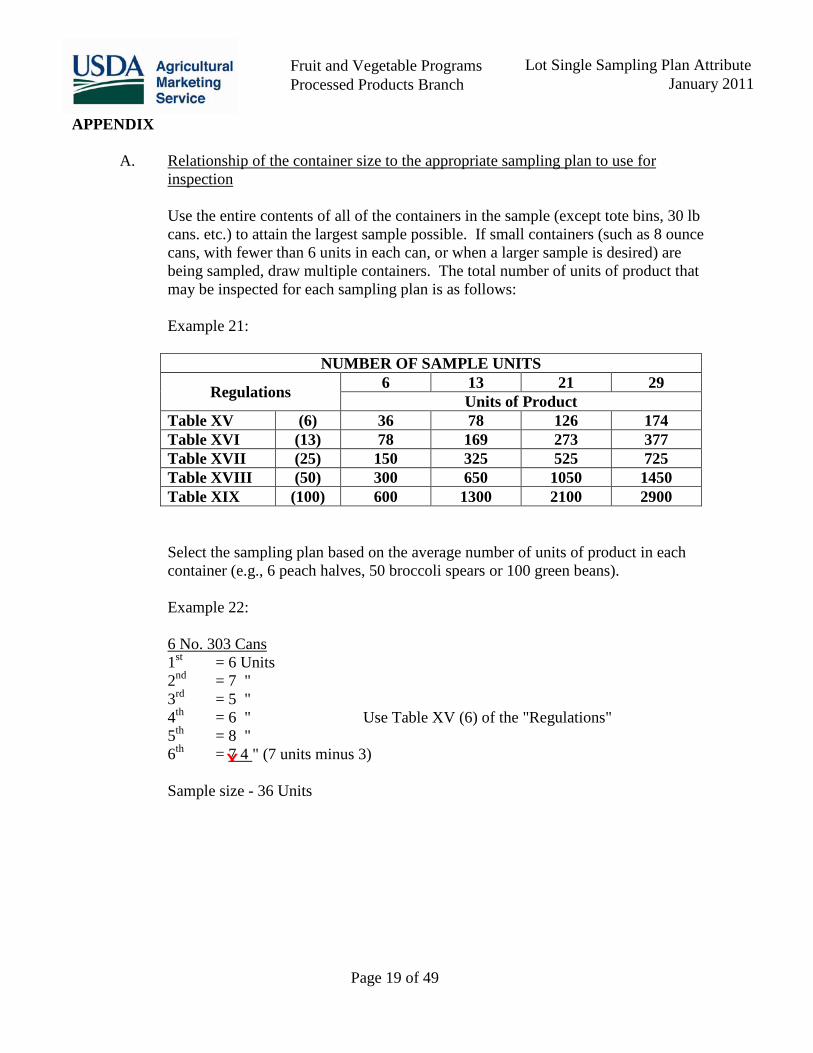
A.
Relationship of the container size to the appropriate sampling plan to use for inspection
Use the entire contents of all of the containers in the sample (except tote bins, 30 lb cans. etc.) to attain the largest sample possible. If small containers (such as 8 ounce cans, with fewer than 6 units in each can, or when a larger sample is desired) are being sampled, draw multiple containers. The total number of units of product that may be inspected for each sampling plan is as follows:
Example 21:
NUMBER OF SAMPLE UNITS
Regulations 6 13 21 29 Units of Product
Table XV (6) 36 78 126 174 Table XVI (13) 78 169 273 377 Table XVII (25) 150 325 525 725 Table XVIII (50) 300 650 1050 1450 Table XIX (100) 600 1300 2100 2900 Select the sampling plan based on the average number of units of product in each container (e.g., 6 peach halves, 50 broccoli spears or 100 green beans).
Example 22:
1st = 6 Units
6 No. 303 Cans
2nd = 7 " 3rd = 5 " 4th = 6 " Use Table XV (6) of the "Regulations" 5th = 8 " 6th = 7 4
" (7 units minus 3)
Sample size - 36 Units
x

Page 20 of 49
Fruit and Vegetable Programs Processed Products Branch
Lot Single Sampling Plan Attribute January 2011
Example 23:
13 No. 2-1/2 Cans
1st = 15 Units 2nd = 18 " 3rd = 12 " 4th = 13 " 5th = 14 " 6th = 15 " 7th = 13 " Use Table XVI (13) of the "Regulations" 8th = 12 " 9th = 15 " 10th = 14 " 11th = 13 " 12th = 12 " 13th = 14 3
" (14 units minus 11)
Sample size - 169 Units Example 24:
1st = 48 Units
6/20-ounce Cartons
2nd = 55 " 3rd = 50 " 4th = 52 " 5th = 49 " 6th = 50 " 7th = 47 " Use Table XVIII (50) of the "Regulations" 8th = 48 " 9th = 50 " 10th = 51 " 11th = 52 " 12th = 50 " 13th = 50 48
" (50 units minus 2)
Sample size - 650 Units
x
x

Page 21 of 49
Fruit and Vegetable Programs Processed Products Branch
Lot Single Sampling Plan Attribute January 2011
Example 25: 1st = 96 Units 2nd = 100 " 3rd = 110 " 4th = 98 " 5th = 105 " 6th = 102 " 7th = 98 " 8th = 101 " 9th = 105 " 10th = 100 " Use Table XIX (100) of the "Regulations" 11th = 99 " 12th = 100 " 13th = 110 " 14th = 102 " 15th = 103 " 16th = 106 " 17th = 104 " 18th = 98 " 20th = 99 " 21st = 102 64
" (102 units minus 38)
Sample size - 2100 Units
B.
Associated material (harmless extraneous vegetable material, pits, seeds, chaff, broken, pieces, etc.)
The U.S. standards specify when associated material is to be included (or reassembled and included) in the standard sample unit size. Associated material is usually to be included in the standard sample unit size if 50 percent or more of the contents of the last container in the sample unit is used for inspection. Under lot inspection, all of the contents of the containers in the sample are used for inspection, except possibly the last container. The 50 percent or more rule in the standards still applies under the lot plan; however, it would apply only to the last container in the sample.
Example 26: (Refer to Example 22, shown previously in this section.)
All of the associated material in each can would be included in the sample.
Example 27: (Refer to Example 23, shown previously in this section.)
All of the associated material in the first 12 cans would be included in the sample. None of the associated material in the 13th can would be included, as less than 50 percent of can 13 was included in the sample.
x

Page 22 of 49
Fruit and Vegetable Programs Processed Products Branch
Lot Single Sampling Plan Attribute January 2011
Example 28: (Refer to Example 24, shown previously in this section.)
All of the associated material in each carton would be included in the sample.
Example 29: (Refer to Example 25, shown previously in this section.)
All of the associated material in each can would be included in the sample.
C.
Inspection of No. 10 cans, gallons (glass), or similar containers
Although 6 sample units is the minimum sample size for the lot single sampling plan (attributes), it is permissible to draw only 3 containers from small lots of large containers, when 3 is the sample size indicated by Inspection Aid No. 42.
Use all of the units of product possible and apply them to the acceptance numbers that would work best for the total number of units of product in the sample.
Note: 36 units of product (6 x 6 = 36) is the least number that could be inspected. If 3 cans fall short of 36 units of product, draw additional cans.
Example 30:
1st = 36 Units Use Table XVI (13) of the "Regulations" 3 No. 10 Cans
2nd = 35 " 3rd = 30 7
" (30 minus 23)
78 Units
Eliminate the last 23 units in the last can and use 78 units (13x6=78) for inspection.
Example 31:
1st = 60 Units Use Table XVII (25) of the "Regulations" 3 No. 10 Cans
2nd = 55 " 3rd = 4835
" (48 minus 13)
150 Units
Eliminate the last 13 units in the last can and use 150 units (25x6=150) for inspection.
X
x

Page 23 of 49
Fruit and Vegetable Programs Processed Products Branch
Lot Single Sampling Plan Attribute January 2011
Example 32:
1st = 96 Units 3 No. 10 Cans
2nd = 100 " Use Table XVIII (50) of the "Regulations" 3rd = 102
"
298 Units
The 2 units short of 300 (50x6=300) is within insignificant plus or minus variation.
D.
Standard sample unit size or number of defects by weight, rather than by count
1. Standard sample unit size. Some U.S. standards specify the standard sample unit size by weight, (e.g., 250 g). In these situations, follow the same procedure outlined in this manual, except convert to weight.
Example 33: (Each 5 g equals 1 defect)
1st = 284 g 6/10-ounce Cartons
2nd = 285 " 3rd = 284 " 4th = 285 " Use Table XVII (25) of the "Regulations" 5th = 286 " 6th = 202
" (285 minus 83 g)
1625 g
1625 5
= 325
Example 34: (Each 5 g equals 1 defect)
1st = 1985 g (drained wt) 6 No. 10 Cans
2nd = 2000 " 3rd = 1993 " 4th = 1996 " Use Table XIX (100) of the "Regulations" 5th = 1990 " 6th = 536
" (1988 minus 1452 g)
10500 g
10500 5
= 2100

Page 24 of 49
Fruit and Vegetable Programs Processed Products Branch
Lot Single Sampling Plan Attribute January 2011
2. Number of defects. Some U.S. standards specify that 1 defect equals "x" amount. In these situations, follow the same procedure outlined in this manual, except convert to weight.
Example 35: Each 5 g equals 1 defect
S E V E R E
Blemished (Seriously)
Fiber (Woody) 13 HEM (Class 1)
TOTAL SEVERE
CUSUM Grade A 0.4 0.8 1.6
Grade B 1 1 2
M A J O R
Blemished (Materially)
Fiber (Non-woody) 26
HEM (Class 1)
TOTAL MAJOR
CUSUM Grade A 1.5 1.5 3
Grade B 1 3 3
Woody fiber = 62 5
g
Non-woody fiber = 128 5
g
E.
Lot segregation
Under the lot single sampling plan, it is not possible to segregate portions of a failed lot. If the applicant wishes to identify possible portions (codes or sub-codes) that are much worse than the average quality level of the lot, those portions must be sampled as a separate lot.
However, it is possible to make notes on the defect tally sheet which would indicate that specific codes in the sample were much worse than others. This information would be useful to an applicant who wished to rework a failed lot. Unless the

Page 25 of 49
Fruit and Vegetable Programs Processed Products Branch
Lot Single Sampling Plan Attribute January 2011
offending codes are much worse than the average quality level of the lot, the apparent poorer quality of some containers could be accredited to sampling variation. Sampling variation could also cause a strictly "borderline" lot to fail one time and pass the next.
F.
Adjusting the defect tally
In some situations, it is necessary to adjust specific defects on the tally prior to determining acceptance for lower grades. If a sample fails grade A, remove those defects that are offending to grade A only, and determine acceptance for grade B. If a sample fails grade B, remove those defects that are offending to grade B only, and determine acceptance for grade C.
Example 36: Defects that would need adjusting
TABLE______
CLASSIFICATION OF DEFECTS
Quality Factor Defect
Classification
Minor Major Severe Critical
Individual Unit Color
Reasonably well developed (Grade A only) X
Poorly developed (in Grades A and B) X
Page 26 of 49
Fruit and Vegetable Programs Processed Products Branch
Lot Single Sampling Plan Attribute January 2011
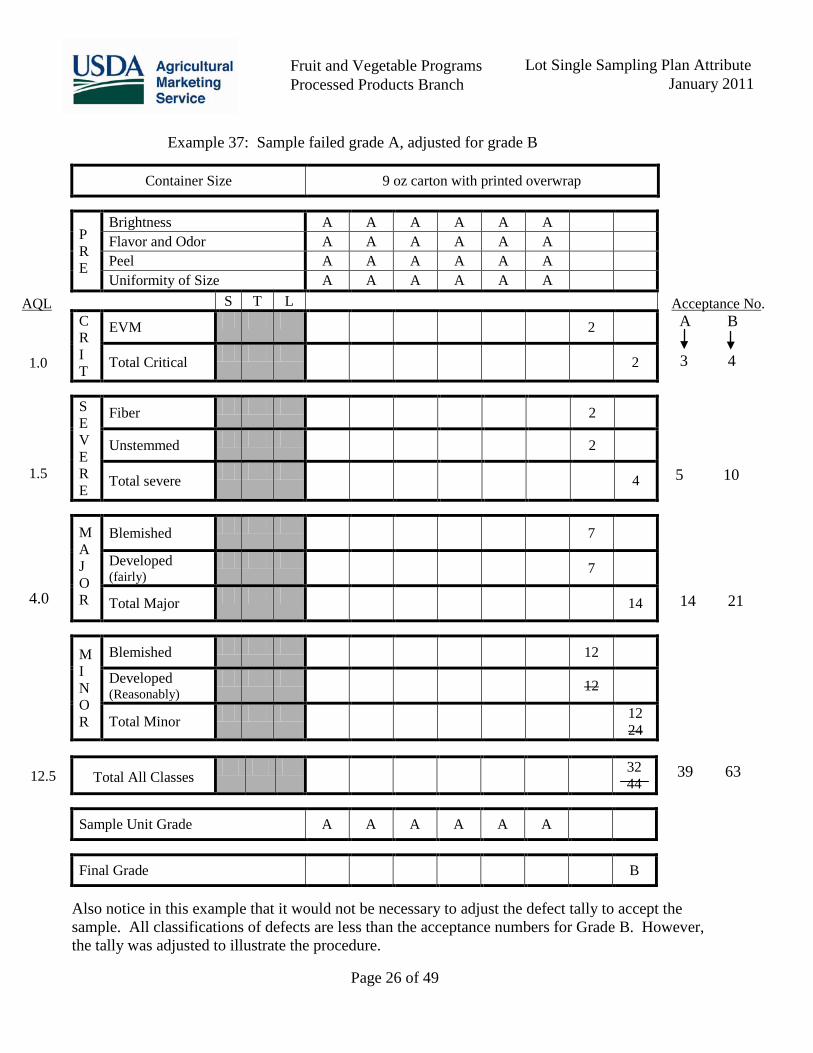
Example 37: Sample failed grade A, adjusted for grade B
Container Size 9 oz carton with printed overwrap
P R E
Brightness A A A A A A Flavor and Odor A A A A A A Peel A A A A A A Uniformity of Size A A A A A A
S T L C R I T
EVM 2
Total Critical 2
S E V E R E
Fiber 2
Unstemmed 2
Total severe 4
M A J O R
Blemished 7
Developed (fairly)
7
Total Major 14
M I N O R
Blemished 12
Developed (Reasonably)
12
Total Minor 12 24
Total All Classes 32
44
Sample Unit Grade A A A A A A
Final Grade B
Also notice in this example that it would not be necessary to adjust the defect tally to accept the sample. All classifications of defects are less than the acceptance numbers for Grade B. However, the tally was adjusted to illustrate the procedure.
AQL
1.0
1.5
4.0
12.5
Acceptance No. A B
3 4
5 10
14 21
39 63
Page 27 of 49
Fruit and Vegetable Programs Processed Products Branch
Lot Single Sampling Plan Attribute January 2011
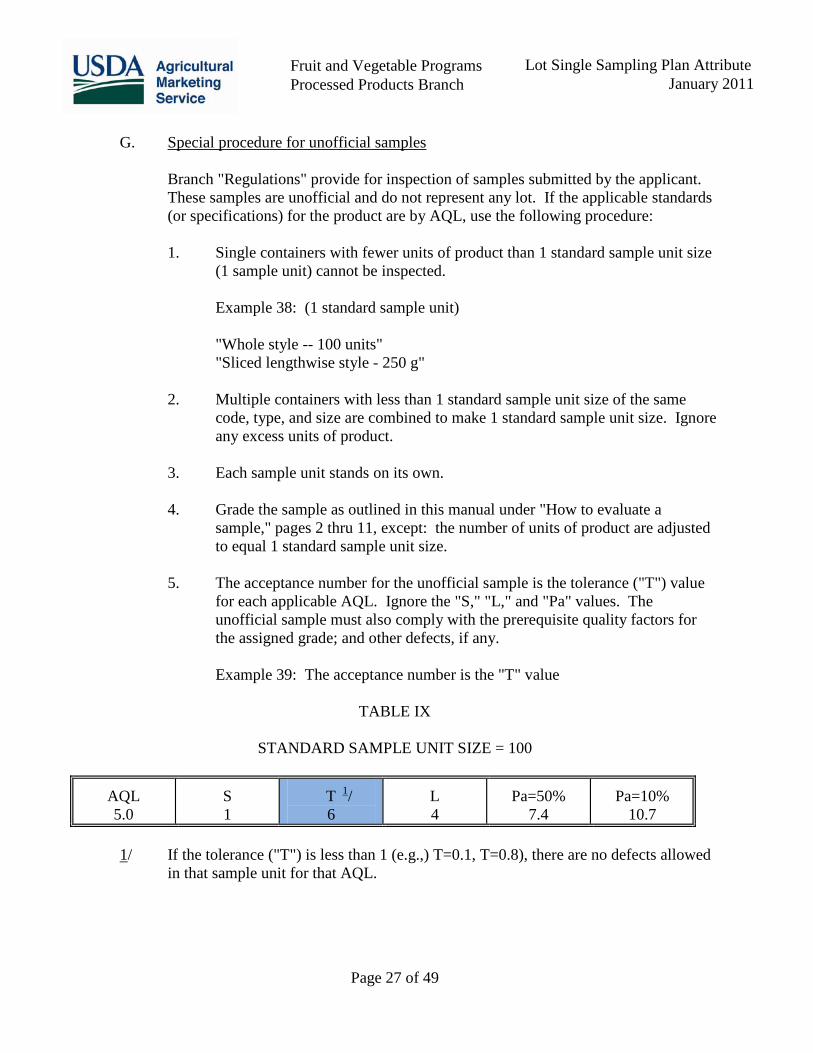
G.
Special procedure for unofficial samples
Branch "Regulations" provide for inspection of samples submitted by the applicant. These samples are unofficial and do not represent any lot. If the applicable standards (or specifications) for the product are by AQL, use the following procedure:
1. Single containers with fewer units of product than 1 standard sample unit size
(1 sample unit) cannot be inspected.
Example 38: (1 standard sample unit)
"Whole style -- 100 units" "Sliced lengthwise style - 250 g"
2. Multiple containers with less than 1 standard sample unit size of the same
code, type, and size are combined to make 1 standard sample unit size. Ignore any excess units of product.
3. Each sample unit stands on its own.
4. Grade the sample as outlined in this manual under "How to evaluate a
sample," pages 2 thru 11, except: the number of units of product are adjusted to equal 1 standard sample unit size.
5. The acceptance number for the unofficial sample is the tolerance ("T") value
for each applicable AQL. Ignore the "S," "L," and "Pa" values. The unofficial sample must also comply with the prerequisite quality factors for the assigned grade; and other defects, if any.
Example 39: The acceptance number is the "T" value
TABLE IX
STANDARD SAMPLE UNIT SIZE = 100
AQL 5.0
S 1
T 1/ 6
L 4
Pa=50% 7.4
Pa=10% 10.7
1/ If the tolerance ("T") is less than 1 (e.g.,) T=0.1, T=0.8), there are no defects allowed
in that sample unit for that AQL.

Page 28 of 49
Fruit and Vegetable Programs Processed Products Branch
Lot Single Sampling Plan Attribute January 2011
Example 40: Tally of 4 unofficial samples
Container Code C49 E14 M02 R25
P R E
Brightness A A B A Flavor and Odor A A A A Grit or Silt A A A A
S T L C R I T I C A L
HEM 1
Total Critical 0 1 0 0
CUSUM
A 0.3 0.1 0.9
B 0 1 1
C 1 2 2
S E V E R E
Fiber Blemished 1 1 1 Total Severe 1 1 0 1
CUSUM A 0.5 1.5 2.0 B 1 3 3 C 1 5 3
M I N O R
Blemished 1 1 2 5 Devel. (reasonably) 1 1 2 5 Total Minor 2 2 4 10 5
CUSUM A 1 8 4 5 6 6 13 8 B 2 14 7 C 3 22 9
Sample Unit Grade A B B B
Final Grade A
M A J O R
Blemished 1 1 1 1 Developed (poorly) 1 1 1 1 Total Major 2 2 2 2
CUSUM A 1 3 3 B 1 5 3 C 1 8 4

Page 29 of 49
Fruit and Vegetable Programs Processed Products Branch
Lot Single Sampling Plan Attribute January 2011
H.
Determining non-quality factors and prerequisite factors when multi-containers are drawn to equal "one sample unit."
It may be necessary to open more containers than the "number of sample units" to reach the required sample size (number of units of product). This situation could be encountered during inspection of small containers (e.g., 8-ounce, No. 300 or No. 303) or when assembling a "standard sample unit size" for unofficial samples. It is intended that only the "sample unit size" be inspected and recorded on the defect tally for non-quality factors and prerequisite factors, except, when it is obvious that some containers deviate excessively from the sample as a whole. You may do the following:
1. Predetermine at random the number of containers in the sample to inspect and
record for non-quality and prerequisite factors that would be equal to the "sample unit size."
2. Make the determination and record the non-quality and prerequisite factors.
3. If upon examination of the other containers it's apparent that some containers
deviate from the sample as a whole, you may reconsider the examination (e.g., one of the containers not in the predetermined number to check for non-quality factors is obviously "slack filled.")
4. Follow Branch guidelines and other instructions which cover the deviation in
question if you reconsider the examination.

Page 30 of 49
Fruit and Vegetable Programs Processed Products Branch
Lot Single Sampling Plan Attribute January 2011
Example 41: 8-ounce cans -- sample unit size = 6
1 2 3 4 5 6 7 8 9 10 11 12 13
Container Code AB DE GH MN RS VW Net Weight (grams) 455 454 452 456 455 454 Vacuum 3 4 3 3 4 4 Drained Weight (grams) 297 283 289 269 297 286 Sirup (degrees Brix) 20 20 21 21 19 20 Designation Heavy Style Halves Count 7 6 6 7 6 7
P R E
Brightness A A A A A B Flavor and Odor A A A A A A Uniformity of Size A A A A A A Character A A A A A A
S T L C R I T
HEM
Total Critical
1

Page 31 of 49
Fruit and Vegetable Programs Processed Products Branch
Lot Single Sampling Plan Attribute January 2011
Example 42: 4 No. 2-1/2 Cans -- unofficial samples 1 2 3 4 = 25 Halves
Container Code AB Net Weight (grams) 458 Vacuum 10 Drained Weight (grams) 298 Sirup (degrees Brix) 20 Designation Heavy Style Halves Count 7
P R E
Brightness A Flavor and Odor A Uniformity of Size A Character A
S T L C R I T
HEM 1
Total Critical
1
7 Halves
25 Halves

Page 32 of 49
Fruit and Vegetable Programs Processed Products Branch
Lot Single Sampling Plan Attribute January 2011
I.
Mixed quality inspection lots
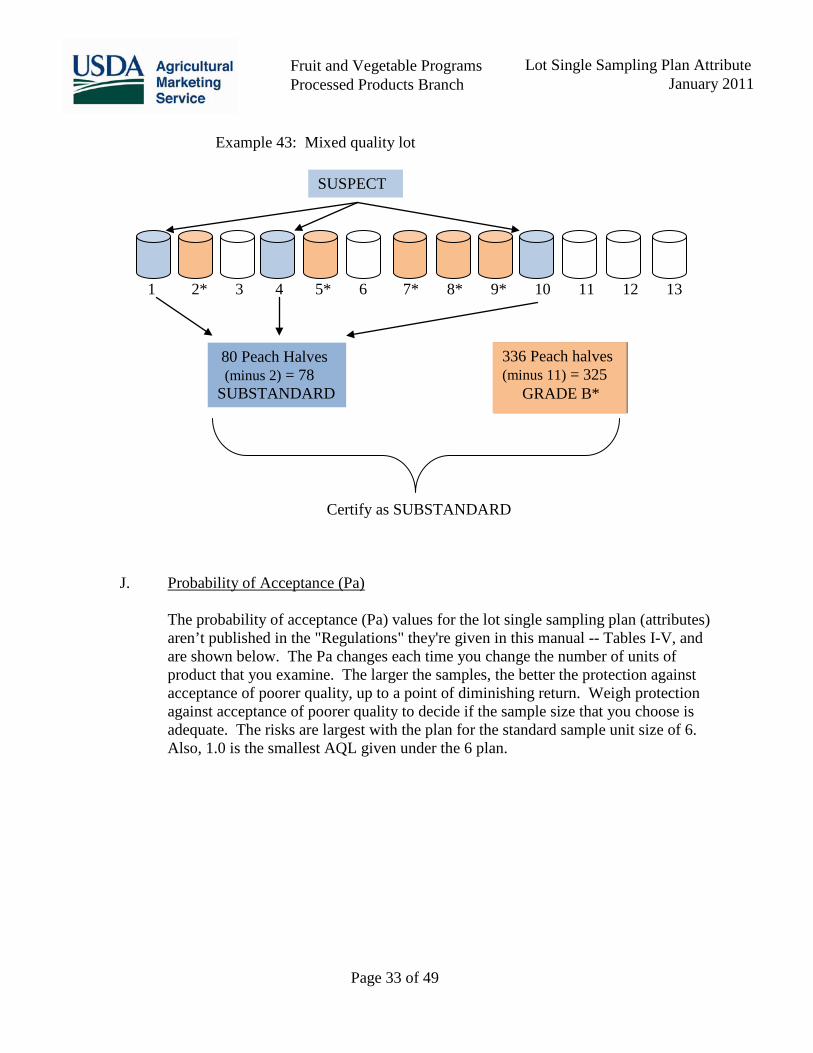
Occasionally, an inspection lot may be encountered with individual sample units in the sample which seem to be of lower quality than the sample as a whole. These "suspect" sample units may or may not be attributed to sample variation. The most obvious question to be answered is: Has lower quality production been intentionally or unintentionally mixed in to the inspection lot? Even though a lot has been intentionally mixed, we may not find a container of lower quality product when we draw the sample -- our acceptance sampling rate is very lot. Thus, lower quality product could get by undetected.
If you do encounter an inspection lot which is obviously mixed quality, do the following:
1. Assemble the largest number of units of product possible from the "suspect"
containers, regardless of code. You must have at least 36 units of product. 1/
2. Perform a regular lot attributes inspection of the "suspect" product.
3. Compare the number of defects (or defectives) that you've found in the "suspect" sample to the acceptance number for each AQL and grade level in the standards.
4. Assemble the largest number of units of product possible from the remainder
of the sample, regardless of code (the containers that aren't "suspect").
5. Compare the number of defects (or defectives) that you've found in the sample to the acceptance number for each AQL and grade level in the standards.
1/ This procedure may be impossible with small cans such as No. 300,
No. 303 and No. 2-1/2 -- less than 36 units. However, if the lot is accessible for sampling, a re-sampling could be made to get at least 36 units of the "suspect" product.
6. Compare the results (the grade assigned) of the "suspect" units of product to
the results (the grade assigned) of the "non-suspect" sample. If the grade of the "suspect" sample is more than one grade below the grade of the "non-suspect" sample, the sample may be certified to the lowest grade. If the applicant requests certification of the "non-suspect" portion of the sample, resample the lot in accordance with the Regulations, 7 CFR52§52.2, "Lot" (a).
These procedures for handling "suspect" containers must be used with discretion. Don't be overly critical. Allowance must be made for sample variability; thus, only containers much worse than the other containers in the sample should be considered for this procedure.
Page 33 of 49
Fruit and Vegetable Programs Processed Products Branch
Lot Single Sampling Plan Attribute January 2011
Example 43: Mixed quality lot
1 2* 3 4 5* 6 7* 8* 9* 10 11 12 13
Certify as SUBSTANDARD J.
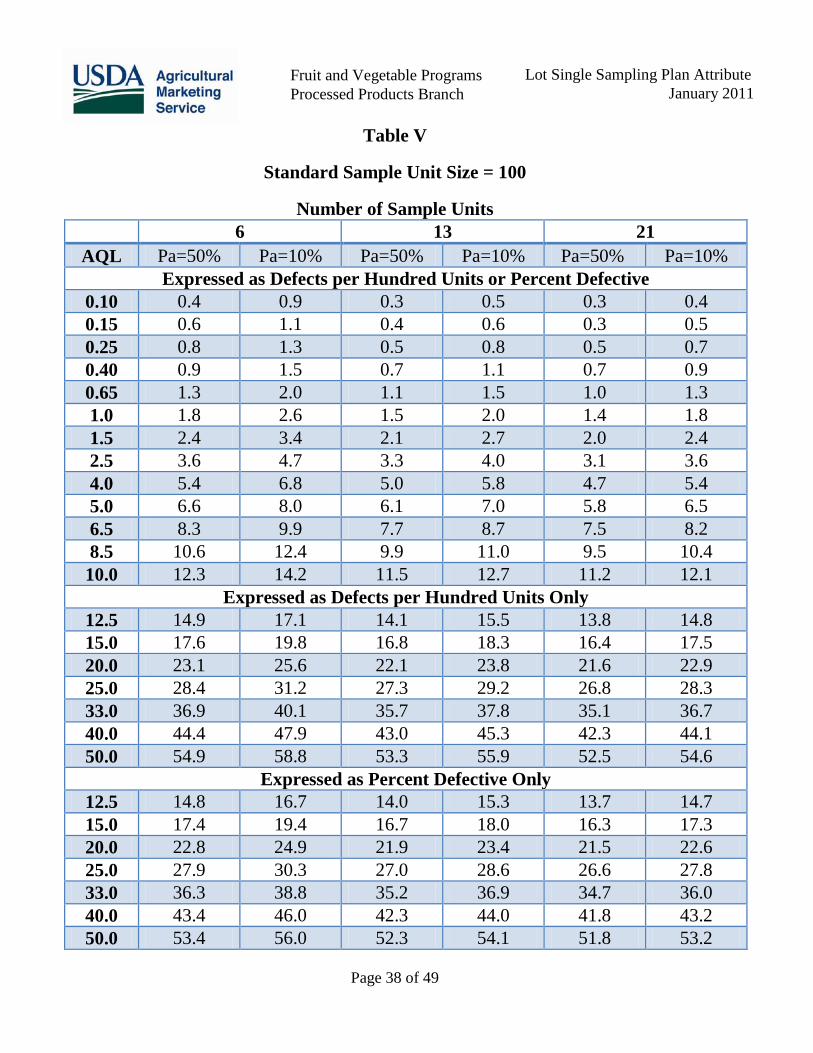
Probability of Acceptance (Pa)
The probability of acceptance (Pa) values for the lot single sampling plan (attributes) aren’t published in the "Regulations" they're given in this manual -- Tables I-V, and are shown below. The Pa changes each time you change the number of units of product that you examine. The larger the samples, the better the protection against acceptance of poorer quality, up to a point of diminishing return. Weigh protection against acceptance of poorer quality to decide if the sample size that you choose is adequate. The risks are largest with the plan for the standard sample unit size of 6. Also, 1.0 is the smallest AQL given under the 6 plan.
SUSPECT
80 Peach Halves (minus 2) = 78 SUBSTANDARD
336 Peach halves (minus 11) = 325 GRADE B*

Page 34 of 49
Fruit and Vegetable Programs Processed Products Branch
Lot Single Sampling Plan Attribute January 2011
Table I
Standard Sample Unit Size = 6
Number of Sample Units
6 13 21 29 AQL Pa=50% Pa=10% Pa=50% Pa=10% Pa=50% Pa=10% Pa=50% Pa=10%
Expressed as Defects per Hundred Units or Percent Defective 1.0 4.7 10.8 3.4 6.8 2.9 5.3 2.6 4.6 1.5 4.7 10.8 4.7 8.6 3.7 6.3 3.3 5.3 2.5 10.2 18.6 6.0 10.2 5.3 8.4 5.0 7.5 4.0 13.0 22.2 8.6 13.5 7.7 11.3 6.7 9.5 5.0 13.0 22.2 9.8 15.1 9.3 13.2 8.4 11.6 6.5 15.8 25.8 12.4 18.2 10.8 15.0 10.2 13.6 8.5 18.5 29.3 15.0 21.3 13.2 17.8 12.5 16.2 10.0 21.3 32.7 16.2 22.8 15.6 20.6 14.2 18.2
Expressed as Defects per Hundred Units Only 12.5 24.1 36.1 20.1 27.3 18.0 23.3 17.1 21.4 15.0 26.9 39.5 22.7 30.3 21.2 26.9 20.5 25.2 20.0 35.2 49.4 29.1 37.6 26.7 33.1 25.7 30.9 25.0 40.7 55.9 35.5 44.8 33.1 40.1 31.4 37.2 33.0 51.9 68.8 44.4 54.8 41.8 49.6 40.6 47.1 40.0 60.2 78.3 52.1 63.3 49.7 58.2 48.1 55.1 50.0 71.3 90.9 63.7 76.0 60.8 70.2 58.9 66.4 65.0 88.0 109.5 80.3 94.1 77.5 88.0 75.6 84.0 85.0 113.0 137.2 103.4 118.9 98.8 110.2 96.8 106.4
100.0 129.6 155.5 118.8 146.2 114.7 126.9 112.9 123.3 150.0 185.2 215.8 173.7 192.9 168.7 183.5 165.8 178.3 250.0 293.1 329.6 280.1 304.4 273.4 292.3 269.8 285.8
Expressed as Percent Defective Only 12.5 23.9 33.6 20.0 26.2 17.9 22.6 17.0 20.9 15.0 26.6 36.6 22.6 28.9 20.3 25.1 19.9 23.9 20.0 32.1 42.4 27.7 34.4 26.7 31.9 25.1 29.4 25.0 37.6 48.1 34.0 41.1 31.4 36.8 30.8 35.4 33.0 45.9 56.4 41.7 48.9 40.1 45.7 38.8 43.6 40.0 54.1 64.4 49.4 56.6 47.2 52.9 46.3 51.1 50.0 65.1 74.7 59.6 66.5 57.5 63.1 56.6 61.4

Page 35 of 49
Fruit and Vegetable Programs Processed Products Branch
Lot Single Sampling Plan Attribute January 2011
Table II
Standard Sample Unit Size = 13
Number of Sample Units
6 13 21 29 AQL Pa=50% Pa=10% Pa=50% Pa=10% Pa=50% Pa=10% Pa=50% Pa=10%
Expressed as Defects per Hundred Units or Percent Defective 0.65 2.2 5.0 2.2 4.0 1.7 2.9 1.5 2.5 1.0 3.4 6.8 2.8 4.7 2.4 3.9 2.0 3.1 1.5 4.7 8.6 3.4 5.5 3.2 4.8 2.8 4.1 2.5 6.0 10.2 5.1 7.7 4.3 6.1 4.2 5.6 4.0 8.6 13.5 6.9 9.8 6.1 8.2 6.0 7.8 5.0 9.8 15.1 8.1 11.2 7.6 9.9 7.1 9.0 6.5 12.4 18.2 10.5 14.0 9.4 12.0 8.9 11.0 8.5 15.0 21.3 12.8 16.7 11.6 14.4 11.1 13.4 10.0 16.2 22.8 14.6 18.7 13.4 16.5 12.9 15.4
Expressed as Defects per Hundred Units Only 12.5 20.1 27.3 17.6 22.0 16.4 19.7 15.6 18.3 15.0 22.7 30.3 20.5 25.3 18.9 22.5 18.5 21.5 20.0 29.1 37.6 25.8 31.2 24.8 28.8 24.0 27.4 25.0 35.5 44.8 31.8 37.6 30.3 34.7 29.3 32.9 33.0 44.4 54.8 40.6 47.2 39.0 43.9 38.1 42.1 40.0 52.1 63.3 48.3 55.5 46.3 51.6 45.5 49.9 50.0 63.7 76.0 59.0 66.9 57.3 63.2 56.1 61.0 65.0 80.3 94.1 75.4 84.0 73.1 79.7 72.0 77.6 85.0 103.4 118.9 96.7 106.4 94.3 101.9 93.0 99.3 100.0 118.8 146.2 112.7 123.2 110.1 118.2 108.6 115.5
Expressed as Percent Defective Only 12.5 20.0 26.2 16.9 20.8 16.0 18.9 15.5 18.0 15.0 22.6 28.9 19.9 24.0 18.9 22.1 18.2 20.8 20.0 27.7 34.4 25.2 29.6 24.0 27.4 23.5 26.4 25.0 34.0 41.1 30.5 35.2 29.5 33.1 28.8 31.8 33.0 41.7 48.9 39.4 44.2 37.9 41.7 37.0 40.2 40.0 49.4 56.6 46.5 51.4 45.2 49.1 44.2 47.4 50.0 59.6 66.5 56.5 61.3 55.1 59.0 54.2 57.5

Page 36 of 49
Fruit and Vegetable Programs Processed Products Branch
Lot Single Sampling Plan Attribute January 2011
Table III
Standard Sample unit Size = 25
Number of Sample units
6 13 21 29 AQL Pa=50% Pa=10% Pa=50% Pa=10% Pa=50% Pa=10% Pa=50% Pa=10%
Expressed as Defects per Hundred Units or Percent Defective 0.40 1.8 3.5 1.1 2.1 1.1 1.8 0.9 1.5 0.65 2.4 4.5 1.7 2.9 1.5 2.2 1.2 1.8 1.0 3.1 5.3 2.1 3.2 1.8 2.7 1.7 2.5 1.5 3.8 6.2 3.0 4.4 2.6 3.6 2.3 3.1 2.5 5.1 7.8 4.2 5.8 3.7 4.9 3.5 4.5 4.0 7.1 10.3 6.1 8.0 5.7 7.1 5.3 6.5 5.0 8.4 11.9 7.3 9.4 6.8 8.4 6.4 7.7 6.5 10.4 14.2 9.1 11.4 8.5 10.2 8.1 9.5 8.5 13.1 17.3 11.3 13.8 10.8 12.7 10.3 11.9 10.0 14.4 18.8 13.1 15.9 12.3 14.4 12.0 13.7
Expressed as Defects per Hundred Units Only 12.5 17.8 22.6 15.9 18.9 15.2 17.5 14.7 16.5 15.0 20.4 25.5 18.7 21.9 17.8 20.3 17.4 19.4 20.0 26.4 32.2 24.2 27.9 23.3 26.0 22.8 25.1 25.0 32.4 38.8 29.7 33.8 28.7 31.7 28.1 30.6 33.0 41.1 48.2 38.3 42.7 37.2 40.7 36.6 39.5 40.0 49.1 56.8 46.0 50.8 44.7 48.4 43.9 47.1 50.0 59.8 68.2 56.5 61.8 55.1 59.3 54.4 57.9 65.0 76.3 85.5 72.5 78.5 71.0 75.7 70.0 74.0
Expressed as Percent Defective Only 12.5 17.1 21.2 15.6 18.3 15.0 17.0 14.6 16.2 15.0 20.4 24.8 18.3 21.2 17.6 19.8 17.3 19.1 20.0 25.7 30.4 23.9 27.0 23.0 25.3 22.6 24.5 25.0 31.0 36.0 29.1 32.4 28.3 30.8 27.7 29.8 33.0 39.7 44.9 37.4 40.8 36.5 39.2 35.9 38.2 40.0 47.0 52.2 44.8 48.3 43.5 46.3 43.1 45.5 50.0 57.0 62.1 54.6 58.2 53.6 56.4 53.2 55.5

Page 37 of 49
Fruit and Vegetable Programs Processed Products Branch
Lot Single Sampling Plan Attribute January 2011
Table IV
Standard Sample Unit Size = 50
Number of Sample Units
6 13 21 29 AQL Pa=50% Pa=10% Pa=50% Pa=10% Pa=50% Pa=10% Pa=50% Pa=10%
Expressed as Defects per Hundred Units or Percent Defective 0.15 0.6 1.3 0.6 1.0 0.4 0.8 0.4 0.6 0.25 0.9 1.8 0.7 1.2 0.5 0.9 0.5 0.8 0.40 1.2 2.2 0.9 1.4 0.8 1.2 0.7 1.1 0.65 1.6 2.7 1.3 2.0 1.1 1.6 1.1 1.5 1.0 2.2 3.5 1.8 2.6 1.6 2.1 1.5 1.9 1.5 2.9 4.3 2.4 3.3 2.2 2.8 2.0 2.6 2.5 4.2 5.9 3.6 4.7 3.4 4.2 3.2 3.9 4.0 6.2 8.3 5.3 6.6 5.1 6.1 4.9 5.7 5.0 7.2 9.4 6.6 7.9 6.2 7.2 6.0 6.8 6.5 9.2 11.7 8.3 9.8 7.9 9.0 7.6 8.6 8.5 11.6 14.3 10.4 12.1 10.0 11.3 9.8 10.9
10.0 13.2 16.1 12.1 13.9 11.7 13.0 11.4 12.6 Expressed as Defects per Hundred Units Only
12.5 16.2 19.4 14.9 16.9 14.3 15.8 14.0 15.3 15.0 18.9 22.3 17.6 19.7 17.0 18.6 16.7 18.1 20.0 24.6 28.4 23.0 25.4 22.3 34.2 22.0 23.5 25.0 29.9 34.1 28.2 30.9 27.6 29.6 27.2 29.0 33.0 38.5 43.1 36.8 39.9 36.0 38.3 35.5 37.5 40.0 46.2 51.2 44.2 47.6 43.3 45.9 42.8 45.0 50.0 56.8 62.4 54.7 58.4 53.7 56.6 53.1 55.5
Expressed as Percent Defective Only 12.5 15.9 18.7 14.7 16.7 14.2 15.6 14.0 15.1 15.0 18.5 21.5 17.3 19.2 16.9 18.4 16.6 17.8 20.0 23.9 27.1 22.7 24.8 22.0 23.7 21.8 23.1 25.0 29.2 32.6 27.9 30.2 27.3 29.0 26.9 28.4 33.0 37.5 41.1 36.1 38.5 35.5 37.4 35.1 36.7 40.0 44.8 48.5 43.3 45.8 42.5 44.5 42.2 43.8 50.0 54.8 58.5 53.3 55.8 52.6 54.6 52.2 53.9
Page 38 of 49
Fruit and Vegetable Programs Processed Products Branch
Lot Single Sampling Plan Attribute January 2011
Table V
Standard Sample Unit Size = 100
Number of Sample Units 6 13 21
AQL Pa=50% Pa=10% Pa=50% Pa=10% Pa=50% Pa=10% Expressed as Defects per Hundred Units or Percent Defective
0.10 0.4 0.9 0.3 0.5 0.3 0.4 0.15 0.6 1.1 0.4 0.6 0.3 0.5 0.25 0.8 1.3 0.5 0.8 0.5 0.7 0.40 0.9 1.5 0.7 1.1 0.7 0.9 0.65 1.3 2.0 1.1 1.5 1.0 1.3 1.0 1.8 2.6 1.5 2.0 1.4 1.8 1.5 2.4 3.4 2.1 2.7 2.0 2.4 2.5 3.6 4.7 3.3 4.0 3.1 3.6 4.0 5.4 6.8 5.0 5.8 4.7 5.4 5.0 6.6 8.0 6.1 7.0 5.8 6.5 6.5 8.3 9.9 7.7 8.7 7.5 8.2 8.5 10.6 12.4 9.9 11.0 9.5 10.4 10.0 12.3 14.2 11.5 12.7 11.2 12.1
Expressed as Defects per Hundred Units Only 12.5 14.9 17.1 14.1 15.5 13.8 14.8 15.0 17.6 19.8 16.8 18.3 16.4 17.5 20.0 23.1 25.6 22.1 23.8 21.6 22.9 25.0 28.4 31.2 27.3 29.2 26.8 28.3 33.0 36.9 40.1 35.7 37.8 35.1 36.7 40.0 44.4 47.9 43.0 45.3 42.3 44.1 50.0 54.9 58.8 53.3 55.9 52.5 54.6
Expressed as Percent Defective Only 12.5 14.8 16.7 14.0 15.3 13.7 14.7 15.0 17.4 19.4 16.7 18.0 16.3 17.3 20.0 22.8 24.9 21.9 23.4 21.5 22.6 25.0 27.9 30.3 27.0 28.6 26.6 27.8 33.0 36.3 38.8 35.2 36.9 34.7 36.0 40.0 43.4 46.0 42.3 44.0 41.8 43.2 50.0 53.4 56.0 52.3 54.1 51.8 53.2

Page 39 of 49
Fruit and Vegetable Programs Processed Products Branch
Lot Single Sampling Plan Attribute January 2011
Example 44: Relationship of Pa to the OC Curve
Table I
Standard Sample Unit Size = 6
6 13 AQL Pa = 50% Pa = 10% Pa = 50% Pa = 10% 1.0 4.7 10.8 3.4 6.8 2.5 10.2 18.6 6.0 10.2 8.5 18,5 29.3 15.0 21.3
Table V
Standard Sample Size = 100
6 13 AQL Pa = 50% Pa = 10% Pa = 50% Pa = 10% 1.0 1.8 2.6 1.5 2.0 2.5 3.6 4.7 3.3 4.0 8.5 10.6 12.4 9.9 11.0
Defects per Hundred Units or Percent Defective
C h a n c e o f P a s s i n g

Page 40 of 49
Fruit and Vegetable Programs Processed Products Branch
Lot Single Sampling Plan Attribute January 2011
The probability of acceptance (Pa) values take on a new meaning if they are compared to the AQL's in the U.S. standards. However, all defects found in the sample must be equally offending against each grade level. Do not use the reasoning of example 45 shown below if any of the defects are adjusted See Adjusting The Defect Tally on pages 24 and 25.
Example 45: Relationship of Pa to specific AQL's
GRADE A GRADE B GRADE C Total 1/ Maj Sev Crit Total 1/ Maj Sev Crit Total 1/ Maj Sev Crit AQL 12.5 4.0 1.5 1.0 20.0 6.5 4.0 1.5 25.0 10.0 6.5 2.5
Table II
Standard Sample Size = 13
6 13 21 AQL Pa = 50% Pa = 10% Pa = 50% Pa = 10% Pa = 50% Pa = 10% 12.5 20.1 27.3 17.6 22.0 16.4 19.7
Defects per Hundred Units or Percent Defective
C h a n c o f P a s s i n g
50%Chance of Passing Grade B
10% Chance of Passing Substandard
Interpretation: Using 78 units of product, 13 X 6 = 78, there is a 50/50 chance of passing a grade B lot for Grade A and a 10 % chance of passing a Substandard lot for grade A.
Page 41 of 49
Fruit and Vegetable Programs Processed Products Branch
Lot Single Sampling Plan Attribute January 2011
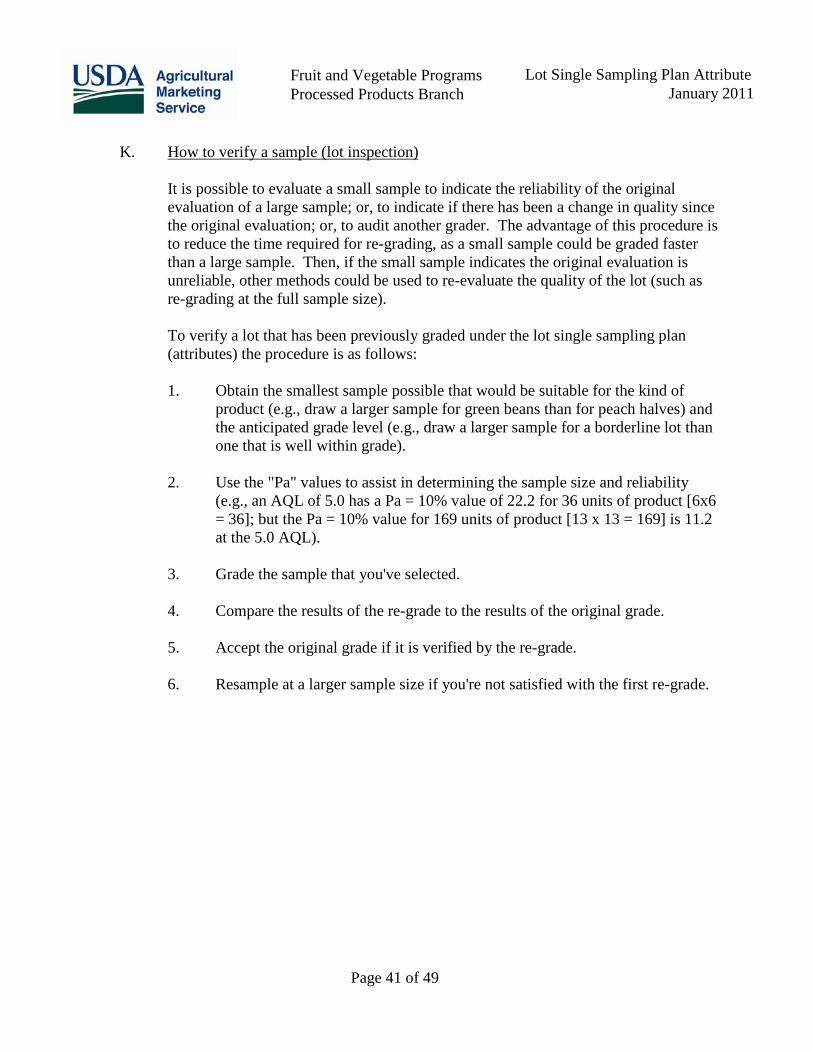
K.
How to verify a sample (lot inspection)
It is possible to evaluate a small sample to indicate the reliability of the original evaluation of a large sample; or, to indicate if there has been a change in quality since the original evaluation; or, to audit another grader. The advantage of this procedure is to reduce the time required for re-grading, as a small sample could be graded faster than a large sample. Then, if the small sample indicates the original evaluation is unreliable, other methods could be used to re-evaluate the quality of the lot (such as re-grading at the full sample size).
To verify a lot that has been previously graded under the lot single sampling plan (attributes) the procedure is as follows:
1. Obtain the smallest sample possible that would be suitable for the kind of
product (e.g., draw a larger sample for green beans than for peach halves) and the anticipated grade level (e.g., draw a larger sample for a borderline lot than one that is well within grade).
2. Use the "Pa" values to assist in determining the sample size and reliability
(e.g., an AQL of 5.0 has a Pa = 10% value of 22.2 for 36 units of product [6x6 = 36]; but the Pa = 10% value for 169 units of product [13 x 13 = 169] is 11.2 at the 5.0 AQL).
3. Grade the sample that you've selected.
4. Compare the results of the re-grade to the results of the original grade.
5. Accept the original grade if it is verified by the re-grade.
6. Resample at a larger sample size if you're not satisfied with the first re-grade.

Page 42 of 49
Fruit and Vegetable Programs Processed Products Branch
Lot Single Sampling Plan Attribute January 2011
Optional Lot Inspection Procedures Using U.S. Standards for Grades (Attributes only) Outline
A. Determine sampling rate. B. Draw sample.
C. Evaluate individual containers for:
1. Non Quality factors
2. Subjective Prerequisite factors
D. Determine the amount of product to be evaluated for:
1. Objective Prerequisite factors
2. Classified factors
E. Evaluate the sample for:
1. Objective Prerequisite factors
2. Classified factors
F. Obtain applicable AQL's from the U.S. Standard.
G. Determine Acceptance Numbers from the Regulations or attached Table I.
H. Determine the grade for each classification.
I. Determine the final grade for the lot.

Page 43 of 49
Fruit and Vegetable Programs Processed Products Branch
Lot Single Sampling Plan Attribute January 2011
Procedures - Lot Inspection by Attributes
Step 1. Determine the sampling rate from CFR 52, §52.38c of Regulations Governing Inspection and Certification of Processed Fruits and Vegetables and Related Products.
Step 2. Draw the number of containers required to meet the prescribed sampling rate.
Note: Be sure you have drawn enough containers to produce at least 36 units of product.
Units may be by count or by weight. See applicable style in the U.S. Standard for the product that is being inspected.
Step 3. Begin the inspection by performing the examination of non-quality (net weight vacuum, etc.) factors and subjective prerequisites (usually similar varietal characteristics, flavor and odor, and brightness or appearance) on a number of containers at least equal to the sampling rate.
Step 4. Determine the amount of product to be used. Add all of the units of product together
(units of count or weight). Simply count all of the units (halves, slices, etc.) where count is the criteria but units of weight must be calculated as follows:
(Wd ) (28.3495)
Ug = unitst
Where:
Wd = Total of all the drained weights of the sample in ounces.
Ug = Weight of an individual unit expressed in grams. 28.3495 = Number of grams in one ounce.
Unitst = Total number of Units in sample
The following example is for six No. 10 cans of Diced Peaches which have the following drained weights: 73.5 oz. 71.9 74.7 72.8 73.9
441.0 oz. 74.2
8 = 1562.77 units 441.0 x 28.3495

Page 44 of 49
Fruit and Vegetable Programs Processed Products Branch
Lot Single Sampling Plan Attribute January 2011
From the below table - adjusted to 8 g increments, the largest number of units less than 1562.77 units is 1450
. This is the amount of product to be used for inspection. It would be 1450 units = 11,600 g = 409.2 oz. You may derive this 409.2 oz. of product two different acceptable ways.
Number of Samples 6 13 21 29 Total Weight of Diced1/
6 36 x 8 g = 288 g or 10.2 oz.
78 x 8 g = 624 g or 22 oz
126 x 8 g = 1008 g or 35.6 oz
174 x 8 g = 1392 g or 49.1 oz
13 78 x 8 g = 624 g or 22 oz
169 x 8 g = 1352 g or 47.7 oz
273 x 8 g = 2184 g or 77 oz
377 x 8 g = 3016 g or 98.7 oz
25 150 x 8 g = 1200 g or 42.3 oz
325 x 8 g = 2600 g or 91.7 oz
525 x 8 g = 4200 g or 148.2 oz
725 x 8 g = 5800 g or 204.6 oz
50 300 x 8 g =
2400 g or 84.7 oz 650 x 8 g =
5200 g or 183.4 oz 1050 x 8 g =
8400 g or 296.3 oz 1450
11600 g or 409.2 oz x 8 g =
100 600 x 8 g = 4800 g or 169.3 oz
1300 x 8 g = 10400 g or 366.8 oz
2100 x 8 g = 16800 g or 592.6 oz
2900 x 8 g = 23200 g or 818.4 oz
1/ Sample size = 8 g increments = weight of diced peaches equivalent to the
number of sample units = the standard sample unit size.
The two acceptable ways to arrive at the required amount of product :
1. Use all of the drained product in the first five cans (total the individual
drained weights from each can) plus select the balance of the total amount required from the sixth can.
2. Select equal amounts from each can. ( This method requires evaluating the balance of each can for foreign material.)
Step 5. Evaluate the product as to the objective prerequisites (pit frags, loose seeds, decay,
character, etc.) and the classified defects and record in the applicable section of the tally sheet.
There are several correct ways to handle the summation of the defects. The following options may be used:
1. Mass of the product together, remove the defects and record on the tally sheet;
or
Standard Sample
Unit Sizes
Page 45 of 49
Fruit and Vegetable Programs Processed Products Branch
Lot Single Sampling Plan Attribute January 2011
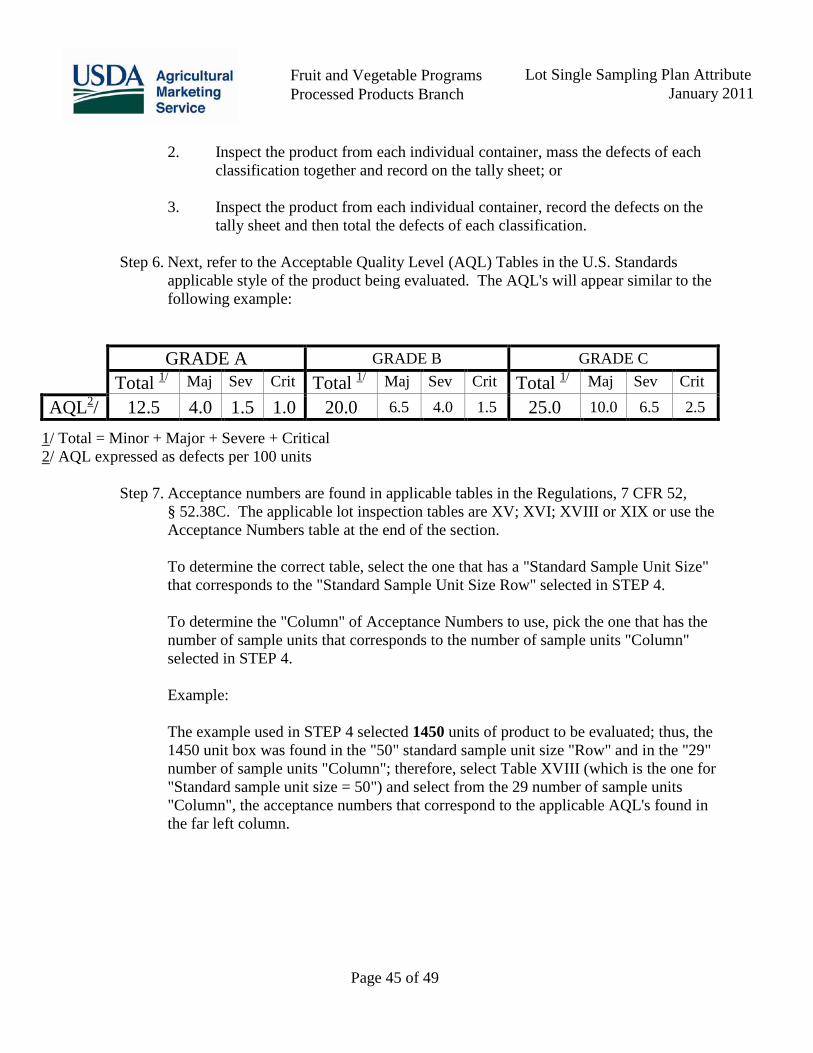
2. Inspect the product from each individual container, mass the defects of each
classification together and record on the tally sheet; or
3. Inspect the product from each individual container, record the defects on the tally sheet and then total the defects of each classification.
Step 6. Next, refer to the Acceptable Quality Level (AQL) Tables in the U.S. Standards
applicable style of the product being evaluated. The AQL's will appear similar to the following example:
GRADE A GRADE B GRADE C Total 1/ Maj Sev Crit Total 1/ Maj Sev Crit Total 1/ Maj Sev Crit
AQL2/ 12.5 4.0 1.5 1.0 20.0 6.5 4.0 1.5 25.0 10.0 6.5 2.5
1/ Total = Minor + Major + Severe + Critical 2/ AQL expressed as defects per 100 units
Step 7. Acceptance numbers are found in applicable tables in the Regulations, 7 CFR 52,
§ 52.38C. The applicable lot inspection tables are XV; XVI; XVIII or XIX or use the Acceptance Numbers table at the end of the section.
To determine the correct table, select the one that has a "Standard Sample Unit Size" that corresponds to the "Standard Sample Unit Size Row" selected in STEP 4.
To determine the "Column" of Acceptance Numbers to use, pick the one that has the number of sample units that corresponds to the number of sample units "Column" selected in STEP 4. Example: The example used in STEP 4 selected 1450 units of product to be evaluated; thus, the 1450 unit box was found in the "50" standard sample unit size "Row" and in the "29" number of sample units "Column"; therefore, select Table XVIII (which is the one for "Standard sample unit size = 50") and select from the 29 number of sample units "Column", the acceptance numbers that correspond to the applicable AQL's found in the far left column.

Page 46 of 49
Fruit and Vegetable Programs Processed Products Branch
Lot Single Sampling Plan Attribute January 2011
Number of Samples
6 13 21 29 Total Weight of Diced1/
6 36 x 8 g = 288 g or 10.2 oz.
78 x 8 g = 624 g or 22 oz
126 x 8 g = 1008 g or 35.6 oz
174 x 8 g = 1392 g or 49.1 oz
13 78 x 8 g = 624 g or 22 oz
169 x 8 g = 1352 g or 47.7 oz
273 x 8 g = 2184 g or 77 oz
377 x 8 g = 3016 g or 98.7 oz
25 150 x 8 g = 1200 g or 42.3 oz
325 x 8 g = 2600 g or 91.7 oz
525 x 8 g = 4200 g or 148.2 oz
725 x 8 g = 5800 g or 204.6 oz
50 300 x 8 g = 2400 g or 84.7 oz
650 x 8 g = 5200 g or 183.4 oz
1050 x 8 g = 8400 g or 296.3 oz
1450 x 8 g = 11600 g or 409.2 oz
100 600 x 8 g = 4800 g or 169.3 oz
1300 x 8 g = 10400 g or 366.8 oz
2100 x 8 g = 16800 g or 592.6 oz
2900 x 8 g = 23200 g or 818.4 oz
1/ Sample size = 8 g increments = weight of diced peaches equivalent to the
number of sample units = the standard sample unit size.
TABLE XVIII LOT SINGLE SAMPLING PLANS
STANDARD SAMPLE UNIT SIZE = 50
NUMBER OF SAMPLE UNITS 6 13 21 29
ACCEPTANCE NUMBERS QUALITY LEVELS EXPRESSED AS DEFECTS PER 100 UNITS OR PERCENT DEFECTIVE
AQL 0.15 1 3 4 5 0.25 2 4 5 7 0.40 3 5 8 10
Step 8. Compare the number of defects found in each classification with the acceptance
number applicable for that classification. Determine the grade of each classification.
Step 9. Determine the grade of the lot from the lowest grade given to any prerequisite or classification of defects.
Special Situations
A. If the sample rate and the number of units per container are such that the minimum number of units of product required to evaluate a lot is not met, then extra containers must be drawn to meet this requirement. Example:
Standard Sample Unit
Sizes
Page 47 of 49
Fruit and Vegetable Programs Processed Products Branch
Lot Single Sampling Plan Attribute January 2011
A lot of 200 cases of 24/8 oz. peach halves are to be sampled. Using Table XI in the Regulations, 7 CFR 52, § 52.38c, the lot sample size would be 6, but 6 cans would not yield 36 halves (probably 18-24 halves). Therefore, draw 2 containers from each location sampled in the lot. Mark each container with the same identifications. Evaluate the non-quality factors and subjective prerequisites on one container from each sampling and then use enough of the extra containers to make up the needed 36 units to complete the evaluation.
B. If the lot consists of large institutional size containers (i.e. No. 10 metal cans, 2-3
pound cartons, gallons, etc.), then, 3 sample units may be drawn if Inspection Aid No. 42 specifies the 3 sample unit rate. The number of product units from the 3 containers must still be equal to or greater than 36.
C. If the lot consists of containers of obvious non-uniformity, the judgment of quality
must be exercised before proceeding with evaluation. If it is obvious that the applicant is attempting to "dilute" defects by mixing poor quality with good quality, follow the instructions on pages 31 and 32. If all of the containers in the sample have the same code, then the final lot grade should be that of the obviously low quality.

Page 48 of 49
Fruit and Vegetable Programs Processed Products Branch
Lot Single Sampling Plan Attribute January 2011
Number of units
36 78 126 150 169 174 273 300 325 377 525 600 650 725 1030 1300 1450 2100 2900
ACCEPTANCE NUMBERS
AQL QUALITY LEVELS EXPRESSED AS DEFECTS PER HUNDRED UNITS OR PERCENT DEFECTIVE
0.04 0 0 0 0 0 0 0 0 0 0 0 0 1 1 1 1 2 2 3 0.065 0 0 0 0 0 0 0 0 0 0 1 1 1 1 2 2 3 3 4 0.10 0 0 0 0 0 0 1 1 1 1 1 2 2 2 3 3 4 5 6 0.15 0 0 0 0 1 1 1 1 1 2 2 3 3 3 4 4 5 6 8 0.25 0 0 1 1 1 1 2 2 2 3 3 4 4 4 5 6 7 9 12 0.40 0 1 1 2 2 3 3 3 3 4 5 5 5 6 8 9 10 13 17 0.65 0 1 2 3 3 3 4 4 5 5 7 7 8 8 11 13 15 20 26 1.0 1 2 3 4 4 4 6 6 6 7 9 10 11 12 16 19 21 29 38 1.5 1 3 4 5 5 5 8 8 9 10 13 14 15 16 22 27 29 41 54 2.5 3 4 6 7 8 8 11 12 13 15 19 21 23 25 35 42 46 64 86 4.0 4 6 9 10 11 11 16 18 19 22 29 32 34 38 53 64 70 99 134 5.0 4 7 11 12 13 14 20 21 23 26 35 39 42 46 64 78 86 122 165 6.5 5 9 13 15 17 17 25 27 29 33 44 49 53 58 82 99 110 156 211 8.5 6 11 16 19 21 21 31 34 36 41 56 63 67 74 105 128 142 200 272 10.0 7 12 19 21 24 24 36 39 42 48 64 73 78 86 122 149 165 234 318
QUALITY LEVELS EXPRESSED AS DEFECTS PER HUNDRED UNITS ONLY
12.5 8 15 22 26 29 29 44 48 51 58 79 89 96 106 150 183 203 289 394 15.0 9 17 26 30 34 35 51 56 60 69 93 105 114 126 178 218 242 344 496 20.0 12 22 33 39 43 44 67 73 78 90 122 138 149 165 234 287 318 454 620 25.0 14 27 41 48 53 54 82 89 96 110 150 170 183 203 289 355 394 563 769 33.0 18 34 52 61 68 70 106 115 124 143 195 221 239 265 377 463 514 736 1008 40.0 21 40 62 73 81 83 126 138 149 171 234 266 287 318 454 558 620 888 1216 50.0 25 49 76 89 99 102 156 170 183 211 289 329 355 394 563 692 769 1103 1513 65.0 31 62 97 114 127 131 199 218 235 271 372 423 456 507 725 892 993 1425 1956 70.0 33 67 103 122 136 140 214 234 252 291 399 454 490 545 780 960 1067 1533 2104 75.0 36 71 110 130 145 149 228 250 269 310 426 485 524 582 834 1026 1142 1640 2252 85.0 40 80 124 146 163 168 257 281 304 350 481 546 591 657 941 1159 1289 1854 2545 100.0 46 92 144 170 190 196 300 329 355 409 562 640 692 796 1103 1359 1512 2175 2988 150.0 66 135 212 250 280 288 - - - - - - - - - - - - - 250.0 105 218 344 407 456 469 - - - - - - - - - - - - -

Page 49 of 49
Fruit and Vegetable Programs Processed Products Branch
Lot Single Sampling Plan Attribute January 2011
ACCEPTANCE NUMBERS
(Continued from previous page) Number of units
36
78
126
150
169
174
273
300
325
377
525
600
650
725
1030
1300
1450
2100
2900
AQL QUALITY LEVELS EXPRESSED AS PERCENT DEFECTIVE ONLY
12.5 8 15 22 25 28 29 43 47 50 58 78 88 95 105 149 182 202 287 392 15.0 9 17 25 30 33 34 51 55 59 68 92 104 112 125 177 216 240 342 467 20.0 11 21 33 38 42 43 65 71 77 88 120 136 147 163 231 284 315 450 615 25.0 13 26 39 46 51 53 80 87 94 108 148 167 181 200 286 351 390 558 763 33.0 16 32 50 59 66 67 103 112 121 139 191 217 234 260 372 457 508 728 999 40.0 19 38 59 70 78 80 123 134 145 166 228 260 281 312 446 549 611 877 1203 50.0 23 46 72 85 95 98 150 164 177 204 281 320 346 385 552 680 756 1088 1494 65.0 28 57 70 107 120 123 190 209 225 260 359 409 443 492 708 873 972 1401 1927 70.0 29 61 96 114 128 132 204 223 241 279 385 438 474 528 759 937 1044 1505 2071 75.0 31 64 102 121 136 140 217 237 257 297 410 467 506 563 811 1001 1115 1608 2213 85.0 34 71 114 135 151 156 242 265 287 332 400 524 567 632 1912 1126 1255 1812 2497