Embed Size (px)
Citation preview

Equity
Research
L O S A N G E L E S | S A N F R A N C I S C O | N E W Y O R K | B O S T O N | S E A T T L E | M I N N E A P O L I S | D A L L A S
Wedbush Securities does and seeks to do business with companies covered in its research reports. Thus, investors should be aware that the firm may have a conflict of interest that could affect the objectivity of this report. Investors should consider this report as only a single factor in making their investment decision. Please see page 10 of this report for analyst certification and important disclosure information.
Internet and E-Commerce
January 26, 2012 Price
$95.04 Rating
UNDERPERFORM 12-Month Price Target
$45
Michael Pachter (213) 688-4474 [email protected] Nick McKay (213) 688-4343 [email protected] Alicia Jenks (212) 938-9927 [email protected]
Company Information Shares Outst (M) 55 Market Cap (M) $5,269 52-Wk Range $62.37 - $304.79 Book Value/sh $11.69 Cash/sh $14.39 Enterprise Value (M) $4,871 LT Debt/Cap 8% Company Description
Netflix, headquartered in Los Gatos, California, is the largest pure-play Internet subscription service for rentable DVDs.
Source: Thomson Reuters
Netflix (NFLX)
Having Their Cake and Eating It Too; Company Must Strike a Balance Between Costs, Quality, Growth, and Profits; Maintain UNDERPERFORM, $45 PT
• Q4:11 earnings beat driven by better-than-expected subscriber growth and domestic contribution margin, as well as low marketing spend. Revenue was $876 million, compared with our estimate of $869 million, consensus of $858 million, and guidance of $841 – 875 million. EPS was $0.73, compared with our estimate of $0.61, consensus of $0.55, and guidance of $0.36 – 0.70.
• Q4:11 subscriber growth was ahead of our expectations. Netflix had 24.4 million unique domestic subs (we estimated 23.85 million), including 2.73 million DVD only subs (we estimated 2.55 million), 8.44 million hybrid subs (we estimated 8.60 million), and 13.23 million streaming only subs (we estimated 12.70 million).
• International expansion and increased content spending to drive net losses for the year ending December 31, 2012. Netflix guided to a net loss for FY:12 and modest losses for each quarter of the year. In addition to losing 9 million high-margin DVD subs over 2H:11, Netflix will likely have to increase marketing and content spending by 25% for the UK and Ireland alone, hurting profitability.
• Netflix is understating the impact of losing Starz on the quality of streaming content. Netflix described the remaining content available for streaming under the deal as fifteen Disney Pay 1 titles and Encore catalog titles, dismissing the Disney content as constituting only 2% of domestic viewing, and the Encore content as easily replaceable. We disagree with Netflix and view the Disney movies as some of Netflix’s most desirable streaming content, and the Encore content as a diverse catalog that enhances the depth of the streaming offering.
• The loss of Starz reflects the difficult trade-off between content quality and content costs that Netflix currently faces. Netflix has to make a choice: either it will have high subscriber growth due to high-cost, high-quality content, meaning profits will be small or nil; or it will have lower subscriber growth due to low-cost, low-quality content, meaning it will make money but not be a growth story. In our view, the high-growth, high-profit story is not going to happen.
• Maintaining our UNDERPERFORM rating and 12-month price target of $45. Our price target reflects 15x our FY:13 EPS estimate of $3, a level of earnings we view as attainable once Netflix has lowered international spending and revised its pricing structure. Our multiple is in-line with the company’s long-term growth rate.
FYE Dec 2010A 2011A 2012E
REV (M) ACTUAL CURR. PREV. CONS. CURR. PREV. CONS.
Q1 Mar $494A $719A -- $874E $838E $848E Q2 Jun 520A 789A -- 920E 873E 883E Q3 Sep 553A 822A -- 930E 910E 915E Q4 Dec 596A 876A 869A 858A 939E 950E 952E Year* $2,163A $3,205A $3,198A $3,186A $3,664E $3,570E $3,590E Change 29.5% 48.2% 14.3% 2010A 2011A 2012E
EPS ACTUAL CURR. PREV. CONS. CURR. PREV. CONS.
Q1 Mar $0.59A $1.11A -- ($0.16)E ($0.62)E ($0.30)E Q2 Jun 0.80A 1.26A -- (0.23)E (0.44)E (0.16)E Q3 Sep 0.70A 1.16A -- (0.27)E 0.14E 0.08E Q4 Dec 0.87A 0.73A 0.61A 0.55A (0.22)E 0.53E 0.36E Year* $2.96A $4.26A $4.13A $4.07A ($0.88)E ($0.35)E ($0.02)E P/E 32.1x 22.3x (107.9)x Change 49.4% 43.8% -120.7%
Consensus estimates are from Thomson First Call. * Numbers may not add up due to rounding.

Michael Pachter (213) 688-4474 Netflix | 2
RISKS Risks to the attainment of our share price target include: a sudden increase in subscriber growth, declining competition from other movie rental competitors, lower than expected costs for content, technology development and deployment, and improving macroeconomic factors. SUMMARY The Positives: • Netflix’s streaming content library continues to improve significantly in terms of size and quality. Since reporting Q2 results
in July, Netflix has announced content deals with AMC Networks, BBC, CBS, CW Network (owned by CBS and Warner Bros.), Discovery, Disney-ABC Television Group, DreamWorks Animation, Fox, Imagine Television, Lionsgate, MGM, Miramax, and Open Road. In addition, Netflix has reportedly successfully negotiated deals with EPIX, Fox, NBC, Paramount, Relativity Media, and Sony, among others. The deals (including those for the UK and Ireland) differentiate the Netflix streaming service from those of its competitors, and help to drive customer retention, which we view as crucial given management’s unpopular actions in recent months (including subscription plan changes and price increases, and the short-lived Qwikster debacle). Although many customers have cancelled their Netflix subscriptions recently, we believe the content quality and value of the company’s streaming service are unparalleled.
• Netflix’s balanced offering provides convenience, selection, and immediate gratification that may be difficult to replicate elsewhere. Notwithstanding our concerns about the potential for continued customer defections and lower overall revenues as a result of the recent price changes, we acknowledge that Netflix provides an unrivaled catalog of over 100,000 DVDs as well as 20,000 high quality choices for streaming. These offerings are as good as or better than competitive offerings, and even at its higher pricing for hybrid plans, they would be are difficult (if not impossible) to replicate elsewhere.
• Global expansion will be incrementally positive to worldwide subscriber growth. In September 2010, Netflix launched a streaming service in Canada, surpassing 1 million subscribers by the following August. In September 2011, Netflix launched a streaming service in 43 countries in Latin America and the Caribbean, and earlier this month, Netflix announced the rollout of a streaming service in the UK and Ireland. We believe long-term subscriber growth in Latin America and the Caribbean will be negatively impacted by payment processing challenges and the costs of popular local content, among other factors. Although there is greater overlap between popular content in the US and the UK / Ireland, content costs are still expected to be significant (we estimate 25% of domestic content costs based on population), and Netflix will compete with the BBC, LoveFilm (owned by Amazon.com), and Sky.
• Starz savings would have a positive impact on profitability. Starz has the exclusive rights to Disney and Sony film content in a specified window beginning approximately 1 year after the films are released on DVD, and ending several years later (some films are in the Starz window as long as seven years). Under each studio’s respective agreements with Starz, Disney and Sony film content are offered exclusively through Starz via cable or Internet during the terms of the deal, so Netflix has no opportunity to circumvent Starz should it wish to continue to exhibit Disney and Sony content within the Starz window. In early September, Starz announced that it had ended talks about a renewal of its streaming video deal with Netflix. According to the announcement, the current agreement will expire on February 28, 2012, and will not be renewed. If Netflix had renewed the Starz deal, the annual cost would have likely increased from $30 million to around $350 million. However, given that negotiations are over (at least for the time being), and the scarcity of high quality movie content currently available from other sources, we expect Netflix to save a large portion of the Starz savings, positively impacting long-term earnings.
The Concerns: • International expansion and increased content spending to drive net losses for the year ending December 31, 2012. We
estimate that Netflix lost roughly 9 million high-margin DVD subs over 2H:11. Continued international expansion, including the rollout of a streaming service in the UK and Ireland in January 2012, will likely hurt profitability further. Netflix’s spend on marketing was roughly $400 million for 2011, an average of $100 million a quarter. The company had the Qwikster debacle to contend with in Q4:11, and the UK rollout in Q1:12. Given that the UK market is around 25% of the size of the U.S. market, it is likely that incremental marketing spending will be as high as $25 million for that region alone. Netflix spent around $1 billion on streaming content in the U.S. in 2011, so adding comparable quality content in the UK should cost around $250 million. More importantly, content cost in the U.S. is expected to increase by at least $500 million net. Therefore, we expect combined US and UK / Ireland content spending to increase by over $750 million in 2012.
• Netflix is likely understating the impact of the loss of Starz on the quality of streaming content. Netflix’s current deal with Starz allows Netflix to stream unlimited Starz content to its subscribers. However, Netflix has been unable to play Sony content since Q2:11 when Starz exceeded the number of Internet subscribers it could serve. Netflix described the remaining content available for streaming under the deal (with Sony unavailable) as fifteen Disney Pay 1 titles and Encore catalog titles, dismissing the Disney content as constituting only 2% of domestic viewing, and the Encore content as easily replaceable. We disagree with Netflix, and view the Disney movies as some of Netflix’s most desirable streaming content, and the Encore content as a diverse catalog that enhances the depth of the streaming offering. In our view, losing Starz is similar to losing a favorite cable channel as part of your cable package. Although that channel may only account for 2% or 6% of total viewing, the consumer values it nonetheless, and will likely look for another provider that offers the channel.

Michael Pachter (213) 688-4474 Netflix | 3
• The loss of Starz reflects the difficult trade-off between content quality and content costs that Netflix currently faces. Netflix has shown that it is unwilling to renew the Starz deal, as the annual price is likely to increase twelve-fold, from $30 million to $350 million. As a result, Netflix is clearly sacrificing content quality in the interest of keeping its costs in check. This will eventually lead to more subscribers losses than most investors believe, and Netflix will have difficulty attracting new subscribers to replace those that quit its service unless it spends more on marketing. If Netflix chooses to go the other way and keep content quality high, it will have to pay a lot more than the Street is currently expecting, and its profits will suffer as a result. Netflix has to make a choice: either it will have high subscriber growth due to high-cost, high-quality content, meaning profits will be small or nil; or it will have lower subscriber growth due to low-cost, low-quality content, meaning it will make money but not be a growth story. In our view, the high-growth, high-profit story is not going to happen.
• Guidance for Q1:12 and FY:12 is likely to result in reductions in earnings estimates. Netflix expects to lose ($0.49) – ($0.16) in Q1:12, meaning the low-end is significantly below prior consensus of ($0.30). In addition, the company expects modest quarterly losses throughout FY:12, below prior consensus estimates for positive EPS of $0.08 and $0.36 in Q3:12 and Q4:12, respectively. We also believe the prior consensus FY:12 estimate is likely to decrease from ($0.02). In recent years, Netflix has been viewed as a highly profitable company that has been able to grow subscribers at a fast enough rate to more than offset rapidly rising content costs. By stating that it will be unprofitable in 2012, Netflix has shifted its focus away from continued margin expansion to near-term subscriber growth domestically and abroad at the expense of earnings. Netflix clearly hopes to undo some of the damage it has done to its domestic subscriber growth number, and hasten international expansion, likely through increased content, marketing, and technology spend. It appears that Netflix management is resolute in its desire to grow subscribers in 2012 at the expense of profitability.
• November’s $400 million concurrent common stock and convertible notes financing. In our view, both transactions were executed at less-than-optimal terms for Netflix as the company sought financing to quiet investor concerns around liquidity (streaming liabilities were ≈ 12x cash and ST investments at Q3:11) and the impact of declining high-margin DVD subscribers and increasing content costs. The $200 million common stock sale (2.86 million shares at $70/share) to T. Rowe Price Associates was a requirement prior to the sale of $200 million of convertible notes ($85.80/share conversion price) to Technology Crossover Ventures. The $70/share price for the stock sale was 6% below the stock’s closing price on November 21, the date of the announcement, and is 26% below Wednesday’s closing price. In addition, the conversion price of the convertible notes always represented a significant discount to Netflix’s share price after accounting for the time value of money (the converts will mature on 12/1/2018).
• The implementation of a longer sales-only window by Warner Bros. On January 10, Netflix and Warner Bros. Home Entertainment Group announced an agreement to extend the sales-only window to 56 days from 28 days, delaying the availability of new DVD and Blu-ray releases for rental on Netflix. The company appears to expect lower revenues to be offset by cheaper DVDs provided by Warner Bros. In our view, a longer window should have a negative impact on Netflix revenues, particularly if competitor Redbox stays at 28 days or less; however, we expect the impact to be minimal given our view that most Netflix subscribers do not perceive the date of availability for a certain title as its street date, but rather as its Netflix date, regardless of whether that date is 28 days or 56 days after the retail sales release.
• The recent reassignment of Netflix’s chief marketing officer may indicate a lackluster response to the company’s marketing campaigns. On January 20, Netflix announced the reassignment of its chief marketing officer, Leslie Kilgore, to the board of directors as a non-executive director. The company appointed an interim chief marketing officer, Jessie Becker, previously the company's vice-president of marketing, while it searches for external candidates. We believe this reassignment may indicate a lackluster response to the company’s marketing campaigns domestically and internationally. Given recent domestic subscriber attrition, the ongoing international rollout (including in the UK and Ireland, which began earlier this month), and the increased marketing spend needed to boost subscriber levels, an ineffective campaign now would be particularly damaging to the company’s financial outlook.
What To Do with the Stock: • Maintaining our UNDERPERFORM rating and 12-month price target of $45. Netflix seems sanguine about its ability to control
content costs and keep losses to a minimum, and from the wording of its Q4:11 investor letter, it appears that the company intends to control costs by buying lower-quality content. It is not renewing the Starz contract, and seems optimistic that it can replace it with a handful of EPIX movies. We disagree, and think that the loss of the Starz feature films will cripple the product offering, causing subscriber growth to slow. In the alternative, Netflix is going to have to pay more for content in order to keep defections within a manageable range. Either way, we think Netflix has misjudged its ability to continue to grow with inferior content, so it can either grow more slowly or grow less profitably. Until the company provides greater insight into growth trends for content costs and subscriber growth, we recommend that investors remain on the sidelines. Our rating and price target remain unchanged.

Michael Pachter (213) 688-4474 Netflix | 4
OPINION Netflix once again guided to solid top line growth, but the company expects to generate losses throughout 2012 in order to support that growth. We continue to believe that the company is vastly underestimating the resolve of content owners to seek ever-increasing fees for streaming content, and we expect Netflix to be unpleasantly surprised in its negotiations for new rights deals as their current deals expire. Netflix management stated during the live question and answer session that they believed their streaming content costs were fixed, and that marginal streaming subscribers contributed virtually 100% operating profits. We find this statement to be either misinformed, naïve or disingenuous. While we don’t think that management is stupid or evil, we are baffled that they can be so naïve. It is clear that content owners seek the market value of their content in licensing deals; if demand goes up for the content (as measured by overall usage), it logically follows that rational content owners will seek ever-increasing license fees. Netflix management appears to believe that because they are often the only bidder for content, they are in a position to dictate market value, and they appear to further believe that all content is fungible. We completely disagree with this notion. In our view, content costs will rise in correlation with usage. In 2010, Netflix announced that it had officially crossed the 50% streaming usage threshold, and declared itself a “streaming company”. While figures were not provided at the time, we believe it is fair to presume that the average streaming customer consumed no more than twice as much content as was consumed in 2007, the last time the company provided DVD usage metrics, and the year that Netflix launched streaming. In 2007, the average Netflix customer rented 6 DVDs per month, and a small percentage of customers streamed content for 15 minutes or more per quarter. Of course, 2007 was the year before Netflix streaming service was available through consoles or Roku boxes, and most streaming use was on the PC. We estimate that the average Netflix customer consumed approximately 12 hours of content per month in 2007, representing 6 DVDs averaging 2 hours in length (an admittedly aggressive figure). By 2010, when streaming usage tipped to over 50%, cost of subscription revenues was up by approximately $500 million over the 2007 level. We estimate that Netflix’s 16 million average subscribers in 2010 rented an average of 4 DVDs per month (768 million rentals for the full year), compared to the 6 DVDs per month rented by Netflix’s 7 million average subscribers in 2010 (504 million rentals), resulting in an increase in physical costs of revenues of 50%. We believe that Netflix spent $40 million on streaming content in 2007, and if our calculations are correct, this means that it spent approximately $940 million on physical content and postage in 2010 and around $215 million on streaming content. More importantly, if our estimates are close to the mark, the average Netflix customer consumed approximately 8 hours of streaming content per month in 2010, and approximately 8 hours of DVD content. If we fast-forward to the fourth quarter of 2011, we learn that Netflix has proudly proclaimed that its average of 21.5 million domestic streaming customers consumed over 2 billion hours of content during the quarter. This figure suggests per subscriber streaming consumption of 93 hours during the quarter, or around 31 hours per month. In other words, the average Netflix streaming customer has quadrupled consumption of content in just the last year. While Netflix paid relatively little for streaming content in 2010, it paid a lot for it in 2011. Overall content spending was $1.79 billion, consisting of an estimated $1 billion in streaming content, $450 million in DVD content, and $350 million in postage. We believe that the streaming content was skewed toward domestic subscribers, costing around $900 million, with international content (for Latin America and Canada) costing around $100 million. This year, Latin American content will be reflected in each quarter, so we expect content costs for that region to rise by an incremental $100 million. The launch of streaming in the UK suggests to us that streaming content spending there will total at least $200 million, and likely more. Streaming content in the U.S. remains the wild card, and we think that Netflix has vastly underestimated the resolve of content owners to monetize content based upon usage. We think it is important to note that while Netflix characterizes its streaming content costs as “fixed”, that is only a half truth. In fact, almost every deal Netflix has with content owners is for one year, with the exception of the EPIX deal (approximately four years remaining at an estimated $190 million per year) and a handful of movie catalog package deals with two-year terms. We conservatively estimate that 80% of the content Netflix offers to its streaming customers comes up for renewal each year, and over the course of 2012, we expect costs to rise dramatically. Netflix has a choice: pay more in order to maintain the quality of content its subscribers have become accustomed to; or control costs while sacrificing content quality. The company’s discussion of the Starz deal reflects its mindset that all content is fungible. In the June 2011 quarter, Netflix acknowledged that Starz content constituted 10% of streaming viewing (prior to Sony pulling its content), and 6% thereafter. Yesterday, Netflix commented that the new release Disney films constituted only 2% of streaming viewing, dismissing the Encore catalog content (which very likely comprised 4% of viewing) as being easily replaceable by “plenty of substitutes”. On the live call, management commented that content from the EPIX deal (which has been available for over a year) would replace the Disney content that will disappear at the end of next month. In our view, the loss of the Starz content is significant. Netflix will lose approximately half of the recent films in its streaming library between June 30, 2011 and February 29, 2012. We expect a lag until streaming subscribers notice, but we expect that they will, indeed, notice. As content quality suffers, we expect Netflix to face another two choices: either see customers churn faster than in the

Michael Pachter (213) 688-4474 Netflix | 5
past and see subscriber growth stall; or pay much more for higher quality content, and see profits remain elusive. Neither choice supports the growth thesis that many of our competitors seem to embrace. We think that the Starz situation is instructive, insofar as it showed that a content owner had the resolve to play hardball with Netflix. Of course, so long as the company faces little competition for streaming content, it may be able to bait and switch content at will, and by juggling enough balls in the air, it may be able to keep its subscribers happy for another quarter or two. However, over the course of the year, we expect to see one or more content owners play hardball, and we expect to see at least one more high-profile negotiation falter. We think that Netflix has underestimated the resolve of content owners to seek a fair price for their content, and by advertising the 93 hours per subscriber of streaming consumption during the quarter, we believe Netflix has sealed its fate. Investors should keep in mind that there is a reason ESPN is able to charge $4.50 per month per subscriber to cable companies while The Weather Channel charges only $0.15—consumption of its content. We believe that this disparity in pricing fully reflects usage of the two channels’ respective content, with ESPN usage highly likely to be 30x as great as The Weather Channel usage. The same parties who negotiate with cable providers are negotiating with Netflix, and it is not a question of “whether”, but a question of “when” they will seek significantly higher prices for content. We were also troubled by the fact that Netflix acknowledged on the call that it would continue international expansion as soon as it achieved profits. In our view, this limits the company’s prospects to ever turn a significant profit, as we expect that streaming content pricing will ultimately catch up with Netflix. It is important for investors to note that the average domestic streaming customer generates less than $1/month in operating profit, while the average DVD customer generates over $5/month in profits. As Netflix continues to lose DVD customers, it must add streaming customers at a rapid pace to replace the foregone profits. As we said above, we do not accept the company’s view that marginal streaming subscribers contribute close to 100% margin. Most importantly, we think that the $1/month profit on streaming subscribers highlights how fragile Netflix’s model has become. Should streaming content costs rise only $20 million per month, Netflix’s operating profits from its 21 million domestic streaming subscribers will be wiped out. It appears to us that content owners value Netflix’s ability to pay, and do not wish for the company to go out of business. However, in discussions with several content owners, we have concluded that they question Netflix’s pricing structure, and believe that consumption at the 30-hour-per-month level should command a higher price to the consumer. The average television household in the U.S. pays around $78 per month for commercial television and watches approximately 33 hours per week, averaging out to around 143 hours per month. Thus, the average cable bill works out to 54.5¢ per hour of commercially-supported television, with approximately half going to purchase content. In the case of Netflix, the average subscriber pays only 25.8¢ per hour ($7.99 per month for 31 hours) for commercial-free television, with approximately $0.17 per hour going to content providers. We believe that pricing at this level is unsustainable.
Michael Pachter (213) 688-4474 Netflix | 6
DETAILS • After the market close on Wednesday, Netflix reported its fiscal Q4:11 (ending December) results. • Revenue was $876 million, compared with our estimate of $869 million, the consensus estimate of $858 million, and guidance of
$841 – 875 million. • At the end of Q4:11, Netflix had 24.4 million unique domestic subscribers (we estimated 23.85 million), including 2.73 million DVD
only subscribers (we estimated 2.55 million), 8.44 million hybrid subscribers (we estimated 8.60 million), and 13.23 million streaming only subscribers (we estimated 12.70 million). This accounts for 21.67 million total domestic streaming subscribers, compared with our estimate of 21.3 million, guidance of 20.0 – 21.5 million, and 21.45 million last quarter. It had 11.17 million total domestic DVD subscribers, compared with our estimate of 11.15 million, guidance of 10.3 – 11.3 million, and 13.93 million last quarter. It had 1.86 million international subscribers, compared with our estimate of 1.8 million, guidance of 1.6 – 2.0 million, and 1.48 million last quarter.
• EPS was $0.73, compared with our estimate of $0.61, the consensus estimate of $0.55, and guidance of $0.36 – 0.70. • Netflix provided initial Q1:12 guidance for domestic streaming (revenue of $496 – 511 million, contribution profit of $50 – 64 million,
total subs of 22.8 – 23.6 million, and paid subs of 21.5 – 22.3 million), domestic DVDs (revenue of $308 – 322 million, contribution profit of $139 – 154 million, total subs of 9.4 – 10.0 million, and paid subs of 9.3 – 9.9 million), and international (revenue of $38 – 44 million, contribution loss of $118 – 108 million, total subs of 2.5 – 3.1 million, and paid subs of 1.9 – 2.45 million). Globally, Netflix expects revenue of $842 – 877 million, contribution profit of $71 – 110 million, a net loss of $27 – 9 million, and EPS of $(0.49) – (0.16). The company continues to expect to incur net losses for the year ending December 31, 2012, with a modest loss for each quarter.
• We are increasing our 2012 estimate for revenue to $3.66 billion from $3.57 billion to reflect better-than-expected subscriber growth in Q4:11, and decreasing our 2012 EPS estimate to $(0.88) from $(0.35) to reflect guidance and increased content spending assumptions.
ADDITIONAL DETAILS • Gross profit for the quarter was $300 million, compared with our estimate of $297 million. • Gross margin for the quarter was 34.3%, vs. 34.4% last year and our expectation of 34.2%. • SG&A expenses totaled $230 million, compared with our estimate of $237 million. • Operating income totaled $71 million, vs. our expectation of $60 million. • GAAP net income totaled $41 million, vs. our expectation of $34 million. • Net subscribers gained were 1.0 million (0.6 million domestic, 0.4 million international), compared to our estimate of a 0.4 million
gain in subscribers (0.1 million domestic, 0.3 international). • The company discontinued its share buyback program in Q4 as it diverted cash to its UK and Ireland launch. Last quarter the
company spent $39.6 million (0.2 million shares at ≈ $218/share) on share repurchases. • On November 21, Netflix announced a $400 million concurrent common stock and convertible notes financing. The company
raised $200 million (2.86 million shares at $70/share) through the registered sale of common stock to mutual funds and accounts managed by T. Rowe Price Associates, and $200 million through a private placement of convertible notes to funds affiliated with Technology Crossover Ventures (“TCV”). The convertible notes do not bear interest, will mature on December 1, 2018 (subject to earlier conversion or repurchase), and have an initial conversion price of $85.80/share (11.6553 shares of common stock per $1,000 principal amount of notes). Both deals closed in Q4.
• On January 4, Netflix announced that its members watched over two billion hours of streaming in Q4. • On January 9, Netflix launched in the UK and Ireland. • On January 10, Netflix and Warner Bros. Home Entertainment Group announced an agreement to extend the sales-only window to
56 days from 28 days, delaying the availability of new DVD and Blu-ray releases for rental on Netflix. • On January 20, Netflix announced that its chief marketing officer for the past twelve years would be reassigned to the board of
directors as a non-executive director. The company appointed an interim chief marketing officer while it searches for a permanent placement.
• The company’s balance sheet remains solid, with $798 million in cash and $400 million of debt (≈ $7/share in net cash) at the end of the quarter, compared with $366 million in cash and $200 million of debt (≈ $3/share in net cash) at the end of last quarter.

Michael Pachter (213) 688-4474 Netflix | 7
INCOME STATEMENT Netflix Inc.
Income Statement ($ millions) Mar-10 Jun-10 Sep-10 Dec-10 2010 Mar-11 Jun-11 Sep-11 Dec-11 2011 Mar-12 Jun-12 Sep-12 Dec-12 2012
Fiscal Year End: December 31 Q1A Q2A Q3A Q4A FY-A Q1A Q2A Q3A Q4A FY-A Q1E Q2E Q3E Q4E FY-E
Subscription Revenues 493.7 519.8 553.2 595.9 2,162.6 718.6 788.6 821.8 875.6 3,204.6 874.4 919.8 930.3 939.2 3,663.6
Cost of subscription revenues 259.6 265.4 292.4 336.8 1,154.1 377.0 428.2 471.8 512.6 1,789.6 571.9 640.2 682.8 690.1 2,585.0Fulfillment 47.6 49.5 52.1 54.0 203.2 61.2 61.8 64.8 62.6 250.3 56.0 55.2 51.2 47.0 209.3
Total cost of revenues 307.2 314.9 344.5 390.8 1,357.4 438.2 490.0 536.6 575.2 2,039.9 627.9 695.4 734.0 737.1 2,794.2
Gross profit 186.5 204.9 208.8 205.1 805.3 280.4 298.6 285.2 300.4 1,164.7 246.5 224.4 196.3 202.1 869.3
Technology and development 37.4 37.9 42.1 46.0 163.3 50.9 57.9 69.5 80.8 259.0 96.2 84.6 68.8 66.7 316.3
Marketing 75.2 74.5 81.2 62.8 293.8 104.3 95.0 89.1 114.3 402.6 117.9 117.9 117.9 120.0 473.7
General and Administrative 17.2 17.1 17.1 19.1 70.6 23.0 30.7 29.8 34.5 117.9 43.7 39.2 30.2 31.3 144.5Restructuring and other charges 0.0 0.0 0.0 0.0 0.0 0.0 0.0 0.0 0.0 0.0 0.0 0.0 0.0 0.0 0.0
Gain on DVD Disposal (1.7) (2.0) (1.2) (1.2) (6.1) 0.0 0.0 0.0 0.0 0.0 0.0 0.0 0.0 0.0 0.0Operating Income 58.3 77.3 69.5 78.5 283.6 102.2 115.1 96.8 70.9 385.1 (11.3) (17.3) (20.7) (15.9) (65.2)
Interest and other income 1.0 0.9 0.9 0.9 3.7 0.9 1.0 1.7 (0.1) 3.5 2.0 1.7 1.6 1.3 6.6
Interest and other expense (5.0) (4.9) (4.9) (4.8) (19.6) (4.9) (5.3) (4.9) (4.9) (20.0) (4.8) (4.8) (4.8) (4.8) (19.0)Total non-operating income/(expense) (4.0) (4.0) (4.1) (3.9) (15.9) (4.0) (4.3) (3.2) (5.0) (16.5) (2.8) (3.1) (3.2) (3.4) (12.4)
Pretax Income 54.4 73.4 65.4 74.6 267.7 98.2 110.8 93.6 65.8 368.5 (14.1) (20.4) (23.9) (19.3) (77.6)
Provision for income taxes 22.1 29.9 27.4 27.5 106.8 38.0 42.6 31.2 25.1 136.9 (5.5) (7.9) (9.3) (7.5) (30.3)Net Income 32.3 43.5 38.0 47.1 160.9 60.2 68.2 62.5 40.7 231.6 (8.6) (12.4) (14.6) (11.8) (47.3)
Basic Shares 52.9 52.5 52.1 52.6 52.5 52.8 52.5 52.6 53.6 52.8 53.6 53.7 53.8 53.9 53.7Diluted Shares 54.8 54.3 53.9 54.2 54.3 54.2 53.9 53.9 55.4 54.4 56.8 56.9 59.4 59.5 58.1
Basic EPS (GAAP) 0.61 0.83 0.73 0.90 3.06 1.14 1.30 1.19 0.76 4.38 (0.16) (0.23) (0.27) (0.22) (0.88)
Diluted EPS (GAAP) 0.59 0.80 0.70 0.87 2.96 1.11 1.26 1.16 0.73 4.26 (0.15) (0.22) (0.25) (0.20) (0.81)
Income Statement Ratios
Gross margin 37.8% 39.4% 37.7% 34.4% 37.2% 39.0% 37.9% 34.7% 34.3% 36.3% 28.2% 24.4% 21.1% 21.5% 23.7%Fulfillment 9.6% 9.5% 9.4% 9.1% 9.4% 8.5% 7.8% 7.9% 7.1% 7.8% 6.4% 6.0% 5.5% 5.0% 5.7%
Technology and development 7.6% 7.3% 7.6% 7.7% 7.6% 7.1% 7.3% 8.5% 9.2% 8.1% 11.0% 9.2% 7.4% 7.1% 8.6%
Marketing 15.2% 14.3% 14.7% 10.5% 13.6% 14.5% 12.0% 10.8% 13.1% 12.6% 13.5% 12.8% 12.7% 12.8% 12.9%G&A 3.5% 3.3% 3.1% 3.2% 3.3% 3.2% 3.9% 3.6% 3.9% 3.7% 5.0% 4.3% 3.2% 3.3% 3.9%
Operating margin 11.8% 14.9% 12.6% 13.2% 13.1% 14.2% 14.6% 11.8% 8.1% 12.0% -1.3% -1.9% -2.2% -1.7% -1.8%
Net margin 6.5% 8.4% 6.9% 7.9% 7.4% 8.4% 8.6% 7.6% 4.7% 7.2% -1.0% -1.4% -1.6% -1.3% -1.3%Tax Rate 40.6% 40.7% 42.0% 36.8% 39.9% 38.7% 38.4% 33.3% 38.1% 37.1% 39.0% 39.0% 39.0% 39.0% 39.0%
Year-over-Year Changes
Total Revenues 25.3% 27.2% 30.7% 34.1% 29.5% 45.6% 51.7% 48.6% 46.9% 48.2% 21.7% 16.6% 13.2% 7.3% 14.3%
Gross Profit 38.3% 47.1% 41.2% 21.3% 36.3% 50.3% 45.8% 36.6% 46.5% 44.6% -12.1% -24.8% -31.2% -32.7% -25.4%
G&A 32.1% 29.2% 48.4% 41.3% 37.4% 33.8% 79.2% 73.9% 80.4% 67.2% 90.1% 27.9% 1.4% -9.2% 22.5%Marketing 20.8% 61.2% 38.7% -11.1% 23.6% 38.6% 27.4% 9.7% 81.8% 37.0% 13.1% 24.1% 32.3% 5.0% 17.7%
Fulfillment 8.3% 11.6% 23.4% 23.1% 16.5% 28.5% 24.7% 24.5% 15.8% 23.2% -8.5% -10.7% -21.0% -25.0% -16.4%
Technology and development 54.5% 39.6% 40.3% 38.4% 42.6% 36.1% 52.8% 65.0% 75.8% 58.6% 88.9% 46.2% -0.9% -17.5% 22.1%Operating Income 60.0% 46.5% 40.9% 47.1% 47.8% 75.2% 48.8% 39.3% -9.7% 35.8% -111.1% -115.1% -121.3% -122.4% 116.9%
Net Income 44.3% 34.1% 26.0% 52.3% 38.8% 86.6% 56.7% 64.5% -13.5% 44.0% -114.2% -118.2% -123.3% -128.9% 120.4%
Diluted EPS 59.9% 47.3% 35.3% 38.5% 43.9% 88.5% 58.0% 64.7% -15.5% 44.1% -113.6% -117.3% -121.1% -118.0% -117.5%Diluted Shares Outstanding -9.8% -8.9% -6.9% -2.3% -7.1% -1.0% -0.8% -0.1% 2.3% 0.1% 4.8% 5.6% 10.2% 7.2% 6.9%
Source: Company reports and Wedbush Securities estimates

Michael Pachter (213) 688-4474 Netflix | 8
BALANCE SHEET Netflix Inc.
Balance Sheet ($ millions) Mar-10 Jun-10 Sep-10 Dec-10 2010 Mar-11 Jun-11 Sep-11 Dec-11 2011 Mar-12 Jun-12 Sep-12 Dec-12 2012
Fiscal Year End: December 31 Q1A Q2A Q3A Q4A FY-A Q1A Q2A Q3A Q4A FY-A Q1E Q2E Q3E Q4E FY-E
Assets
Cash and equivalents 79.9 107.3 113.1 194.5 194.5 150.4 175.2 159.2 508.1 508.1 387.8 333.5 243.4 164.0 164.0Short-term investments 186.5 171.8 143.7 155.9 155.9 192.3 201.2 206.6 289.8 289.8 289.8 289.8 289.8 289.8 289.8
Prepaid expenses 25.9 0.0 0.0 5.0 5.0 5.0 5.0 5.0
Prepaid content / rev. share 31.7 33.8 59.3 62.2 62.2 74.6 59.8 77.1 56.0 56.0 56.0 56.0 56.0 56.0 56.0
Content Library 55.6 93.1 138.4 181.0 181.0 265.9 499.4 705.4 919.7 919.7 919.7 919.7 919.7 919.7 919.7
Other current assets 35.2 37.7 47.4 47.4 38.4 33.8 41.8 53.8 53.8 53.8 53.8 53.8 53.8 53.8
Total Current Assets 379.5 441.2 492.2 641.0 641.0 721.6 969.4 1,190.1 1,827.4 1,827.4 1,712.1 1,657.8 1,567.8 1,488.4 1,488.4
Content / DVD library, net 109.4 94.7 120.0 181.0 181.0 197.6 425.2 570.2 1,046.9 1,046.9 1,144.0 1,249.0 1,339.0 1,419.0 1,419.0Intangibles, net 0.0 0.0 0.0 0.0 0.0 0.0 0.0
Property and equipment, net 127.2 123.3 125.1 128.6 128.6 134.8 136.9 144.0 136.4 136.4 135.7 135.7 135.7 135.7 135.7
Deposits 0.0 0.0 0.0 0.0 0.0 0.0 0.0
Other non-current assets 32.2 34.8 32.9 31.6 31.6 36.2 39.1 57.2 55.1 55.1 55.1 55.1 55.1 55.1 55.1Total Assets 648.3 694.0 770.3 982.1 982.1 1,090.2 1,570.7 1,961.6 3,065.7 3,065.7 3,046.9 3,097.5 3,097.5 3,098.1 3,098.1
Liabilities and Shareholders' Equity
Accounts payable 102.7 120.0 170.1 222.8 222.8 301.0 533.4 750.1 1,012.6 1,012.6 1,011.2 1,063.7 1,075.8 1,086.1 1,086.1
Accrued expenses 38.7 34.7 37.0 36.5 36.5 44.1 44.1 54.7 54.7 54.7 54.6 57.5 58.1 58.7 58.7
Deferred revenue 100.1 101.4 103.0 127.2 127.2 143.0 146.9 160.9 148.8 148.8 148.6 156.3 158.1 159.6 159.6
Current portion - debt 0.0 0.0 0.0 0.0 0.0 0.0 0.0
Current portion - lease obligations 1.9 2.0 2.0 2.1 2.1 2.1 2.2 2.3 0.0 0.0 0.0 0.0 0.0 0.0 0.0
Total Current Liabilities 243.4 258.2 312.1 388.6 388.6 490.3 726.7 968.0 1,216.1 1,216.1 1,214.4 1,277.5 1,292.0 1,304.4 1,304.4
Convertible preferred 0.0 0.0 0.0Notes payable 200.0 200.0 200.0 200.0 200.0 200.0 200.0 200.0 400.0 400.0 400.0 400.0 400.0 400.0 400.0
Capital lease obligations 35.7 35.2 34.7 34.1 34.1 33.6 33.0 32.4 0.0 0.0 0.0 0.0 0.0 0.0 0.0
Other non-current liabilities 22.4 24.0 31.5 69.2 69.2 90.6 277.0 372.8 801.3 801.3 801.3 801.3 801.3 801.3 801.3
Total Liabilities 501.6 517.3 578.3 691.9 691.9 814.5 1,236.7 1,573.2 2,417.4 2,417.4 2,415.7 2,478.8 2,493.3 2,505.7 2,505.7
Stockholders' Equity:
Common stock 0.1 0.1 0.1 0.1 0.1 0.1 0.1 0.1 0.1 0.1 0.1 0.1 0.1 0.1 0.1Additional paid-in capital 51.6 51.6 0.0 219.1 219.1 210.6 210.6 210.6 210.6 210.6
Deferred stock-based compensation 0.0 0.0 0.0 0.0 0.0 0.0 0.0 0.0
Accumulated other income (loss) 0.5 0.8 1.3 0.8 0.8 0.6 0.9 0.6 0.7 0.7 0.7 0.7 0.7 0.7 0.7
Retained earnings(deficit) 146.2 175.8 190.6 237.7 237.7 275.1 333.1 387.7 428.4 428.4 419.9 407.4 392.9 381.1 381.1
Stockholders' Equity 146.7 176.6 192.0 290.2 290.2 275.7 334.0 388.4 648.3 648.3 631.2 618.7 604.2 592.4 592.4
Tot. Liabilities/Stockholders' Equity 648.3 694.0 770.3 982.1 982.1 1,090.2 1,570.7 1,961.6 3,065.7 3,065.7 3,046.9 3,097.5 3,097.5 3,098.1 3,098.1
Source: Company reports and Wedbush Securities estimates
Michael Pachter (213) 688-4474 Netflix | 9
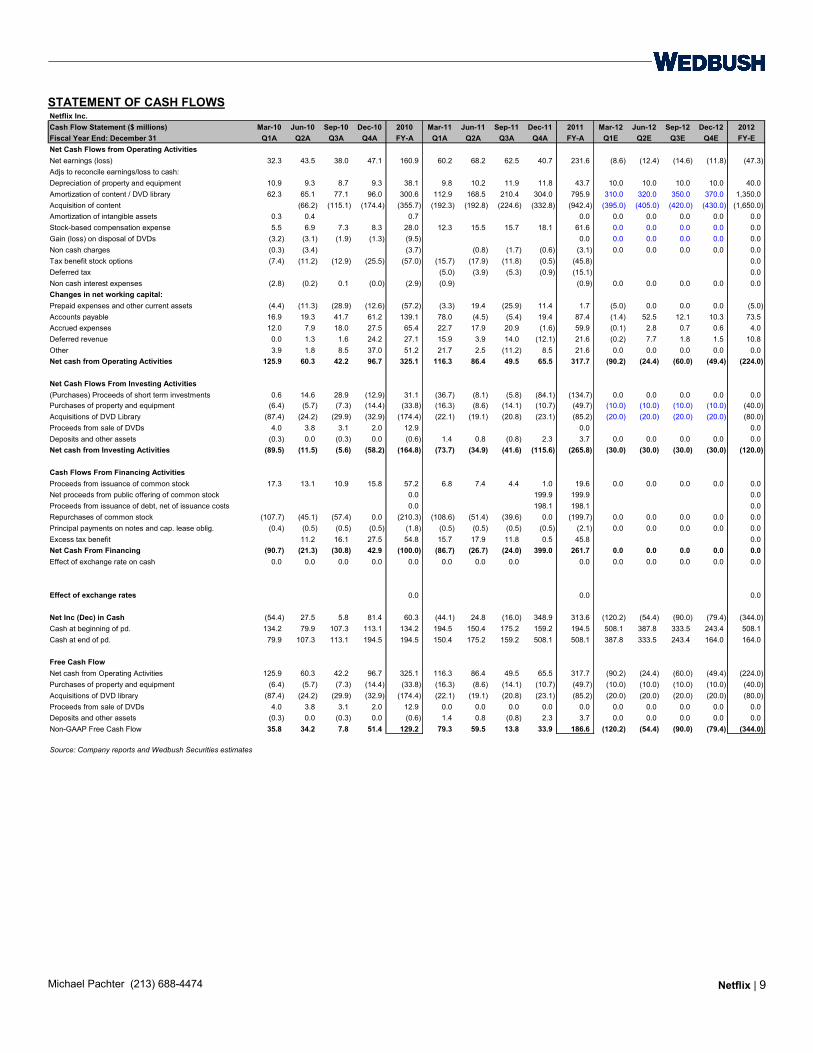
STATEMENT OF CASH FLOWS Netflix Inc.
Cash Flow Statement ($ millions) Mar-10 Jun-10 Sep-10 Dec-10 2010 Mar-11 Jun-11 Sep-11 Dec-11 2011 Mar-12 Jun-12 Sep-12 Dec-12 2012Fiscal Year End: December 31 Q1A Q2A Q3A Q4A FY-A Q1A Q2A Q3A Q4A FY-A Q1E Q2E Q3E Q4E FY-E
Net Cash Flows from Operating Activities
Net earnings (loss) 32.3 43.5 38.0 47.1 160.9 60.2 68.2 62.5 40.7 231.6 (8.6) (12.4) (14.6) (11.8) (47.3)
Adjs to reconcile earnings/loss to cash:
Depreciation of property and equipment 10.9 9.3 8.7 9.3 38.1 9.8 10.2 11.9 11.8 43.7 10.0 10.0 10.0 10.0 40.0
Amortization of content / DVD library 62.3 65.1 77.1 96.0 300.6 112.9 168.5 210.4 304.0 795.9 310.0 320.0 350.0 370.0 1,350.0
Acquisition of content (66.2) (115.1) (174.4) (355.7) (192.3) (192.8) (224.6) (332.8) (942.4) (395.0) (405.0) (420.0) (430.0) (1,650.0)Amortization of intangible assets 0.3 0.4 0.7 0.0 0.0 0.0 0.0 0.0 0.0
Stock-based compensation expense 5.5 6.9 7.3 8.3 28.0 12.3 15.5 15.7 18.1 61.6 0.0 0.0 0.0 0.0 0.0
Gain (loss) on disposal of DVDs (3.2) (3.1) (1.9) (1.3) (9.5) 0.0 0.0 0.0 0.0 0.0 0.0
Non cash charges (0.3) (3.4) (3.7) (0.8) (1.7) (0.6) (3.1) 0.0 0.0 0.0 0.0 0.0
Tax benefit stock options (7.4) (11.2) (12.9) (25.5) (57.0) (15.7) (17.9) (11.8) (0.5) (45.8) 0.0
Deferred tax (5.0) (3.9) (5.3) (0.9) (15.1) 0.0
Non cash interest expenses (2.8) (0.2) 0.1 (0.0) (2.9) (0.9) (0.9) 0.0 0.0 0.0 0.0 0.0Changes in net working capital:
Prepaid expenses and other current assets (4.4) (11.3) (28.9) (12.6) (57.2) (3.3) 19.4 (25.9) 11.4 1.7 (5.0) 0.0 0.0 0.0 (5.0)
Accounts payable 16.9 19.3 41.7 61.2 139.1 78.0 (4.5) (5.4) 19.4 87.4 (1.4) 52.5 12.1 10.3 73.5Accrued expenses 12.0 7.9 18.0 27.5 65.4 22.7 17.9 20.9 (1.6) 59.9 (0.1) 2.8 0.7 0.6 4.0
Deferred revenue 0.0 1.3 1.6 24.2 27.1 15.9 3.9 14.0 (12.1) 21.6 (0.2) 7.7 1.8 1.5 10.8
Other 3.9 1.8 8.5 37.0 51.2 21.7 2.5 (11.2) 8.5 21.6 0.0 0.0 0.0 0.0 0.0Net cash from Operating Activities 125.9 60.3 42.2 96.7 325.1 116.3 86.4 49.5 65.5 317.7 (90.2) (24.4) (60.0) (49.4) (224.0)
Net Cash Flows From Investing Activities
(Purchases) Proceeds of short term investments 0.6 14.6 28.9 (12.9) 31.1 (36.7) (8.1) (5.8) (84.1) (134.7) 0.0 0.0 0.0 0.0 0.0Purchases of property and equipment (6.4) (5.7) (7.3) (14.4) (33.8) (16.3) (8.6) (14.1) (10.7) (49.7) (10.0) (10.0) (10.0) (10.0) (40.0)
Acquisitions of DVD Library (87.4) (24.2) (29.9) (32.9) (174.4) (22.1) (19.1) (20.8) (23.1) (85.2) (20.0) (20.0) (20.0) (20.0) (80.0)
Proceeds from sale of DVDs 4.0 3.8 3.1 2.0 12.9 0.0 0.0
Deposits and other assets (0.3) 0.0 (0.3) 0.0 (0.6) 1.4 0.8 (0.8) 2.3 3.7 0.0 0.0 0.0 0.0 0.0Net cash from Investing Activities (89.5) (11.5) (5.6) (58.2) (164.8) (73.7) (34.9) (41.6) (115.6) (265.8) (30.0) (30.0) (30.0) (30.0) (120.0)
Cash Flows From Financing Activities
Proceeds from issuance of common stock 17.3 13.1 10.9 15.8 57.2 6.8 7.4 4.4 1.0 19.6 0.0 0.0 0.0 0.0 0.0Net proceeds from public offering of common stock 0.0 199.9 199.9 0.0
Proceeds from issuance of debt, net of issuance costs 0.0 198.1 198.1 0.0
Repurchases of common stock (107.7) (45.1) (57.4) 0.0 (210.3) (108.6) (51.4) (39.6) 0.0 (199.7) 0.0 0.0 0.0 0.0 0.0
Principal payments on notes and cap. lease oblig. (0.4) (0.5) (0.5) (0.5) (1.8) (0.5) (0.5) (0.5) (0.5) (2.1) 0.0 0.0 0.0 0.0 0.0
Excess tax benefit 11.2 16.1 27.5 54.8 15.7 17.9 11.8 0.5 45.8 0.0Net Cash From Financing (90.7) (21.3) (30.8) 42.9 (100.0) (86.7) (26.7) (24.0) 399.0 261.7 0.0 0.0 0.0 0.0 0.0
Effect of exchange rate on cash 0.0 0.0 0.0 0.0 0.0 0.0 0.0 0.0 0.0 0.0 0.0 0.0 0.0 0.0
Effect of exchange rates 0.0 0.0 0.0
Net Inc (Dec) in Cash (54.4) 27.5 5.8 81.4 60.3 (44.1) 24.8 (16.0) 348.9 313.6 (120.2) (54.4) (90.0) (79.4) (344.0)
Cash at beginning of pd. 134.2 79.9 107.3 113.1 134.2 194.5 150.4 175.2 159.2 194.5 508.1 387.8 333.5 243.4 508.1
Cash at end of pd. 79.9 107.3 113.1 194.5 194.5 150.4 175.2 159.2 508.1 508.1 387.8 333.5 243.4 164.0 164.0
Free Cash Flow
Net cash from Operating Activities 125.9 60.3 42.2 96.7 325.1 116.3 86.4 49.5 65.5 317.7 (90.2) (24.4) (60.0) (49.4) (224.0)
Purchases of property and equipment (6.4) (5.7) (7.3) (14.4) (33.8) (16.3) (8.6) (14.1) (10.7) (49.7) (10.0) (10.0) (10.0) (10.0) (40.0)
Acquisitions of DVD library (87.4) (24.2) (29.9) (32.9) (174.4) (22.1) (19.1) (20.8) (23.1) (85.2) (20.0) (20.0) (20.0) (20.0) (80.0)
Proceeds from sale of DVDs 4.0 3.8 3.1 2.0 12.9 0.0 0.0 0.0 0.0 0.0 0.0 0.0 0.0 0.0 0.0Deposits and other assets (0.3) 0.0 (0.3) 0.0 (0.6) 1.4 0.8 (0.8) 2.3 3.7 0.0 0.0 0.0 0.0 0.0
Non-GAAP Free Cash Flow 35.8 34.2 7.8 51.4 129.2 79.3 59.5 13.8 33.9 186.6 (120.2) (54.4) (90.0) (79.4) (344.0)
Source: Company reports and Wedbush Securities estimates
Michael Pachter (213) 688-4474 Netflix | 10
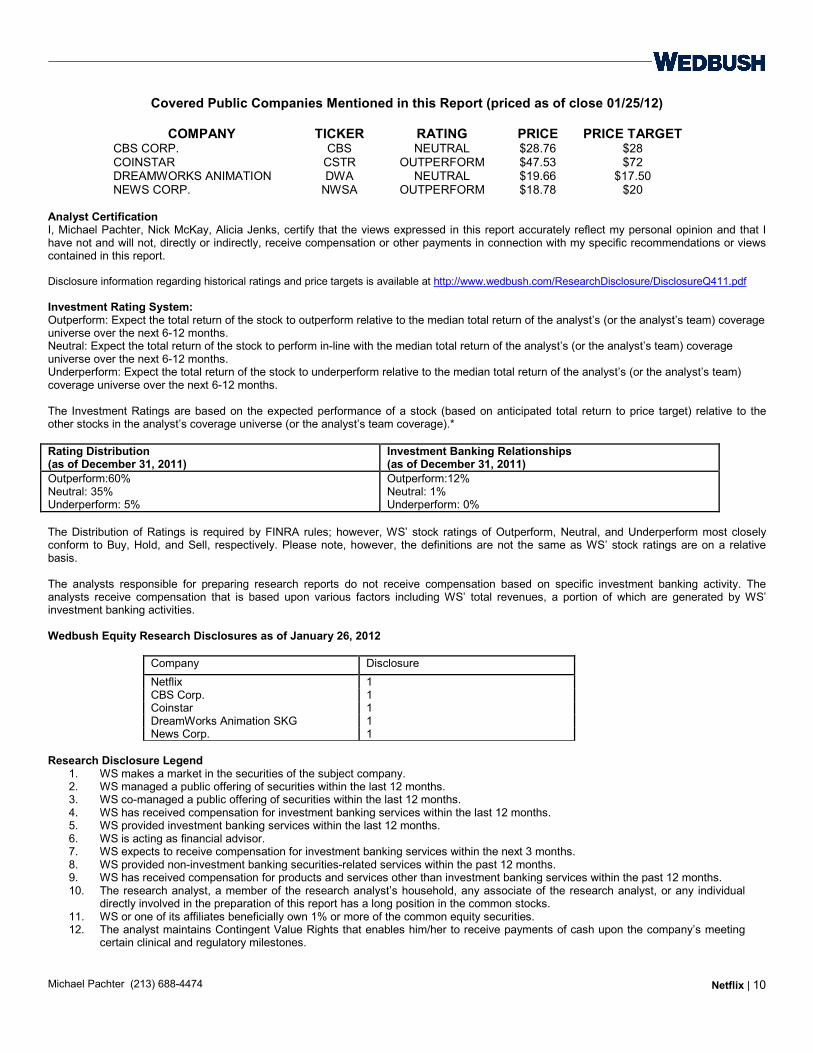
Covered Public Companies Mentioned in this Report (priced as of close 01/25/12)
COMPANY TICKER RATING PRICE PRICE TARGET CBS CORP. CBS NEUTRAL $28.76 $28 COINSTAR CSTR OUTPERFORM $47.53 $72 DREAMWORKS ANIMATION DWA NEUTRAL $19.66 $17.50 NEWS CORP. NWSA OUTPERFORM $18.78 $20
Analyst Certification I, Michael Pachter, Nick McKay, Alicia Jenks, certify that the views expressed in this report accurately reflect my personal opinion and that I have not and will not, directly or indirectly, receive compensation or other payments in connection with my specific recommendations or views contained in this report. Disclosure information regarding historical ratings and price targets is available at http://www.wedbush.com/ResearchDisclosure/DisclosureQ411.pdf Investment Rating System: Outperform: Expect the total return of the stock to outperform relative to the median total return of the analyst’s (or the analyst’s team) coverage universe over the next 6-12 months. Neutral: Expect the total return of the stock to perform in-line with the median total return of the analyst’s (or the analyst’s team) coverage universe over the next 6-12 months. Underperform: Expect the total return of the stock to underperform relative to the median total return of the analyst’s (or the analyst’s team) coverage universe over the next 6-12 months. The Investment Ratings are based on the expected performance of a stock (based on anticipated total return to price target) relative to the other stocks in the analyst’s coverage universe (or the analyst’s team coverage).* Rating Distribution (as of December 31, 2011)
Investment Banking Relationships (as of December 31, 2011)
Outperform:60% Neutral: 35% Underperform: 5%
Outperform:12% Neutral: 1% Underperform: 0%
The Distribution of Ratings is required by FINRA rules; however, WS’ stock ratings of Outperform, Neutral, and Underperform most closely conform to Buy, Hold, and Sell, respectively. Please note, however, the definitions are not the same as WS’ stock ratings are on a relative basis. The analysts responsible for preparing research reports do not receive compensation based on specific investment banking activity. The analysts receive compensation that is based upon various factors including WS’ total revenues, a portion of which are generated by WS’ investment banking activities. Wedbush Equity Research Disclosures as of January 26, 2012
Company Disclosure
Netflix 1 CBS Corp. 1 Coinstar 1 DreamWorks Animation SKG 1 News Corp. 1
Research Disclosure Legend
1. WS makes a market in the securities of the subject company. 2. WS managed a public offering of securities within the last 12 months. 3. WS co-managed a public offering of securities within the last 12 months. 4. WS has received compensation for investment banking services within the last 12 months. 5. WS provided investment banking services within the last 12 months. 6. WS is acting as financial advisor. 7. WS expects to receive compensation for investment banking services within the next 3 months. 8. WS provided non-investment banking securities-related services within the past 12 months. 9. WS has received compensation for products and services other than investment banking services within the past 12 months. 10. The research analyst, a member of the research analyst’s household, any associate of the research analyst, or any individual
directly involved in the preparation of this report has a long position in the common stocks. 11. WS or one of its affiliates beneficially own 1% or more of the common equity securities. 12. The analyst maintains Contingent Value Rights that enables him/her to receive payments of cash upon the company’s meeting
certain clinical and regulatory milestones.

Michael Pachter (213) 688-4474 Netflix | 11
Price Charts Wedbush disclosure price charts are updated within the first fifteen days of each new calendar quarter per FINRA regulations. Price charts for companies initiated upon in the current quarter, and rating and target price changes occurring in the current quarter, will not be displayed until the following quarter. Additional information on recommended securities is available on request.

Michael Pachter (213) 688-4474 Netflix | 12
* WS changed its rating system from (Strong Buy/Buy/Hold/Sell) to (Outperform/ Neutral/Underperform) on July 14, 2009. Please access the attached hyperlink for WS’ Coverage Universe: http://www.wedbush.com/services/cmg/equities-division/research/equity-research Applicable disclosure information is also available upon request by contacting Ellen Kang in the Research Department at (213) 688-4529, by email to [email protected], or the Business Conduct Department at (213) 688-8090. You may also submit a written request to the following: Business Conduct Department, 1000 Wilshire Blvd., Los Angeles, CA 90017.
OTHER DISCLOSURES
RESEARCH DEPT. * (213) 688-4505 * www.wedbush.com EQUITY TRADING Los Angeles (213) 688-4470 / (800) 421-0178 * EQUITY SALES Los Angeles (800) 444-8076
CORPORATE HEADQUARTERS (213) 688-8000 The information herein is based on sources that we consider reliable, but its accuracy is not guaranteed. The information contained herein is not a representation by this corporation, nor is any recommendation made herein based on any privileged information. This information is not intended to be nor should it be relied upon as a complete record or analysis; neither is it an offer nor a solicitation of an offer to sell or buy any security mentioned herein. This firm, Wedbush Securities, its officers, employees, and members of their families, or any one or more of them, and its discretionary and advisory accounts, may have a position in any security discussed herein or in related securities and may make, from time to time, purchases or sales thereof in the open market or otherwise. The information and expressions of opinion contained herein are subject to change without further notice. The herein mentioned securities may be sold to or bought from customers on a principal basis by this firm. Additional information with respect to the information contained herein may be obtained upon request.

RETAIL AND CONSUMER TECHNOLOGY, MEDIA AND TELECOM LIFE SCIENCES
Consumer Products Communications Equipment Biotechnology/Biopharmaceuticals/BioDefense Rommel T. Dionisio (212) 938-9934 Rohit Chopra (212) 668-9871 Gregory R. Wade, Ph.D. (415) 274-6863 Kurt M. Frederick, CFA CPA (415) 274-6822 Sanjit Singh (212) 938-9922 David M. Nierengarten, Ph.D. (415) 274-6862
Ryan Flanagan (212) 938-9942 Christopher N. Marai, Ph.D. (415) 274-6861 Footwear, Apparel and Accessories Corinna Freedman (212) 668-9876 Computer Services: Financial Technology Cardiac, Hepatic and Regenerative
Gil B. Luria (213) 688-4501 Duane Nash, MD JD MBA (415) 263-6650 Healthy Lifestyles Jonathan Jin (213) 688-4505 Akiva Felt (415) 263-6648 Kurt M. Frederick, CFA CPA (415) 274-6822 Larry Chen (415) 274-6874
Entertainment: Retail Restaurants Michael Pachter (213) 688-4474 Emerging Pharmaceuticals Nick Setyan (213) 688-4519 Nick McKay (213) 688-4343 Liana Moussatos, Ph.D. (415) 263-6626
Alicia Jenks (212) 938-9927 Richard Lau (415) 274-6851 Specialty Retail: Hardlines Christopher N. Marai, Ph.D. (415) 274-6861 Joan L. Storms, CFA (213) 688-4537 Entertainment: Software John Garrett, CFA (213) 688-4523 Michael Pachter (213) 688-4474 Healthcare Services - Managed Care
Nick McKay (213) 688-4343 Sarah James (213) 688-4503 Specialty Retail: Softlines Daniel Patt (212) 938-9937 Betty Chen (415) 273-7328 Internet and E-Commerce Alex Pham (415) 273-7315 Michael Pachter (213) 688-4474 Medical Diagnostics and Life Sciences Tools
Nick McKay (213) 688-4343 Zarak Khurshid (415) 274-6823 RETAIL/CONSUMER MARKET RESEARCH Alicia Jenks (212) 938-9927 Jeffrey Chu (415) 274-6885
Gabriella Santaniello (213) 688-4557 Media James Dix, CFA (213) 688-4315
CLEAN TECHNOLOGY AND INDUSTRIAL GROWTH Movies and Entertainment
Aerospace and Defense Michael Pachter (213) 688-4474 Kenneth Herbert (415) 274-6875 Nick McKay (213) 688-4343 Andrew Doupé (415) 274-6876 Alicia Jenks (212) 938-9927
Clean Technology Semiconductors Craig Irwin (212) 938-9926 Betsy Van Hees (415) 274-6869 David Giesecke (212) 938-9925 Ryan Jue (415) 263-6669
Environmental Services Telecommunications Infrastructure Al Kaschalk (213) 688-4539 Suhail Chandy, CFA (213) 688-4380
Scott P. Sutherland, CFA (213) 688-4522 Industrial Biotechnology Liana Moussatos, Ph.D. (415) 263-6626 Telecommunications Software Christopher N. Marai, Ph.D. (415) 274-6861 Scott P. Sutherland, CFA (213) 688-4522
Suhail Chandy, CFA (213) 688-4380 Water and Renewable Energy Solutions David Rose, CFA (213) 688-4319 Wireless Equipment
Scott P. Sutherland, CFA (213) 688-4522 Suhail Chandy, CFA (213) 688-4380
MANAGER, RESEARCH OPERATIONS Ellen Kang (213) 688-4529
EQUITY RESEARCH DEPARTMENT (213) 688-4529
DIRECTOR OF RESEARCH Mark D. Benson (213) 688-4435
EQUITY SALES EQUITY TRADING Los Angeles (213) 688-4470 / (800) 444-8076 Los Angeles (213) 688-4470 / (800) 421-0178 San Francisco (415) 274-6800 San Francisco (415) 274-6811 New York (212) 938-9931 New York (212) 344-2382 Boston (617) 832-3700 Boston (617) 832-3700
CORPORATE HEADQUARTERS 1000 Wilshire Blvd., Los Angeles, CA 90017-2465
Tel: (213) 688-8000 www.wedbush.com