Embed Size (px)
Citation preview
Long-Term Monitoring of Coral Reefs of the Main Hawaiian Islands
Final Report 2009 NOAA Coral Reef Conservation Program
Hawaiʹi Island Monitoring Report
NA09NOS4260100
10/01/2009 – 12/31/2012
William Walsh, Stephen Cotton, Camille Barnett, Courtney Couch, Linda Preskitt, Brian Tissot, Kara Osada-D’Avella
Department of Land & Natural Resources February, 2013

2
Contents
SUMMARY OF FINDINGS ............................................................................................... 4
CONTRIBUTORS ............................................................................................................. 8
HAWAI′I ISLAND SURVEYS............................................................................................ 9
Benthic Monitoring Methods .............................................................................................. 9
Results .............................................................................................................................. 9
Puakō................................................................................ ...............................................11
Octocoral Distribution ...................................................................................................... 12
Coral Disease.................................................................................................................. 14
Methodology.................................................................................................................... 14
Results ............................................................................................................................ 15
Temperature data............................................................................................................ 23
Fish Surveys ................................................................................................................... 25
Methodology.................................................................................................................... 25
Results ............................................................................................................................ 31
Introduced Species – Taʹape .......................................................................................... 34
Roi ................................................................................................................................... 35
Pufferfish Die-Off ............................................................................................................. 38
Roi Impacts ..................................................................................................................... 39
Aquarium Species ........................................................................................................... 41
Fish Replenishment Areas (FRAs) .................................................................................. 45
Aquarium Species of Special Concern ............................................................................ 54
Aquarium Species Open vs. FRA Trend Analysis ........................................................... 55
Aquarium Species Population and Catch Analysis ......................................................... 63
Endemic Species on the WHFC White List ..................................................................... 66
Aquarium Reef Fish Catch vs. Non-Aquarium Catch ...................................................... 67
Lay Gill Net Management ................................................................................................ 72
Invertebrates – Crown-of-Thorns .................................................................................... 74
COTS Aggregation .......................................................................................................... 75
Urchins ............................................................................................................................ 79
East Hawaiʹi Fish Survey Results ................................................................................... 80
References ...................................................................................................................... 84
3
Appendices
Appendix A. Occurrences of eight coral diseases documented across 30 monitoring sites in West Hawaiʹi .......................................................................................... 87
Appendix B. West Hawaiʹi Benthic Cover 2011 Surveys; Broad Benthic Categories ...... 88
Appendix C. West Hawaiʹi Coral Cover By Species 2011 Surveys ................................. 89
Appendix D. West Hawaiʹi Benthic Cover 2007 Surveys; Broad Benthic Categories ..... 90
Appendix E. West Hawaiʹi Coral Cover By Species 2007 Surveys ................................. 91
Appendix F. West Hawaiʹi Benthic Cover 2003 Surveys; Broad Benthic Categories ...... 92
Appendix G. West Hawaiʹi Coral Cover By Species 2003 Surveys ................................. 93
Appendix H. 2003, 2007 and 2011 Octocoral Percent Cover Comparison ..................... 94
Appendix I. Individuals per 100 m2 by species at East Hawaiʹi sites ............................... 95

4
SUMMARY OF FINDINGS
Benthic Coral and Habitat Surveys Total Coral cover declined significantly at 2 northern sites in West Hawaiʹi
between 2007 and 2011. One southern site (out of 16) declined and 1 increased between 2007 and 2011. Overall, 7 of 9 northern sites have significantly declined between 2003 and 2011. One southern site has significantly declined between 2003 and 2011 and one has significantly increased. A strong winter storm in 2004 was likely responsible for the declines but a major sediment event in 2006 may also have affected sites at Kamilo Gulch and Waiakaʹilio Bay on the North Kohala coast. Another sediment event occurred in 2012 and its effects have yet to be determined. Puakō continues to exhibit an alarming downward trend in coral cover over a 40 year period.
No invasive alien algal or coral species were detected at any site. Macroalgal cover was very low at all sites.
The distribution of the octocoral Sarcothelia edmonsoni around developed areas near Kona and its virtual absence around undeveloped shoreline areas suggests possible anthropogenic (pollution) influence. Since other studies have cited octocoral as a pollution indicator and shoreline development in West Hawaiʹi is expected to continue to increase, further studies should be undertaken to determine the relationship between octocoral presence and land based pollution.
Coral Disease Surveys
The following coral diseases were recorded at West Hawaiʹi monitoring sites in 2010: Porites growth anomaly, Porites tissue loss syndrome, Porites multifocal tissue loss, Porites trematodiasis, Montipora growth anomaly, Pavona varians hypermycosis and Pocillopora tissue loss.
Porites spp. were the most susceptible to disease with the most widespread diseases including growth anomalies, trematodiasis, and tissue loss syndrome of Porites spp.
Though thought to be a common condition, the possible senescence reaction of Pocillopora meandrina (i.e. progressive age-related colony death) was observed at only two sites likely attributed to the low number of Pocilloporids present at monitoring sites.
Overall disease prevalence and prevalence of Porites growth anomalies were positively correlated with total estimated size and total number of submarine groundwater (SGD) “plumes”.
West Hawaiʹi sites show a significant negative relationship between disease prevalence and distance from harbors/boat ramps particularly for Porites growth anomalies and Porites tissue loss syndrome.
5
No significant changes in disease densities were found between survey years 2007 and 2010 for ten monitoring sites. However, instances of Porites growth anomalies and Porites tissue loss syndrome slightly increased at four sites located in close proximity to harbors/boat ramps.
No statistically significant relationships were found between prevalence of coral diseases and abundances of corallivorous butterflyfishes and parrotfishes for West Hawaii’s reefs.
Temperature Trends
From 1999 to 2005 there was a clear trend of increasing water temperatures
along the West Hawaiʹi coastline. Over this 6 year period water temperatures increased by 1.8-2.7°F. Sometime around 2006/2007 the increasing temperature trend ceased and overall water temperatures declined over the next four years. A slight increase in 2012 has resulted in slightly elevated mean water temperatures (x = 0.39ºF) during the warmest months of the year.
Fish
The abundances of aquarium and food fishes increased significantly in West Hawaiʹi over the last 14 years. The overall number of fishes, not substantially harvested for either food or the aquarium trade, did not change significantly although individual species within this group may have.
Temporal trends of the various trophic groups of reef fishes indicate that herbivores and detritivores have increased over the past 14 years. There have been no overall changes in corallivores, zooplanktivores or sessile invertebrate feeders while piscivores and mobile invertebrate feeders have decreased.
Overall herbivore biomass has increased in West Hawaiʹi due to recent increases in the MPAs which currently are 2X higher than the FRAs or the Open areas. There is no difference in herbivore biomass between FRAs and Open areas and there are declining long term trends of herbivore biomass in both areas. Aquarium fishing is not driving the decline in herbivore biomass but rather it is likely due to other types of fishing (i.e. food fishing).
Introduced Species/Fish Die-Off
Transect data reflects overall low abundance of Taʹape in the reef areas of the study sites and they are rarely found in the shallower water where resource fish surveys are conducted. Taʹape are relatively numerous in some locales usually along drop-offs and deeper reef areas but their distribution is highly patchy. Ta’ape abundance has declined at survey sites from earlier periods.
There has been a marked decrease in Roi abundance both on West Hawaiʹi transect (53%) and free swim surveys (69%). This decline may be related in part to an unusual fish die-off in West Hawaiʹi which first became apparent in May 2006.
Early in 2010 a die-off of large puffers, with external symptoms quite similar to the previous mortalities, began to occur on Maui and Hawaiʹi Island. Over the

6
ensuing months low numbers of dead and dying puffers were progressively reported up the island chain as far as Kauaʹi.
West Hawaiʹi monitoring data also indicates a substantial decline has occurred in the abundance of the Hawaiian Spotted Toby (Canthigaster jactator) and the Spotted Puffer (Arothron meleagris) with a precipitous drop of the latter species in 2009/2010.
As of November 2010 a total of 106 puffers have undergone both gross and microscopic examination. All assays for viruses (including electron microscopy) have so far come up negative and all attempts to incriminate any infectious agent as a cause have come to naught.
An examination of Roi abundance and two of the most abundant species in Roi’s prime habitat; Yellow Tang (Zebrasoma flavescens) and Kole (Ctenochaetus strigosus) failed to indicate direct negative impact on either species.
Examination of the relationship between Roi abundance and the abundance of various species and functional groups showed no significant negative relationships. Having more Roi in an area does not result in having less total fish, small prey fish, other piscivores, Yellow Tang Young-of-Year (YOY), Kole YOY or all YOY.
The estimated Roi population in West Hawai’i in the 30’-60’ depth range (hard bottom only) is 27,609 individuals.
Aquarium Species
The West Hawai'i aquarium fishery has undergone substantial and sustained expansion over the past 35 years. Total catch and value have increased by 39% and 59% respectively since FY 2000. Approximately 79% of the fish caught in the State and 68% of the total aquarium catch value presently comes from the Big Island. Aquarium take of opae ula has increased dramatically in recent years both from East and West Hawaiʹi.
Comparison of Hawai'i Island aquarium catch report data with dealer purchases from collectors indicated a 3.5% difference between the numbers of animals reported caught and sold by aquarium collectors. Dealer reports of purchases from Hawai'i collectors were 9.8% lower than number reported sold by collectors which did not indicate underreporting by collectors.
Twelve years after FRA closure the abundances of Yellow Tang, Goldring Surgeonfish (Kole) and Forcepsfish density have increased markedly (and significantly) in the FRAs. The first two species alone account for 92% of the total aquarium catch. Seven other long term changes (3 increases and 4 decreases) for the top 20 collected species were significant.
The FRAs were ‘effective’ (increases in FRAs relative to long term MPAs) for 10 of the top 20 collected species with four species being statistically significant. Effectiveness for 4 other, less abundant and/or less collected, species was significantly negative.
With only two exceptions all of the FRAs have proven to be effective (positive R value) in enhancing Yellow Tang populations. Five of the eight increases were statistically significant. The single FRA which was ineffective was Waiakaʹilio

7
Bay in North Kohala. This FRA had very low Yellow Tang recruitment throughout the study period and the area may have been impacted by a sedimentation event in October 2006.
Overall Yellow Tang abundance in 30’-60’ hardbottom habitat in West Hawaiʹi increased by 355,758 individuals from 1999/2000 to 2010-2012 even though Yellow Tang abundance in the Open areas decreased by 21%. This decrease is attributable largely to an increase in the number of aquarium collectors and collected animals relative to the period when the FRAs were established.
There were no significant differences in the abundance of adult Yellow Tang in open vs. closed areas based on shallow water (10’-20’ depths) jet boot surveys. Total estimated coastwise population of adult Yellow Tang in this depth range was estimated to be >2.5 million individuals.
Goldring Surgeonfish or Kole exhibited trends quite similar to Yellow Tang. Overall Kole abundance in 30’-60’ hardbottom habitat increased by 948,662 individuals and abundance in open areas increased by 15%. Achilles Tang is in a declining trend.
With only a single exception all of the FRAs have proven to be effective (positive R value) in enhancing Kole populations although only a single one was statistically significant. All FRAs had an increase in the numbers of Kole.
Concerns over continued expansion of the aquarium fishery and harvesting effects in the open areas has prompted DAR and the West Hawai′i Fisheries Council (WHFC) to develop a ‘white list’ of 40 species which can be taken by aquarium fishers. All other species will be off limits.
Based on an analysis of the differences in density between open and protected areas there was clear evidence of an aquarium collecting impact for only 5 species of the 34 white list species which were analyzed. Four of the 5 are among the 10 most heavily collected species. For the others, it appears that inclusion on the white list poses little or no threat to their populations.
Based on a comparison of catch and estimated population abundance in the 30’-60’ depth range aquarium collecting is having the largest impacts on Achilles and Yellow Tang. Achilles Tang has had low levels of recruitment over the past decade and substantial numbers of larger fish (i.e. ‘breeders’) are taken for human consumption.
For most of the species on the white list collecting impact, in terms of the % of the population being removed annually, is relatively low with 10 species having single digit % catch and 19 species having % catch values <1%.
Eight no lay gill netting areas were established in West Hawai′i in 2005, comprising 25% of the coastline (including already protected areas). Nearshore monitoring results did not find major differences in food fish abundance in/out of the no netting areas with the exception of parrotfishes. The lack of an effect of protection on other resource fishes may be due to several factors including the relatively low number of lay gill nets that are presently being used (i.e. registered) in West Hawai′i.

8
Reef fish landings by commercial fishers and non-commercial ‘recreational’ fishers can equal or exceed the catch by aquarium collectors in West Hawai’i and elsewhere.
Invertebrates
Crown-of-Thorns Starfish (COTS) (Acanthaster planci) have a low absolute abundance on West Hawaiʹi reefs but there has been a recent rebound in numbers following a substantial decline beginning in 2006.
An aggregation of COTS was monitored near Kaʹūpūlehu, West Hawaiʹi at site #7 in September 2012. COTS were noticeably distributed in clusters. Surveys conducted at a one week interval (September 20th and 26th), showed COTS density and abundance decreased and the starfish appeared to be migrating slowly in a northerly direction and into shallower waters.
Only a single predator of COTS, Charonia tritonis (Triton’s Trumpet), was observed at the survey site.
Continued monitoring of COTS populations and immediate protection of their predators, C. tritonis and Cassis cornuta (Horned Helmet) is highly recommended throughout the State of Hawaiʹi.
Three of four of the most common surveyed urchin species have increased in West Hawaiʹi since monitoring began in 1999. This increase has been very substantial for the Collector Urchin, Tripneustes gratilla which has increased by 6.1X between 1999/2000 – 2010/2012.
The estimated population of Collector Urchin on West Hawaiʹi reefs in the 30’ -60’ depth range is 9,678,711. This increase is not related to an increase in benthic algae as a food supply.
East Hawaiʹi
Abundance of fishes is significantly greater at both Waiopae MLCD and Waiopae open sites than at Richardson’s Ocean Center (ROC). Species richness is higher in the MLCD as compared to ROC. The MLCD and ROC sites have the highest similarity in fish communities, and the OPEN and ROC communities have the lowest similarity.
Over the 12 years of surveying of fishes at Waiopae and ROC, there appears to have been a slight increase in fishes observed between 1999 and 2006, followed by a three-year decline. No net increase in fish abundance has been observed at Waiopae MLCD since its establishment in 2003.
CONTRIBUTORS
Laura Livnat, Ross Martin, Rich Osada, Kosta Stamoulis, Ivor Williams, Jill Zamzow, Greta Aeby, Thierry Work, Megan Lamson, Lindsey Kramer, Rebecca Most, Anthony Spitzack, Chad Wiggins, Brent Carman.

9
Hawaiʹi Island Surveys
Benthic Monitoring Methods Benthic surveys were initially conducted in West Hawaiʹi in 1999 and then again in 2003. More recently, surveys were conducted at 26 monitoring sites in 2007 and 2011. The images used for analysis in 1999 were captured by digital video. The resolution of the video images was very poor however compared to the subsequent surveys which used much higher resolution digital still images (Olympus 5060 in 2003, Olympus 7070 in 2007 and Olympus E-PL1 in 2011). Specifically, octocoral was not detectable in the 1999 video capture images, nor was it possible to distinguish live finger coral from dead finger coral. It was therefore determined that it was not valid to compare data taken with these two different techniques. To obtain images of consistent size and quality, a 75cm clear Plexiglas® spacer rod is attached to the underwater housing and used as a guide to steady the camera at a fixed height (0.75m) above the benthos. A white balance feature was used to compensate for loss of red light at depth, giving the images a more natural appearance without artificial lighting. Four transects 25m in length were photographed at each site. Images were taken at 1m intervals from a standard height of 0.75cm starting at the 0 point and ending at the 25m mark, producing 26 images per transect. Images were analyzed using the Coral Point Count with Excel extensions software program (CPCe Kohler and Gill 2006). Data was pooled by transect. The resulting configuration was 4 transects per site, 26 frames per transect, 20 stratified random points per image (4 rows, 5 columns), 520 individual data points per transect, and 2080 points per site. Proportion of each benthic category was determined for each image and percent cover was calculated for each transect, Total percent cover was obtained by calculating the mean percent cover of the 4 transects. Results Complete benthic data for the 2003, 2007 and 2011 surveys, presented as percent coverage, are contained in Appendices A – H. Comparisons of total coral cover (paired two-sample T tests) were performed on the percent total coral cover mean values for individual transects (Table 1).
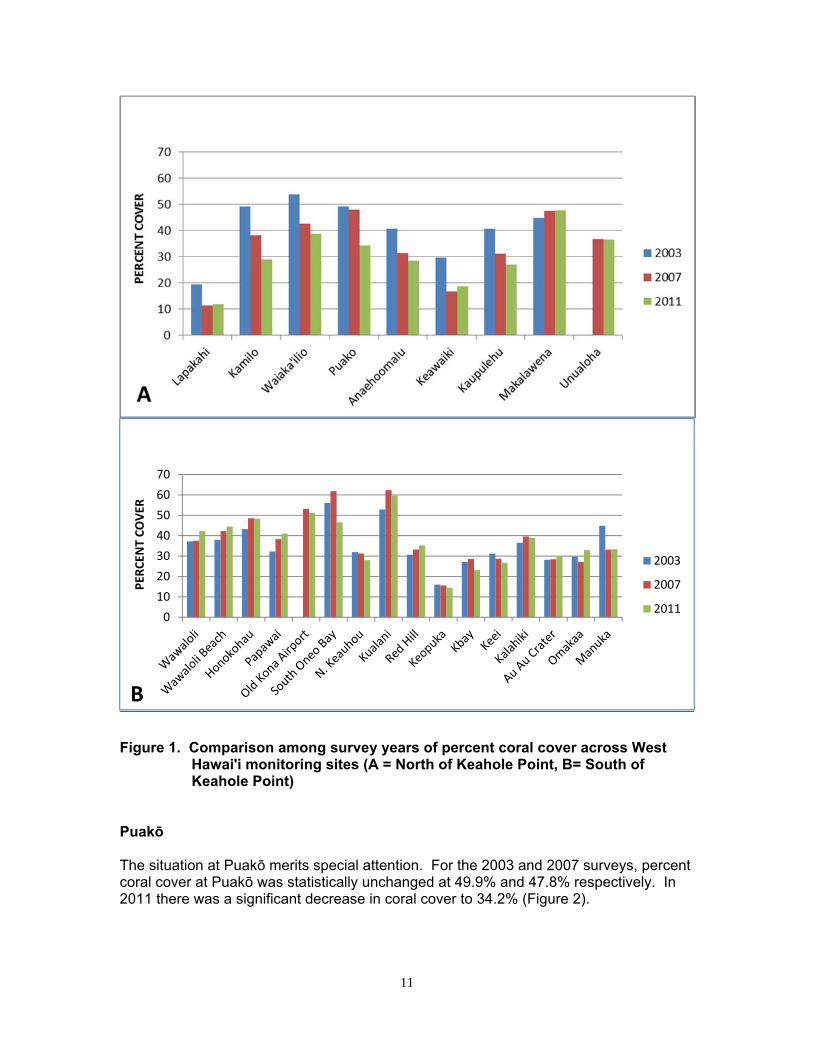
Between Lapakahi, the northernmost site, and Keahole Point, a distance of approximately 37 coastal miles, there are 9 survey sites. One site, Unualoha, was added in 2007 and therefore no comparative data is available. Of the 8 “northern” sites (north of Keāhole Point) that were compared, 6 showed statistically significant declines in total coral cover between 2003 and 2011. Lapakahi, Kamilo, Puakō, ʹAnaeho’omalu Keawaiki, and Kaʹūpūlehu all declined significantly and Waiakaʹilio Bay was almost significant. Only Makalawena showed no significant change (Figure 1). A severe storm with large swells caused extensive coral damage along the West Hawaiʹi coast north of Keāhole Point in January 2004. This damage was noted during surveys

10
soon after the storms occurred. The declines at Kamilo Gulch and Waiakaʹilio Bay may also have been influenced by a major sediment runoff event caused by heavy rainfall in October 2006. A reconnaissance was conducted offshore of several intermittent streams near these sites soon after the event. Thick layers of sediment covering large amounts of coral were observed and sediment was recorded at water depths of 90 feet. Numerous dead coral were observed during subsequent reconnaissance. South of Keāhole Point 15 sites were compared. Three sites, Wawaloli Beach, Papawai Bay and South Oneo Bay showed statistically significant increases in total coral cover between 2003 and 2007. All other sites showed no change.
Table 1. Percent coral cover at West Hawai’i sites in 2003, 2007, 2011
Site (N to S) 2003 2007 2011 ∆ (2007/2011) P = ∆ (2003/2011) P =
Lapakahi 19.50% 11.37% 11.78% 0.41 0.794 -7.69 0.032 Overall Decline, no change from
2007 to 2011
Kamilo 49.50% 38.19% 28.96% -9.23 0.000 -20.27 0.004 Overall Decline
Waiaka'ilio Bay 54.40% 42.50% 38.78% -3.72 0.089 -15.13 0.054 Overall Decline, no change from
2007 to 2011
Puakō 49.09% 47.83% 34.21% -13.63 0.001 -14.88 0.002 Overall Decline mainly between
2007/2011
ʹAnaeho'omalu 40.58% 31.47% 28.43% -3.04 0.147 -12.15 0.005 Overall Decline, no change from
2007 to 2011
Keawaiki 29.66% 16.73% 18.68% 1.95 0.220 -10.98 0.031 Overall Decline, no change from
2007 to 2011
Kaʹūpūlehu 40.71% 31.15% 27.05% -4.09 0.171 -13.66 0.030 Overall Decline, no change from
2007 to 2011
Makalawena 44.88% 47.57% 47.63% 0.06 0.992 2.76 0.489 No Change
Unualoha N/A 36.82% 36.51% -0.31 0.873 N/A N/A No Change (only measured
from 2007/2011
Wawaloli 37.21% 37.51% 42.26% 4.74 0.061 5.05 0.140 No overall change, increasing
from 2007/2011
Wawaloli Beach 37.93% 42.25% 44.45% 2.20 0.479 6.52 0.187 No Change
Honokōhau 43.22% 48.54% 48.32% -0.22 0.940 5.10 0.437 No Change
Papawai 32.31% 38.31% 41.05% 2.75 0.506 8.84 0.173 No Change
Old Kona Airport N/A 53.16% 51.19% -1.97 0.570 N/A N/A No Change (only measured
from 2007/2011
S. Oneo Bay 56.09% 61.86% 46.55% -15.31 0.019 -9.54 0.054 Overall Decline mainly between
2007/2011
N. Keauhou 31.92% 31.28% 28.00% -3.28 0.134 -3.92 0.165 No Change
Kualanui Pt. 52.81% 59.78% 62.35% +2.57 0.358 9.54 0.034 Overall Increase
Red Hill 30.68% 33.22% 35.26% 2.04 0.470 4.58 0.148 No Change
Keopuka 15.98% 15.59% 14.44% -1.15 0.600 -1.54 0.559 No Change
Kealakekua Bay 27.10% 28.64% 23.11% -5.53 0.288 -3.99 0.219 No Change
Ke'ei 31.20% 28.67% 26.70% -1.96 0.543 -4.50 0.379 No Change
Kalahiki 36.53% 39.62% 38.94% -0.68 0.720 2.41 0.026 Overall Increase
Ho'okena (Auau) 28.18% 28.44% 29.98% 1.54 0.671 1.80 0.109 No Change
Miloli'i (Omaka'a) 29.76% 27.08% 32.94% 5.86 0.052 3.18 0.414 Increase from 2007/2011
Manukā 30.35% 33.17% 33.36% 0.19 0.961 3.01 0.689 No Change
11
Figure 1. Comparison among survey years of percent coral cover across West
Hawaiʹi monitoring sites (A = North of Keahole Point, B= South of Keahole Point)
Puakō The situation at Puakō merits special attention. For the 2003 and 2007 surveys, percent coral cover at Puakō was statistically unchanged at 49.9% and 47.8% respectively. In 2011 there was a significant decrease in coral cover to 34.2% (Figure 2).
0
10
20
30
40
50
60
70
PER
CEN
T COVER
B
2003
2007
2011

12
(A) Puakō 2007 (B) Puakō 2011
Figure 2. Same approximate location over time showing significant loss of Porites lobata (∆ -6% between survey years)
Minton, et al. (2012) reports a severe decline in coral cover from 80% in the mid 1970’s to 32% in 2010. (DAR 2011 analysis showed 34.1% coral cover in 2011). The report theorizes a number of causes primarily due to human impacts (overfishing and local land based pollution). Plans for development in the area call for 4,000 new homes to be built. With this staggering increase the potential for catastrophic anthropomorphic impacts to the reefs in this area should not be ignored. The South Kohala Conservation Action Plan developed by a multi-agency team addresses many of the problems affecting this shoreline. Coastal development will inevitably increase in West Hawaiʹi. This plan addresses one relatively small but important area of the coast. More conservation plans of this nature should be considered before irrevocable impacts occur. In addition, surveys conducted in 2010 and 2011 as part of a coral health monitoring program conducted by Courtney S. Couch (Cornell University Ph.D candidate) in collaboration with DAR showed algal overgrowth and the resulting coral tissue mortality occurred at all eight DAR sites surveyed, including Puakō (WHAP Site 4). In the majority of cases of active algal overgrowth, the red filamentous algae Corallophila huysmansii was the primary contributor to coral tissue mortality (Couch et al. in prep) and therefore may be also be contributing to the significant loss of coral cover at Puakō. Octocoral Distribution Benthic surveys revealed a most interesting distribution of one or more species of octocorals centered on the urbanized areas of Kailua-Kona. The Bishop Museum checklist (http://www2.bishopmuseum.org/HBS/invert/results.asp) lists 11 species of shallow water octocorals occurring in Hawai‘i. At least one of the species in question appears to be the blue octocoral Sarcothelia (Anthelia) edmondsoni - Figure 3) although the taxonomy of the group is somewhat confused. The original taxonomic description for S. edmondsoni is actually a brown morph common in calm lagoons on the windward side. The blue morph is more abundant in fore reef areas with heavy wave surge and is most likely a separate species. Both varieties have long histories in Hawai’i and are presumably native and/or endemic (S. Kahng, pers. comm.).

13
Figure 3. Sarcothelia edmonsoni (left) and another unidentified octocoral found
on West Hawai’i reefs The apparent concentration of Sarcothelia edmondsoni in the vicinity of Honokōhau Harbor and Kailua Bay (Figure 4) may suggest anthropogenic influence on the distribution of octocoral in West Hawaiʹi. Published studies have suggested that octocorals may be indicators of pollution (Baker and Webster 2010, Hernandez-Munoz et al. 2008). With the planned increase in development in these areas and the possible associated rise in point source pollution further investigation into octocoral distribution and its potential as a pollution indicator is suggested.
Figure 4. Comparison between survey years of percent cover of octocoral across
West Hawai‘i monitoring sites An analysis of octocoral percent cover (Table 1, Appendix H), showed no statistically significant changes from 2007 to 2011. Between 2003 and 2011 only one site, Papawai,

14
changed significantly from 18.2% in 2003 to 6.9% in 2011 (P=0.03). Although no octocoral was detected at Puakō during these surveys it has been observed there in small quantities by other researchers. Given the long term decline in reef health at Puakō and the continued plans for increased development in the area continued monitoring and investigation of this site is particularly important. Coral Disease Methodology Coral disease surveys were conducted at 28 West Hawaiʹi sites, and at Okoe and Hōnaunau Bays. Surveys were conducted from March to July 2010 by four survey divers: Courtney Couch (Cornell University), Camille Barnett (DAR), Kara Osada-D’Avella (DAR), and Linda B. Preskitt (DAR). Two permanent transects were surveyed at each site. Field surveys An area of 1 x 25 meters was surveyed for coral disease along each transect. Larger areas were surveyed at sites with low occurrences of disease, while (due to time constraints) the full 25 m2 was not surveyed at several sites with high disease frequency. Disease assessment included all corals within the survey area inspected for signs of trematodiasis, growth anomalies, tissue loss syndrome, multifocal tissue loss, hypermycosis, and other progressive conditions. When disease was present, colony size and species were recorded along with the number, size, shape and color of the lesion(s) observed. All diseased colonies were photographed and described, excluding colonies with only Porites trematodiasis. In addition, 1-2cm fragments from diseased coral colonies were sampled for histological analyses, helping to further differentiate between tissue loss and biological interactions (e.g. predation). Colony assessment Colony counts were conducted in conjunction with coral disease surveys. For each transect line, a 1 x 10 meter area was surveyed with the aid of a 1m square quadrat. Each coral colony within the survey area was recorded to species level and assigned to one of seven size classes; 0-5cm, 5.1-10cm, 10.1-20cm, 21.1-40cm, 41.1-80cm, 81.1-160cm and >160cm. Calculations and Analyses We calculated mean colony density (colonies/m2) for each site by averaging the number of colonies of each genus on both transects and dividing by the average area surveyed for each site. Mean colony density was then multiplied by the area surveyed for disease to obtain estimated number of colonies. At each site we calculated total estimated disease prevalence for each disease as follows: (total no. cases of a specific disease for the genus) ÷ (estimated number of colonies for the genus). Total disease prevalence for each site was calculated using the method described above using total number of colonies and total number of diseased cases for each site (all genera combined). In 2007, Dr. Greta Aeby and Steve Cotton (DAR) conducted initial coral disease surveys at 10 WHAP sites (Appendix Table A) (DAR 2007). This dataset was compared with

15
data collected in 2010 to assess changes in coral disease frequencies. Prevalence (% of diseased colonies per site) data between the two surveys were not comparable due to substantial differences in colony counts between 2007 and 2010, with significantly more small colonies (colonies <10cm) counted in 2010 than 2007. This difference was believed to be due to observer changes rather than biological changes. Therefore, data were compared using disease abundance per m2 rather than disease prevalence. Coral disease prevalence data were non-parametric; therefore Spearman rank correlation analyses were employed. Paired t-tests were used for comparisons of disease per m2 between 2007 and 2010 surveys at ten WHAP sites (JMP® v8.0.2.2, ©2009 SAS Institute Inc.) Results
Coral disease by size class
Coral diseases were observed across all colony size classes, with the greatest percentages of disease cases occurring in the larger size categories (Figure 5). Coral colonies less < 5cm accounted for 18% of total colonies (18.3% of Porites spp.) recorded in count surveys, yet accounted for only 1% of the total cases of diseased colonies (1.1 % of Porites spp.).
Figure 5. Size structure of coral colonies recorded in West Hawaiʹi during surveys conducted in 2010. Percentages reflect % of diseased colonies recorded within each size class
0
1000
2000
3000
4000
<5 cm 5.1-10 cm 10.1-20 cm 20.1-40 cm 40.1-80 cm 80.1-160 cm >160 cm
no.
co
lon
ies
Size class
Total no. disease cases
Total no. colonies
7.1% 2.0% 42.4%
1.0% 227% 2.9% 163%

16
These findings imply West Hawaiʹi’s small corals (<5 cm) are less susceptible to disease than the larger and subsequently older colonies. Linear growth rates of coral colonies are both species and size specific, and are affected by a suite of environmental factors such as depth, temperature, light irradiation and latitude. Therefore it is difficult to age colonies based on size. Given an overall slow growth rate (ranging from 7.4 – 16.7 mm/yr.) of the dominant reef builder Porites and the relative contribution of gametes that large colonies provide, it is important to continue monitoring coral disease prevalence as they may have long-term effects on coral populations and community structure (Rodgers & Cox 2003; Forsman et al. 2006, Richmond 1987; Grigg & Maragos 1974, Lough & Barnes 2000). Why more diseased colonies than total colonies recorded? Larger colonies tended to occur near the end of survey lines, therefore the number of diseased colonies are greater than total colonies counted due to the methodology employed; coral colonies were counted and sized for the first 10m of each transect, while disease assessments were made along the full 25m line. Coral community structure Percent coral cover in 2011 surveys varied across sites, ranging from 11.8% at Site 1 (Lapakahi) to 62.4% at Site 16 (Kualanui Pt.) (Appendix B, Table1). Within all monitoring sites, Poritids were the most abundant corals, while densities of other coral genera were variable across sites. Coral colony density was not significantly related to percent coral cover (Spearman p = -0.2626, p > 0.1). Rather, high coral density reflects an abundance of small colonies. Spearman rank correlations revealed significant negative relationships between overall colony density and total disease prevalence (ρ = -0.5276, p = 0.0033). However, total disease prevalence was positively related to percent coral cover (ρ = 0.4291, p = 0.0202). In other words, higher disease prevalence was observed on reefs with high coral cover and lower colony density, which is likely due to the increase in disease susceptibility with colony size. When relationships were analyzed by genus, Porites followed the same trend as described above. Porites growth anomalies and Porites tissue loss syndrome were positively correlated with percent cover of Porites sp. (ρ = 0.4444, p = 0.0178 and ρ = 0.3804, p = 0.0458) and negatively related to Poritid density (ρ = -0.7200, p < 0.001 and ρ = -0.5600, p = 0.0016). Frequency of Porites diseases may be attributed to the dominance of Poritid corals in West Hawai‘i reef communities possibly allowing the spread of pathogens or creating a susceptibility to disease within the genus. Coral diseases in West Hawaiʹi At 30 sites surveyed in West Hawaiʹi, the following diseases were recorded within each specified genus: growth anomalies (GA) of Poritids and Montiporids, Porites trematodiasis (TRE), tissue loss syndrome (TLS) within Porites and Pocillopora, Porites multifocal tissue loss (MFTL), and hypermycosis (HYP) of Pavona (Figure 6).

17
The above diseases have been previously described (Coral Disease Working Group 2007, Williams et al. 2010), however we observed a number of cases of a distinct type of tissue loss in Pocillopora meandrina. The lesion was characterized by progressive tissue loss from one side of the colony with old algae-covered skeleton grading into recently denuded skeleton to sloughing and into apparently healthy tissue. The tissue loss appears to originate and progress from the base of each branch, with a clear band of freshly denuded skeleton at the lesion margin. We also recorded cases of possible Pocillopora senescence. This condition is common along West (C. Couch pers. obs.) and East Hawai‘i (B. Vargas-Angel pers. comm.) In most cases colony death originates on one side of the colony and progresses across the colony. Algal covered skeleton is adjacent to paled/bleached tissue, which grades into “normally” pigmented tissue. Samples sent to United States Geological Survey (USGS) Biological Resources Division for analyses revealed atrophy, appearing to be a senescence reaction (or progressive death of the colony, perhaps due to age) (Figure 6).
A
Porites evermanni
B
Porites compressa
C
Porites lobata
D
Porites lobata
E
Montipora capitata
F
Pavona varians
G
Pocillopora meandrina
H
Pocillopora meandrina
Figure 6. Examples of coral diseases observed in West Hawaiʹi during 2010
baseline surveys: A) Porites growth anomaly, B) Porites tissue loss syndrome, C) Porites multifocal tissue loss, D) Porites trematodiasis, E) Montipora growth anomaly, F) Pavona varians hypermycosis, G) Pocillopora tissue loss, H) possible senescence reaction
Disease distribution and prevalence Consistent with previous coral disease assessments in the Main Hawaiian Islands (Aeby and Cotton 2007, Williams et. al 2010), Porites was the most susceptible genus to disease, having the highest disease prevalence (3.76 ± 3.58 %) and most types of diseases compared to other genera. The most widespread diseases observed were growth anomalies, trematodiasis, and tissue loss of Porites spp. (Table 2 Figure 7, Appendix A)

18
Table 2. Occurrence of diseases across ten monitoring stations in survey years 2007 and 2010 in West Hawai‘i. Presence during only one survey year is noted by the year when it was observed, with "X" denoting presence for both survey years
Disease SITE
3 SITE
4 SITE
5 SITE
8 SITE
97 SITE
11 SITE
15 SITE
17 SITE
19 SITE 20
Porites trematodiasis 2007 X X X X X X X X X
Porites tissue loss X 2010 2010 X 2007 X X 2007 X X Porites multifocal tissue loss
X 2007 2010
Porites growth anomaly 2010 X X X 2007 X X X X X
Pavona hypermycosis 2010 2010 2010 Montipora white syndrome
2007
Montipora growth anomaly
2007 X 2010
Pocillopora senescence reaction
2010
Pocillopora tissue loss
Figure 7. Relative abundance of coral diseases recorded for DAR monitoring sites
in West Hawai‘i during surveys conducted in 2010 Although Porites growth anomalies were found at all but two sites (Sites 6, Keawaiki and Site 97, Unualoha Pt.), mean prevalence across all sites was low (1.83 ± 2.15 %),

19
ranging from 0.02 % at Site 10 (Wawaloli Beach) to 7.81% at Site 11 (Honokōhau) (Figure 43). Porites trematodiasis, the second most common disease, was found at all but the following four sites: Site 2 (Kamilo Gulch), Site 3 (Waiaka‘ilio), Site 18 (Keopuka), and Site 21 (Kalahiki Beach). Mean prevalence across all sites was low (1.71 ± 2.17%), ranging from 0.05 % at Site 1 (Lapakahi) to 9.03% at Site 8 (Makalawena) (Figure 8). Porites tissue loss syndrome occurred at all but the following sites: Site 1 (Lapakahi), Site 6 (Keawaiki), Site 7 (Ka‘ūpūlehu), Site 97 (Unualoha Pt.), and Site 17 (Red Hill). Mean prevalence across all sites was low (0.21 ± 0.18 %), ranging from 0.02 at Site 10 (Wawaloli Beach) to 0.65 % at Site 23 (Omaka‘a Bay) (Figure 8).
Figure 8. Prevalence of Poritid diseases at each West Hawai‘i site surveyed in
2010
0
2
4
6
8
1 2 3 4 5 6 7 8 97 9 10 11 13 98 14 15 15x 15y 15z 16 17 18 19 20 HO 21 22 23 99 24
prev
alen
ce (
%) Porites growth anomaly
0
2
4
6
8
1 2 3 4 5 6 7 8 97 9 10 11 13 98 14 15 15x 15y 15z 16 17 18 19 20 HO 21 22 23 99 24
prev
alen
ce (
%) Porites trematodiasis
0
2
4
6
8
1 2 3 4 5 6 7 8 97 9 10 11 13 98 14 15 15x 15y 15z 16 17 18 19 20 HO 21 22 23 99 24
prev
alen
ce(%
)
Site
Porites tissue loss

20
Although possible senescence reaction of Pocillopora meandrina appears commonly in West Hawai‘i (see section entitled Diseases in West Hawaiʹi), this condition was observed at only two sites: 97 (Unualoha Pt.) and 22 (Hoʹokena). This infrequent documentation of cases is likely attributed to the low number of Pocilloporids occurring at DAR monitoring sites, as P. meandrina accounts for an average of 0.83% of total coral cover at WHAP sites Spatial Patterns Anthropogenic impacts such as coastal pollution are hypothesized to result in physiological stress and altered host-pathogen interactions, leading to changes in coral health and coral reef community structure (Harvell et al. 2007). While the mechanisms underlying the link between coral disease and water quality are poorly understood, diseases such as growth anomalies have been positively associated with high human use and impaired water quality in the Pacific (Yamashiro et al. 2000, Kaczmarsky 2009, Aeby et al. 2011). Due to Hawaiʹi’s highly porous basaltic rock, terrestrial inputs are transported rapidly through submarine groundwater (Knee et al. 2010). Data collected by Johnson (2008) documented areas with submarine groundwater discharge (SGD) “plumes” between Kawaihae and Hōnaunau. Disease prevalence at DAR monitoring sites was analyzed in relation to these SGD plumes (data were available for a total of 14 monitoring sites within the region documented). Overall disease prevalence and prevalence of Porites growth anomalies were positively correlated with total estimated size of SGD plumes (total prevalence r = 0.460, p = 0.098, Porites GA r = 0.586, p = 0.028) and number of SGD plumes (total prevalence r = 0.612, p = 0.020, Porites GA r = 0.744, p = 0.002) located within the vicinity of each site (<1.5 km). These results show high nutrient loading may be affecting West Hawai’i’s coral health. Additionally, sites surveyed in West Hawaiʹi show a significant negative relationship between disease prevalence and distance from harbors/boat ramps (overall disease prevalence: r = -0.402, p = 0.028) (Figure 9). The most frequently occurring diseases, Porites growth anomalies and Porites tissue loss syndrome showed decreased prevalence with greater distance to these usage areas (Porites GA r = -0.701, p = 0.0001, Porites TLS r = -0.658, p = 0.0001). Similar to previous findings, the distribution of Porites trematodiasis, a disease known to be transmitted by fishes, particularly corallivores, was not associated with these locations (Aeby 2007).

21
Figure 9. Disease prevalence in relation to site distance from harbors/boat ramps
in West Hawaiʹi for overall disease prevalence (r = -0.402, p = 0.028), Porites growth anomalies (GA) (r = -0.658, p = 0.000) and Porites tissue loss syndrome (TLS) (r = -0.701, p = 0.000)
Prior studies have also found relationships between abundances of reef fish and prevalence of particular coral diseases. Various fishes are known to impact corals directly (such as the grazing of parrotfish) as well as transmit diseases (such as corallivorous butterflyfish) (Williams et al. 2010). Aeby et al. 1998 also found the highest trematodiasis at sites with intermediate percent coral cover. Using fish abundance data from WHAP surveys, sites were compared for Poritid disease prevalence to corallivorous butterflyfish and parrotfish abundances. However, no statistically significant relationships were found between these fish groups and coral disease prevalence for West Hawai’i’s reefs. Temporal comparisons Comparisons of disease density (instances per square meter) between 2007 data and 2010 revealed no significant changes in disease densities between survey years (t = -1.46, p = 0.18). Though changes were not significant, Porites trematodiasis slightly increased at most sites (Figure 10).
0
2
4
6
8
10
12
14
0 5 10 15 20 25
pre
vale
nce
(%)
Proximity to Harbors (km)
Total disease
Porites GA
Porites TLS

22
Figure 10. Comparison between survey years (2007 vs. 2010) of diseased colony
densities for three types of Poritid conditions at 10 sites in West Hawaiʹi
Instances of Porites growth anomalies and Porites tissue loss syndrome increased (though not significantly) at four sites: Sites 4 (Puakō), 5 (Mauna Lani), 11 (Honokōhau) and 15 (Keauhou). Each of these sites is located in close proximity to harbors and boat ramps. As described in the previous section, diseases have been positively associated with high human use. Although no significant change in disease frequency was found, the change in presence or absence of two diseases was noted. Montipora white syndrome was not recorded in
0
0.02
0.04
0.06
0.08
0.1
3 4 5 8 97 11 15 17 19 20
no. diseased colonies per m
2
2007
2010
Tissue loss syndrome p = 0.61
0
0.5
1
1.5
2
2.5
3 4 5 8 97 11 15 17 19 20
no. diseased colonies per m
2
2007
2010
Trematodiasisp = 0.46
0
0.2
0.4
0.6
0.8
1
1.2
3 4 5 8 97 11 15 17 19 20
no. diseased colonies per m
2
2007
2010Growth anomaly
p = 0.14

23
surveys in 2010, though one case was recorded in 2007. Pocillopora tissue loss (including senescence reaction) and Pavona varians hypermycosis were not recorded in 2007 surveys, but occurred at multiple sites in 2010. For Pavona varians hypermycosis, this includes some sites previously surveyed (Table 2). Temperature data Hobo® temperature loggers (Onset Computer Corporation) were initially deployed at all West Hawaiʹi Fish Replenishment Area (FRA) sites (Figure 13). They were attached via cable tie to a coral head in the immediate vicinity of the center transect pin. Due to various circumstances including loss and flooding (i.e. multiple Hobo® Water Temp Pro units failed) a complete temperature record over the last decade is not available for any site. Fortunately fairly comprehensive temperature data exists for several West Hawai’i sites including a northerly site (Waiakaʹilio), a southerly site (Miloliʹi) and a central site (Keʹei) (Figure 11). Examination of the temperature data reveals a marked similarity in water temperatures along coastal sites separated by considerable distances. From 1999 to 2005 there was a clear trend of increasing water temperatures along the West Hawaiʹi coastline. Over this 6 year period water temperatures increased by 1.8-2.7°F. For comparison, surface water temperate records at Koko Head, Oʹahu only increased by 1.4°F over a 50 year period (NMFS + IGLOSS corrected data provided by Paul Jokiel). Trend analysis suggested that if West Hawaiʹi water temperatures continued to increase at the ‘99/’05 rate, the lethal thermal limit for corals (i.e. 30 day exposure to mean water temperature of 29.6°C) would likely be reached within a decade. However sometime around 2006/2007 the increasing temperature trend ceased and overall water temperatures declined over the next four years. A slight increase in 2012 has resulted in slightly elevated water temperatures (x = 0.39ºF) during the warmest months of the year August – October (Table 3). Table 3. Mean water temperatures (August-October) at 3 West Hawaiʹi sites
1999 2012 Δ Waiakaʹilio 79.24ºF 79.50ºF ↑0.26ºF Keʹei 79.12ºF 79.63ºF ↑0.51ºF Miloliʹi 78.89ºF 79.38ºF ↑0.39ºF
The most recent El Niño event to occur began in June 2009, peaked in November and December of the same year and waned in March 2010. It was effectively over by June 2010 (Jet Propulsion Laboratory web site). Although El Niño periods are characterized by warmer than usual equatorial waters, West Hawai′i coastal waters were only marginally warmer than the preceding two years. Mean water temperatures for the four month period of Oct 09-Jan10 was 78.9°F which was only 0.4 - 0.5°F warmer than the previous periods (Oct-07-Jan 08 = 78.5°F; Oct 08-Jan 09 = 78.6°F). Examination of the temperature records also shows that water temperatures in several of the previous non-El Niño years (e.g. 2004/2005) were generally higher than during the recent El Niño event.

24
Waiaka′ilio FRA
Ke′ei FRA
Miloli′i FRA Figure 11. Temperature records for 3 FRAs with 2nd order polynomial trend line Fish Surveys

25
Although the DAR fish survey protocol for West Hawaiʹi was initially designed to focus primarily on species which are the principal targets of the aquarium fishery it has proven to be a highly useful methodology for general coral reef monitoring and has been adopted by DAR for monitoring on other islands. It’s important to note that all fishes are censused, whether they’re aquarium species or not. While the protocol is particularly effective for assessing recruits, smaller site-oriented species and those not wary of divers, it also provides highly useful information on other groups including predators, invertebrates and “food” fishes. Fish Survey Methods To obtain high-resolution data on the fish community at specific sites over time, a series of short (25-m-long) fixed transects were permanently installed in 1999 (as above in the Benthic Monitoring section). At each site, stainless steel eyebolts are drilled and epoxied into the reef at the start and end of 4 permanent transects. Transects are arrayed in an ‘H’ pattern: 2 parallel rows of 2 transects (one deep row and one shallow row), with 10 m between transects in each row and between rows. Six stainless steel eyebolts (the circles in Figure 12) permanently mark the end points of the four 25m transect lines. Each transect is surveyed by a pair of divers swimming in parallel on either side of the transect line, each diver recording all fishes within a 2 m-wide belt on their side of the line. Divers first swim rapidly down the transect recording larger mobile fishes transiting the line, mid-water species and any conspicuous rare or uncommon species. They then turn around and return back down the same transect slowly and carefully recording all other fishes in and around the benthos within the same 2m-wide belt.
Figure 12. Diagram of fixed transect fish survey configuration All species of fishes are recorded and sized, with particular attention to small site-attached or semi-cryptic species, fish recruits, and total fish community richness. Data from the two observers on a transect are then pooled into one 4 m x 25 m transect, with a total of four replicate 4 m x 25 m transects distributed across the ‘H’ sampling design. The sizes of all fishes are visually estimated to the nearest 5 cm and recorded in 5cm bins (i.e. 1-5cm=”A”, 6-10cm=”B”, 11-15cm=”C”, etc.). Measured hash marks on the top of diver-held data slates serve as visual size references. Fishes whose sizes indicate they have recently recruited are noted as “R”.
10 m buffer
A B
C D
Team 1 swims Team 2 swims
25m

26
The size estimates of the fish are then converted to biomass using known length-weight relationships (www.fishbase.org) and unpublished data from the Hawai'i Cooperative Fishery Research Unit). This methodology was initially developed on Hawai’i Island and is presently utilized both on Oʹahu and Maui. DAR monitored 23 sites in West Hawaiʹi (Figure 13) bi-monthly, for a total of six surveys per year (five in 2000 due to logistic problems) from 1999 until Jan. 2005 when the project was revamped at which time surveys became quarterly. Additional survey sites (Unualoha Pt. and Okoe Bay) were added at this time and another (Old Kona Airport) was added in 2007.
Figure 13. West Hawai′i monitoring sites These fixed transect surveys are noted as Small scale (SS) surveys in Table 4. Similar monitoring has also been conducted at three sites in East Hawaiʹi although on a less systematic schedule. In addition to the transect surveys, a 10 minute ‘free-swim’ survey is also conducted by two divers in the areas surrounding the fixed transects. The purpose of this survey is to
27
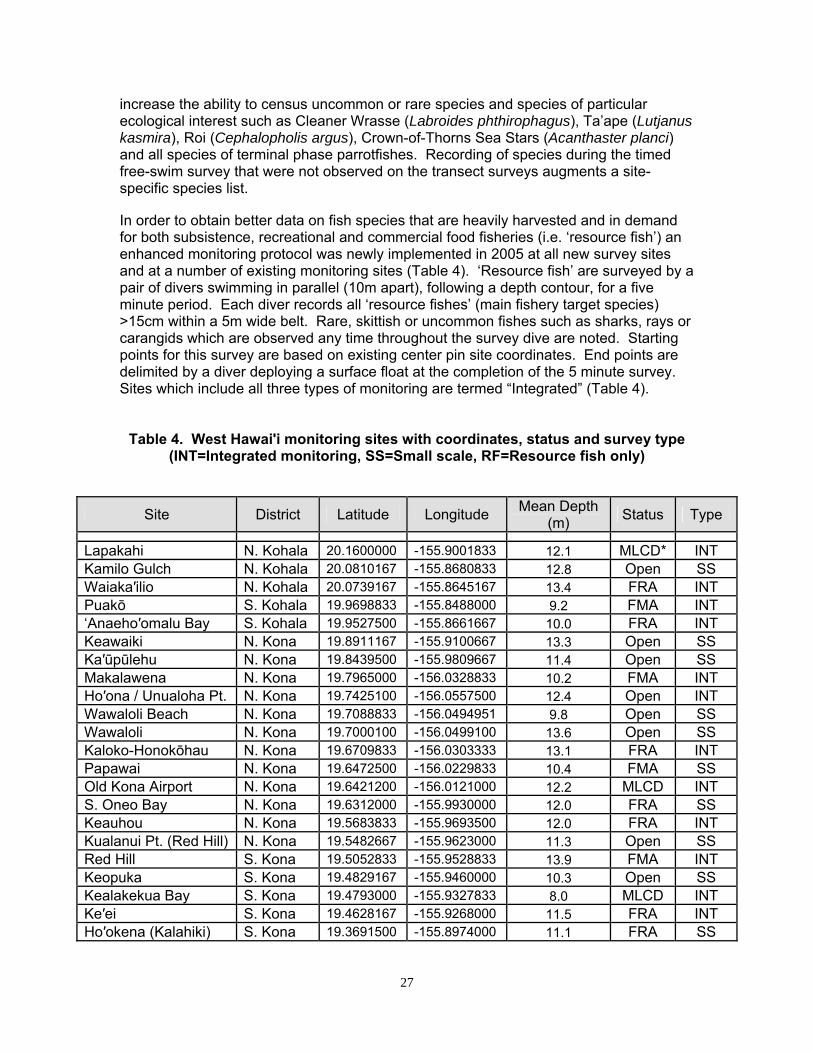
increase the ability to census uncommon or rare species and species of particular ecological interest such as Cleaner Wrasse (Labroides phthirophagus), Ta’ape (Lutjanus kasmira), Roi (Cephalopholis argus), Crown-of-Thorns Sea Stars (Acanthaster planci) and all species of terminal phase parrotfishes. Recording of species during the timed free-swim survey that were not observed on the transect surveys augments a site-specific species list. In order to obtain better data on fish species that are heavily harvested and in demand for both subsistence, recreational and commercial food fisheries (i.e. ‘resource fish’) an enhanced monitoring protocol was newly implemented in 2005 at all new survey sites and at a number of existing monitoring sites (Table 4). ‘Resource fish’ are surveyed by a pair of divers swimming in parallel (10m apart), following a depth contour, for a five minute period. Each diver records all ‘resource fishes’ (main fishery target species) >15cm within a 5m wide belt. Rare, skittish or uncommon fishes such as sharks, rays or carangids which are observed any time throughout the survey dive are noted. Starting points for this survey are based on existing center pin site coordinates. End points are delimited by a diver deploying a surface float at the completion of the 5 minute survey. Sites which include all three types of monitoring are termed “Integrated” (Table 4).
Table 4. West Hawaiʹi monitoring sites with coordinates, status and survey type (INT=Integrated monitoring, SS=Small scale, RF=Resource fish only)
Site District Latitude Longitude Mean Depth
(m) Status Type
Lapakahi N. Kohala 20.1600000 -155.9001833 12.1 MLCD* INT Kamilo Gulch N. Kohala 20.0810167 -155.8680833 12.8 Open SS Waiaka′ilio N. Kohala 20.0739167 -155.8645167 13.4 FRA INT Puakō S. Kohala 19.9698833 -155.8488000 9.2 FMA INT ‘Anaeho′omalu Bay S. Kohala 19.9527500 -155.8661667 10.0 FRA INT Keawaiki N. Kona 19.8911167 -155.9100667 13.3 Open SS Ka′ūpūlehu N. Kona 19.8439500 -155.9809667 11.4 Open SS Makalawena N. Kona 19.7965000 -156.0328833 10.2 FMA INT Ho′ona / Unualoha Pt. N. Kona 19.7425100 -156.0557500 12.4 Open INT Wawaloli Beach N. Kona 19.7088833 -156.0494951 9.8 Open SS Wawaloli N. Kona 19.7000100 -156.0499100 13.6 Open SS Kaloko-Honokōhau N. Kona 19.6709833 -156.0303333 13.1 FRA INT Papawai N. Kona 19.6472500 -156.0229833 10.4 FMA SS Old Kona Airport N. Kona 19.6421200 -156.0121000 12.2 MLCD INT S. Oneo Bay N. Kona 19.6312000 -155.9930000 12.0 FRA SS Keauhou N. Kona 19.5683833 -155.9693500 12.0 FRA INT Kualanui Pt. (Red Hill) N. Kona 19.5482667 -155.9623000 11.3 Open SS Red Hill S. Kona 19.5052833 -155.9528833 13.9 FMA INT Keopuka S. Kona 19.4829167 -155.9460000 10.3 Open SS Kealakekua Bay S. Kona 19.4793000 -155.9327833 8.0 MLCD INT Ke′ei S. Kona 19.4628167 -155.9268000 11.5 FRA INT Ho′okena (Kalahiki) S. Kona 19.3691500 -155.8974000 11.1 FRA SS

28
Ho′okena (Auau) S. Kona 19.2978833 -155.8898833 13.6 Open SS Miloli′i/Honomalino S. Kona 19.1673000 -155.9132500 12.3 FRA INT Okoe Bay Ka’u 19.6421200 -156.0121000 16.5 FRA RF Manukā Ka’u 19.0767167 -155.9039667 12.0 Open SS
Shallow Water Resource Fish Surveys Shallow water resource fish surveys collect data on the abundance of resource (desired) fish species in shallow water habitats where they are typically most abundant during the day in West Hawai′i. These surveys were designed to be comparable with our standard
Figure 14. Map showing locations of shallow water resource fish surveys and laynet prohibited areas resource fish surveys occurring in mid-depth habitats, and thus the methodology is very similar. As with the other resource fish surveys, distance covered is measured for every survey so that data can be analyzed on a per unit area basis. Initially 72 sites were selected evenly distributed along the coastline in 2-6m of water between our northern and southernmost permanent study sites (Figure 14). Using a GIS (ArcGIS 9.2), the 72 points were overlaid on a NOAA habitat map for the purpose of adjusting any sites that did not fall on hard-bottom habitat. Direction taken for the survey was predetermined

29
when habitat was an issue. Otherwise survey direction (north or south) from the start point was determined in the field. Each site is surveyed only once. The survey consists of a timed 10min swim along the coastline with divers being careful to remain in the target depth of 2-6m. When the survey is finished, the boat captain records an end point so that the distance covered can be later calculated. The dive team consists of two divers both surveying a single 5m wide belt. One diver is counting surgeonfish, goatfish, and introduced species above 15cm except for Acanthurus achilles and A. triostegus for which individuals above 10cm are recorded. The other diver counts parrotfish, wrasses, other resource fish, and selected rare butterflyfish of interest. Large predatory fish appearing off transect are also recorded. Adult Yellow Tang surveys To supplement data from the long-term monitoring program and to investigate the possibility of ‘spillover’ of adult fish from existing protected areas, we survey adult Yellow tang populations in their prime daytime habitat, i.e. the deep edge of the shallow pavement zone around 3 to 6 m deep. Along the West Hawai′i coast, shallow pavement areas generally have a distinct deep boundary where the main reef slope begins and where coral cover increases rapidly, and therefore the target habitat zone for our surveys was mostly well defined. Recognizing that adult Yellow Tang have highly clumped distributions, we developed a survey approach which allows divers to count Yellow Tang over long transects running approximately parallel to shore through the prime adult habitat. There are 4 AYT sites within FRAs, 4 within long-term protected areas (LTP); and 8 in open, i.e. fished, areas. As adults have daily movements between diel and night time areas of up to at least 800 m we assumed that there could be spillover across protected area boundaries over at least that scale. We therefore established 4 open sites as ‘boundary’ sites, centered < 1 km from the nearest protected area boundary, and 4 as ‘open’ sites with mid-points > 2 km from the nearest boundary. Each area was surveyed 5 times in 2006 and 6 times in 2010. The survey technique and initial findings of significant spillover of Yellow Tang from protected to open areas is contained in Williams et al. 2009. Depth Stratified Random Surveys In response to a long standing conflict between aquarium fish collectors and the local community at Ka′ohe (Pebble Beach), South Kona, a DLNR community advisory group, the West Hawai′i Fisheries Council (WHFC) recommended in 2006 that the area at Ka′ohe be closed to aquarium collecting. To maintain the existing balance of open and closed areas the WHFC also recommended that a similarly sized protected area be opened to collecting at Keauhou which is presently an FRA. Considerable disagreement ensued however surrounding the nature and abundance of the resources within the proposed open area so DAR embarked on an effort to accurately assess the populations of a number of species of interest. 72 random, depth stratified, transects were conducted in the Keauhou FRA (Figure 15) in July 2008 to derive area population estimates. Survey methodology closely follows the methodology described above for 25m fixed transects but with two rather than four 25m X 4m transects at each random point. In addition, three fixed transect sites were established at Keauhou to better assess the impact of opening a closed area to aquarium collecting.

30
The Keauhou FRA random survey was repeated in August 2010 and similar surveys have been conducted in the FRA at Ka’ūpūlehu (August 2009), the Red Hill FRA/FMA (April 2009) and open areas at Makolea Pt. (June 2011) and Pa’ao’ao Bay (October 2011). In August 2010 the newly formed Big Island Association of Aquarium Fishers (BIAFF) rejected the opening of an area within the Keauhou FRA as ‘compensation’ for the closure of Kaʹohe. Monitoring of the three additional survey sites at Keauhou was discontinued in 2011.
Figure 15. Map showing the locations of Keauhou stratified random fish
population survey sites. The stratified depth zones are as follows: DP=24-30m, MD=18-24m, MI=9-18m, SH=3-9m
Retrospective Surveys Several long-term retrospective surveys, primarily directed at fish populations, are being conducted at 3 West Hawai′i sites. The sites and the date of the initiation of the original surveys are as follows: Puakō, South Kohala (1979), Ke′ei, South Kona (1978) and Hōnaunau, South Kona (1975). So that new data is comparable with historical data, the same transect locations and survey methodologies are employed as in the original studies. Methods vary by locations, but all are based on standard dimension belts or search areas. Additional benthic data are also being collected. This work is presently under analysis.

31
Results Fish Surveys Fishes on West Hawaiʹi reefs may be regarded as falling into three groups based upon human utilization. Resource or ‘food’ fish such as jacks (Carangidae), goatfishes (mullidae) and parrotfishes (Scaridae) are those targeted for food by recreational and commercial fishers. Aquarium fish are those which are harvested, usually in the smaller size classes, by commercial aquarium collectors although there are some species which fall into both groups (e.g. Kole, Ctenochaetus strigosus and Achilles Tang, Acanthurus achilles) for the present study these are classified solely as aquarium fishes. The third group (‘other’) is species which are harvested neither for food nor for aquaria. The overall number of ‘other’ fishes, those which are not substantially harvested for either food or for the aquarium trade, did not change significantly at West Hawaiʹi sites over the last 14 years although individual species within this group may have. In contrast, the abundance of both aquarium and food fishes increased significantly over the same time period (Figure 16).
Figure 16. Overall temporal trend in mean fish density of three major fish groups
at West Hawaiʹi sites. Aquarium Fishes represents top 20 collected species. Trend line represents 3rd order polynomial smoothing procedure applied to data. Closed triangle = p<0.05 (Spearman rank test)
For aquarium fishes it is clear that a substantial part of the increase in overall numbers is due to the implementation in 2000 of a network of Fish Replenishment Areas (FRAs) along the West Hawaiʹi coast. The aquarium fishery in Hawaiʹi is economically the

32
largest inshore fishery in the state and certainly the most controversial. The management importance of comprehensive and extensive monitoring such as has been underway in West Hawaiʹi for over a decade cannot be underestimated when addressing the issue of this highly controversial fishery. In depth analysis of aquarium collecting impacts is contained in a later section (pg. 41). Examination of the temporal trends of the various trophic groups of reef fishes indicates that herbivores and detritivores have increased over the past 14 years. There have been no overall changes in corallivores, zooplanktivores or sessile invertebrate feeders while piscivores and mobile invertebrate feeders have decreased (Figure 17). The latter two groups are comprised of a number of families (e.g. jacks and goatfishes) which are primarily targeted by food fishers.

33
Figure 17. Temporal trends in mean fish density for various trophic groups of fishes on
West Hawai’i sites. Trend line represents 3rd order polynomial smoothing procedure applied to data. Closed triangle = p<0.05 (Spearman rank test)
The overall increase in the number of herbivores is associated with a recent increase in herbivore biomass within the MPAs (Figure 18). Herbivore biomass in the MPAs is significantly higher (2X) than in the FRAs or the Open areas (ANOVA p<0.001). However there is no difference in herbivore biomass between the FRAs and the Open areas (ANOVA p=0.28). Unlike the MPAs there are declining long term trends of herbivore biomass in both the Open areas (p=0.01) and the FRAs (p=0.04). These factors indicate that aquarium fishing is not driving the decline in herbivore biomass in these areas but rather that other types of fishing (i.e. food fishing) are likely responsible for observed declines.

34
Figure 18. Overall change in herbivore biomass in FRA, MPA and open areas 2003-2012 Introduced species Taʹape From their initial introductions, Taʹape have clearly undergone an expansive period of population growth. Taʹape were only introduced to the island of Oʹahu but have subsequently spread widely throughout the islands of the archipelago. Based on free swim site surveys there was a trend for increasing numbers from 1999 to 2004 followed by a subsequent decline of unknown cause. Taʹape have decreased by 131% on the transect surveys since their peak in 2005 and by 647% since 2004 on the free swim surveys (Figure 19). Transect data reflects overall low abundance of this species in the reef areas of the study sites (2010-2012 mean = 0.14/100m2). Similarly Taʹape are rarely found in the shallower water where resource fish surveys are conducted (2008/2009/2011 mean = 0.045/100m2). While Taʹape are numerous in some locales usually along drop-offs and deeper reef areas, their distribution is highly patchy (characteristic of a schooling species) and they are not at all abundant in many reef areas in West Hawaiʹi. Similar to West Hawai’i, at some shallow reef locations such as in Kāneʹohe Bay, Taʹape numbers also appear to have declined from earlier periods (George Losey, pers. comm.).

35
Figure 19. Ta′ape abundance on Transects and 10 minute free swim surveys Roi Of the six species of groupers (family Serranidae) introduced to Hawaiʹi only Roi, Cephalopholis argus has become established. There were more Roi introduced (n=2385) than any other grouper and it was the only species introduced to the Island of Hawaiʹi (400 fish from Moorea in 1956). It now occurs on all the main Hawaiian Islands and in low numbers on some of the Northwest Hawaiian Islands.
As evidenced by transect and free-swim data (Figure 20) overall Roi abundance at West Hawaiʹi sites was increasing since at least 1999 to 2004. West Hawaiʹi retrospective studies at Hōnaunau and Keʹei indicate that Roi populations only began to increase in the 1990’s, three decades after their initial introduction. Randall notes in 1987 that “This fish (Roi) has not become abundant. It has not developed a population approaching that of its native stock in the Society Islands.” Since 2004 however there has been a marked downturn in observed overall Roi abundance both on West Hawaiʹi transect (53% decrease) and free swim surveys (69% decrease) (Figure 20). These declines have been widespread occurring at 20 of 23 surveyed sites.
The decline in Roi abundance in West Hawaiʹi does not appear to be related to the relatively recent proliferation of Roi ‘eradication’ spearfishing events (aka “Roi Roundups”). These began in Maui around 2009 and more recently a few have occurred in West Hawaiʹi. DAR itself undertook the first Roi removals in West Hawaiʹi (1999, 2003 and 2004) but these were structured as fishing-down experiments and for gathering data on prey consumption/ciguatera – not for eradication and they did not occur near DAR monitoring sites. The other West Hawaiʹi
-
1
2
3
4
5
6
7
8
9
10
0
0.5
1
1.5
2
2.5
3
3.5
4
4.5
5
1999 2000 2001 2002 2003 2004 2005 2006 2007 2008 2009 2010 2011 2012
Nu
mb
er/
10
min
Fre
es
wim
Nu
mb
er/
10
0m
2
Transect
Free Swim

36
Roi events have so far been coordinated with DAR so as not to occur directly in and around DAR monitoring sites.
Rather than Roi eradication events, the decline in Roi populations may be related to fish die-offs in West Hawaiʹi which first became apparent in May 2006. At that time seven dead Roi were found washed up on the beach at ʹAnaehoʹomalu, North Kona (Travis Hall, pers. Comm.). Several other species were also noted at this time including several goatfish (Mulloidicthys sp.), a surgeonfish (Acanthurus dussumieri) and a moray eel. Over the next five months there were numerous reports of dead and dying fishes, typically floating or struggling at the surface, along a wide stretch of the West Hawaiʹi coastline. In most instances the fish had distended swim bladders which prevented still live fish from returning to the bottom. Individuals of three species (C. argus, Chlorurus sordidus and Acanthurus olivaceus) were observed underwater live but having difficulty maintaining equilibrium. Roi were by far the most commonly involved species in the die off incidents but a number of other species also perished comprising a wide range of families, feeding types and depth ranges (Table 5). Similar undocumented reports of floating fish (typically Roi) were also received from Maui, Oʹahu and Molokaʹi. Ten specimens of nine species were collected and sent to the National Wildlife Health Center, U.S. Geological Survey in Honolulu for necropsy. Diagnostic Case Report findings typically indicated swim bladder distension, a variety of incidental lesions and, in two cases, atrophy of the liver. No gross or microscopic lesions were considered severe enough to cause death and the cause of death remains unknown (Thierry Work, pers. Comm.).
Table 5. List of fishes collected or reported in West Hawai’i die off
Family Species Common Name Acanthuridae Acanthurus dussumieri Eyestripe SurgeonfishAcanthuridae Acanthurus olivaceus Orangeband SurgeonAcanthuridae Acanthurus triostegus Convict SurgeonfishAcanthuridae Ctenochaetus hawaiiensis Black Surgeonfish Acanthuridae Naso hexacanthus Sleek UnicornfishAcanthuridae Zebrasoma flavescens Yellow TangBalistidae Melichthys niger Black DurgonBalistidae Rhinecanthus aculeatus Lagoon TriggerBalistidae Rhinecanthus rectangulus Reef TriggerfishChaetodontidae Chaetodon auriga Threadfin ButterflyfishChaetodontidae Forcipiger flavissimus ForcepsfishKuhliidae Kuhlia sandvicensis Hawaiian FlagtailLutjanidae Lutjanus kasmira Taʹape (Blueline Snapper)Mullidae Mulloidichthys sp. goatfishMuraenidae Gymnothorax sp. Moray eelScaridae Chlorurus sordidus Bullethead ParrotfishScaridae Scarus rubroviolaceus Redlip ParrotfishSerranidae Cephalopholis argus Roi (Peacock Grouper)Serranidae Epinephelus quernus Hawaiian Grouper

37
Figure 20. C. argus density in West Hawai′i. Data based on two types of underwater
visual surveys at 26 long-term monitoring stations spread over approximately 100 miles of coastline. Each site was surveyed 4-6 times a year
The following year in 2007 only a single fish was reported or found suffering similar conditions, that being the Deep-Sea Swallower Kali indica (Fig 21).
Figure 21. Kali indica
0
2
4
6
8
10
12
0
0.2
0.4
0.6
0.8
1
1.2
1.4
1.6
1.8
2
1999 2000 2001 2002 2003 2004 2005 2006 2007 2008 2009 2010 2011 2012
Nu
mb
er/
10
min
Fre
es
wim
Nu
mb
er/
10
0m
2
Transect
Free Swim

38
Puffer die-off Early in 2010 a die-off of large puffers, with external symptoms quite similar to the previous mortalities, began to occur on Maui and Hawaiʹi Island. Over the ensuing months low numbers of dead and dying puffers increased (Figure 22) and were progressively reported up the island chain as far as Kauaʹi (Oct. 2010). The overall reported numbers of dead puffers decreased as fall approached. Greater than 95% of all reported mortalities were of the Stripebelly Puffer, Arothron hispidus with a few Porcupine fish (Diodon hystrix), Hawaiian Whitespotted Toby (Canthigaster jactator) and Spotted Puffer (Arothron meleagris) (Thierry Work, pers. comm.) A network of concerned citizens and agency people were actively involved in this incident, filing reports of mortalities and shipping dead fish to Dr. Thierry Work, Wildlife Disease Specialist with the U.S. Geological Service (USGS) in Honolulu who performed both gross and microscopic examinations. All assays for viruses (including electron microscopy) have so far come up negative and all attempts to incriminate any other infectious agent as a cause have come to naught. The current hypothesis is that the puffers died from a natural toxin of some sort. A chemist at the Charleston SC NOAA lab has been working the problem for the last 2 years. A natural toxin has been isolated from the puffers and the lab is in the process of trying to determine its structure.
Figure 22. Number of dead puffers examined at USGS Honolulu Field Station West Hawaiʹi monitoring data indicates a substantial decline has occurred in the Spotted Puffer (A. meleagris) with a precipitous drop in 2009/2010 (Figure 23). Other large puffer species were too infrequently counted on transects to determine changes in abundance. The decline in A. meleagris is somewhat perplexing in that this species did not constitute a substantial portion of the reported and examined mortalities. It is of interest to note that two separate dead puffers of this species were found underwater buried face down in the sand at Keʹei (photo in Fig 23) and in a Waiopae tide pool (Jennifer Turner, pers. comm.). In a somewhat similar vein, West Hawaiʹi monitoring data indicates that the Hawaiian Spotted Toby (C. jactator) has also declined substantially over the past decade although there’s been somewhat of a rebound over the last two years. It’s unknown whether mortalities similar to the Stripebelly Pufferfish are responsible.

39
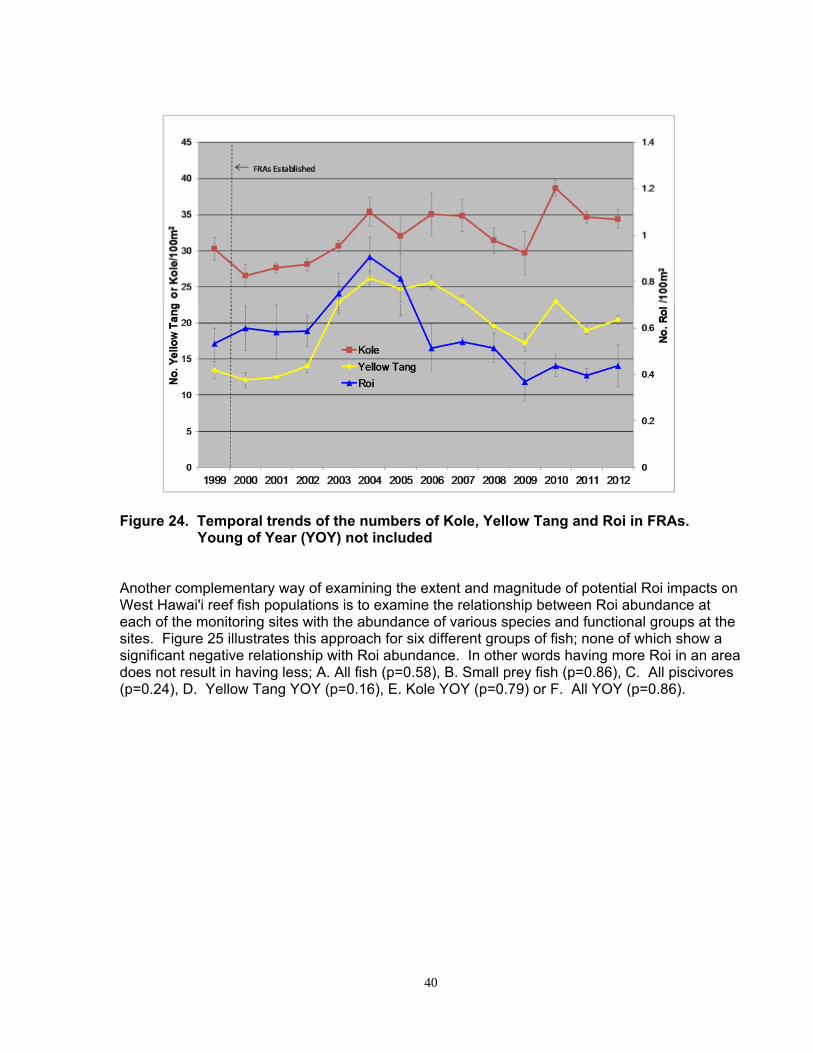
Figure 23. Pufferfish abundances in West Hawai′i Roi impacts As previously noted, although Roi was introduced to augment declining populations of food and game fishes it has not been well received by most Hawai’i fishermen due to concerns about ciguatera and more recently about negative impacts to native fish populations. As with Taʹape, Roi have been blamed for a multitude of problems on the reefs, including a purported decline in important aquarium fish such as the Yellow Tang Zebrasoma flavescens. Concern has also been expressed over putative impacts on food fishes and invertebrates. The marked decline in the numbers of West Hawaiʹi Roi in recent years provides an unprecedented opportunity (i.e. a ‘natural’ experiment) to examine responses of the reef fish community to a >50% reduction in the Roi population. It is anticipated that if Roi are having major impacts on the abundances of other species they prey upon there would be detectible and consistent temporal relationships between Roi and prey species abundance. An examination of Roi and two of the most abundant species in Roi’s prime habitat the Yellow Tang (Zebrasoma flavescens) and Kole (Ctenochaetus strigosus) fails to indicate any direct negative impact on either species. From 1999 to 2004 as Roi populations were increasing, both Kole and Yellow Tang populations were increasing. Subsequent to 2004 as Roi populations decreased Yellow Tang similarly decreased whereas Kole numbers were fairly stable (Figure 24). This is not the pattern that would result if Roi abundance was a major determinant of the abundance of these other two species.
40
Figure 24. Temporal trends of the numbers of Kole, Yellow Tang and Roi in FRAs.
Young of Year (YOY) not included
Another complementary way of examining the extent and magnitude of potential Roi impacts on West Hawaiʹi reef fish populations is to examine the relationship between Roi abundance at each of the monitoring sites with the abundance of various species and functional groups at the sites. Figure 25 illustrates this approach for six different groups of fish; none of which show a significant negative relationship with Roi abundance. In other words having more Roi in an area does not result in having less; A. All fish (p=0.58), B. Small prey fish (p=0.86), C. All piscivores (p=0.24), D. Yellow Tang YOY (p=0.16), E. Kole YOY (p=0.79) or F. All YOY (p=0.86).

41
A. All fish vs. Roi B. Small fish species (<15cm TL) vs. Roi
C. All piscivores vs. Roi D. Yellow Tang YOY vs. Roi
E. Kole YOY vs. Roi F. All YOY vs. Roi
Figure 25. Relationship between Roi and various West Hawai′i fish population
parameters. 2002-2009 data from all West Hawaiʹi monitoring sites (23 sites, n=736 surveys)
Aquarium species The aquarium collecting industry in Hawai'i and especially in West Hawai'i has long been a subject of controversy. Walsh et al. 2003 provides an historical overview of the

42
commercial aquarium fishery in Hawai'i. In contrast to other areas in the State, the West Hawai'i aquarium fishery has undergone substantial and sustained expansion over the past 35 years (Figure 26). Approximately 79% of fish caught in the State and 68% of the total aquarium catch value presently comes from the Big Island (Table 6). Prior to the last two years, almost all of the Big Island catch (97% avg. from 2001 – 2010) came from West Hawai'i. However, in recent years, there has been a dramatic increase in the catch of Halocaridina rubra (Opae ula), an endemic anchialine shrimp both from West and East Hawaiʹi (Figure 27). This shrimp is widely used in ‘microcosm’ displays (mini ecosystem environments) which are widely available for sale online. Although at least one company (petshrimp.com) claims to sell only captive bred Opae ula, catch data indicates substantial numbers of wild-caught shrimp are currently being taken.
Figure 26. Number of marine aquarium animals collected and number of
commercial aquarium permits in West Hawai'i for fiscal years 1976-2012
Table 6. Changes in West Hawai'i aquarium fishery since implementation of the FRAs. Dollar value is adjusted for inflation
FY 2000 FY 2012 ∆
No. Permits 48 54 13% ↑ Total Catch 279,606 388,344 39% ↑ Total Value $745,129 $1,184,610 59% ↑ % of State Fish Catch 70% 79% 9% ↑ % of State Fish Value 67% 71% 4% ↑ % of State Total Catch 55% 69% 14% ↑ % of State Total Value 59% 68% 9% ↑
0
10
20
30
40
50
60
70
80
0
50,000
100,000
150,000
200,000
250,000
300,000
350,000
400,000
450,000
500,000
No
. of
Pe
rmit
s
No
. Ca
ug
ht
Fiscal Year
AQ Catch
AQ Permits
FRAs established

43
The West Hawai'i Regional Fishery Management Area, which spans the entire West Hawaiʹi coastline, was established in 1998 primarily in response to controversy surrounding the activities of aquarium collectors working the coastline. Overall, the marine aquarium fishery in the State of Hawai'i is one of the most economically valuable commercial inshore fisheries with FY 2012 reported landings of 439,358 specimens and
Figure 27. Opae ula catch in East and West Hawaiʹi (Keoki Stender photo) a total value of $2.05 million. Earlier studies suggested that the reported values may have been underestimated by a factor of approximately 2X to 5X (Cesar et al. 2002, Walsh et al. 2003). However, a recent analysis of FY 2010 data comparing Hawai'i Island aquarium catch report data with dealer purchase data from collectors found good correspondence in reported numbers. There was a 3.5% difference between the number of animals reported caught and sold by aquarium collectors which can represent both live releases and mortality (Figure 28). Dealer reports of purchases from Hawai'i collectors were 9.8% lower than number reported sold. Unlike collectors, there currently is no reporting requirement for dealers (no Hawaii Administrative Rule or statute) and thus reporting is essentially on a voluntary basis. It is likely that some dealers are not reporting in whole or in part. In any case the comparison did not indicate underreporting by collectors.

44
Figure 28. Comparison between Hawai'i Island aquarium collector report data and
dealer purchases of aquarium animals from the collectors (FY 2010) In 1999, DAR in conjunction with a citizen’s advisory group, the West Hawai'i Fisheries Council (WHFC), established a network of 9 Fish Replenishment Areas (FRAs) where aquarium collecting was prohibited. Along with existing protected areas 35.2% of the coastline was off limits to collecting. In order to investigate the effectiveness of the FRAs to replenish depleted fish stocks, a consortium of researchers established the West Hawai'i Aquarium Project (WHAP) in early 1999. Funding was secured for the early years of the project through the Hawai'i Coral Reef Initiative Research Program (HCRI-RP), a federal initiative under the aegis of the National Oceanic and Atmospheric Administration (NOAA). Subsequent funding has been provided by Coral Reef Monitoring Grants under NOAA’s Coral Reef Conservation Program. The initial project researchers were Dr. Brian Tissot, Washington State University, Dr. William Walsh, DAR/DLNR and Dr. Leon Hallacher, University of Hawai'i-Hilo. They have been joined in recent years by Dr. Ivor Williams and Dr. Jill Zamzow, National Marine Fisheries Service, Dr. Mark Hixon, Oregon State University and Dr. Helen Fox, World Wildlife Fund. WHAP established 23 study sites (Figure 13, Table 4) along the West Hawai'i coastline in early 1999 at 9 FRA sites, 8 open sites (aquarium fish collection areas) and 6 previously established Marine Protected Areas (MPAs) to collect baseline data both prior to and after the closure of the FRAs. The MPAs are MLCDs and Fishery Management Areas (FMAs), which have been closed to aquarium collecting for at least 9 years and were presumed to have close to “natural” levels of aquarium fish abundances. They serve as a reference or ‘control’ to compare with the FRAs and open areas. Three additional sites have been added over the years. The overall goals of WHAP were two-fold: 1) To evaluate the effectiveness of the FRA network by comparing targeted aquarium fishes in FRAs and open areas relative to adjacent control sites and, 2) To evaluate the impact of the FRA network on the aquarium fishery.
0
100,000
200,000
300,000
400,000
500,000
Caught Sold Purchased
Nu
mb
er
of
An
ima
ls
Δ 3.5%
Δ 9.8%

45
The general rationale for WHAP’s goals was based on the premise that changes in FRAs and open areas can best be estimated by comparing them to other areas which have been protected for relatively long periods of time. These areas (MPAs) serve as control areas against which the FRAs are measured both before and after the closure of the FRAs. This rationale is derived from a well-known statistical procedure known as the BACI (Before-After-Control-Impact) procedure (Tissot et al, 2004) which is an especially appropriate and statistically powerful method for examining FRA effectiveness. For this study FRA effectiveness (R) is measured statistically as the change in the difference between each FRA and the mean of all MPA sites during each survey (control vs. impact) from before (1999-2000) vs. after (2010-2012) FRA establishment. Details on study methodology and this procedure are covered in (Tissot et al, 2004, Division of Aquatic Resources 2004). R measures the changes within the FRA as a percent of the baseline abundance relative to control sites. In the case of this study, R is a measure of the effectiveness or ‘protective value’ of the FRAs. That is, what effect is increased protection having on targeted fish apart from other changes in the system? Scientific studies on reef fishes are notoriously difficult due to the very high variability of fish abundance in both time and space. Even with a rigorous statistical design (such as BACI) and 14 years of study, it is difficult to statistically detect changes in abundances except for the most common species that exhibit relatively large changes. Fish Replenishment Areas (FRAs) Changes in density for the 20 most collected aquarium fishes across all FRAs are shown in Table 7. Yellow Tang, Goldring Surgeonfish and Forcepsfish density increased markedly (and significantly) in the FRAs. The first two species alone account for 92% of the total aquarium catch. Abundance in the FRAs decreased significantly for Multiband Butterflyfish, Brown Surgeonfish, Saddle Wrasse and Cleaner Wrasse. Brown Surgeonfish decreased only in the FRAs where Yellow Tang and Goldring Surgeonfish substantially increased suggesting possible competitive displacement especially by Yellow Tang. The other three species which declined in the FRAs also decreased in the MPAs and Open areas as well thus it does appear that these systematic declines are attributable to aquarium collecting. The FRAs were ‘effective’ (increases in FRAs relative to long term MPAs) for the same three species as above as well as the Bluelined Surgeon. Effectiveness for four of the other, less abundant and/or less collected species was significantly negative. This was due to either abundances decreasing within the FRAs while they increased in the MPAs (Brown and Goldrim Surgeonfishes) or abundances declining in both types of areas but to a greater extent in the FRAs (Multiband Butterflyfish and Moorish Idol).

46
Table 7. Overall FRA effectiveness for the top 20 most aquarium collected fishes. ‘Before’ = Mean of 1999-2000; ‘After’ = Mean of 2010-2012. All size classes
included
COMMON NAME SCIENTIFIC NAME MEAN DENSITY
(NO/100M2)
OVERALL%
CHANGE IN
DENSITY R
Before After
Yellow Tang Zebrasoma flavescens 13.93 26.22 +88% <0.01 +148% <0.01Goldring Surgeonfish Ctenochaetus strigosus 29.32 40.15 +37% <0.01 +31% <0.01Achilles Tang Acanthurus achilles 0.28 0.05 -81% 0.11 -116% 0.49Orangespine Unicornfish Naso lituratus 0.83 0.72 -13% 0.64 -7% 0.95Chevron Tang Ctenochaetus hawaiiensis 0.18 0.27 +19% 0.46 +68% 0.21Forcepsfish Forcipiger flavissimus 0.41 0.63 +54% <0.01 +150% <0.01Multiband Butterflyfish Chaetodon multicinctus 5.43 4.06 -25% 0.02 -52% 0.01Potter’s Angelfish Centropyge potteri 1.38 1.59 +16% 0.45 +20% 0.65Ornate Wrasse Halichoeres ornatissimus 1.09 0.93 -14% 0.43 -31% 0.30Brown Surgeonfish Acanthurus nigrofuscus 8.63 6.16 -29% 0.04 -99% <0.01Orangeband Surgeonfish Acanthurus olivaceus 0.13 0.13 -3% 0.95 +121% 0.19Fourspot Butterflyfish Chaetodon quadrimaculatus 0.05 0.04 -20% 0.57 +287% 0.24Saddle Wrasse Thalassoma duperrey 4.69 2.67 -43% <0.01 -45% 0.07Yellowtail Coris Coris gaimard 0.20 0.17 -17% 0.36 +28% 0.18Cleaner Wrasse Labroides phthirophagus 0.87 0.52 -40% <0.01 -40% 0.25Moorish Idol Zanclus cornutus 0.19 0.10 -47% 0.07 -63% 0.01Psychedelic Wrasse Anampses chrysocephalus 0.01 0.02 +67% 0.22 +133% 0.95Goldrim Surgeon Acanthurus nigricans 0.04 0.03 -28% 0.51 -136% <0.01Christmas Wrasse Thalassoma trilobatum 0 0 NA NA NA NA Bluelined Surgeon Acanthurus nigroris 0.14 0.05 -61% 0.21 +59% <0.01
Bold = statistically significant at ≤ 0.05 With only a two exceptions all of the FRAs have proven to be effective (positive R value) in enhancing Yellow Tang stocks (Figure 29). Five of the eight increases were statistically significant. The single FRA which was clearly ineffective was in North Kohala. This FRA had very low Yellow Tang recruitment throughout the study period and additionally the area may have been impacted by a sedimentation event in October 2006 on nearby reefs. Yellow Tang density increased (overall x̄ =88%) in all of the FRAs with the exception of Waiakaʹilio Bay (Site #3). An examination of multiple factors associated with effective FRAs (Tissot et al., 2004) found that habitat quality, FRA size (especially reef width) and density of adult fishes are associated with significant recovery of fish stocks. Of particular importance are areas of high Finger Coral (Porites compressa) cover which is critical habitat for juvenile Yellow Tang and other fishes (Walsh, 1987). Live coral cover at Waiakaʹilio declined 15% between 2003 and 2011 (Table 1).

47
Figure 29. Effectiveness of individual FRAs to replenish Yellow Tang, 1999-2012.
*= Statistically significant at ≤0.05
The overall average changes in Yellow Tang abundance in the three management areas are shown in Figure 30. Yellow Tang exhibited a delayed increase in abundance in all areas following a strong recruitment year in 2002. Relatively low recruitment in 6 of the following years resulted in subsequent downward trends in all areas. A similar pattern was evident with the high recruitment year of 2009 and subsequent lower recruitment years. The number of Yellow Tang (excluding YOY) has increased by 63% in the FRAs since they were established (1999/2000 – 2010/2012). Overall Yellow Tang abundance in 30’-60’ hardbottom habitat in West Hawaiʹi increased by 355,758 individuals from 1999/2000 to 2010-2012. When Yellow Tang reach sexual maturity they leave the deeper coral rich reef areas where they settled (and where DAR transects are located) for shallower reef habitat (Claisse 2009). For females this occurs at approximately 4-5 years of age and for males at age 5-7. Thus in the absence of substantial input of Young-of-the-Year fish, (i.e. low recruitment) Yellow Tang populations will invariably decline over time due to the emigration of mature fish in addition to natural mortality. Obviously such declines will be exacerbated by aquarium collection activities which specifically target smaller-sized fishes.

48
Figure 30. Overall changes in Yellow Tang abundance (Mean ± SE) in FRAs, MPAs
and Open areas, 1999-2012. Yellow bars indicate mean density (May -Nov) Yellow Tang Young-of-Year (YOY). YOY are not included in trend line data
Yellow Tang abundance in the open areas decreased 21% from 1999/2000 to 2010-2012. This decrease is attributable largely to an increase in the number of aquarium collectors and collected animals relative to the period when the FRAs were established (Figure 26, Table 6). The continuing decline of Yellow Tang in areas open to collecting has prompted several additional proposed management actions including some size/bag limits, restricting which species can be collected (See Aquarium Species of Special Concern section pg. 54) and the proposed establishment of a limited entry program for the fishery. Recruitment in 2009 was the second highest since 1999 which appears to be ameliorating the overall downward trend for Yellow Tang in open areas, at least over the short term. The fishing/reserve (i.e. FRA/MPA) impacts described above are striking, but of greater significance to the role such reserves have in enhancing and sustaining West Hawai'i populations and the fishery which depends on those, are effects of the reserve network on Yellow Tang breeding stocks. Based on adult Yellow Tang ‘jet boot’ surveys (Williams et al. 2009) it was found that adult densities were highest within protected areas and in ’boundary’ areas (open areas adjacent to protected areas). Densities were lowest in open areas far from protected areas. The high densities in boundary areas are evidence of ‘spillover’ (outward movement from reserves into surrounding open areas) and indicate that protected areas supplement adult stocks not only within their own boundaries, but also in open areas up to a kilometer or more away. Thus, the 35% of the coastline in reserves helps to sustain Yellow Tang breeding stocks in about 50% of

49
the coastline. There were no significant differences (Figure 31 t-test p=0.71) in the abundance of adult Yellow Tang in open vs. closed areas based on shallow water (10’-20’ depths) jet boot surveys (2006-2010). Total estimated coastwise population of adult Yellow Tang in this depth range was estimated to be >2.5 million individuals.
Figure 31. Yellow Tang abundance in West Hawaiʹi shallow water (10’-20’) habitat Goldring Surgeonfish or Kole exhibited trends quite similar to Yellow Tang. Kole have increased by 37% in the FRAs since their establishment in 2000 (Table 7).
Figure 32. Overall changes in Goldring Surgeonfish (Kole) abundance (Mean ±
SE) in FRAs, MPAs and Open areas, 1999-2012. Bars indicate mean density (June-Nov) of Goldring Surgeonfish Young-of-Year (YOY). YOY are not included in trend line data
0
5
10
15
20
25
30
AQ Open Areas AQ Closed Areas
Nu
mb
er/
10
0m
2
0
5
10
15
20
25
30
35
40
45
1999 2000 2001 2002 2003 2004 2005 2006 2007 2008 2009 2010 2011 2012
De
nsity
(#
/10
0m
2)
YOY
MPA
FRA
Open

50
Overall Kole abundance in 30’-60’ hardbottom habitat increased by 948,662 individuals from 1999/2000 to 2010-2012 and abundance in open areas increased by 15%. Recruitment patterns are markedly similar between the Kole and Yellow Tang, likely due to similarities in spawning seasonality, location and daily timing (Walsh 1984, 1987). It is unknown at present if Kole make a habitat change as they reach sexual maturity but it appears likely. In terms of FRA effectiveness (R), with only a single exception, all of the FRAs had positive R values for Kole although only a single one was statistically significant (figure 33). All FRAs had an increase in the number of Kole. The lack of effectiveness (a positive R) at ʹAnaehoʹomalu relates to the fact that Kole density in the reference MPA increased to a greater extent than it did in the FRA.
Figure 33. Effectiveness of individual FRAs to replenish Goldring Surgeonfish,
1999-2012. *= Statistically significant at ≤0.05 Achilles Tang (Figure 34) has generally shown a highly variable pattern in all management areas in the early years of the study with an overall decline in the last seven years. Average densities of this species is very low (x̄ = 0.22/100m2) on all transects. The deeper reef areas where the DAR transects are located is not the prime habitat for adults of this species. They prefer the high energy shallower surge zones more typical of the shoreline drop-offs areas in West Hawaiʹi. Presumably algal food resources are more abundant in these areas. These areas reef areas are surveyed by means of the shallow water resource surveys conducted by DAR. Initial results from this program and other ancillary longer terms studies suggest there should be concern for

51
the sustained abundance of this species. Achilles Tang is a very popular food fish as well as an aquarium fish and thus is being harvested both as juveniles and adults. Low levels of recruitment over the past 11 years (x̄ (Jun-Nov) = 0.09/100m2) appear insufficient to compensate for the existing levels of harvest.
Figure 33. Overall changes in Achilles Tang abundance in FRAs, MPAs and Open
areas, 1999-2012. Bars indicate mean density (June-Nov) of Achilles Tang Young-of-Year (YOY). YOY are not included in trend line data
DAR is currently in the process of developing a comprehensive package of size and bag limits for a number of popularly targeted species. There is a proposed bag limit of 10 Achilles Tang/person/day which would only apply to aquarium collectors. Analysis of aquarium catch report data indicates that such a bag limit will be largely ineffective in stemming the continuing decline in Achilles Tang since, in most West Hawaiʹi areas, it is presently difficult to collect more than 10 Achilles Tang in a day. The abundance/recruitment trends of the Orangespine Unicornfish and Chevron Tang, the fourth and fifth most collected species, are somewhat similar to Achilles Tang (Figures 34 & 35). Here again the primary adult habitat is not the deeper, coral rich areas, where the DAR transects are located. Additionally the Orangespine Unicornfish is also widely taken as a food fish as well as being an important aquarium fish. The abundance of both these species on the transects closely tracks recruitment with an upturn during 2004/2005 when there was somewhat higher recruitment followed by declining trends in subsequent years that had low recruitment. Overall, recruitment has been minimal over the last 14 years for both Orangespine Unicornfish (x̄ = 0.03/100m2) and Chevron Tang (x̄ = 0.05/100m2).
0
0.1
0.2
0.3
0.4
0.5
0.6
0.7
1999 2000 2001 2002 2003 2004 2005 2006 2007 2008 2009 2010 2011 2012
De
nsity
(#
/10
0m
2
YOY
MPA
FRA
Open

52
Figure 34. Overall changes in Orangespine Unicornfish abundance (Mean ± SE) in
FRAs, MPAs and Open areas, 1999-2012. Bars indicate mean density (June-Nov) of Orangespine Unicornfish Young-of-Year (YOY). YOY are not included in trend line data
0
0.5
1
1.5
2
2.5
1999 2000 2001 2002 2003 2004 2005 2006 2007 2008 2009 2010 2011 2012
De
nsity (
#/1
00
m2)
YOY
MPA
FRA
Open

53
Figure 35. Overall changes in Chevron Tang abundance (Mean ± SE) in
FRAs, MPAs and Open areas, 1999-2012. Bars indicate mean density (June-Nov) of Chevron Tang Young-of-Year (YOY)
As observed in previous work (Walsh 1987) and emphasized again in this work, for some species, recruitment can be highly variable between years and repeated low levels of recruitment is a regular occurrence. Without substantial input of the YOY, overall abundances on the deeper reef transects decrease over time due to ontogenetic movement out of settlement habitat and natural mortality. This decrease can occur even in areas which are not subject to aquarium collecting pressure (i.e. FRAs and MPAs). Although only a few species comprise the bulk of the West Hawai'i aquarium fishery, over 200 different species of fishes and invertebrates have been collected from the reefs over the last five years. Some of these species are uncommon or even rare and presumably have a low resilience to harvesting pressure. Even in protected areas a considerable amount of time may be required for populations of these species to increase. A good example seems to be the Flame Angelfish, Centropyge loricula. This very attractive but uncommon species is highly desired in the aquarium trade. Demand far exceeds the supply Hawai'i can provide so substantial numbers of this species are imported to Hawai'i (for subsequent reshipping) from other locales (e.g. Christmas Island). Flame Angelfish were rarely sighted on transect or free swim surveys during the first seven years of the study (Figures 36 & 37). Beginning in 2006 however they have become noticeably more abundant presumably due to one or more years of good recruitment although the recruits are apparently cryptic so not readily surveyed.
0.0
0.1
0.2
0.3
0.4
0.5
0.6
0.7
0.8
0.9
1999 2000 2001 2002 2003 2004 2005 2006 2007 2008 2009 2010 2011 2012
De
nsity (
#/1
00
m2)
YOY
MPA
FRA
Open

Flame angelfish abundance in open areas is decreasing in recent year presumably due to aquarium collection activities.
Figure 36. Flame angelfish on transects
Figure 37. Flame angelfish on free swim surveys
Aquarium Species of Special Concern Coral reef animals have multiple values and they serve fundamental biodiversity and ecosystem functions. They’re important not only to aquarium collectors and other fishers but also to the commercial ocean recreation industry, their visitors and Hawai'i ocean users in general. Management of this resource needs to balance these values and uses. A number of reef fish species are particularly vulnerable to depletion because they may be naturally uncommon or rare but command high prices in the aquarium trade and are thus highly sought after by collectors. Examples include the Dragon Moray (Enchelycore pardalis), Tinker’s Butterflyfish (Chaetodon tinkeri), and Bandit Angelfish (Apolemichthys arcuatus). All of these species (and others) are worth more (sometimes considerably more) than $50 each when collected. In a retail aquarium shop in Connecticut several years ago the author observed a Bandit Angel that sold for $3,500. For uncommon or rare species or those that occur in deeper reef habitats, it is difficult and/or unfeasibly expensive to gather solid information on their status and trends. Nevertheless for some of these species such as the Hawaiian Turkeyfish there is considerable anecdotal evidence that they have declined in recent decades. It’s also clear from a number of our long term studies at Puakō, Ke'ei and Hōnaunau that a number of fairly conspicuous species have likewise declined in abundance over time – most obviously several species of butterflyfish and, in particular, the Bandit Angelfish. FRAs are a key component of the sustainable management of the West Hawai′i aquarium fishery. They encompass many of the areas most utilized by residents and dive/snorkel business, and help maintain the biodiversity of our reefs people expect and visitors are willing to pay for. The FRAs do not of course provide protection for species in the open areas. While they do provide a population reservoir, intensive fishing pressure on species with low natural abundances across most of West Hawai′i’s reefs is problematic. Concerns over continued expansion of the fishery (>30% over the last
0
0.04
0.08
0.12
0.16
1999 2000 2001 2002 2003 2004 2005 2006 2007 2008 2009 2010 2011 2012
Den
sity
(#
/10
0m2 )
MPA
FRA
Open
0%
10%
20%
30%
40%
50%
1999 2000 2001 2002 2003 2004 2005 2006 2007 2008 2009 2010 2011 2012
10
Min
ute
Fre
esw
im S
ight
ings
(%
of S
ites)
FRA
MPA
Open

55
decade) and harvesting effects in the open areas (65% of the coast), necessitate additional management measures. To address such issues DAR in conjunction with The West Hawai′i Fisheries Council (WHFC) developed a ‘white list’ of species which could be taken by aquarium fishers (Table 8). The approach taken by the WHFC was based on the fact that the West Hawai'i aquarium fishery is very heavily focused on a relatively small number of species. Six species (Yellow Tang, Goldring Surgeonfish, Achilles Tang, Clown Tang, Chevron Tang and Tinker’s Butterfly) make up 96% of the total catch value averaged over the last 5 years. The 40 species on the white list make up 99% of the total catch value so the great majority of species taken (over 200 species) have very little individual or collective value; nonetheless they are important components of the reef ecosystem. It should be noted no invertebrates are included on the white list. The white list is part of a Hawai’i Administrative Rule (HAR 13-60.4) that is currently being processed. Although the list has been recommended and supported by the WHFC and approved by the nascent Big Island Association of Aquarium Fishers (BIAFF) there nevertheless has been some criticism directed at the list. Most of the concern is generally directed to why this species or that species is included on the list (i.e. allowed to be collected). Concerns have been articulated about collecting impacts on the species’ populations and sometimes as to suitability and survivability of the species in captivity. Aquarium Species Open vs. FRA Trend Analysis In order to more comprehensively explore the 40 white list species and the current and potential impact to their populations on the reefs by aquarium collecting two different analyses were undertaken. The first analysis examined the trends in the % difference in density between areas open to collecting and the FRAs (closed to collecting) for the species on the white list. Density was based on the overall average density of each species for the last three years (2010-2012) at all open and FRA survey sites. The % difference in fish densities between open and FRAs areas for a species was calculated as:
(DensityOPEN - DensityFRA)/DensityFRA) X 100.
Table 8. Proposed ‘White List’ of species which can be taken by aquarium collectors within the West Hawai′i Regional Fisheries Management Area
Common Name Scientific Name Common Name Scientific Name Achilles Tang Acanthurus achilles Potter’s Angelfish Centropyge potteri Goldrim Surgeonfish Acanthurus nigricans Pyramid Butterflyfish Hemitaurichthys polylepis Yellow Tang Zebrasoma flavescens Lei Triggerfish Sufflamen bursa Psychedelic Wrasse Anampses chrysocephalus Hi Dascyllus Dascyllus albisella Chevron Tang Ctenochaetus hawaiiensis Redbarred Hawkfish Cirrhitops fasciatus Milletseed Butterflyfish Chaetodon miliaris Hi Whitespotted Toby Canthigaster jactator Forcepsfish Forcipiger flavissimus Thompson’s Surgeonfish Acanthurus thompsoni Fourspot Butterflyfish Chaetodon quadrimaculatus Saddle Wrasse Thalassoma duperrey Orangespine Unicornfish Naso lituratus Brown Surgeonfish Acanthurus nigrofuscus

56
Yellowtail Coris Coris gaimard Black Durgon Melichthys niger Shortnose Wrasse Macropharyngodon geoffroy Fourline Wrasse Pseudocheilinus tetrataenia Gilded Triggerfish Xanthichthys auromarginatus Eightline Wrasse Pseudocheilinus octotaenia Goldring Surgeonfish Ctenochaetus strigosus Bluestripe Snapper Lutjanus kasmira Spotted Boxfish Ostracion meleagris Peacock Grouper Cephalopholis argus Orangeband Surgeonfish Acanthurus olivaceus Eyestripe Surgeonfish Acanthurus dussumieri Smalltail Wrasse Pseudojuloides cerasinus Tinker’s Butterflyfish Chaetodon tinkeri Blackside Hawkfish Paracirrhites forsteri Blacklip Butterflyfish Chaetodon kleinii Bird Wrasse Gomphosus varius Fisher’s Angelfish Centropyge fisheri Multiband Butterflyfish Chaetodon multicinctus Flame Wrasse Cirrhilabrus jordani Ornate Wrasse Halichoeres ornatissimus Hi Longfin Anthias Pseudanthias hawaiiensis
There were 8 species which had distributions and/or behaviors which precluded obtaining accurate density estimates in the survey areas. Chaetodon Kleinii is a planktivore which typically feeds above the reef often near drop-offs or in deeper water. Lutjanus kasmira is a schooling species more likely to be found in deeper water at reef/sand interfaces while Centropyge fisheri, Chaetodon tinkeri, Anampses chrysocephalus, Cirrhilabrus jordani and Pseudanthias hawaiiensis inhabit deeper (generally >60’) waters. Acanthurus dussumieri were rarely recorded on fixed line transects and appeared to be associated with sand areas. Individuals of this species which are encountered are invariably of very large size and small fish (e.g. YOY) are rarely if ever seen on survey dives. These six species were excluded from the analyses. The results of this analysis are presented in the following graphs (Figures 38-40). Given the controversial nature of all aspects of managing the aquarium fishery and the current relevance of the issue, available data for all 34 species are presented. The columns (bars) represent the % difference in density between open and FRA areas for each year since 1999. Bars below the x axis indicate densities which are lower in the open areas relative to the FRAs and similarly bars above the x axis indicate densities which are higher in the open areas relative to the FRAs. The number to the right of the species name represents the 3 year (2010-2012) % difference. Note that 1999 data are prior to FRA establishment thus no FRA impact would be evident – rather just site differences between open areas. The white list species can be classified into three groups based on their densities in the open areas relative to FRAs. Note that Young of Year are not included in these analyses. Group1 species (6 spp., Fig 37) had fairly consistent lower densities in the open areas. The Yellow Tang, Zebrasoma flavescens is particularly noteworthy as the disparity between the open areas and the FRAs is substantial. Averaged over the past three years (2010-2012) Yellow Tang are 61% less abundant in the open areas as compared to the FRAs. Yellow Tang are by far the most heavily targeted species in West Hawaiʹi and over the past decade the numbers of aquarium collectors and collected fish have increased substantially (Fig. 25). Although the disparity in Yellow Tang abundance was consistently increasing from 2000 to 2008 this trend has ameliorated somewhat in recent years. The second most collected species, the Kole, Ctenochaetus strigosus, also exhibits a collecting impact but in contrast to Yellow Tang the disparity between open and protected areas has not been increasing. For Kole, open areas contain 32% fewer fish

57
than the FRAs. For the Multiband Butterflyfish, Chaetodon multicinctus, the difference between FRAs and the open areas has been consistently decreasing over the years and presently there are now slightly more of this species in the open areas than in the FRAs. Roi, Cephalopholis argus is, also less abundant in the open areas but this is not due to aquarium collecting as very few individuals of this species are collected (Table 10). There is some indication that aquarium collectors kill this grouper on occasion or as a matter of course which may, in part, explain the difference between area types. Group 2 species (11 spp. Fig., 39) did not exhibit any consistent pattern of differences in abundance in open vs. FRAs. In some years densities were higher in the FRAs while in other years they were higher in the open areas. In some years there were essentially no differences between areas. Aquarium collecting impacts, if any, are thus obscure and likely limited. Group 3 species (16 spp., Fig. 40) had consistently greater densities of fishes in the open areas vs. the FRAs. This pattern, as with Group 2 species, appears to relate to the comparatively low number of fishes collected relative to the size of their population on the reefs. In summary, there was clear evidence of collecting impact for only 5 species of the 34 white list species which were analyzed. Four of the 5 (not G. varius) were all among the 10 most heavily collected species in the fishery (Walsh 2009). For the others, it appears that, at least based on the past 14 years data, inclusion on the white list poses little or no threat to their populations. The caveat is that this assumes collecting preferences will remain similar to the past decade and the amount of collecting effort (i.e. number of collectors) does not substantially increase. Furthermore these findings do not mean that aquarium collecting may not presently be having impacts on species not on the white list especially uncommon, rare and valuable species.

Zebrasoma flavescens Open-FRA diff. -61% Ctenochaetus strigosus Open-FRA diff. -32%
Gomphosus varius Open-FRA diff. -59% Chaetodon multicinctus E Open-FRA diff. +4%
Forcipiger flavissimus Open-FRA diff. -36% Cephalopholis argus Open-FRA diff. -73%
Figure 38. White list species showing fairly consistent lower densities in areas open to aquarium collecting. The graph columns represent the % difference in density between open and FRA areas. Bars below the x axis indicate densities are lower in the open areas relative to the FRAs. ‘E’ denotes an Endemic species
-100%
-90%
-80%
-70%
-60%
-50%
-40%
-30%
-20%
-10%
0%
1999 2000 2001 2002 2003 2004 2005 2006 2007 2008 2009 2010 2011 2012
% D
iffe
rne
ce
be
twe
en
Op
en
Are
as
an
d F
RA
s
-100%
-90%
-80%
-70%
-60%
-50%
-40%
-30%
-20%
-10%
0%
1999 2000 2001 2002 2003 2004 2005 2006 2007 2008 2009 2010 2011 2012
% D
iffe
rne
ce
be
twe
en
Op
en
Are
as
an
d F
RA
s
-120%
-100%
-80%
-60%
-40%
-20%
0%
1999 2000 2001 2002 2003 2004 2005 2006 2007 2008 2009 2010 2011 2012
% D
iffe
rne
ce
be
twe
en
Op
en
Are
as
an
d F
RA
s
-100%
-80%
-60%
-40%
-20%
0%
20%
40%
1999 2000 2001 2002 2003 2004 2005 2006 2007 2008 2009 2010 2011 2012
% D
iffe
rne
ce
be
twe
en
Op
en
Are
as
an
d F
RA
s
-100%
-80%
-60%
-40%
-20%
0%
20%
40%
60%
80%
100%
1999 2000 2001 2002 2003 2004 2005 2006 2007 2008 2009 2010 2011 2012
% D
iffe
rne
ce
be
twe
en
Op
en
Are
as
an
d F
RA
s
-150%
-100%
-50%
0%
50%
100%
1999 2000 2001 2002 2003 2004 2005 2006 2007 2008 2009 2010 2011 2012
% D
iffe
rne
ce
be
twe
en
Op
en
Are
as
an
d F
RA
s

59
Melichthys niger Open-FRA diff. -49% Acanthurus thompsoni Open-FRA diff. -68%
Paracirrhites forsteri Open-FRA diff. -1% Acanthurus nigricans Open-FRA diff. +41%
Ctenochaetus hawaiiensis Open-FRA diff. + 3% Pseudojuloides cerasinus Open-FRA diff. +36%
Figure 39. White list species exhibiting inconsistent differences in density between areas open to aquarium collecting and FRAs. The graph columns represent the % difference in density between open and FRA areas. Bars below the x axis indicate densities are lower in the open areas relative to the FRAs. Note different Y axis scale for M. niger and A. nigricans
-700%
-600%
-500%
-400%
-300%
-200%
-100%
0%
100%
1999 2000 2001 2002 2003 2004 2005 2006 2007 2008 2009 2010 2011 2012
% D
iffe
rne
ce
be
twe
en
Op
en
Are
as
an
d F
RA
s
-160%
-110%
-60%
-10%
40%
90%
1999 2000 2001 2002 2003 2004 2005 2006 2007 2008 2009 2010 2011 2012
% D
iffe
rne
ce
be
twe
en
Op
en
Are
as
an
d F
RA
s
-100%
-80%
-60%
-40%
-20%
0%
20%
40%
60%
80%
100%
1999 2000 2001 2002 2003 2004 2005 2006 2007 2008 2009 2010 2011 2012
% D
iffe
rne
ce
be
twe
en
Op
en
Are
as
an
d F
RA
s
-800%
-700%
-600%
-500%
-400%
-300%
-200%
-100%
0%
100%
1999 2000 2001 2002 2003 2004 2005 2006 2007 2008 2009 2010 2011 2012
% D
iffe
rne
ce
be
twe
en
Op
en
Are
as
an
d F
RA
s
-100%
-80%
-60%
-40%
-20%
0%
20%
40%
60%
80%
100%
1999 2000 2001 2002 2003 2004 2005 2006 2007 2008 2009 2010 2011 2012
% D
iffe
rne
ce
be
twe
en
Op
en
Are
as
an
d F
RA
s
-250%
-200%
-150%
-100%
-50%
0%
50%
100%
1999 2000 2001 2002 2003 2004 2005 2006 2007 2008 2009 2010 2011 2012
% D
iffe
rne
ce
be
twe
en
Op
en
Are
as
an
d F
RA
s

60
Coris gaimard Open-FRA diff. -4% Macropharyngodon geoffroy E Open-FRA diff. +62%
Ostracion meleagris Open-FRA diff. +37% Acanthurus achilles Open-FRA diff. +296%
Figure 39 con’t. White list species exhibiting inconsistent differences in density between areas open to aquarium collecting and FRAs. The graph columns represent the % difference in density between open and FRA areas. Bars below the x axis indicate densities are lower in the open areas relative to the FRAs. Bars above the x axis indicate densities are higher in the open areas relative to the FRAs. Note different Y axis scale for P. cerasinus and M. geoffroy
-100%
-80%
-60%
-40%
-20%
0%
20%
40%
60%
80%
100%
1999 2000 2001 2002 2003 2004 2005 2006 2007 2008 2009 2010 2011 2012
% D
iffe
rne
ce
be
twe
en
Op
en
Are
as
an
d F
RA
s
-160%
-140%
-120%
-100%
-80%
-60%
-40%
-20%
0%
20%
40%
60%
80%
100%
1999 2000 2001 2002 2003 2004 2005 2006 2007 2008 2009 2010 2011 2012
% D
iffe
rne
ce
be
twe
en
Op
en
Are
as
an
d F
RA
s
0%
10%
20%
30%
40%
50%
60%
70%
80%
90%
100%
1999 2000 2001 2002 2003 2004 2005 2006 2007 2008 2009 2010 2011 2012
% D
iffe
rne
ce
be
twe
en
Op
en
Are
as
an
d F
RA
s
-100%
0%
100%
200%
300%
400%
500%
600%
700%
1999 2000 2001 2002 2003 2004 2005 2006 2007 2008 2009 2010 2011 2012
% D
iffe
rne
ce
be
twe
en
Op
en
Are
as
an
d F
RA
s

61
Pseudocheilinus tetrataenia Open-FRA diff. +21% Centropyge potteri E Open-FRA diff. +34%
Naso literatus Open-FRA diff. +63% Pseudocheilinus octotaenia Open-FRA diff. +32%
Sufflamen bursa Open-FRA diff. +40% Thalassoma duperrey E Open-FRA diff. +32%
Figure 40. White list species exhibiting higher population densities in areas open to collecting relative to FRAs. The graph columns represent the % difference in density between open and FRA areas. Bars above the x axis indicate densities are higher in the open areas relative to the FRAs
-100%
-80%
-60%
-40%
-20%
0%
20%
40%
60%
80%
100%
1999 2000 2001 2002 2003 2004 2005 2006 2007 2008 2009 2010 2011 2012
% D
iffe
rne
ce
be
twe
en
Op
en
Are
as
an
d F
RA
s
0%
10%
20%
30%
40%
50%
60%
70%
80%
90%
100%
1999 2000 2001 2002 2003 2004 2005 2006 2007 2008 2009 2010 2011 2012
% D
iffe
rne
ce
be
twe
en
Op
en
Are
as
an
d F
RA
s
0%
20%
40%
60%
80%
100%
120%
1999 2000 2001 2002 2003 2004 2005 2006 2007 2008 2009 2010 2011 2012
% D
iffe
rne
ce
be
twe
en
Op
en
Are
as
an
d F
RA
s
0%
10%
20%
30%
40%
50%
60%
70%
80%
90%
100%
1999 2000 2001 2002 2003 2004 2005 2006 2007 2008 2009 2010 2011 2012
% D
iffe
rne
ce
be
twe
en
Op
en
Are
as
an
d F
RA
s
0%
10%
20%
30%
40%
50%
60%
70%
80%
90%
100%
1999 2000 2001 2002 2003 2004 2005 2006 2007 2008 2009 2010 2011 2012
% Differnece between Open Areas and FRAs
0%
10%
20%
30%
40%
50%
60%
70%
80%
90%
100%
1999 2000 2001 2002 2003 2004 2005 2006 2007 2008 2009 2010 2011 2012
% D
iffe
rne
ce
be
twe
en
Op
en
Are
as
an
d F
RA
s

62
Xanthichthys auromarginatus Open-FRA diff. +68% Acanthurus nigrofuscus Open-FRA diff. +58%
Halichoeres ornatissimus Open-FRA diff. +64% Acanthurus olivaceus Open-FRA diff. +55%
Canthigaster jactator E Open-FRA diff. +82% Chaetodon quadrimaculatus Open-FRA diff. +78%
Figure 40 con’t. White list species exhibiting higher population densities in areas open to collecting relative to FRAs. The graph columns represent the % difference in density between open and FRA areas. Bars above the x axis indicate densities are higher in the open areas relative to the FRAs
0%
10%
20%
30%
40%
50%
60%
70%
80%
90%
100%
1999 2000 2001 2002 2003 2004 2005 2006 2007 2008 2009 2010 2011 2012
% D
iffe
rne
ce
be
twe
en
Op
en
Are
as
an
d F
RA
s
0%
10%
20%
30%
40%
50%
60%
70%
80%
90%
100%
1999 2000 2001 2002 2003 2004 2005 2006 2007 2008 2009 2010 2011 2012
% D
iffe
rne
ce
be
twe
en
Op
en
Are
as
an
d F
RA
s
0%
10%
20%
30%
40%
50%
60%
70%
80%
90%
100%
1999 2000 2001 2002 2003 2004 2005 2006 2007 2008 2009 2010 2011 2012
% D
iffe
rne
ce
be
twe
en
Op
en
Are
as
an
d F
RA
s
0%
10%
20%
30%
40%
50%
60%
70%
80%
90%
100%
1999 2000 2001 2002 2003 2004 2005 2006 2007 2008 2009 2010 2011 2012
% D
iffe
rne
ce
be
twe
en
Op
en
Are
as
an
d F
RA
s
0%
10%
20%
30%
40%
50%
60%
70%
80%
90%
100%
1999 2000 2001 2002 2003 2004 2005 2006 2007 2008 2009 2010 2011 2012
% Differnece between Open Areas and FRAs
0%
10%
20%
30%
40%
50%
60%
70%
80%
90%
100%
1999 2000 2001 2002 2003 2004 2005 2006 2007 2008 2009 2010 2011 2012
% D
iffe
rne
ce b
etw
ee
n O
pe
n A
reas
and
FR
As

63
Cirrhitops fasciatus Open-FRA diff. +66% Hemitaurichthys polylepis Open-FRA diff. +97%
Chaetodon miliaris E Open-FRA diff. +85% Dascyllus albisella E Open-FRA diff. +41%
Figure 40 con’t. White list species exhibiting higher population densities in areas open to collecting relative to FRAs. The graph columns represent the % difference in density between open and FRA areas. Bars above the x axis indicate densities are higher in the open areas relative to the FRAs.
Aquarium Species Population and Catch Analysis The second approach to assessing white list inclusion estimated actual populations of the species on the list and related those numbers to the aquarium catch of that species. Most aquarium collecting in West Hawaiʹi occurs primarily in mid-depth ranges. While abundance and conditions can and will alter collecting depths, Stevenson et al. (2011) reported that the majority of aquarium fishers collect between 41’- 59’. A population estimate was thus made based on a depth range of 30’-60’ which broadly corresponds to the depths encompassed by DAR West Hawaiʹi transect data (Table 4). An added advantage of this data set is that survey sites span a considerable portion of the West Hawaiʹi coastline and include both open and closed areas. Mean densities for the species on the white list for which adequate data existed were calculated for the period 2010-2012 at open survey sites. Three species (Lutjanus kasmira, Chaetodon Kleinii and Centropyge fisheri) are also included in this analysis even though it is clear that their
0%
10%
20%
30%
40%
50%
60%
70%
80%
90%
100%
1999 2000 2001 2002 2003 2004 2005 2006 2007 2008 2009 2010 2011 2012
% D
iffe
rne
ce
be
twe
en
Op
en
Are
as
an
d F
RA
s
0%
10%
20%
30%
40%
50%
60%
70%
80%
90%
100%
1999 2000 2001 2002 2003 2004 2005 2006 2007 2008 2009 2010 2011 2012
% D
iffe
rne
ce
be
twe
en
Op
en
Are
as
an
d F
RA
s
0%
10%
20%
30%
40%
50%
60%
70%
80%
90%
100%
1999 2000 2001 2002 2003 2004 2005 2006 2007 2008 2009 2010 2011 2012
% D
iffe
rne
ce
be
twe
en
Op
en
Are
as
an
d F
RA
s
0%
10%
20%
30%
40%
50%
60%
70%
80%
90%
100%
1999 2000 2001 2002 2003 2004 2005 2006 2007 2008 2009 2010 2011 2012
% Differnece between Open Areas and FRAs

64
populations are substantially underestimated. A GIS was used to determine the total area of hard bottom reef in the 30’ -60’ depth range that was open to aquarium collecting. Total populations in the 30’ -60’ depth range were the product of open area density X open area (10.55 km2). This population was then related to the average catch of the species for the period FY 2010-2012 (Table 9). Table 9. Population estimates and % of population taken by aquarium collectors of ‘White List’ species. “E” indicates an endemic species, “Catch” is the average aquarium catch over FY 2010 - 2012 and 30’-60’ Population” is an estimate of total numbers of fish (excluding YOY) in collected open areas of hard bottom habitat in 30’- 60’ depths. “Catch as % of Population” is the % of the species’ population in collected open areas taken annually by aquarium collectors
Scientific Name Common Name Catch 30’-60’
Population
Catch as % of
Population Acanthurus achilles Achilles Tang 9,801 13,666 77.38% Zebrasoma flavescens Yellow Tang 295,047 848,622 34.77% Ctenochaetus hawaiiensis Chevron Tang 2,602 20,055 12.97% Acanthurus nigricans Goldrim Surgeonfish 381 4,887 7.80% Macropharyngodon geoffroy Shortnose Wrasse E 252 4,398 5.73% Coris gaimard Yellowtail Coris 614 14,660 4.19% Naso lituratus Orangespine Unicornfish 4,272 113,994 3.75% Forcipiger flavissimus Forcepsfish 1,413 40,109 3.52% Chaetodon quadrimaculatus Fourspot Butterflyfish 662 21,745 3.05% Chaetodon miliaris Milletseed Butterflyfish E 313 10,995 2.84% Acanthurus olivaceus Orangeband Surgeonfish 786 33,776 2.33% Ostracion meleagris Spotted Boxfish 152 7,086 2.15% Ctenochaetus strigosus Goldring Surgeonfish (Kole) 38,431 2,570,143 1.50% Chaetodon kleinii Blacklip Butterflyfish 53 3,909 1.36% Pseudojuloides cerasinus Smalltail Wrasse 244 21,012 1.16% Lutjanus kasmira Bluestripe Snapper 52 6,597 0.78% Gomphosus varius Bird Wrasse 338 56,196 0.60% Centropyge potteri Potter’s Angelfish E 1,022 218,489 0.47% Hemitaurichthys polylepis Pyramid Butterflyfish 181 41,536 0.44% Halichoeres ornatissimus Ornate Wrasse 926 211,100 0.44% Chaetodon multicinctus Multiband Butterflyfish E 1,293 339,871 0.38% Centropyge fisheri Fisher’s Angelfish 74 22,478 0.33% Sufflamen bursa Lei Triggerfish 209 63,330 0.33% Xanthichthys auromarginatus Gilded Triggerfish 29 9,500 0.31% Melichthys niger Black Durgon 79 26,632 0.30% Dascyllus albisella Hawaiian Dascyllus E 149 55,463 0.27% Paracirrhites forsteri Blackside Hawkfish 45 16,888 0.26% Thalassoma duperrey Saddle Wrasse E 656 314,539 0.21% Acanthurus thompsoni Thompson’s Surgeonfish 133 71,774 0.19% Cirrhitops fasciatus Redbarred Hawkfish 9 7,574 0.12%

65
Pseudocheilinus octotaenia Eightline Wrasse 126 183,657 0.07% Acanthurus nigrofuscus Brown Surgeonfish 809 1,381,650 0.06% Canthigaster jactator Hawaiian Whitespotted Toby E 97 211,100 0.05% Pseudocheilinus tetrataenia Fourline Wrasse 81 301,873 0.03% Cephalopholis argus Peacock Grouper 1 27,609 0.00% Anampses chrysocephalus Psychedelic Wrasse E 387 N/A N/A Chaetodon tinkeri Tinker’s Butterflyfish 217 N/A N/A Cirrhilabrus jordani Flame Wrasse E 96 N/A N/A Pseudanthias hawaiiensis Hawaiian Longfin Anthias E 75 N/A N/A Acanthurus dussumieri Eyestripe Surgeonfish 61 N/A N/A N/A – Species occurs in habitats not adequately surveyed by transects
Based on this analysis aquarium collecting is having the largest impacts on Achilles Tang and Yellow Tang. Several collectors have indicated that fair numbers of Achilles Tang still occur along the most southerly stretch of reefs on the Island of Hawaiʹi. Achilles Tang has had low levels of recruitment over the past decade (Fig 33) and substantial numbers of larger fish (i.e. ‘breeders’) are taken for human consumption. Given these factors, population declines and a substantial aquarium impact are not surprising. There is currently a proposed bag limit for aquarium collectors of 10 fish/person/day undergoing Hawaii Administrative rulemaking. Yellow Tang has generally recruited reliably (Figure 30) and aquarium take has been decreasing in recent years from a previous period of continual and likely unsustainable increases (Fig 41). The price per fish paid by dealers to collectors has increased almost 1.8X since 2000 but has declined over the last three years, likely an effect of the U.S. economic recession.
Figure 41. West Hawaiʹi Yellow Tang catch since FRA establishment and price per fish
(adjusted for inflation)
$0.00
$0.50
$1.00
$1.50
$2.00
$2.50
$3.00
$3.50
$4.00
$4.50
$5.00
0
50,000
100,000
150,000
200,000
250,000
300,000
350,000
400,000
450,000
2000 2001 2002 2003 2004 2005 2006 2007 2008 2009 2010 2011 2012
Pri
ce
pe
r F
ish
Nu
mb
er
Ca
ug
ht
Yellow Tang
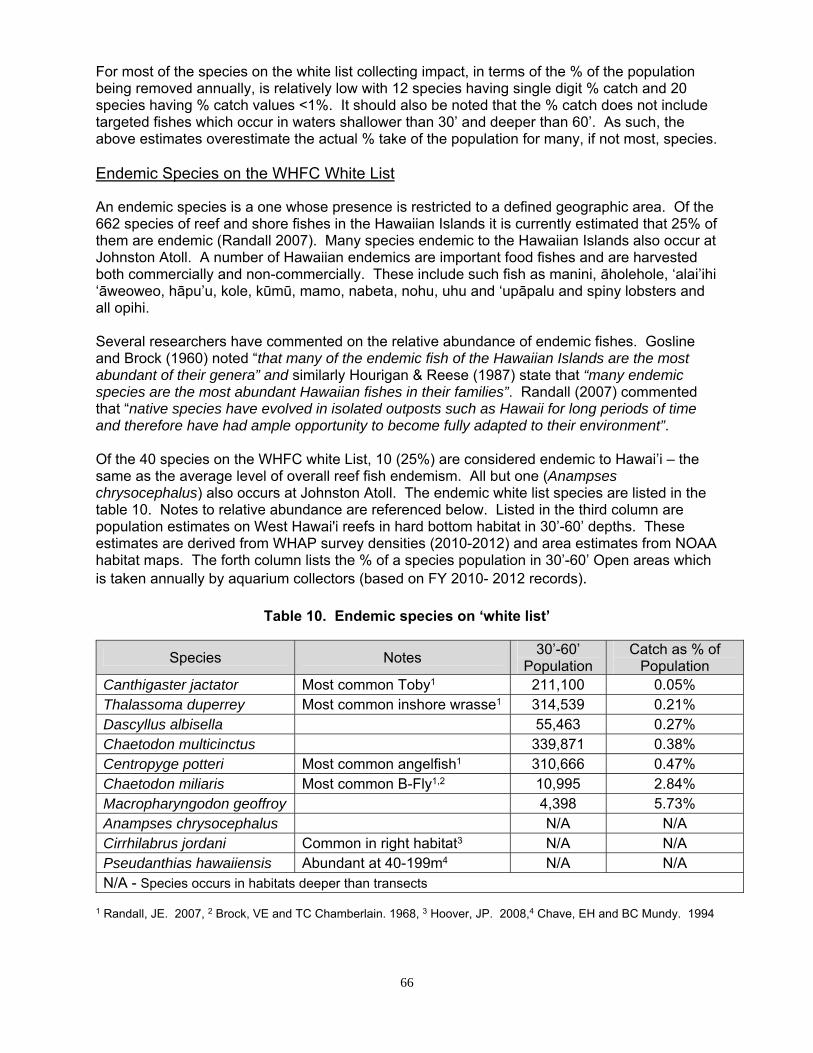
66
For most of the species on the white list collecting impact, in terms of the % of the population being removed annually, is relatively low with 12 species having single digit % catch and 20 species having % catch values <1%. It should also be noted that the % catch does not include targeted fishes which occur in waters shallower than 30’ and deeper than 60’. As such, the above estimates overestimate the actual % take of the population for many, if not most, species. Endemic Species on the WHFC White List
An endemic species is a one whose presence is restricted to a defined geographic area. Of the 662 species of reef and shore fishes in the Hawaiian Islands it is currently estimated that 25% of them are endemic (Randall 2007). Many species endemic to the Hawaiian Islands also occur at Johnston Atoll. A number of Hawaiian endemics are important food fishes and are harvested both commercially and non-commercially. These include such fish as manini, āholehole, ‘alai’ihi ‘āweoweo, hāpu’u, kole, kūmū, mamo, nabeta, nohu, uhu and ‘upāpalu and spiny lobsters and all opihi. Several researchers have commented on the relative abundance of endemic fishes. Gosline and Brock (1960) noted “that many of the endemic fish of the Hawaiian Islands are the most abundant of their genera” and similarly Hourigan & Reese (1987) state that “many endemic species are the most abundant Hawaiian fishes in their families”. Randall (2007) commented that “native species have evolved in isolated outposts such as Hawaii for long periods of time and therefore have had ample opportunity to become fully adapted to their environment”. Of the 40 species on the WHFC white List, 10 (25%) are considered endemic to Hawai’i – the same as the average level of overall reef fish endemism. All but one (Anampses chrysocephalus) also occurs at Johnston Atoll. The endemic white list species are listed in the table 10. Notes to relative abundance are referenced below. Listed in the third column are population estimates on West Hawaiʹi reefs in hard bottom habitat in 30’-60’ depths. These estimates are derived from WHAP survey densities (2010-2012) and area estimates from NOAA habitat maps. The forth column lists the % of a species population in 30’-60’ Open areas which is taken annually by aquarium collectors (based on FY 2010- 2012 records).
Table 10. Endemic species on ‘white list’
Species Notes 30’-60’
Population Catch as % of
Population Canthigaster jactator Most common Toby1 211,100 0.05% Thalassoma duperrey Most common inshore wrasse1 314,539 0.21% Dascyllus albisella 55,463 0.27% Chaetodon multicinctus 339,871 0.38% Centropyge potteri Most common angelfish1 310,666 0.47% Chaetodon miliaris Most common B-Fly1,2 10,995 2.84% Macropharyngodon geoffroy 4,398 5.73% Anampses chrysocephalus N/A N/A Cirrhilabrus jordani Common in right habitat3 N/A N/A Pseudanthias hawaiiensis Abundant at 40-199m4 N/A N/A N/A - Species occurs in habitats deeper than transects
1 Randall, JE. 2007, 2 Brock, VE and TC Chamberlain. 1968, 3 Hoover, JP. 2008,4 Chave, EH and BC Mundy. 1994

67
Figures 38-40 presented the difference in a species’ abundance in West Hawaiʹi Fish Replenishment Areas (FRAs, n=9) relative to Open Areas (n=9). Bars represent the % difference in abundance for each year from 1999 to 2012 Bars above the horizontal x axis indicate the species was more abundant in the Open Areas (aquarium collected) than the FRAs. Similarly, bars below the x axis indicate greater abundance in the FRAs than the Open Areas. Of the 8 endemic species for which we have survey data, only the Multiband Butterflyfish (Chaetodon multicinctus) is consistently less abundant in the Open Areas than the FRAs indicating very low aquarium related impact on the other species at present. For the Multiband Butterflyfish the FRA/Open difference has been decreasing in recent years and in 2012 there were slightly more of this species in the Open Areas than in the FRAs. The % of the population of Multiband Butterflyfish taken annually by aquarium collectors in recent years is 0.38% (Table 10). Six of 10 endemic species on the white list are regarded as being common in suitable habitat. The population estimates presented represent only a portion of available habitat where these species occur. Thus total populations are invariably higher than indicated for just the 30’-60’ depth range. For the 7 species for which we have data all of them have <6% of their open area population collected annually. Five of the 7 species have <1% of their population collected. Populations in MPAs and FRAs are essentially not collected and as indicated above total populations are higher than estimated in just the 30’-60’ depth range. This means the percentage of the total population taken by aquarium collectors is substantially lower than indicated in the table above. Given past and present collecting preferences and effort, the inclusion of these endemic species on the white list appears to pose little or no threat to populations on West Hawaiʹi reefs. Attention should continue to be paid however to the Shortnose Wrasse (M. geoffroy) which has the lowest estimated population in the survey depth range and the highest relative level of collection. Similarly, caution should be exercised regarding the Psychedelic Wrasse (A. chrysocephalus), Flame Wrasse (Cirrhilabrus jordani) and Hawaiian Longfin Anthias (Pseudanthias hawaiiensis) for which current abundance data is inadequate. Aquarium reef fish catch vs. non-aquarium catch Controversy over aquarium collecting has become ever most pervasive in recent years due primarily to a small cadre of anti-aquarium collecting activists on the island of Maui. In their view, management of the aquarium fishery is not an option; it should not even be regarded as a ‘fishery’ and only a total outright ban is acceptable. Unfortunately their concern regarding impacts of aquarium collecting has not focused solely on the reefs of Maui. Considerable time, effort and expense have been expended by this group at thwarting community-based management efforts in West Hawaiʹi such as the establishment of the ‘white list, size and bag limits for key targeted aquarium species and a West Hawaiʹi specific aquarium permit. The latter is a preliminary step in the development of a limited entry aquarium fishery along this section of the Hawaiʹi Island. In order to gain a more balanced perspective on the generalized impact on reef fishes by aquarium collecting vis á vis other types of reef fishing activities, reef fish landings by aquarium collectors were compared with that of other commercial fishers and non-commercial ‘recreational’ fishers. Both aquarium collectors and other commercial fishers are required by law and Administrative Rule to submit catch reports and thus island specific reef fish catch data is available for each group. As noted previously (Fig 28) recent analysis suggests that

68
aquarium catch reports appear to fairly accurately reflect actual catch. Unfortunately similar assurance isn’t available for other commercial catch reports. Recreational fishers in Hawai’i are not required to submit catch reports but such catch data has been collected since 2003 by the Hawaii Marine Recreational Marine Fishing Survey (HMRFS) and subsequently since 2007 by NOAA’s Marine Recreational Information Program (MRIP). Species-specific recreational catch data on a statewide basis is available online: http://www.st.nmfs.noaa.gov/st1/recreational/queries/custom_time_series.html. All MRIP catch data from 2008 thru 2010 was decreased by a factor of 81.96% (i.e., 1/1.22) because of a count error made by NOAA in the population household numbers for Maui County (Hongguang 2012). Over the past four years the number of reef fishes caught statewide by the recreational and commercial sectors has been quite comparable averaging 1,511,025/yr. for recreational fishers and 1,554,010/yr. for commercial (i.e. non-aquarium) fishers (Fig. 42).
Figure 42. Comparison of the number of reef fishes caught by recreational and
commercial fishers in the Main Hawaiian Islands The combined catch however is 1.7X the total statewide take (1,810,402/yr.) of aquarium fishes. The average yearly biomass (pounds) of reef fish caught by commercial fishers was similar for both commercial fishers (1,199,520 lbs.) and recreational fishers (1,160,337 lbs.) (Fig. 43). A biomass comparison was not made with the aquarium catch.
0
500,000
1,000,000
1,500,000
2,000,000
2,500,000
2008 2009 2010 2011
Nu
mb
er
of
Re
ef
Fis
h C
au
gh
t A
nn
ua
lly
Recreational Catch
Commercial Catch

69
Figure 43. Comparison of the biomass of reef fishes caught by recreational and
commercial fishers in the Main Hawaiian Islands To compare total reef fish catches for the various fishing sectors on a more localized area basis it was necessary to apportion the recreational catch among island areas. An adjustment factor was calculated based on the percentage of statewide commercial reef fish landings reported from each area (generally island or county as well as West Hawai’i). A separate adjustment factor was derived for both number of reef fishes caught and biomass. Biomass was estimated for aquarium fish catch by specifying a targeted size or typical maximum size of collected species based on information provided by active collectors (n= 7) and Stevenson et.al. (2011). Size data was then converted to weight utilizing length to weight conversion factors (DAR database). In West Hawaiʹi the aquarium fishery takes 1.8X the number of reef fishes taken by recreational and other commercial fishers combined (Figure 44). 81% of the aquarium caught fishes are a single species – the Yellow Tang. In terms of all other reef fish species, the recreational and commercial fisheries combine to take 3X the number of reef fishes caught by aquarium collectors (Figure 45).
0
200,000
400,000
600,000
800,000
1,000,000
1,200,000
1,400,000
1,600,000
2008 2009 2010 2011
Po
un
ds
of
Re
ef
Fis
h C
au
gh
t A
nn
ua
lly
Recreational Catch
Commercial Catch
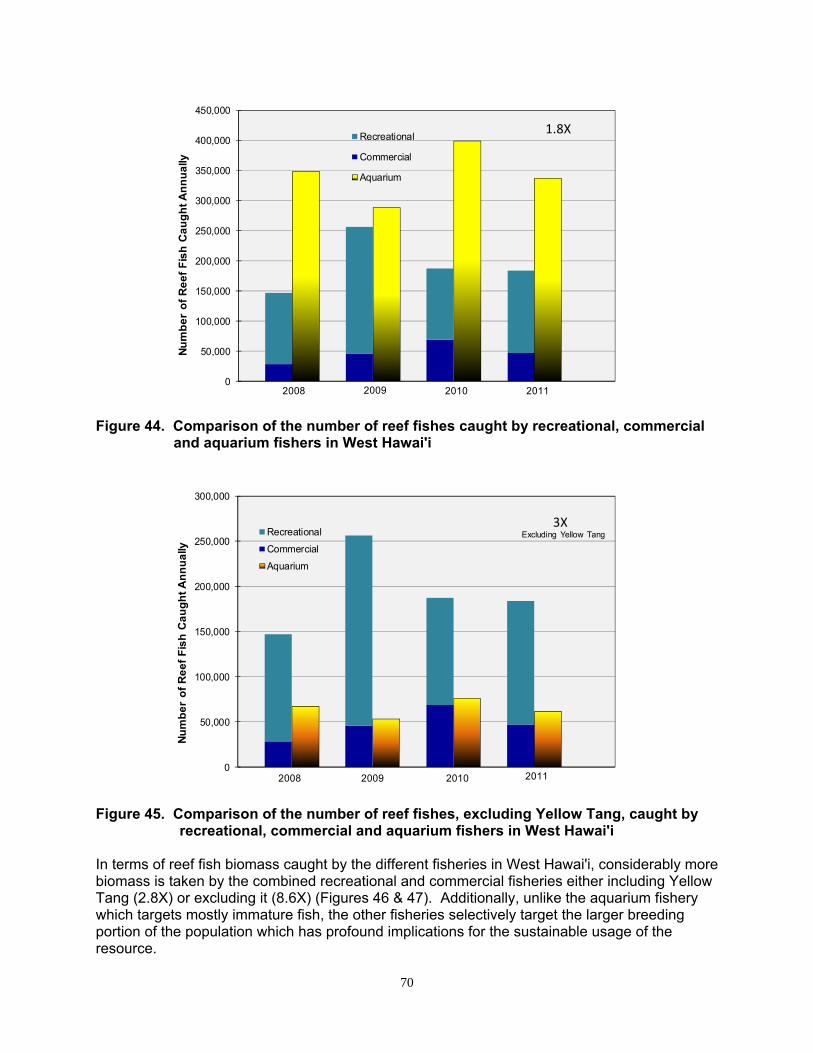
70
Figure 44. Comparison of the number of reef fishes caught by recreational, commercial
and aquarium fishers in West Hawaiʹi
Figure 45. Comparison of the number of reef fishes, excluding Yellow Tang, caught by
recreational, commercial and aquarium fishers in West Hawaiʹi In terms of reef fish biomass caught by the different fisheries in West Hawaiʹi, considerably more biomass is taken by the combined recreational and commercial fisheries either including Yellow Tang (2.8X) or excluding it (8.6X) (Figures 46 & 47). Additionally, unlike the aquarium fishery which targets mostly immature fish, the other fisheries selectively target the larger breeding portion of the population which has profound implications for the sustainable usage of the resource.
0
50,000
100,000
150,000
200,000
250,000
300,000
350,000
400,000
450,000
2008 2009 2010 2011
Nu
mb
er
of
Re
ef
Fis
h C
au
gh
t A
nn
ua
lly
Recreational
Commercial
Aquarium
1.8X
2008 2009 2010 2011
0
50,000
100,000
150,000
200,000
250,000
300,000
2008 2009 2010 2011
Nu
mb
er
of
Re
ef
Fis
h C
au
gh
t A
nn
ua
lly
Recreational
Commercial
Aquarium
3XExcluding Yellow Tang
2008 2009 2010 2011
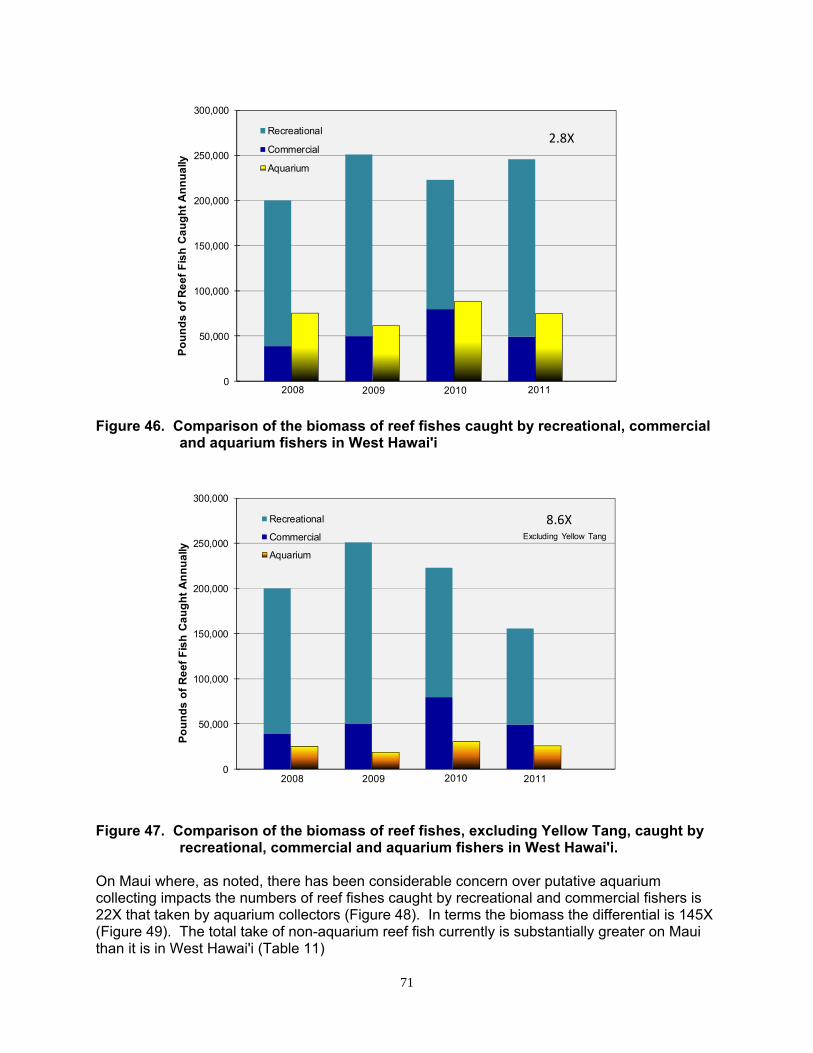
71
Figure 46. Comparison of the biomass of reef fishes caught by recreational, commercial
and aquarium fishers in West Hawaiʹi
Figure 47. Comparison of the biomass of reef fishes, excluding Yellow Tang, caught by recreational, commercial and aquarium fishers in West Hawaiʹi.
On Maui where, as noted, there has been considerable concern over putative aquarium collecting impacts the numbers of reef fishes caught by recreational and commercial fishers is 22X that taken by aquarium collectors (Figure 48). In terms the biomass the differential is 145X (Figure 49). The total take of non-aquarium reef fish currently is substantially greater on Maui than it is in West Hawaiʹi (Table 11)
0
50,000
100,000
150,000
200,000
250,000
300,000
2008 2009 2010 2011
Po
un
ds
of
Re
ef
Fis
h C
au
gh
t A
nn
ua
lly
Recreational
Commercial
Aquarium
2.8X
2008 2009 2010 2011
0
50,000
100,000
150,000
200,000
250,000
300,000
2008 2009 2010 2011
Po
un
ds
of
Re
ef
Fis
h C
au
gh
t A
nn
ua
lly
Recreational
Commercial
Aquarium
8.6XExcluding Yellow Tang
2008 2009 2010 2011

72
Figure 48. Comparison of the numbers of reef fishes caught by recreational, commercial and aquarium fishers on Maui
Figure 49. Comparison of the biomass of reef fishes caught by recreational, commercial and aquarium fishers on Maui
Table 11. Comparison of the number and pounds of reef fishes caught by recreational
and commercial fishers on Maui and in West Hawaiʹi
Recreational Catch Commercial Catch Maui West Hawaiʹi Maui West Hawaiʹi
Number Caught 218,474 146,176 71,730 48,498 Pounds Caught 342,769 153,193 122,268 55,468
Lay gill net management As mandated by Act 306, SLH 1998, a laynet (i.e. gill net) management plan was developed over four years by the WHFC and DAR. The recommended plan became incorporated in Hawaii Administrative Rule §13-60.3 in 2005. The rule provides for continued small-scale subsistence-level netting while effectively controlling large-scale commercial netting. Eight areas have been designated where the use of gill nets is prohibited. Along with existing no gill-netting areas, approximately 25% of the coastline now prohibits the use of such nets (Figure 50).

73
Figure 50. Locations of laynet prohibited areas in West Hawai'i and shallow water resource fish survey sites Additional provisions of the rule were designed to encourage responsible net use and enhance enforcement. These include requirements such as net registration and numbered identification (floats and tags), maximum soak time of four hours and maximum net length of 125’. One area (Kaloko-Honokōhau FRA) was designated a Hawaiian cultural netting area where only locally constructed handmade nets of natural fibers may be used. The West Hawai′i laynet rules served as a model for the rest of the state and have generally been adopted elsewhere except for Maui which completely banned their use in 2007. Transects conducted in shallow water habitats, the areas most likely to be impacted by lay gill netters (Figure 51) indicate there is little difference in the biomass of three of four targeted food fish groups between areas open to netting (‘OPEN’ & ‘FRA’) and those prohibiting netting either beginning in 2005 (‘LAY) or those in Fisheries Management Areas (FMA) or Marine Life Conservation Districts (MLCD) which have had longer (>10 years) prohibitions on laynetting (‘LAY+’). At present parrotfish biomass is significantly greater in MPAs/MLCDs which prohibit lay gill netting (‘LAY+’) and OPEN areas as compared to FRAs and areas just prohibiting lay gill nets (LAY) (ANOVA p<0.004). In terms of parrotfish biomass there presently are no differences between ‘LAY+’ and ‘OPEN’ areas. Given the fact that parrotfishes are not caught by lay nets at night and that they also appear to be rarely caught by lay nets even

74
during the day (Puleloa, 2012), differences in parrotfish biomass abundance between management areas is not likely due to whether or not lay gill netting is prohibited.
Figure 51. Biomass of ‘Resource’ (i.e. food) fish on shallow water transects in various management areas. ‘LAY’ are survey sites (N=20) which were closed to gill netting in 2005. ‘LAY+’ (N=44) are FMA and MLCD sites which have prohibited netting for >10 years. ‘Open’ denotes surveys (n=82) in areas where lay gill netting is permitted. Only fish > 15 cm TL are censused in these surveys
The reasons for the lack of differences between open and laynet protected areas may relate to one or more of several factors: (i) the newly protected areas haven't had sufficient time to become fully effective; (ii) the protected areas are not effectively enforced; (iii) the sites of many of the shallow water resource transects may be areas where netting is impractical (i.e. rocky shorelines, sharp reef drop-offs, etc.) and (iv) the overall level of laynet fishing is relatively low. This last factor is supported by the low number of lay gill nets registered in West Hawai′i (79 as of Feb. 2013) as compared to other islands (e.g. 796 on Oʹahu in 2009). Invertebrates Crown-of-Thorns Starfish While Acanthaster planci is native to Hawaiʹi and not an introduced species it nevertheless is of substantial concern to the general public due to its reputation as a ‘coral killer’ and the publicity generated by massive outbreaks on other Pacific islands. The last reported large-scale occurrence in Hawaiʹi of the Crown-of-Thorns Starfish (COTS) was in August 1969 when approximately 20,000 starfish were observed off the
0
5
10
15
20
25
30
FRA LAY LAY+ OPEN
Bio
ma
ss
gm
/m2
Management Status
Surgeonfishes
Parrotfishes
Goatfishes
Jacks

75
south shore of Molokaʹi. Since that time there have only been scattered reports of COTS aggregations and all have been of considerably lesser magnitude. Data from surveys reflect the low absolute abundance of COTS on West Hawaiʹi reefs but does indicate a recent rebound in numbers following a substantial decline beginning in 2006 (Figure 52).
Figure 52. Overall Crown-of-Thorns abundance on West Hawai′i transects and 10
minute free swim surveys COTS Aggregation
On September 13, 2012 aggregations of Acanthaster planci were discovered at West Hawaiʹi survey site 7, near Kaʹūpūlehu on the Kona Coast. This site is located at 10-18 m depth range. One week later, on September 20th, as part of a scheduled monitoring survey, COTS were counted on the four permanent 25m x 4m transects at site 7 and during a 10 minute ‘free swim’ survey around the perimeter of the site. To further assess the extent of the outbreak, four divers spaced approximately 10m apart swam at depths from 6m to 20m north from the site and conducted a 5 minute swim counting all COTS within a 5m visual belt survey. Due to the unusually high COTS abundance on the transects and the 5 minute swim, the team returned again to the site on September 26, 2012 to further assess the outbreak. Surveys methods described above are part of a developing rapid response protocol established by Eyes of the Reef Network in collaboration with DAR monitoring techniques.
0
0.1
0.2
0.3
0.4
0.5
0.6
0
0.1
0.2
0.3
0.4
0.5
0.6
1999 2000 2001 2002 2003 2004 2005 2006 2007 2008 2009 2010 2011 2012
Nu
mb
er/
10
min
. F
ree
sw
im
Nu
mb
er/
10
0m
2
Transect
Free Swim
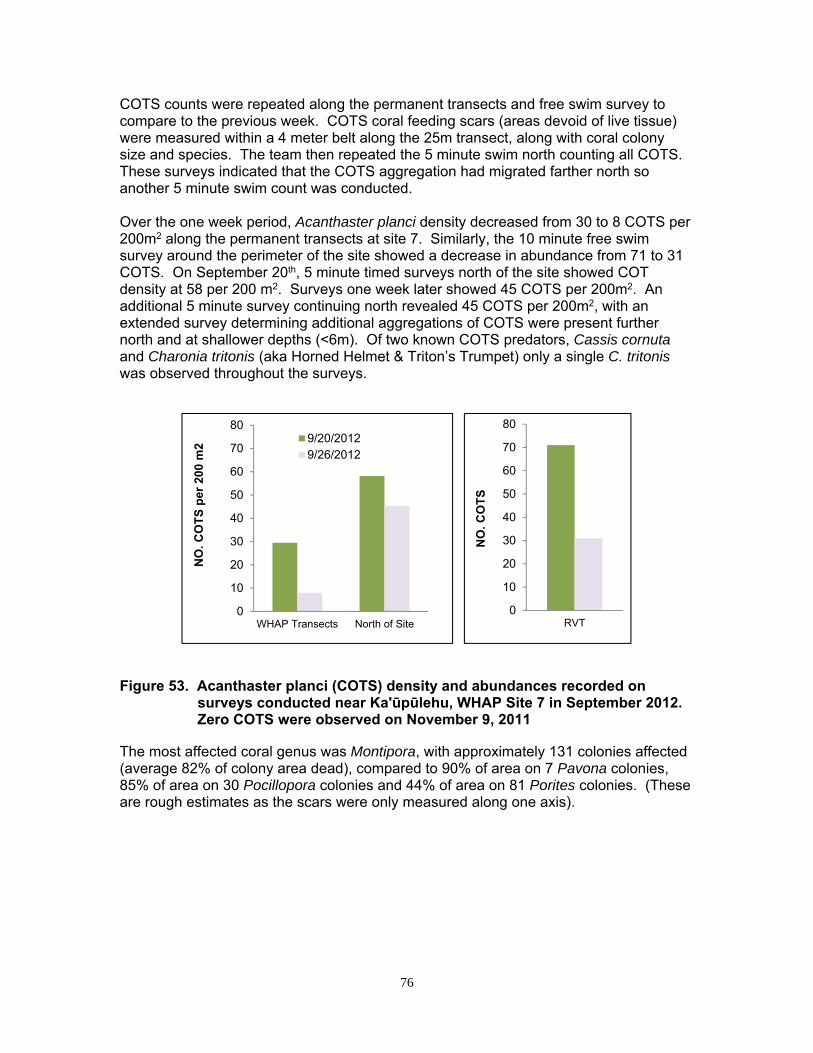
76
COTS counts were repeated along the permanent transects and free swim survey to compare to the previous week. COTS coral feeding scars (areas devoid of live tissue) were measured within a 4 meter belt along the 25m transect, along with coral colony size and species. The team then repeated the 5 minute swim north counting all COTS. These surveys indicated that the COTS aggregation had migrated farther north so another 5 minute swim count was conducted. Over the one week period, Acanthaster planci density decreased from 30 to 8 COTS per 200m2 along the permanent transects at site 7. Similarly, the 10 minute free swim survey around the perimeter of the site showed a decrease in abundance from 71 to 31 COTS. On September 20th, 5 minute timed surveys north of the site showed COT density at 58 per 200 m2. Surveys one week later showed 45 COTS per 200m2. An additional 5 minute survey continuing north revealed 45 COTS per 200m2, with an extended survey determining additional aggregations of COTS were present further north and at shallower depths (<6m). Of two known COTS predators, Cassis cornuta and Charonia tritonis (aka Horned Helmet & Triton’s Trumpet) only a single C. tritonis was observed throughout the surveys.
Figure 53. Acanthaster planci (COTS) density and abundances recorded on
surveys conducted near Kaʹūpūlehu, WHAP Site 7 in September 2012. Zero COTS were observed on November 9, 2011
The most affected coral genus was Montipora, with approximately 131 colonies affected (average 82% of colony area dead), compared to 90% of area on 7 Pavona colonies, 85% of area on 30 Pocillopora colonies and 44% of area on 81 Porites colonies. (These are rough estimates as the scars were only measured along one axis).
0
10
20
30
40
50
60
70
80
WHAP Transects North of Site
NO
. CO
TS
per
200
m2
9/20/20129/26/2012
0
10
20
30
40
50
60
70
80
RVT
NO
. CO
TS

77
Figure 54. Number of coral colonies observed at site 7 with COTS feeding ‘scars’
and approximate area of subsequent colony mortality
During regular monitoring of West Hawaiʹi sites, few COTS are usually recorded along the four permanent transects and the free swim survey maximum is typically maxed out at a single individual (Figure 52). However, on October 4, 2011, a total of 33 and 8 COTS were observed at site 7 during the free swim and fixed transects. Surveys conducted prior to and following the September 2012 outbreak, on July 31 and November 11, 2012) showed no COTS present at the site. The predominant coral species at this site is Porites lobata while the most affected genera were Montipora and Pocillopora. This finding is consistent with preferential feeding behavior on other Indo-Pacific reefs (Kayal et al. 2012). COTS aggregated in clusters with animals even piled upon one another rather than spread out (Figure 55A). There were well over 200 animals counted within an area where no more than a single individual is typically observed (WHAP data). As mentioned above, COTS most frequently preferred Montiporid and Pocilloporid colonies, consuming over 80% of most colonies. Benthic surveys in 2011 along the permanent transects showed percent coral cover at this site for Montipora sp. and Pocillopora sp. to be 1% and 0.3% cover respectively. However, a substantial number of Poritids were also preyed upon, which comprise approximate 26% of the 27.1% total coral cover at the site. Tissue loss resulting from biological interactions such as COTS predation also has the ability to further influence benthic community structure and coral health by making substrate available for algal colonization. Old COTS feeding scars were quickly
0
10
20
30
40
50
60
70
80
90
100
0
20
40
60
80
100
120
140
Montipora Pocillopora Pavona Porites
Nu
mb
er o
f C
olo
nie
s
Genus
% o
f Co
lon
y area affected
# Colonies % Area

78
overgrown by algae along the permanent transects (Figure 55B). Tissue loss of corals is known to result from algal-coral interactions (Haas et al. 2010). Coral-algal interactions were surveyed along West Hawaiʹi in 2010 and 2011 as part of a coral health monitoring program conducted by Courtney S. Couch (Cornell University Ph.D candidate) in collaboration with DAR. Algal overgrowth and the resulting coral tissue mortality were widespread both in the shallow habitats (3-6m) and deeper habitats (WHAP sites). These surveys revealed that algal overgrowth was significantly higher in shallow habitats, with no clear seasonal trend across all the sites. Between 1-15% of all the coral colonies were overgrown by algae to some degree. Surveys revealed active algal overgrowth of live corals paired with tissue loss, primarily by Corallophila huysmansii (Figure 55C) (Couch et al. in prep). C. huysmansii has the ability to settle on, overgrow, and kill live coral tissue through the hypothesized use of cytotoxic allelochemicals (Jompa & McCook2003). With upwards of 15% of all colonies affected by algal overgrowth and approximately 44% of the affected Poritid colonies directly impacted by COTS predation at the outbreak site, biological interactions such as algal overgrowth and COTS predation may have a large, but underestimated, influence on not only coral health but also to benthic community structure and percent live coral cover along West Hawaiʹi.
(A)
(B)
(C) Figure 55. A) Crown-of-Thorns Starfish (COTS) aggregation monitored at
Kaʹūpūlehu (Site 7) in September 2012. Note: Arrow indicates COTS feeding scar on Porites lobata with algal colonization, B) Recent COTS feeding scar on P. lobata colony, C) Previously documented tissue loss of P. lobata colony at same site with colonization of turf algae and the filamentous Corallophila huysmansii, photographed on March 27, 2011

79
Over several weeks of monitoring, the Crown-of-Thorns Starfish aggregation appeared to be migrating slowly in a northerly direction and into shallower depths, presumably where more Pocillopora and Montipora colonies might be found, behavior which is consistent with other studies (Kayal et al. 2012). This COTS outbreak is clearly disturbing the coral community’s diversity in an area that has already experienced strong storm damage and decreasing coral cover (net loss of 13% from 2003 - 2011). Moreover, only a single predator of COTS, Charonia tritonis (Triton’s Trumpet), was observed at the site. Monitoring of COTS populations will continue and immediate protection of their predators, C. tritonis and Cassis cornuta (Triton’s Trumpet and Horned Helmet) is proposed for West Hawaiʹi and is highly recommended throughout the State of Hawaiʹi. Urchins Three of four of the most common surveyed urchin species have increased in West Hawaiʹi since monitoring began in 1999. This increase has been very substantial for the Collector Urchin, Tripneustes gratilla which has increased by 6.1X between 1999/2000 – 2010/2012 (Figure 56). The estimated population of Collector Urchin on West Hawaiʹi reefs in the 30’ -60’ depth range is 9,678,711. Based on data presented in previous monitoring reports this increase does not appear to be related to a substantial increase in food supply (i.e. benthic algae) along the coast. Likewise there is no indication that potential food competitors such as herbivorous fishes (e.g. acanthurids and scarids) have markedly decreased. In actuality herbivores in general have increased in West Hawaiʹi (Figure 18) along with the urchins.
Figure 56. Abundance (Mean ± SE) of Collector Urchin Tripneustes gratilla, Red
Slate Pencil Urchin Heterocentrotus mammillatus and Banded Urchin Echinothrix calamaris on transects
0
10
20
30
40
50
60
70
1999 2000 2001 2002 2003 2004 2005 2006 2007 2008 2009 2010 2011 2012
Nu
mb
er/
10
0m
2
T. gratilla
H. Mammillatus
E. calamaris

80
Even though urchin densities are increasing for three species, present abundance may still be lower than in previous years for some species at locations such as Kealakekua Bay which was surveyed for urchins in 1968 (Ebert, 1971). East Hawaiʹi To date, abundance of fishes among sites is significantly different, being more abundant at both Waiopae sites than at Richardson’s Ocean Center (Figure 57A). Species richness among sites is also significantly different among sites, being higher on MLCD transects compared to ROC (Figure 57 B). There are no among-site differences in species diversity (p= 0.435) (Figure 57 C). The MLCD and ROC sites have the highest similarity in their fish communities, and the OPEN and ROC communities have the lowest similarity (Table 12).
Figure 57. Fish community parameters at Waiopae (MLCD & OPEN) and Richardson’s Ocean Center (all survey years pooled) Data are means and standard errors. (A) abundance; (B) Species richness; (C) S-W Diversity.
(A)
(B) (C)

81
Table 12. Percent Similarity from pairwise site comparisons.
Location Percent Similarity
MLCD vs. OPEN 69.3% MLCD vs. ROC 72.7% OPEN vs. ROC 53.1%
Over the twelve years of surveying of fishes at Waiopae and Richardson’s, there appears to have been a slight increase in fishes observed between 1999 and 2006, followed by a three-year decline, with an upturn on fishes seen so far in 2010 (Figure 58). There is generally good concordance in the year-to-year abundance of fishes among survey sites (Figure 58). Since the delineation of the Waiopae MLCD on June 16, 2003, no net increase in fish abundance has been observed.
Figure 58. Annual mean abundance (+SE) of fishes at Waiopae and Richardson’s Ocean Center.

82
Of the 136 species recorded on transects at the three locations, most individuals are from one of six families: Labridae, Scaridae, Acanthuridae, Pomacentridae, Tetraodontidae, and Chaetodontidae (Table 13, Figure 59). Labrids and pomacentrids were particularly abundant at all three sampling areas, but scarids were only abundant on Waiopae Open transects. All of the transect lines in this area are deeper than other sites and two traverse a level area with abundant turf algae which appears to attract large numbers of scarids. Species densities at the three East Hawaiʹi sites are listed in Appendix I.
Table 13. Individuals per 100 m2 by family at East Hawaiʹi sites (n = 224 transects at Waiopae Sites; n = 172 at Richardson's Ocean Center).
Family OPEN MLCD ROC Acanthuridae 13.10 6.12 9.88 Apogonidae 0.02 0.00 0.00 Aulostomidae 0.05 0.02 0.01 Balistidae 0.04 0.05 0.13 Belonidae 0.00 0.10 0.09 Blenniidae 1.30 1.06 0.35 Caracanthidae 0.00 0.01 0.04 Chaetodontidae 2.33 2.99 1.26 Cirrhitidae 0.11 0.40 1.41 Diodontidae 0.00 0.00 0.00 Fistulariidae 0.33 0.09 0.06 Gobiidae 0.03 0.01 0.00 Holocentridae 0.03 0.04 0.01 Kyphosidae 0.00 0.59 0.00 Labridae 48.54 52.46 39.52 Lutjanidae 0.04 0.40 0.00 Monacanthidae 0.02 0.01 0.01 Mugilidae 0.00 0.01 0.11 Mullidae 0.62 0.14 0.05 Muraenidae 0.09 0.14 0.14 Myliobatidae 0.00 0.00 0.00 Ophichthidae 0.00 0.00 0.00 Ostraciidae 0.05 0.19 0.05 Pomacanthidae 0.00 0.00 0.00 Pomacentridae 16.91 33.54 33.31 Scaridae 29.29 4.12 1.31 Scorpaenidae 0.00 0.07 0.23 Serranidae 0.15 0.41 0.01 Synodontidae 0.03 0.03 0.03 Tetraodontidae 4.12 4.11 2.72 Zanclidae 0.06 0.10 0.03 Pooled Individuals/100 m2 = 117.3 107.2 90.7

83
Figure 59. Waiopae Open/MLCD and ROC fish abundance by family (all years pooled).
0
10
20
30
40
50
60
Acanthuridae Chaetodontidae Labridae Pomacentridae Scaridae Tetraodontidae
Mea
n N
um
ber
of
Ind
ivid
ual
s p
er 1
00
m2
OPEN
MLCD
ROC

84
REFERENCES
Aeby, G.S. (1998). A digenean metacercaria from the reef coral, Porites compressa, experimentally identified as Podocotyloides stenometra. Journal of Parasitology 84:
Aeby, G.S. (2007). Spatial and temporal patterns of infection of Porites trematodiasis on
the reefs of Kaneohe Bay, Oahu, Hawaii. Bulletin of Marine Science 80:209-218.
Aeby, G.S, and Cotton, S.P. (2007) DAR monitoring report. Aeby, G., Williams, G.J., Franklin, E.C., Haapkyla, J., Harvell, C.D., Neale, S., Page,
C.A., Raymundo, L.J., Vargas-Angel, B., Willis, B.L., Work, T.M. and Davy, S.K. (2011). Growth anomalies on the coral genera Acropora and Porites are strongly associated with host density and human population size across the Indo-Pacific. PLoS ONE 6(2): e16887. doi:10.1371/journal.pone.0016887.
Baker, D. M. and Webster, K.L. (2010). Caribbean octocorals record changing carbon
and nitrogen sources from 1862 to 2005. Global Change Biology 16(10): 2701-2710.
Brock, V,E and T,C. Chamberlain. (1968). A geological and ecological reconnaissance off Western Oahu, Hawaii principally by means of the research submarine “Asherah”. Pac. Sci. XXII: 373-394.
Cesar, H., Beukering, P.V., Pintz, S., and Dierking, J. (2002). Economic valuation of the coral reefs of Hawai′i. Final Report. Hawai′i Coral Reef Initiative Research Program. 117 pp.
Chave, E.H and B.C Mundy. (1994). Deep-sea benthic fish of the Hawaiian Archipelago, Cross Seamount and Johnston Atoll. Pac. Sci. 48(4): 367-406.
Coral Disease Working Group. (2007) Coral disease, environmental drivers, and the balance between coral and microbial associates. Oceanography 20(1):172-195.
Couch, C., S., Garriques, J., Barnett, C., Preskitt, L., Work, T.W., Giddens, J., Walsh, W.
and Harvell, C. D. (in prep). Spatiotemporal Dynamics of Coral Health and Disease along the leeward coast of the Hawai`i Island. Ecological Monographs.
Division of Fish & Game. Annual Report of the Board of Agriculture and Forestry,
Territory of Hawaii. FY July 1,1955 – June 30,1956.
Forsman, Z.H., Rinkevich, B., and Hunter, C.L. (2006). Investigating fragment size for culturing reef-building corals (Porites lobata and P. compressa) in ex situ nurseries. Aquaculture. 261:89-97.
Grigg, R.W. and Maragos, J.E. (1974). Recolonization of hermatypic corals on submerged lava flows in Hawaii. Ecology 55: 387-395.
Haas, A., el-Zibdah M., Wild C. (2009) Seasonal monitoring of coral-algae interactions in fringing reefs of the Gulf of Aqaba, Northern Red Sea.

85
Harvell, C.D., Jordán-Dahlgren, E., Merkel, S., Rosenberg, E., Raymundo, L., Smith, G.W., Weil, E. and Willis, B.L. (2007). Coral disease, environmental drivers and the balance between coral and microbial associates. Oceanography 20:58-81.
Hawaii Statewide GIS Program. Department of Business, Economic Development and Tourism Office of Planning. http://hawaii.gov/dbedt/gis/
Hernandez-Munoz, D., Alcolado, P. M. and Hernandez-Gonzales, M. (2008). Effects of a
submarine discharge of urban waste on octocoral (Octocorallia: Alcyonacea) communities in Cuba. Revista de Biologia Tropical. 56(1):65-75.
Hongguang, M. (2012). Catch and Effort Estimates for 2003-2010 from the Hawaii
Marine Recreational Fishing Survey. PIFSC Internal Report IR-12-010. 08 March, 2012.
Hoover, J.P. (2008). The Ultimate Guide to Hawaiian Reef Fishes, Sea Turtles,
Dolphins, whales and seals. Mutual Publishing. 388p. Jompa, J., L.J. McCook. (2003) Coral-algal competition: macroalgae with different properties have different effects on corals. Marine Ecology Progress Series, Vol. 258: 87-95. Johnson, A. (2008) Groundwater discharge from the leeward half of the big island of
Hawai‘i. Masters in Science Thesis, University of Hawai‘i. Kaczmarsky, L. (2009) Characterizations of the major coral diseases of the Philippines:
ulcerative white spot disease and novel growth anomalies of Porites. Biology, Miami.
Kayal M., Vercelloni J., Lison de Loma T., Bosserelle P., Chancerelle Y., Geoffroy S., Stievenart C., Michonneau F., Penin L., Planes S., Adjeroud M. (2012) Predator Crown-of-Thorns Starfish (Acanthaster planci) outbreak, mass mortality of corals, and cascading effects on reef fish and benthic communities. PLoS ONE 7(10): e47363. doi:10.1371/journal.pone.0047363 Knee, K.L., Street, J.H., Grossman, E.E., Boehm, A.B. and Paytan, A. (2010). Nutrient
inputs to the coastal ocean from submarine groundwater discharge in a groundwater-dominated system: Relation to land use (Kona coast, Hawaii, USA). Limnology and Oceanography 55:1105-1122.
Lough, J.M. and Barnes, D.J. (2000) Environmental controls on growth of the massive
coral Porites. Journal of Experimental Marine Biology and Ecology. 245:225–243.
Minton, D., Conklin, E., Weiant, P. and Wiggins, C. (2012) 40 years of decline on
Puako’s coral reefs, A review of historical and current data (1970-2010). Puleloa, W.K. (2012). Moloka‘i Island Gill-net Project May 2008 - June 2009. Hawaii
Division of Aquatic Resources Technical Report 12-01. 24pp. http://hawaii.gov/dlnr/dar/pdf/Molokai_gill_net_study.pdf

86
Randall, J. E. (1987). Introductions of marine fishes to the Hawaiian Islands. Bulletin of
Marine Science. 41:490-502. Randall, J.E. (2007). Reef and Shore Fishes of the Hawaiian Islands. Sea Grant
Program. 546p.
Richmond, R.H. (1987) Energetic relationships and biogeographical differences among fecundity, growth and reproduction in the reef coral Pocillopora damicornis. Bulletin of Marine Science 41(2):594-604.
Rodgers, K., Cox, E. and Newtson, C. (2003) Effects of mechanical fracturing and
experimental trampling on Hawaiian corals. Environmental management 31(3):377-384.
Tissot, B.N., Walsh, W. and Hallacher, L.E. (2004). Evaluating the effectiveness of a marine reserve network in Hawai′i to increase the productivity of an aquarium fishery. Pacific Science 58(2):175-188.
Stevenson, T.C., Tissot, B.N. and Dierking, J. (2011). Fisher behaviour influences catch productivity and selectivity in West Hawaii's aquarium fishery. Journal of Marine Science. 68:813-822.
Walsh, W.J. (1984). Aspects of nocturnal shelter, habitat space, and juvenile recruitment in Hawaiian coral reef fishes. Ph.D. Dissertation, University of Hawai′i. 475 pp.
Walsh, W. J. (1987). Patterns of recruitment and spawning in Hawaiian reef fishes. Environmental Biology of Fishes 18(4):257-276.
Walsh, W.J., Cotton, S.P., Dierking, J. and Williams, I.D. (2003). The Commercial Marine Aquarium Fishery in Hawai'i 1976-2003. In: Friedlander A.M. (ed.) Status of Hawai`i’s Coastal Fisheries in the New Millennium. Proceedings of a Symposium sponsored by the American Fisheries Society, Hawai’i Chapter. pp. 132-159.
Williams, G.J., Aeby, G.S., Cowie, R.O.M. and Davy, S.K. (2010). Predictive modeling of coral disease distribution within a reef system. PLoS ONE 5(2): e9264.doi:10.1371/journal.pone.0009264.
Williams, I.D., Walsh, W.J., Claisse, J.T., Tissot, B.N. and. Stamoulis, K.A. (2009). Impacts of a Hawaiian marine protected area network on the abundance and fishery sustainability of the yellow tang, Zebrasoma flavescens. Biol. Cons. 142:1066-1073.
Yamashiro, H., Yamamoto, M and van Woesik, R. (2000) Tumor formation on the coral Montipora informis. Diseases of Aquatic Organisms 41:211-217.
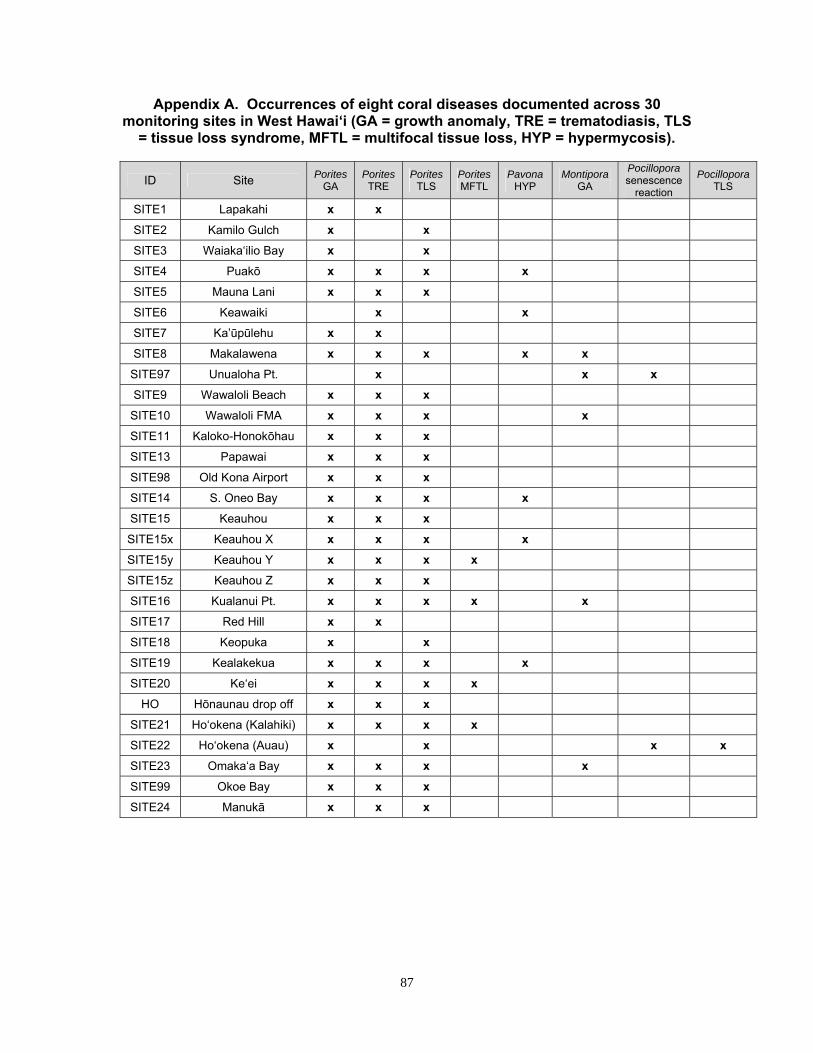
87
Appendix A. Occurrences of eight coral diseases documented across 30 monitoring sites in West Hawai‘i (GA = growth anomaly, TRE = trematodiasis, TLS
= tissue loss syndrome, MFTL = multifocal tissue loss, HYP = hypermycosis).
ID Site Porites GA
Porites TRE
Porites TLS
Porites MFTL
Pavona HYP
Montipora GA
Pocillopora senescence
reaction
Pocillopora TLS
SITE1 Lapakahi x x
SITE2 Kamilo Gulch x x
SITE3 Waiaka‘ilio Bay x x
SITE4 Puakō x x x x
SITE5 Mauna Lani x x x
SITE6 Keawaiki x x
SITE7 Ka’ūpūlehu x x
SITE8 Makalawena x x x x x
SITE97 Unualoha Pt. x x x
SITE9 Wawaloli Beach x x x
SITE10 Wawaloli FMA x x x x
SITE11 Kaloko-Honokōhau x x x
SITE13 Papawai x x x
SITE98 Old Kona Airport x x x
SITE14 S. Oneo Bay x x x x
SITE15 Keauhou x x x
SITE15x Keauhou X x x x x
SITE15y Keauhou Y x x x x
SITE15z Keauhou Z x x x
SITE16 Kualanui Pt. x x x x x
SITE17 Red Hill x x
SITE18 Keopuka x x
SITE19 Kealakekua x x x x
SITE20 Ke‘ei x x x x
HO Hōnaunau drop off x x x
SITE21 Ho‘okena (Kalahiki) x x x x
SITE22 Ho‘okena (Auau) x x x x
SITE23 Omaka‘a Bay x x x x
SITE99 Okoe Bay x x x
SITE24 Manukā x x x

88
Appendix B. West Hawai’i Benthic Cover 2011 Surveys Broad Benthic Categories
Survey Site Coral Turf-Bare Crustose Coralline
NCC Macroalgae
Macroalgae Sand Sessile Invert
Other
Lapakahi 11.8% 57.9% 0.5% 0.1% 0.1% 28.3% 0.0% 1.1% Kamilo 29.0% 62.2% 5.8% 0.4% 0.1% 0.8% 0.0% 1.7% Waiaka'ilio 38.8% 53.0% 4.8% 0.7% 0.8% 0.8% 0.0% 1.1% Puakō 34.2% 52.9% 9.6% 0.6% 0.4% 0.5% 0.0% 2.4% 'Anaeho'omalu 28.4% 57.1% 6.9% 0.9% 0.5% 2.4% 0.0% 3.8% Keawaiki 18.7% 72.3% 5.1% 1.0% 0.1% 0.9% 0.1% 1.0% Ka’ūpūlehu 27.1% 62.3% 5.2% 0.6% 0.3% 2.8% 0.0% 1.7% Makalawena 47.6% 49.3% 0.8% 0.0% 0.1% 1.3% 0.2% 0.9% Unualoha 36.5% 59.4% 4.4% 0.2% 0.2% 0.7% 10.0% 1.7% Wawaloli Beach 44.5% 52.0% 0.1% 0.0% 0.1% 1.3% 1.0% 1.0% Wawaloli 42.3% 52.3% 0.2% 0.1% 0.1% 0.1% 3.6% 1.3% Honokōhau 48.3% 32.0% 1.9% 0.1% 0.0% 2.6% 13.0% 2.1% Papawai 41.1% 46.9% 2.2% 0.5% 0.2% 0.9% 7.0% 1.2% Old Kona Airport 51.2% 31.6% 1.2% 0.0% 0.0% 7.3% 7.6% 1.1% S. Oneo 46.6% 43.9% 6.4% 0..2% 0.0% 1.1% 0.1% 1.8% N. Keauhou 28.0% 64.5% 3.3% 1.5% 0.2% 0.1% 0.1% 2.5% Kualanui 62.4% 34.5% 1.3% 0.0% 0.1% 0.5% 0.0% 1.2% Red Hill 35.3% 53.4% 3.2% 1.9% 0.9% 3.3% 0.1% 1.9% Keopuka 14.4% 79.9% 3.2% 0.4% 0.2% 0.8% 0.0% 1.1% Kealakekua 23.1% 64.8% 3.5% 0.1% 5.9% 0.0% 0.0% 2.6% Ke'ei 26.7% 60.8% 3.1% 0.3% 6.3% 0.3% 0.0% 1.5% Kalahiki 38.9% 45.4% 9.4% 2.2% 0.2% 1.9% 0.0% 1.2% Au Au Crater Omaka'a Manukā
30.0% 32.9% 33.4%
56.0% 53.1% 52.7%
6.7% 5.7% 7.3%
3.5% 0.3% 2.7%
1.4% 0.8% 0.6%
0.2% 6.3% 1.7%
0.0% 0.0% 0.1%
2.2% 0.9% 1.5%

89
Appendix C. West Hawai’i Coral Cover By Species 2011 Surveys
Survey Site Montipora capitata
Montipora patula
Pavona varians
Pocillopora meandrina
Porites compressa
Porites evermanni
Porites lobata
Other
Lapakahi 0.30% 0.00% 0.00% 0.30% 3.10% 0.60% 7.60% 0.10% Kamilo 0.40% 0.30% 0.40% 0.10% 11.70% 0.00% 16.10% 0.00%
Waiaka'ilio 0.70% 0.20% 0.30% 0.30% 12.80% 0.00% 24.50% 0.00% Puakō 0.20% 0.20% 0.20% 0.50% 12.00% 0.10% 21.20% 0.00%
Anaeho'omalu 1.10% 0.30% 0.40% 0.50% 9.20% 0.20% 16.60% 0.00% Keawaiki 0.70% 1.40% 2.20% 0.30% 9.00% 0.00% 4.20% 0.90%
Ka’ūpūlehu 0.60% 0.30% 0.00% 0.30% 2.20% 0.00% 23.80% 0.00% Makalawena 1.50% 2.90% 1.60% 1.30% 8.70% 0.40% 24.40% 6.80%
Unualoha 0.50% 0.00% 0.00% 2.90% 3.40% 0.60% 28.50% 0.60% Wawaloli Beach 0.8% 0.0% 0.0% 0.9% 6.1% 0.9% 35.7% 0.0%
Wawaloli 0.6% 0.0% 0.1% 3.7% 5.6% 0.2% 31.8% 0.4% Honokōhau 0.20% 0.00% 0.00% 0.10% 16.50% 0.90% 30.70% 0.00%
Papawai 0.50% 0.10% 0.00% 1.20% 3.50% 1.30% 34.20% 0.30% Old Kona Apt 0.00% 0.00% 0.00% 0.70% 14.50% 0.80% 35.20% 0.00%
S. Oneo 0.10% 0.60% 0.60% 0.30% 17.40% 1.50% 26.10% 0.00% N. Keauhou 0.10% 0.00% 0.00% 0.00% 16.80% 0.30% 10.80% 0.00%
Kualanui 0.70% 0.20% 0.10% 0.40% 3.30% 13.90% 43.90% 0.00% Red Hill 1.90% 0.30% 0.20% 0.80% 10.20% 0.50% 21.30% 0.00% Keopuka 0.20% 0.20% 0.10% 2.20% 2.10% 0.30% 9.30% 0.00%
Kealakekua 0.10% 0.10% 0.40% 0.20% 7.00% 0.00% 15.40% 0.10% Ke'ei 0.10% 0.00% 0.10% 0.10% 15.80% 2.90% 6.30% 1.50%
Kalahiki 0.20% 0.10% 0.00% 0.10% 16.40% 1.00% 21.30% 0.00% Au Au Crater 2.40% 0.20% 0.10% 1.30% 5.60% 0.30% 20.00% 0.20%
Omaka'a 1.20% 0.10% 0.10% 1.10% 11.60% 2.10% 16.90% 0.00% Manukā 0.20% 0.00% 0.10% 0.50% 8.90% 0.30% 23.30% 0.10%

90
Appendix D. West Hawai’i Benthic Cover 2007 Surveys
Broad Benthic Categories
Survey Site Coral Turf-Bare Crustose Coralline
Encrusting Macroalgae
Macroalgae Sand Sessile Invert
Other
‘Anaeho’omalu 31.5% 56.9% 7.1% 0.1% 0.3% 2.4% 0.1% 1.6% Ho’okena 28.4% 57.7% 4.8% 2.3% 6.3% 0.1% 0.1% 0.3%
Honokōhau 48.5% 31.6% 3.3% 0.5% 0.3% 2.4% 12.9% 0.1% Kalahiki 39.6% 48.3% 5.2% 2.2% 1.5% 2.0% 0.0% 1.2% Kamilo 38.2% 51.0% 7.1% 0.3% 0.2% 0.7% 0.0% 2.3%
Ka’ūpūlehu 31.2% 59.9% 5.8% 0.2% 0.0% 1.8% 0.0% 1.3% Keawaiki 16.7% 74.9% 5.7% 0.4% 0.2% 0.3% 0.1% 1.7%
Kealakekua 28.6% 65.0% 4.1% 0.7% 0.1% 0.1% 0.0% 1.4% Ke’ei 28.7% 58.4% 3.6% 0.4% 6.9% 0.3% 0.0% 1.7%
Keopuka 15.6% 75.8% 4.1% 1.3% 0.1% 1.8% 0.1% 1.2% Kualanui 59.8% 33.4% 3.7% 0.1% 1.3% 0.3% 0.1% 1.1% Lapakahi 11.4% 56.7% 1.6% 0.9% 0.2% 28.6% 0.1% 1.4%
Makalawena 47.6% 47.5% 1.9% 0.1% 0.0% 1.8% 0.2% 0.6% Manukā 33.2% 52.9% 9.7% 1.2% 0.1% 1.5% 0.0% 1.5%
N. Keauhou 31.1% 61.4% 5.0% 0.4% 0.4% 0.5% 0.1% 1.1% Omaka'a 27.1% 61.8% 2.5% 0.2% 0.2% 7.7% 0.0% 0.5% Papawai 38.3% 39.9% 3.1% 0.6% 4.0% 1.9% 11.0% 1.2% Puakō 47.8% 42.0% 6.7% 0.6% 0.2% 0.3% 0.0% 2.4%
Red Hill 33.2% 59.4% 2.2% 1.8% 0.1% 2.7% 0.0% 0.6% S. Oneo 61.9% 31.7% 3.7% 0.9% 0.1% 1.2% 0.1% 0.0%
Waiaka’ilio 42.5% 47.7% 5.5% 0.5% 0.1% 1.2% 0.1% 2.2% Wawaloli 37.5% 55.3% 3.1% 0.1% 0.0% 0.4% 3.1% 0.5%
Wawaloli Beach 42.3% 52.8% 0.3% 0.0% 0.0% 3.1% 0.3% 1.3% Keauhou X Keauhou Y Keauhou Z
57.6% 40.3% 42.5%
37.6% 55.0% 45.9%
3.3% 3.0% 6.6%
0.3% 0.1% 0.4%
0.1% 0.2% 0.1%
0.6% 1.0% 1.2%
0.5% 0.0% 2.6%
0.3% 0.4% 0.7%
Okoe Bay 34.0% 55.3% 6.0% 0.0% 0.1% 3.3% 0.0% 1.3% Old Kona Airport 53.2% 25.2% 2.4% 0.3% 0.1% 10.8% 8.0% 0.0%
Unualoha 36.8% 57.3% 1.1% 0.1% 1.1% 1.4% 0.3% 1.8%

91
Appendix E. West Hawai’i Coral Cover By Species 2007 Surveys
Survey Site Montipora capitata
Montipora patula
Pavona varians
Pocillopora meandrina
Porites compressa
Porites evermanni
Porites lobata
Other
Anaeho’omalu 1.1% 0.8% 0.6% 0.3% 14% 0.0% 14.2% 0.4% Ho’okena 3.5% 0.2% 0.0% 2.3% 3.4% 0.4% 19.4% 0.0% Honokōhau 0.2% 0.0% 0.0% 0.3% 16.0% 0.5% 31.4% 0.4% Kalahiki 0.1% 0.0% 0.0% 0.3% 13.6% 1.0% 25.5% 0.1% Kamilo 0.6% 0.1% 0.1% 0.0% 17.1% 0.0% 20.5% 0.2% Ka’ūpūlehu 0.2% 0.1% 0.1% 0.2% 2.8% 0.0% 27.6% 0.2% Keawaiki 0.7% 1.6% 1.9% 0.0% 7.4% 0.0% 4.9% 0.1% Kealakekua 0.1% 0.0% 1.1% 0.2% 11.9% 0.2% 14.9% 0.4% Ke’ei 0.2% 0.0% 0.1% 0.1% 20.2% 1.5% 6.7% 0.0% Keopuka 0.2% 0.3% 0.0% 4.8% 1.6% 0.6% 8.2% 0.1% Kualanui 0.1% 0.4% 0.1% 0.7% 3.2% 18.7% 36.8% 0.0% Lapakahi 0.1% 0.0% 0.0% 0.0% 1.7% 0.2% 9.4% 0.1% Makalawena 2.0% 2.6% 1.7% 1.5% 6.2% 0.1% 27.8% 5.7% Manukā 0.3% 0.0% 0.0% 0.3% 9.9% 1.0% 22.2% 0.1% N. Keauhou 0.0% 0.0% 0.3% 0.0% 21.2% 0.1% 9.7% 0.0% Keauhou X 0.1% 0.0% 0.1% 0.0% 18.8% 2.9% 35.7% 0.0% Keauhou Y 0.1% 0.1% 0.0% 0.0% 26.1% 0.0% 13.2% 0.0% Keauhou Z 0.0% 0.0% 0.0% 0.1% 24.0% 0.5% 19.1% 0.0% Okoe Bay 0.3% 0.0% 0.0% 0.3% 4.5% 2.6% 26.3% 0.0% Old Kona Airport 0.2% 0.0% 0.0% 0.5% 14.1% 0.6% 38.0% 0.0% Omaka'a 0.9% 0.1% 0.1% 1.2% 7.7% 2.3% 14.9% 0.1% Papawai 0.2% 0.1% 0.1% 0.4% 3.5% 1.8% 32.4% 0.3% Puakō 1.3% 0.7% 0.2% 0.5% 17.2% 0.3% 27.2% 1.0% Red Hill 1.0% 0.2% 0.1% 1.4% 10.2% 1.7% 19.4% 0.0% S. Oneo 0.2% 0.5% 0.6% 0.3% 30.5% 1.7% 28.2% 0.0% Unualoha 1.0% 0.1% 0.0% 3.3% 4.5% 0.3% 26.5% 0.2% Waiaka’ilio 0.5% 0.4% 0.5% 0.3% 14.7% 0.0% 26.4% 0.1% Wawaloli 0.5% 0.0% 0.1% 3.9% 4.0% 0.3% 28.0% 0.9% Wawaloli Beach 1.1% 0.0% 0.0% 0.9% 4.0% 1.4% 34.8% 0.0%

92
Appendix F. West Hawai`i Benthic Cover 2003 Surveys
Broad Benthic Categories
Survey Site Coral Turf-Bare Crustose Coralline
NCC Macroalgae
Macroalgae Sand Sessile Invert
Other
‘Anaeho’omalu 41.2% 38.8% 8.6% 0.6% 0.0% 3.3% 0.0% 7.5% Ho’okena 28.5% 55.3% 6.1% 4.3% 0.2% 1.0% 0.3% 4.3%
Honokōhau 48.3% 18.5% 6.8% 0.5% 0.1% 1.7% 11.6% 12.4% Kalahiki 37.1% 45.6% 5.4% 2.8% 0.3% 3.1% 0.0% 5.7% Kamilo 49.5% 29.1% 7.4% 3.9% 1.2% 1.1% 0.0% 7.9%
Ka’ūpūlehu 40.9% 40.7% 8.5% 0.3% 0.0% 1.6% 0.0% 7.9% Keawaiki 29.9% 51.7% 9.4% 0.0% 0.6% 0.2% 0.0% 8.1%
Kealakekua 27.7% 51.1% 8.0% 2.5% 0.0% 0.0% 0.0% 10.7% Ke’ei 31.3% 40.0% 14.3% 0.9% 0.0% 0.2% 0.0% 13.4%
Keopuka 16.5% 62.5% 8.2% 1.8% 0.0% 1.3% 0.0% 9.6% Kualanui 53.3% 36.0% 4.6% 0.7% 0.0% 0.4% 0.2% 4.7% Lapakahi 19.5% 53.8% 1.4% 0.9% 0.0% 23.0% 0.0% 1.3%
Makalawena 45.2% 44.8% 4.0% 0.3% 0.0% 2.3% 0.1% 3.3% Manukā 30.8% 50.4% 9.0% 2.7% 0.1% 2.1% 0.0% 4.8%
N. Keauhou 32.9% 41.5% 15.1% 0.4% 0.0% 0.2% 1.3% 8.5% Omaka'a 30.2% 52.2% 4.2% 0.7% 0.0% 8.4% 0.0% 4.3% Papawai 32.8% 30.1% 6.2% 0.5% 0.0% 3.0% 19.8% 7.6% Puakō 49.9% 32.2% 7.5% 0.9% 0.0% 0.9% 0.0% 8.6%
Red Hill 31.5% 40.9% 6.6% 3.9% 0.2% 5.3% 0.8% 10.7% S. Oneo 57.0% 23.3% 10.5% 0.3% 0.1% 2.1% 0.2% 6.6%
Waiaka’ilio 54.4% 29.1% 5.3% 0.9% 0.8% 1.3% 0.1% 8.1% Wawaloli 37.9% 45.8% 2.3% 0.2% 0.3% 2.0% 2.5% 9.0%
Wawaloli Beach 33.8% 51.9% 2.4% 0.2% 0.0% 7.1% 0.3% 4.3%

93
Appendix G. West Hawaiʹi Coral Cover By Species 2003 Surveys
Survey Site Montipora capitata
Montipora patula
Pavona varians
Pocillopora meandrina
Porites compressa
Porites evermanni
Porites lobata
Other
ʹAnaehoʹomalu 0.8% 2.2% 1.0% 1.1% 15.2% 0.2% 19.6% 1.2% Ho’okena 1.6% 0.7% 0.0% 2.0% 2.0% 0.3% 19.3% 2.4% Honokōhau 0.0% 0.0% 0.0% 0.2% 14.4% 1.8% 31.8% 0.0% Kalahiki 0.0% 0.0% 0.0% 0.2% 13.4% 0.0% 22.9% 0.6% Kamilo 0.8% 0.2% 0.1% 0.2% 23.3% 0.1% 24.3% 0.4% Ka’ūpūlehu 0.2% 0.1% 0.0% 0.3% 6.7% 1.1% 31.9% 0.4% Keawaiki 0.5% 3.8% 1.4% 0.9% 12.7% 0.0% 8.9% 1.6% Kealakekua 0.1% 0.3% 1.9% 0.2% 10.6% 0.0% 13.7% 0.8% Ke’ei 0.1% 0.0% 0.1% 0.0% 19.6% 1.8% 9.4% 0.1% Keopuka 0.0% 0.1% 0.1% 4.2% 1.0% 0.0% 9.6% 1.6% Kualanui 0.5% 0.5% 0.1% 0.1% 3.0% 13.7% 34.3% 1.2% Lapakahi 0.2% 0.0% 0.0% 0.6% 3.1% 0.0% 15.4% 0.1% Makalawena 1.0% 4.0% 1.0% 1.0% 6.4% 0.5% 26.5% 4.7% Manukā 0.2% 0.0% 0.0% 0.4% 7.6% 0.4% 21.5% 0.7% N. Keauhou 0.0% 0.0% 0.6% 0.0% 16.2% 0.0% 15.0% 1.0% Omaka’a 0.5% 0.4% 0.1% 0.2% 6.8% 2.3% 18.4% 1.4% Papawai 0.2% 0.1% 0.0% 0.8% 1.8% 0.8% 28.1% 1.0% Puakō 0.4% 1.7% 0.3% 0.7% 16.9% 0.2% 28.5% 1.3% Red Hill 0.6% 0.1% 0.1% 0.6% 10.0% 2.0% 16.9% 1.1% S. Oneo 0.2% 0.6% 0.4% 0.2% 27.2% 1.9% 25.4% 1.0% Waiaka’ilio 0.6% 2.3% 0.1% 0.7% 19.4% 0.0% 30.5% 0.8% Wawaloli 0.1% 0.1% 0.0% 5.5% 3.5% 0.0% 27.3% 1.3% Wawaloli Beach 0.4% 0.1% 0.0% 1.5% 3.2% 1.7% 26.1% 0.7%

94
Appendix H. 2003, 2007 and 2011 Octocoral Percent Cover Comparison Site (North to South) Year 2003/2007
P= 2003/2011
P= 2007/2011
P= 2003 2007 2011
Lapakahi (01) 0.0% 0.0% 0.0% N/A N/A N/A
Kamilo (2) 0.0% 0.0% 0.0% N/A N/A N/A
Waiakailio Bay (03) 0.0% 0.0% 0.0% N/A N/A N/A
Puako (4) 0.0% 0.0% 0.0% N/A N/A N/A
Anaehoomalu (05) 0.0% 0.0% 0.0% N/A N/A N/A
Keawaiki (06) 0.0% 0.0% 0.0% N/A N/A N/A
Kaupulehu (07) 0.0% 0.0% 0.0% N/A N/A N/A
Makalawena (8) 0.0% 0.0% 0.0% N/A N/A N/A
Wawaloli Beach (09) 0.4% 0.3% 1.0% 0.908 0.276 0.212
Wawaloli (10) 2.3% 3.1% 3.6% 0.232 0.324 0.696
Honokohau (11) 10.6% 12.7% 13.0% 0.592 0.838 0.971
Papawai (13) 18.2% 10.9% 6.9% 0.018 0.029 0.137
S. Oneo Bay (14) 0.2% 0.1% 0.0% 0.058 0.092 0.391
N. Keauhou (15) 1.2% 0.1% 0.0% 0.13 0.124 0.391
Kualanui Pt. (16) 0.1% 0.1% 0.0% 0.231 0.058 0.391
Red Hill (17) 0.5% 0.0% 0.0% 0.262 0.300 0.391
Keopuka (18) 0.0% 0.0% 0.0% N/A N/A N/A
Kealakekua Bay (19) 0.0% 0.0% 0.0% N/A N/A N/A
Ke'ei (20) 0.0% 0.0% 0.0% N/A N/A N/A
Hookena (Kalahiki) (21) 0.2% 0.0% 0.0% 0.141 N/A N/A
Hookena (Auau) (22) 0.0% 0.0% 0.0% N/A N/A N/A
Milolii (Omakaa) (23) 0.0% 0.0% 0.0% N/A N/A N/A
Milolii (Manuka) (24) 0.0% 0.0% 0.0% N/A N/A N/A

95
APPENDIX I. Individuals per 100 m2 by species at East Hawaiʹi sites (n = 224 transects at Waiopae; n = 172 at Richardson's Ocean Center).
Taxa OPEN MLCD ROC
Abudefduf abdominalis 0.09 0.74 3.20 Abudefduf sordidus 0.00 0.22 0.03 Abudefduf vaigiensis 0.00 0.04 0.05 Acanthurus achilles 0.00 0.04 0.01 Acanthurus blochii 0.02 0.00 0.00 Acanthurus leucopareius 0.03 0.25 0.25 Acanthurus nigrofuscus 10.35 2.92 6.18 Acanthurus nigroris 0.00 0.04 0.02 Acanthurus triostegus 1.83 2.48 3.36 Anampses cuvier 0.03 0.00 0.01 Arothron hispidus 0.03 0.02 0.01 Arothron meleagris 0.08 0.24 0.07 Asterropteryx semipunctatus 0.03 0.00 0.00 Aulostomus chinensis 0.05 0.02 0.01 Belonidae 0.00 0.01 0.01 Blenniella gibbifrons 0.02 0.01 0.03 Bodianus bilunulatus 0.03 0.00 0.00 Calotomus carolinus 0.01 0.00 0.00 Cantherhines dumerilii 0.01 0.01 0.01 Canthigaster amboinensis 0.36 1.18 1.06 Canthigaster jactator 3.65 2.67 1.58 Caracanthus typicus 0.00 0.01 0.04 Cephalopholis argus 0.15 0.41 0.01 Chaetodon auriga 0.10 0.05 0.04 Chaetodon lunula 1.50 2.15 0.70 Chaetodon lunulatus 0.00 0.00 0.04 Chaetodon miliaris 0.03 0.00 0.00 Chaetodon ornatissimus 0.12 0.22 0.03 Chaetodon quadrimaculatus 0.49 0.48 0.44 Chaetodon unimaculatus 0.08 0.00 0.00 Chlorurus perspicillatus 0.38 0.04 0.00 Chlorurus spilurus 16.30 1.93 0.63 Chromis agilis 0.09 0.01 0.14 Chromis ovalis 0.78 0.02 0.00 Chromis hanui 0.00 0.00 0.02 Chromis vanderbilti 10.01 9.33 2.82 Cirrhitops fasciatus 0.01 0.04 0.64 Cirrhitus pinnulatus 0.01 0.13 0.14 Cirripectes vanderbilti 0.89 0.54 0.18 Coris flavovittata 0.00 0.01 0.01 Coris gaimard 0.33 0.47 0.41 Coris venusta 0.02 0.08 0.32 Ctenochaetus strigosus 0.41 0.31 0.00 Dascyllus albisella 0.19 0.03 0.01

96
Echidna nebulosa 0.02 0.00 0.00 Exallias brevis 0.01 0.04 0.02 Fistularia commersonii 0.33 0.09 0.06 Forcipiger flavissimus 0.01 0.06 0.00 Forcipiger longirostris 0.00 0.02 0.00 Gomphosus varius 4.88 5.74 1.23 Gymnomuraena zebra 0.01 0.02 0.03 Gymnothorax eurostus 0.00 0.04 0.01 Gymnothorax flavimarginatus 0.02 0.03 0.02 Gymnothorax meleagris 0.01 0.04 0.05 Gymnothorax sp. 0.02 0.01 0.02 Gymnothorax undulatus 0.01 0.00 0.00 Halichoeres ornatissimus 0.04 1.04 0.58 Kyphosus bigibbus 0.00 0.28 0.00 Kyphosus sp. 0.00 0.26 0.00 Kyphosus vaigiensis 0.00 0.04 0.00 Labroides phthirophagus 1.50 0.97 0.05 Lutjanus fulvus 0.02 0.00 0.00 Lutjanus kasmira 0.02 0.40 0.00 Macropharyngodon geoffroy 0.00 0.05 0.06 Melichthys vidua 0.00 0.01 0.00 Mulloidichthys flavolineatus 0.04 0.01 0.03 Mulloidichthys vanicolensis 0.04 0.00 0.00 Naso lituratus 0.07 0.05 0.04 Naso unicornis 0.03 0.00 0.01 Neomyxus leuciscus 0.00 0.01 0.11 Neoniphon sammara 0.01 0.00 0.00 Novaculichthys taeniourus 0.01 0.01 0.02 Ostracion meleagris 0.05 0.19 0.05 Oxycheilinus unifasciatus 0.07 0.02 0.02 Paracirrhites arcatus 0.08 0.19 0.58 Paracirrhites forsteri 0.00 0.04 0.05 Parupeneus insularis 0.15 0.07 0.00 Parupeneus cyclostomus 0.05 0.01 0.01 Parupeneus multifasciatus 0.34 0.02 0.02 Parupeneus porphyreus 0.00 0.03 0.00 Pervagor aspricaudus 0.01 0.00 0.00 Plagiotremus ewaensis 0.04 0.05 0.05 Plagiotremus goslinei 0.34 0.41 0.07 Platybelone argalus 0.00 0.09 0.08 Plectroglyphidodon imparipennis 1.58 2.98 8.22 Plectroglyphidodon johnstonianus 0.96 1.07 1.42 Plectroglyphidodon sindonis 0.00 0.00 0.02 Pristiapogon kallopterus 0.01 0.00 0.00 Pseudocheilinus evanidus 0.03 0.02 0.02 Pseudocheilinus octotaenia 0.14 0.06 0.00 Pseudocheilinus tetrataenia 0.13 0.14 0.01 Rhinecanthus rectangulus 0.04 0.04 0.13

97
Sargocentron diadema 0.01 0.00 0.00 Sargocentron punctatissimum 0.02 0.00 0.01 Sargocentron xantherythrum 0.00 0.03 0.00 Scarus dubius 0.29 0.02 0.01 Scarus psittacus 11.69 1.85 0.47 Scarus rubroviolaceus 0.62 0.28 0.20 Scuticaria tigrinus 0.00 0.01 0.00 Sebastapistes coniorta 0.00 0.06 0.22 Stegastes fasciolatus 3.21 19.10 17.38 Stethojulis balteata 5.04 7.98 14.18 Synodus binotatus 0.00 0.01 0.03 Synodus sp. 0.02 0.02 0.00 Synodus ulae 0.00 0.01 0.00 Synodus variegatus 0.01 0.00 0.00 Taenianotus triacanthus 0.00 0.01 0.00 Thalassoma ballieui 0.02 0.04 0.05 Thalassoma duperrey 36.21 35.76 22.38 Thalassoma purpureum 0.00 0.01 0.01 Thalassoma quinquevittatum 0.02 0.00 0.00 Thalassoma trilobatum 0.04 0.06 0.15 Unidentified 1 0.05 0.08 0.05 Zanclus cornutus 0.06 0.10 0.03 Zebrasoma flavescens 0.35 0.03 0.01
Pooled Individuals/100 m2 = 117.3 107.2 90.7