Embed Size (px)
Citation preview
LONG-TERM MONITORING OF 2ND –PERIOD EP-ELECTROLYTE IN STF-EP FACILITY AT KEK*
M. Sawabe, T. Saeki, H. Hayano, H. Monjushiro, A. Komiya, M. Satou KEK, Tsukuba, Japan
Abstract We have constructed an Electro-polishing (EP)
Facility in the Superconducting RF Test Facility (STF) at KEK at the end of 2007. We have been operating the EP facility since January 2008 and have performed the EP processes of cavities about 140 times up to the present. During this period, we replaced EP-electrolyte in the 2,000L tank twice. Consequently, now we are performing EP processes with the 3rd–period EP-electrolyte. In this report, we present the long-term monitoring results of the 2nd–period EP-electrolyte used from May 2009 to July 2010.
INTRODUCTION In the EP facility at KEK, the capacity of the EP-
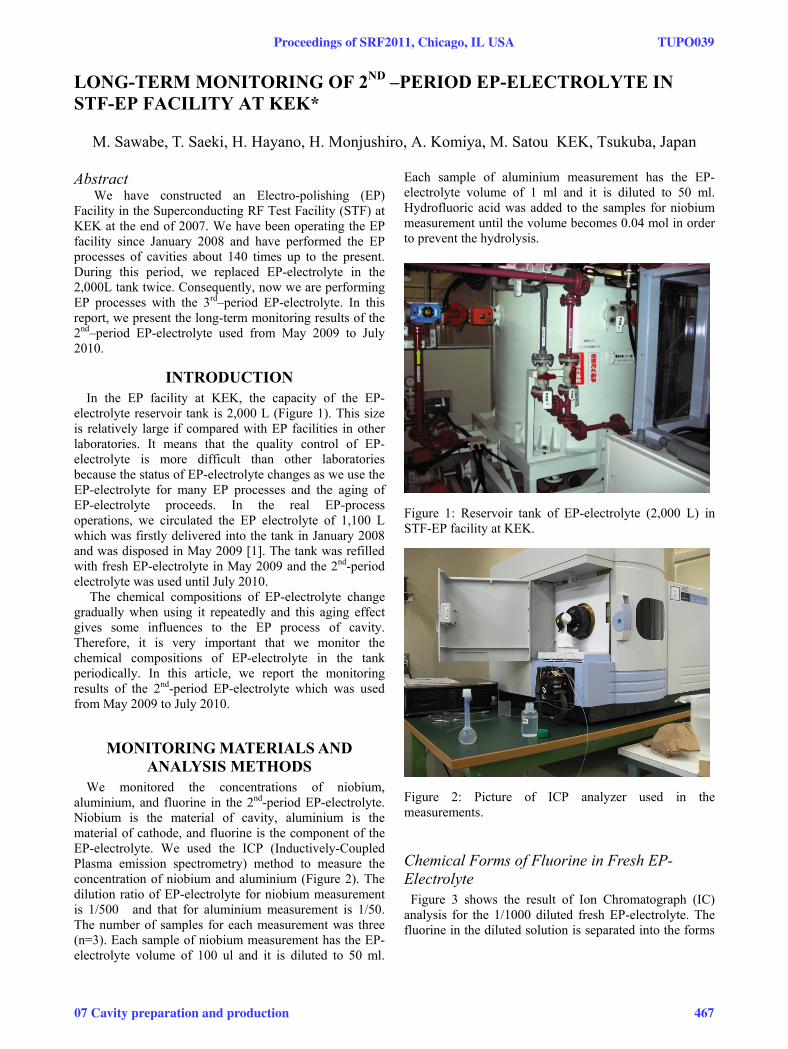
electrolyte reservoir tank is 2,000 L (Figure 1). This size is relatively large if compared with EP facilities in other laboratories. It means that the quality control of EP-electrolyte is more difficult than other laboratories because the status of EP-electrolyte changes as we use the EP-electrolyte for many EP processes and the aging of EP-electrolyte proceeds. In the real EP-process operations, we circulated the EP electrolyte of 1,100 L which was firstly delivered into the tank in January 2008 and was disposed in May 2009 [1]. The tank was refilled with fresh EP-electrolyte in May 2009 and the 2nd-period electrolyte was used until July 2010.
The chemical compositions of EP-electrolyte change gradually when using it repeatedly and this aging effect gives some influences to the EP process of cavity. Therefore, it is very important that we monitor the chemical compositions of EP-electrolyte in the tank periodically. In this article, we report the monitoring results of the 2nd-period EP-electrolyte which was used from May 2009 to July 2010.
MONITORING MATERIALS AND ANALYSIS METHODS
We monitored the concentrations of niobium, aluminium, and fluorine in the 2nd-period EP-electrolyte. Niobium is the material of cavity, aluminium is the material of cathode, and fluorine is the component of the EP-electrolyte. We used the ICP (Inductively-Coupled Plasma emission spectrometry) method to measure the concentration of niobium and aluminium (Figure 2). The dilution ratio of EP-electrolyte for niobium measurement is 1/500 and that for aluminium measurement is 1/50. The number of samples for each measurement was three (n=3). Each sample of niobium measurement has the EP-electrolyte volume of 100 ul and it is diluted to 50 ml.
Each sample of aluminium measurement has the EP-electrolyte volume of 1 ml and it is diluted to 50 ml. Hydrofluoric acid was added to the samples for niobium measurement until the volume becomes 0.04 mol in order to prevent the hydrolysis.
Chemical Forms of Fluorine in Fresh EP-Electrolyte Figure 3 shows the result of Ion Chromatograph (IC)
analysis for the 1/1000 diluted fresh EP-electrolyte. The fluorine in the diluted solution is separated into the forms
Figure 1: Reservoir tank of EP-electrolyte (2,000 L) in STF-EP facility at KEK.
Figure 2: Picture of ICP analyzer used in the measurements.
Proceedings of SRF2011, Chicago, IL USA TUPO039
07 Cavity preparation and production 467
of the fluoride ion (F-), the fluoro-sulfuric ion (SO3F-),
and niobium fluoro-complex ion (NbOF52-).
Procedure of the Fluorine Analysis The procedure of fluorine analysis with a
diluted solution of the EP-electrolyte is shown in figure 4. By this analysis, we measured the concentration of fluoride ion as the form of only HF by Ion Selective Electrode (ISE) method directly and also as the all ionic forms (HF, HSO3F, H2NbOF5) by the steam distillation and ISE methods. Table 1 shows the results of the measured concentration of fluoride ion with the 1/500 diluted samples of fresh EP-electrolyte. The fluorine concentration as the form of HF in the diluted fresh EP-electrolyte was 29 mg/l, and the total fluorine concentration was 95 mg/l. From the result, the fluorine concentration as fluoro-sulfuric ion (HSO3F) was estimated to be 66 mg/l because the measured EP-electrolyte is fresh and then the samples do not include fluoro-niobium complex (H2NbOF5).
For the analysis of aged/used EP-eletrolyte, the fluorine concentration in the form of niobium fluoro-complex (H2NbOF5) is calculated from niobium concentration. The fluorine concentration in the form of niobium fluoro-
complex (H2NbOF5) = 1.02 x niobium concentration. Combining these methods, the fluorine concentration is measured in diluted EP-electrolyte as the chemical forms of fluoride ion (F-), fluoro-sulfuric ion (SO3F
-) and niobium fluoro-complex ion (NbOF5
2-). Table 1: Results of analysis with 1/500 diluted solution of the fresh EP-electrolyte
MONITORING RESULTS We performed the EP processes of cavities 59 times
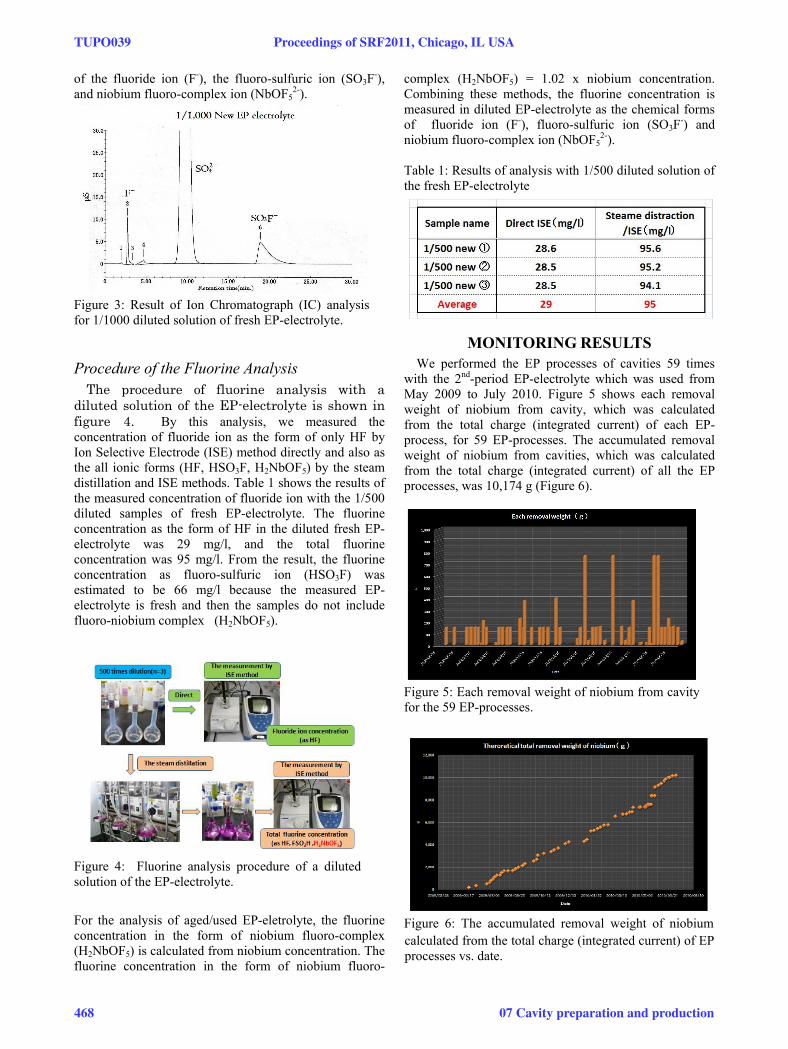
with the 2nd-period EP-electrolyte which was used from May 2009 to July 2010. Figure 5 shows each removal weight of niobium from cavity, which was calculated from the total charge (integrated current) of each EP-process, for 59 EP-processes. The accumulated removal weight of niobium from cavities, which was calculated from the total charge (integrated current) of all the EP processes, was 10,174 g (Figure 6).
Figure 5: Each removal weight of niobium from cavity for the 59 EP-processes.
Figure 6: The accumulated removal weight of niobium
Figure 3: Result of Ion Chromatograph (IC) analysis for 1/1000 diluted solution of fresh EP-electrolyte.
Figure 4: Fluorine analysis procedure of a diluted solution of the EP-electrolyte.
calculated from the total charge (integrated current) of EP processes vs. date.
TUPO039 Proceedings of SRF2011, Chicago, IL USA
468 07 Cavity preparation and production
Periodical Measurements of Niobium Concentration in EP- electrolyte
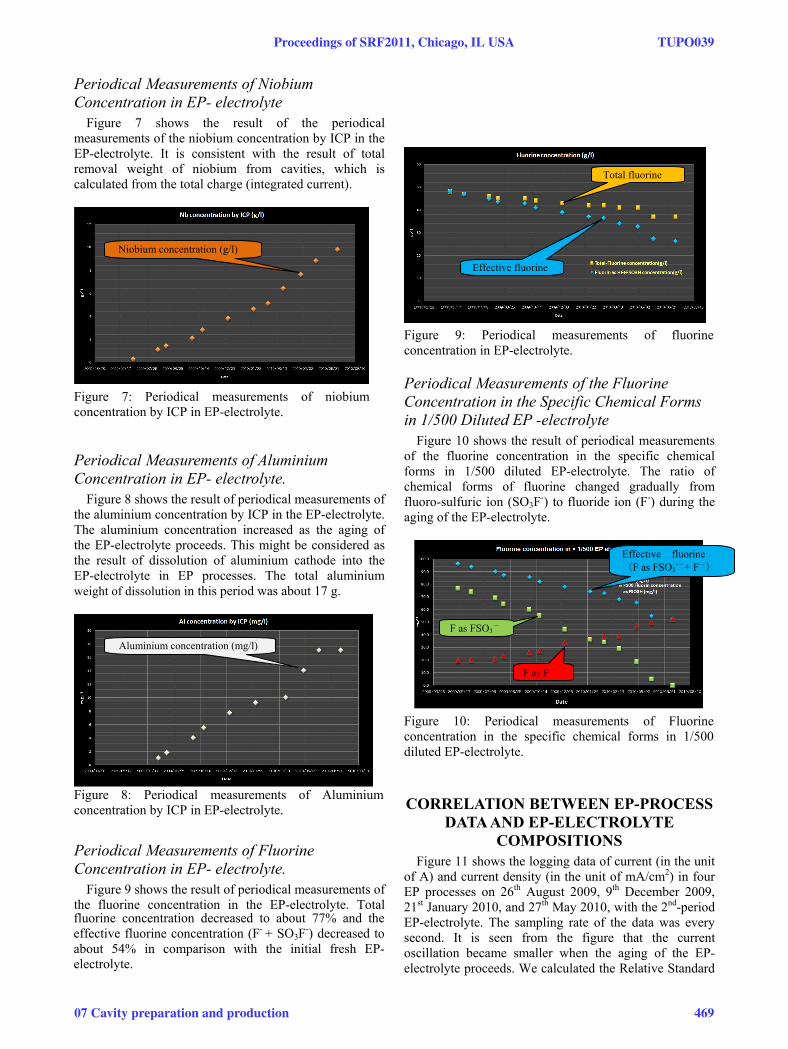
Figure 7 shows the result of the periodical measurements of the niobium concentration by ICP in the EP-electrolyte. It is consistent with the result of total removal weight of niobium from cavities, which is calculated from the total charge (integrated current).
Figure 7: Periodical measurements of niobium concentration by ICP in EP-electrolyte.
Periodical Measurements of Aluminium Concentration in EP- electrolyte.
Figure 8 shows the result of periodical measurements of the aluminium concentration by ICP in the EP-electrolyte. The aluminium concentration increased as the aging of the EP-electrolyte proceeds. This might be considered as the result of dissolution of aluminium cathode into the EP-electrolyte in EP processes. The total aluminium weight of dissolution in this period was about 17 g.
Figure 8: Periodical measurements of Aluminium concentration by ICP in EP-electrolyte.
Periodical Measurements of Fluorine Concentration in EP- electrolyte.
Figure 9 shows the result of periodical measurements of the fluorine concentration in the EP-electrolyte. Total fluorine concentration decreased to about 77% and the effective fluorine concentration (F- + SO3F
-) decreased to about 54% in comparison with the initial fresh EP-electrolyte.
Figure 9: Periodical measurements of fluorine concentration in EP-electrolyte.
Periodical Measurements of the Fluorine Concentration in the Specific Chemical Forms in 1/500 Diluted EP -electrolyte
Figure 10 shows the result of periodical measurements of the fluorine concentration in the specific chemical forms in 1/500 diluted EP-electrolyte. The ratio of chemical forms of fluorine changed gradually from fluoro-sulfuric ion (SO3F
-) to fluoride ion (F-) during the aging of the EP-electrolyte.
Figure 10: Periodical measurements of Fluorine concentration in the specific chemical forms in 1/500 diluted EP-electrolyte.
CORRELATION BETWEEN EP-PROCESS DATA AND EP-ELECTROLYTE
COMPOSITIONS Figure 11 shows the logging data of current (in the unit
of A) and current density (in the unit of mA/cm2) in four EP processes on 26 August 2009, 9 December 2009, th th
21st January 2010, and 27th May 2010, with the 2nd-period EP-electrolyte. The sampling rate of the data was every second. It is seen from the figure that the current oscillation became smaller when the aging of the EP-electrolyte proceeds. We calculated the Relative Standard
Effective fluorine (F as FSO3
--+ F-)
F as FSO3-
F as F-
Effective fluorine
Total fluorine
Aluminium concentration (mg/l)
Niobium concentration (g/l)
Proceedings of SRF2011, Chicago, IL USA TUPO039
07 Cavity preparation and production 469
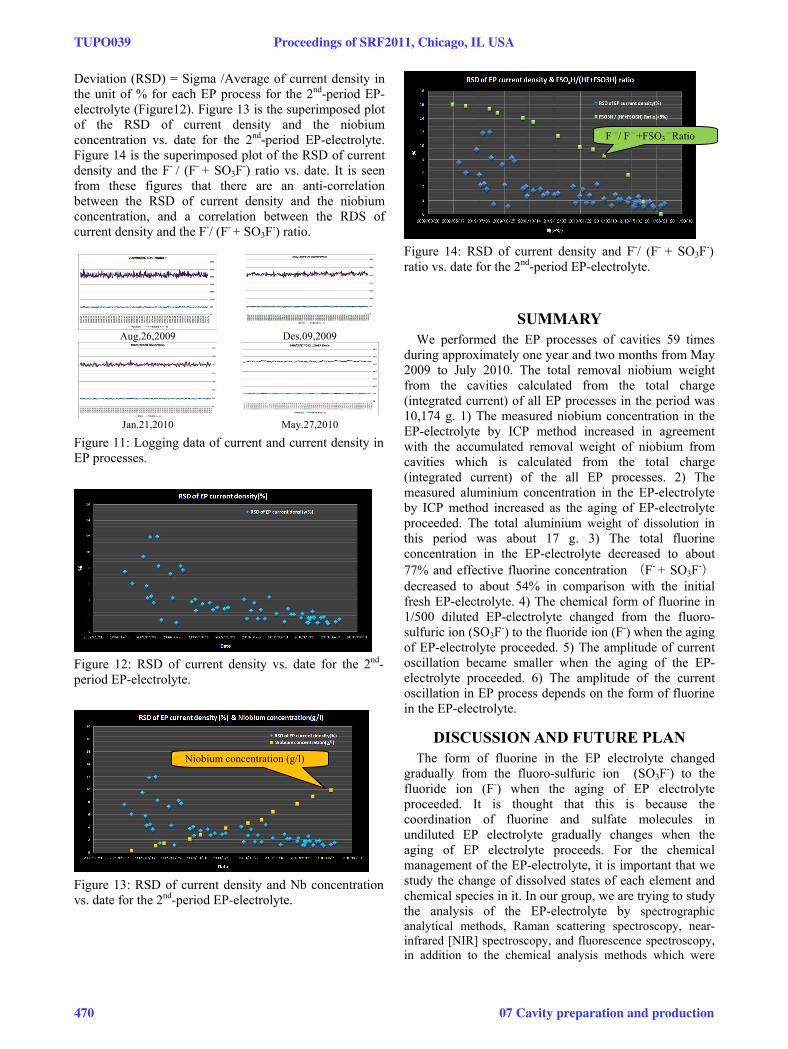
Deviation (RSD) = Sigma /Average of current density in the unit of % for each EP process for the 2nd-period EP-electrolyte (Figure12). Figure 13 is the superimposed plot of the RSD of current density and the niobium concentration vs. date for the 2nd-period EP-electrolyte. Figure 14 is the superimposed plot of the RSD of current density and the F- / (F- + SO3F
-) ratio vs. date. It is seen from these figures that there are an anti-correlation between the RSD of current density and the niobium concentration, and a correlation between the RDS of current density and the F-/ (F- + SO3F
-) ratio.
Aug.26,2009 Des.09,2009
Jan.21,2010 May.27,2010
Figure 11: Logging data of current and current density in EP processes.
Figure 12: RSD of current density vs. date for the 2nd-period EP-electrolyte.
Figure 13: RSD of current density and Nb concentration vs. date for the 2nd-period EP-electrolyte.
Figure 14: RSD of current density and F-/ (F- + SO3F-)
ratio vs. date for the 2nd-period EP-electrolyte.
SUMMARY We performed the EP processes of cavities 59 times
during approximately one year and two months from May 2009 to July 2010. The total removal niobium weight from the cavities calculated from the total charge (integrated current) of all EP processes in the period was 10,174 g. 1) The measured niobium concentration in the EP-electrolyte by ICP method increased in agreement with the accumulated removal weight of niobium from cavities which is calculated from the total charge (integrated current) of the all EP processes. 2) The measured aluminium concentration in the EP-electrolyte by ICP method increased as the aging of EP-electrolyte proceeded. The total aluminium weight of dissolution in this period was about 17 g. 3) The total fluorine concentration in the EP-electrolyte decreased to about 77% and effective fluorine concentration (F- + SO3F
-)decreased to about 54% in comparison with the initial fresh EP-electrolyte. 4) The chemical form of fluorine in 1/500 diluted EP-electrolyte changed from the fluoro-sulfuric ion (SO3F
-) to the fluoride ion (F-) when the aging of EP-electrolyte proceeded. 5) The amplitude of current oscillation became smaller when the aging of the EP-electrolyte proceeded. 6) The amplitude of the current oscillation in EP process depends on the form of fluorine in the EP-electrolyte.
DISCUSSION AND FUTURE PLAN The form of fluorine in the EP electrolyte changed
gradually from the fluoro-sulfuric ion (SO3F-) to the
fluoride ion (F-) when the aging of EP electrolyte proceeded. It is thought that this is because the coordination of fluorine and sulfate molecules in undiluted EP electrolyte gradually changes when the aging of EP electrolyte proceeds. For the chemical management of the EP-electrolyte, it is important that we study the change of dissolved states of each element and chemical species in it. In our group, we are trying to study the analysis of the EP-electrolyte by spectrographic analytical methods, Raman scattering spectroscopy, near-infrared [NIR] spectroscopy, and fluorescence spectroscopy, in addition to the chemical analysis methods which were
F-/ F-+FSO3-Ratio
Niobium concentration (g/l)
TUPO039 Proceedings of SRF2011, Chicago, IL USA
470 07 Cavity preparation and production
described in this article. The results from these analyses will be presented in the near future.
REFERENCES [1] M. Sawabe, et al., TTC-Meeting Apr, 2010 “Quality control of KEK STF”. https://indico.fnal.gov/conferenceDisplay.py?confId=3000. M. Sawabe, et al., Paper ID: WEPEC027, IPAC10, May 2010, “Long-monitoring of Electro-polishing Electrolyte in EP facility at KEK”.
Proceedings of SRF2011, Chicago, IL USA TUPO039
07 Cavity preparation and production 471


![g]kfn :jf:Yo ;]jf P]g, @)%# · 2018. 2. 21. · -#_ pkbkmf -@_ df h'g;'s} s'/f n]lvPsf] eP tfklg u|fdL0f :jf:Yo sfo{stf{ / dft[lzz' sfo{stf{n] xfn u/L cfPsf] sfo{ qmdzM cSh'n/L x]Ny](https://img.dokumen.tips/doc/110x75/61015834247e9d35d03612d3/gkfn-jfyo-jf-pg-2018-2-21-pkbkmf-df-hgs-sf-nlvpsf.jpg)