Embed Size (px)
Citation preview

A special report from The Economist Intelligence Unit
Long-term macroeconomic forecasts Key trends to 2050
www.eiu.com
Long-term macroeconomic forecastsKey trends to 2050
© The Economist Intelligence Unit Limited 2015 1
Overview 2
Top ten economies in 2050 at market exchange rates 3
The rise of Asia continues 4
Global dominance of the top three economies 5
A new era of global demographic decline 6
Population growth will still benefit a few 7
For most, population as a source of growth will need to be replaced 9
Collectively rich, individually not so rich 11
Long-term methodology 12
Contents

Long-term macroeconomic forecastsKey trends to 2050
© The Economist Intelligence Unit Limited 20152
W ith many companies making strategic business decisions over long time frames, the long-term projections of The Economist Intelligence Unit (EIU) provide information to facilitate such
decisions. Long-term forecasts and scenarios are also key to understanding some of the big economic issues that will shape global business in the coming decades. The EIU has an established methodology for producing long-term economic forecasts for 82 economies. We have recently completed an extension of our forecast horizon to 2050, and below we consider some of the key trends that are highlighted by these extended forecasts.
Overview

Long-term macroeconomic forecastsKey trends to 2050
© The Economist Intelligence Unit Limited 2015 3
China is expected to overtake the United States in 2026 in nominal GDP in US dollar terms and maintain its position as the largest economy to 2050. India is expected to move up the rankings
to third place, with real growth averaging close to 5% up to 2050. Indonesia and Mexico are expected to leap into the top ten world economies from 16th and 15th place in 2014 to fourth and ninth place respectively by 2050. We do not expect the representation of Western economies within the top-ten listing to become insignificant. The United States, Germany, the United Kingdom and France will all move down the rankings, but only Italy will lose its place within the top ten.
Top ten economies in 2050 at market exchange ratesNominal GDP (US$ bn)
Source: The Economist Intelligence Unit.
Russia [10]
India [9]
Italy [8]
Brazil [7]
France [6]
UK [5]
Germany [4]
Japan [3]
China [2]
US [1]
France [10]
UK [9]
Mexico [8]
Brazil [7]
Germany [6]
Japan [5]
Indonesia [4]
India [3]
US [2]
China [1]17,419
10,335
4,606
3,865
1,861
2,055
2,149
2,346
2,835
2,951
105,916
70,913
63,842
15,432
9,671
9,812
9,826
10,334
11,334
11,367
2014 2050
Economy moves up rankings
Economy moves down rankings
Economy remains at rankings

Long-term macroeconomic forecastsKey trends to 2050
© The Economist Intelligence Unit Limited 20154
The rise of Asia is not a new phenomenon; the rise of Japan and South Korea has been witnessed over the second half of the 20th century. The start of the new millennium saw another boom, with
many Asian economies recording high growth rates that took their share of global GDP from 26% to 32% between 2000 and 2014. Our extended long-term forecasts suggest that Asia’s rise will continue up to 2050—not quite at the same pace, but by 2050 it will account for 53% of global GDP.
The rise of Asia continues
Regional share of global GDP (%)
Source: The Economist Intelligence Unit.
0
10
20
30
40
50
60
70
80
90
100
0
10
20
30
40
50
60
70
80
90
100Middle East & AfricaEuropeAmericasAsia-Pacific
2041-502031-402019-302011-182001-101991-20001981-90

Long-term macroeconomic forecastsKey trends to 2050
© The Economist Intelligence Unit Limited 2015 5
By 2030 the top three economies of the world will be the US, China and India. Such will be the growth of the two latter countries, in particular, that by 2050 they will each be richer than the next
five (Indonesia, Germany, Japan, Brazil, and the UK) put together. This will represent a scale of wealth relative to the rest of the top ten that is unique in recorded history.
Given China’s and India’s economic might, they will take on a much bigger role in addressing global issues such as climate change, international security and global economic governance. In the medium term, this will require the world’s existing powers—notably the US—to let India, and especially China, play a greater role on the world stage and adapt international institutions to allow them to exert greater influence.
Global dominance of the top three economies
Nominal GDP, 2050(US$ trn)
Source: The Economist Intelligence Unit.
0
20
40
60
80
100
120
0
20
40
60
80
100
120
Next 5 economiesIndiaUSChina
105.92
70.9163.84
52.67

Long-term macroeconomic forecastsKey trends to 2050
© The Economist Intelligence Unit Limited 20156
G lobal growth to 2050 is not expected to decline dramatically from its average historical levels. However, regional growth rates are expected to begin to decline across every region after 2030.
Much of the global growth in recent decades has been driven by population growth. Long-term population estimates, however, reveal that growth in the global population is expected to see a dramatic decline from an average of 1.3% in the 1980-2014 period to 0.5% across the 2015-50 period. The slowdown in the growth rate of the global working-age population will be even starker, with a drop to 0.3% in the 2015-50 period, compared with an average growth rate of 1.7% in the 1980-2014 period.
A new era of global demographic declineReal GDP (% change - CAGR)
Source: The Economist Intelligence Unit.
0.0
0.5
1.0
1.5
2.0
2.5
3.0
3.5
4.0
4.5
0.0
0.5
1.0
1.5
2.0
2.5
3.0
3.5
4.0
4.5
World
2041-502031-402020-302011-19
Middle East & Africa EuropeAmericasAsia-Pacific
Average growth in global population (%)
Source: The Economist Intelligence Unit.
0.0
0.2
0.4
0.6
0.8
1.0
1.2
1.4
1.6
1.8
2.0
0.0
0.2
0.4
0.6
0.8
1.0
1.2
1.4
1.6
1.8
2.0
Working-age populationPopulation
2041-502031-402019-302011-182001-101991-2000

Long-term macroeconomic forecastsKey trends to 2050
© The Economist Intelligence Unit Limited 2015 7
The majority of countries in Africa and the Middle Eastern region will benefit from an increase in their working populations, which will be an advantage in sustaining higher growth rates in the
forecast period. The potential labour forces of Angola, Nigeria and Kenya are expected to almost triple between 2014 and 2050, rising respectively from 9m to 28m, 56m to 161m and 18m to 48m. The labour forces of Algeria, Egypt and Iran are expected to increase considerably too, doubling in size by 2050.
Population growth will still benefit a few
Largest increase in labour force (m)
Source: The Economist Intelligence Unit.
0
20
40
60
80
100
120
140
160
180
0
20
40
60
80
100
120
140
160
180
LibyaKuwaitAlgeriaAngolaIranEgyptKenyaPhilippinesPakistanNigeria
20142050
Contribution to real GDP growth, 2019-50 (% CAGR)
Source: The Economist Intelligence Unit.
0.0
1.0
2.0
3.0
4.0
5.0
6.0
0.0
1.0
2.0
3.0
4.0
5.0
6.0
of which Capital and TFP Real GDP (% change)of which Labour
South AfricaIranEgyptAlgeriaVenezuelaPhilippinesPakistanNigeriaKenyaAngola

Long-term macroeconomic forecastsKey trends to 2050
© The Economist Intelligence Unit Limited 20158
These economies will primarily benefit from favourable demographics in the forecast period, with higher birth rates supporting a healthy supply of workers. To a lesser extent, some of these economies will also be able to benefit from increased participation rates, as growing numbers of women enter the labour force in some economies and retirement ages are raised in others to increase the labour supply and support growth. Policies pursued to increase participation rates, however, will not be able to boost growth significantly. Countries with favourable demographics will therefore have an advantage in terms of sustaining higher levels of growth. The contribution to growth from changes to the labour force for these economies will be positive and represent a larger driver of growth than capital and total factor productivity.
For countries with favourable demographics, our forecasts assume that growth-friendly policies are pursued and are successful in providing jobs for a growing workforce and ensuring longer-term growth. Failure to achieve this will lead to a growing number of potential workers unable to find employment, resulting in a source of significant political instability and a missed opportunity in terms of seizing an advantage offered by favourable demographics.

Long-term macroeconomic forecastsKey trends to 2050
© The Economist Intelligence Unit Limited 2015 9
Most of Europe and East Asia, by contrast, is expected to see labour-force declines, representing a severe drag on growth. Japan will see the greatest decline of over one-quarter, from 66m to 47m;
China and South Korea are also expected to experience a 17-18% contraction in their labour forces. Within Europe, Greece, Portugal and Germany will see their available labour forces decline by over one-fifth, falling between 2014 and 2050 from 4.8m to 3.8m, 5.2m to 4.2m and 45m to 35m respectively. As a group, emerging European economies (with a few exceptions, including Kazakhstan and Turkey) will experience persistent declines in their available labour forces, ranging between 20% and 30%. These economies will see the drop in their labour forces act as a drag on growth.
For most, population as a source of growth will need to be replaced
Largest decrease in labour force (m)
Source: The Economist Intelligence Unit.
0
10
20
30
40
50
60
70
0
10
20
30
40
50
60
70
20142050
LithuaniaGreecePortugalRomaniaTaiwanUkraineSouth KoreaThailandGermanyJapan
of which Capital and TFP Real GDP (% change)of which Labour
Contribution to real GDP growth, 2019-50 (% CAGR)
Source: The Economist Intelligence Unit.
-1.0
0.0
1.0
2.0
3.0
4.0
-1.0
0.0
1.0
2.0
3.0
4.0
South KoreaPortugalGreeceRussiaTaiwanUkraineGermanyRomaniaThailandJapan

Long-term macroeconomic forecastsKey trends to 2050
© The Economist Intelligence Unit Limited 201510
Policies to boost participation rates will be pursued to soften the negative effects of unfavourable demographics, but these will not be sufficient. Immigration policies will move up high on government agendas as economies will be required to compete to attract a limited global pool of labour.
A country’s ability to switch to different sources of growth will be crucial. For some countries which are starting from a low capital base, there will be the potential for investment to support growth. These countries will still be able to make gains by moving from less technologically intensive production to capital-intensive manufacturing production. For more advanced economies, however, it will be gains from the more efficient usage of capital through increased technological progress as a result of investment in research and development (R&D) that will boost growth. A low level of investment following the financial crises in many economies suggests that the outlook for such gains will be unspectacular.
Long-term macroeconomic forecastsKey trends to 2050
© The Economist Intelligence Unit Limited 2015 11
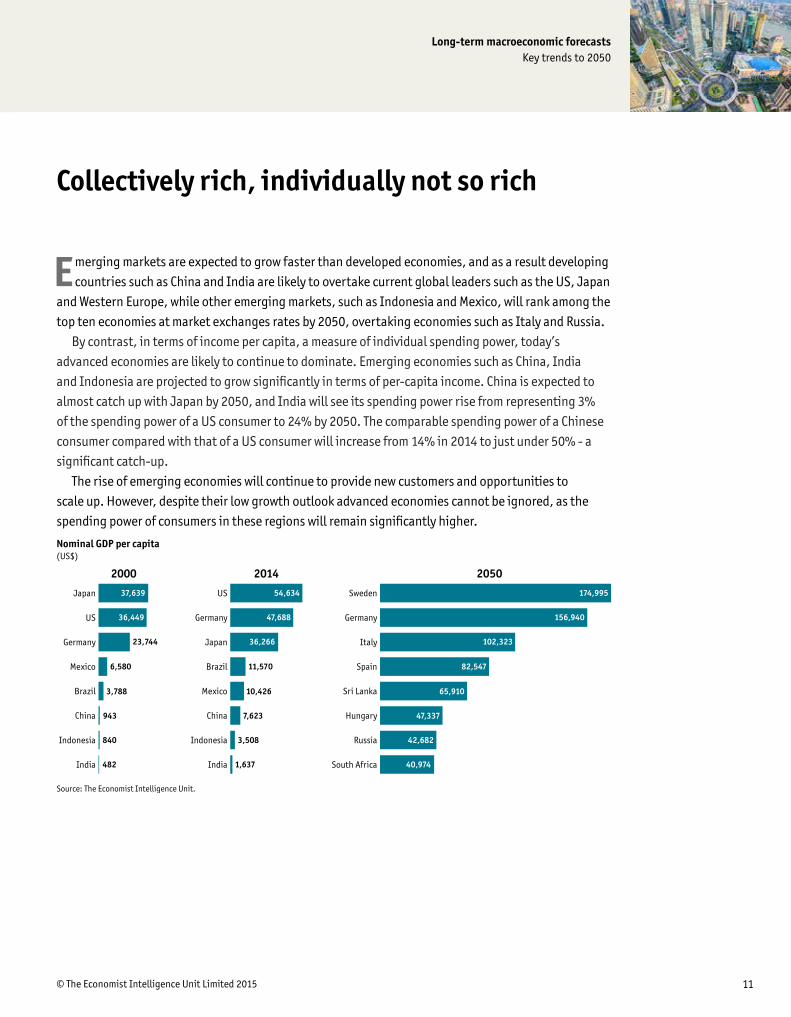
Emerging markets are expected to grow faster than developed economies, and as a result developing countries such as China and India are likely to overtake current global leaders such as the US, Japan
and Western Europe, while other emerging markets, such as Indonesia and Mexico, will rank among the top ten economies at market exchanges rates by 2050, overtaking economies such as Italy and Russia.
By contrast, in terms of income per capita, a measure of individual spending power, today’s advanced economies are likely to continue to dominate. Emerging economies such as China, India and Indonesia are projected to grow significantly in terms of per-capita income. China is expected to almost catch up with Japan by 2050, and India will see its spending power rise from representing 3% of the spending power of a US consumer to 24% by 2050. The comparable spending power of a Chinese consumer compared with that of a US consumer will increase from 14% in 2014 to just under 50% - a significant catch-up.
The rise of emerging economies will continue to provide new customers and opportunities to scale up. However, despite their low growth outlook advanced economies cannot be ignored, as the spending power of consumers in these regions will remain significantly higher.
Collectively rich, individually not so rich
Nominal GDP per capita(US$)
Source: The Economist Intelligence Unit.
India
Indonesia
China
Brazil
Mexico
Germany
US
Japan
India
Indonesia
China
Mexico
Brazil
Japan
Germany
US
South Africa
Russia
Hungary
Sri Lanka
Spain
Italy
Germany
Sweden 174,995
156,940
102,323
82,547
65,910
47,337
42,682
40,974
37,639
36,449
23,744
6,580
3,788
943
840
482
54,634
47,688
36,266
11,570
10,426
7,623
3,508
1,637
2000 2014 2050

Long-term macroeconomic forecastsKey trends to 2050
© The Economist Intelligence Unit Limited 201512
The methodology used to derive our long term-forecasts is distinct from that used to generate our five-year (medium-term) forecasts. Medium-term forecasts are based on a “demand-side”
forecasting framework, which assumes that supply adjusts to meet demand either directly through changes in output or through the drawing-down (or building-up) of inventories. Such a framework is appropriate for constructing short- and medium-term projections, where output can deviate substantially (but temporarily) from its long-run sustainable level. But a demand-side framework is not appropriate for forecasting over the long term. Instead, we utilise a supply-side framework, in which output is determined by the availability of labour and capital equipment and the growth in productivity.
The Economist Intelligence Unit is well placed to produce long-term projections and scenarios. We have considerable experience in tracking and forecasting a variety of economic and institutional factors, which our analysis suggests are closely related to long-term growth prospects. These factors include the availability of an educated workforce, the openness of the economy to trade, the quality of institutions (including the legal framework and the quality of the bureaucracy), fiscal policy, the degree of government regulation and movements in the population of working age relative to the overall population. In addition, the income gap between each country and the global technological leader (the US) is important, as this illustrates the potential for economic catch-up by importing ideas and techniques. Forecasts of GDP growth per capita based on these factors can then be combined with demographic projections (taken primarily from UN population projections) to give forecasts for overall GDP growth.
Long-term methodology

Cover image - © chungking/ Shutterstock.com
While every effort has been taken to verify the accuracy of this information, The Economist Intelligence Unit Ltd. cannot accept any responsibility or liability for reliance by any person on this report or any of the information, opinions or conclusions set out in this report.

LONDON20 Cabot SquareLondonE14 4QWUnited KingdomTel: (44.20) 7576 8000Fax: (44.20) 7576 8500E-mail: [email protected]
NEW YORK750 Third Avenue5th FloorNew York, NY 10017United StatesTel: (1.212) 554 0600Fax: (1.212) 586 1181/2E-mail: [email protected]
HONG KONG1301 Cityplaza Four12 Taikoo Wan Road, Taikoo ShingHong KongTel: (852) 2585 3888Fax: (852) 2802 7638E-mail: [email protected]
GENEVARue de l’Athénée 321206 GenevaSwitzerlandTel: (41) 22 566 2470Fax: (41) 22 346 93 47E-mail: [email protected]