Embed Size (px)
Citation preview

Long term macro-
economics assessment of
Latin America
Sarah Hunter
Oxford Economics
Page 2
Economic forecasts
Household projections
Risk
•Oxford Economics’ Global Economic Model
•Econometric analysis to decompose population into income groups and model consumption by product & service
•Based on Economic & Political Risk Evaluator
•WEF’s World Competitiveness Report
Methodology
Macro
Forecasts
Macroeconomic analysis was completed in three stages, with each stage leveraging quantitative tools
built by the Oxford Economics team

Page 3
Market Influencers
Growth has slowed in most Latam countries as the region has been buffeted by weak commodity prices,
with many countries having limited scope for policy response
Key drivers of the near-term economic growth prospect are:
Commodity prices – countries such as Bolivia, Colombia, Guatemala and Paraguay have been hit by weak commodity
prices. However, there has been a boost to commodity importers such as El Salvador and Honduras;
US growth – the US is important for trade and remittances for Costa Rica, El Salvador and Honduras and these
countries will benefit as the US recovery strengthens;
Inflation and deficits – these are critical for determining the amount of policy support an economy can expect. Fiscal
policy in Bolivia and Costa Rica is constrained while inflation has pushed up interest rates in Colombia.
Exports
(% of GDP)
Commodities
(% of exports)
Current
account
(% of GDP)
Workers
remittances
(% GDP)
InflationInterest rate
(lending)
Government
balance
(% of GDP)
Population
(16-26 CAGR)
Bolivia 20.5% 82% -8.3% 3.6% 4.5% 8.4% -6.3% 1.4%
Colombia 11.6% 73% -6.0% 1.1% 7.6% 14.3% -3.9% 0.7%
Costa Rica 19.1% 26% -3.5% 1.2% 1.3% 14.2% -6.2% 0.9%
El Salvador 16.8% 18% -3.1% 16.8% 1.6% 6.2% -2.3% 0.3%
Guatemala 18.1% 49% 0.1% 9.9% 4.5% 13.2% -1.3% 1.9%
Honduras 28.3% 28% -6.9% 17.4% 2.9% 20.7% -3.2% 1.3%
Paraguay 42.6% 62% -1.2% 1.6% 4.7% 18.5% -2.5% 1.2%
External Factors Domestic factors

Page 4
Bolivia and Honduras have the most favorable medium-term growth outlooks, whereas El Salvador has
weaker underlying fundamentals that limits growth
Macroeconomic Outlook
Macro Outlook
Domestic and institutional factors are more
important in determining outlook for investment
and productivity, which are key to explaining
long run growth. In particular:
Business environment – challenging
across all countries, although Costa Rica
and Paraguay have relatively business
friendly policies that should be more
supportive of investment;
Political stability/corruption – these
factors increase the cost of doing
business across Latam;
Security – security is a major concern in
El Salvador, Guatemala, and Honduras
and this severely hampers private
enterprise.Bolivia Colombia Costa Rica El Salvador Guatemala Honduras Paraguay
0
5
10
15
20
25
30
% o
f G
DP
Other FDI
Source: Oxford Economics
Investment

Page 5
Outlook for Households
Costa Rica, Colombia, El Salvador, Guatemala, and Paraguay are all expected to have average incomes
approaching or above US$20,000 by 2026
Consumer spending
The outlook for average incomes is largely
determined by overall economic growth and
therefore we expect to see the strongest income
growth in Bolivia and Honduras.
The poorest households in the study are
Bolivia and Honduras. Average incomes are
only over US$20,000 in Costa Rica and
Colombia suggesting limited discretionary
spending across the countries in this study.
“Middle class” households – countries with
relatively high starting income levels and those
likely to see robust economic growth should see
the largest rise in the number of households
with income >US$20,000. These are Costa Rica
and Colombia. The smallest increases occur in
Bolivia and Guatemala.
Page 6
Exchange Rate
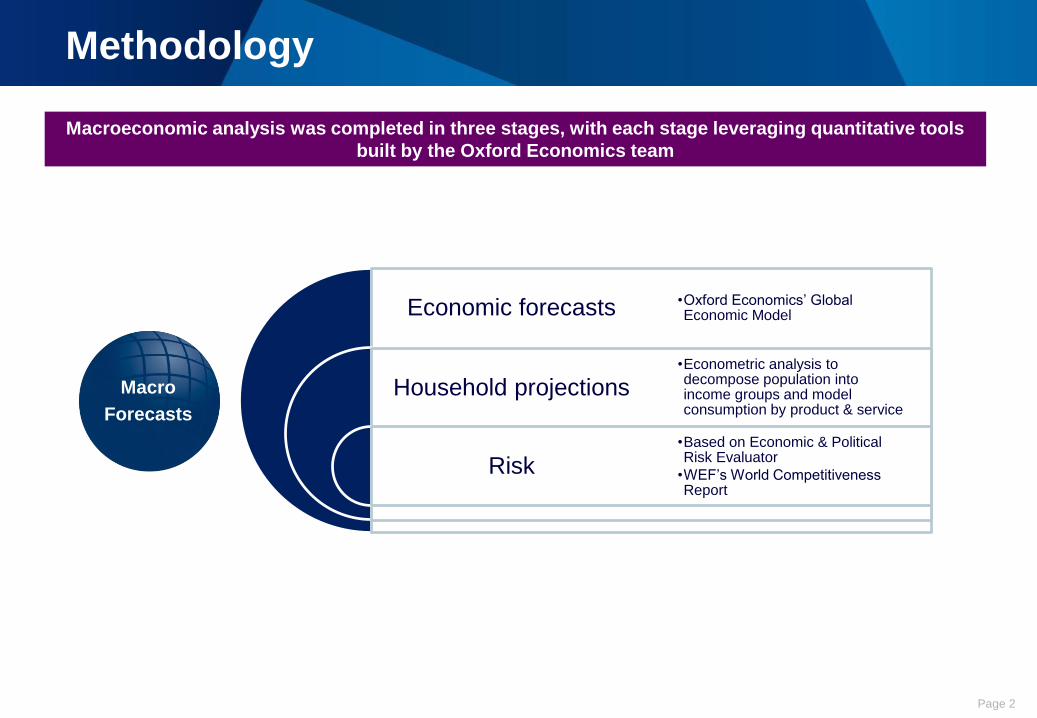
We expect to see a gradual depreciation in the currencies of Bolivia, Colombia, Costa Rica, Guatemala,
Honduras, and Paraguay against the US$
Exchange Rate
Volatility can be managed with some form of
exchange rates control and El Salvador is
dollarized.
The robustness of pegs depend largely on a
country’s reserves (relative to size of imports
and short-term debt). Bolivia has a significant
buffer while Costa Rica and Honduras are
more vulnerable should the markets turn
against them.
Most countries will see a real appreciation of
the exchange rate over the forecast period.
Colombia (Oil), Guatemala (Agriculture) and
Paraguay (Soya) are exposed to
commodities and uncertainty over the outlook
for commodity prices means that volatility over
the next few years may be higher than normal.
2015 2021
Depreciation
(CAGR 2015-21) 2026
Depreciation
(CAGR 2021-26)
Bolivia 6.9 7.2 0.6% 7.7 1.4%
Colombia 2741 2900 0.9% 2956 0.4%
Costa Rica 535 642 3.1% 723 2.4%
El Salvador
Guatemala 7.7 8.5 1.7% 9.3 1.8%
Honduras 22.0 25.3 2.4% 29.7 3.3%
Paraguay 5205 5859 2.0% 6362 1.7%
Exchange rate

Page 7
Latam Market Potential
Note: The size of the bubble indicates number of households with income >US$20,000
Honduras and Bolivia offer strong growth potential, while Colombia and Guatemala are the largest
markets
2011-16 2016-21 2021-26
Bolivia 4.9 4.4 5.0
Colombia 3.8 3.6 3.5
Costa Rica 3.8 4.0 3.4
El Salvador 2.0 2.1 2.1
Guatemala 3.6 3.5 3.4
Honduras 3.4 4.0 4.6
Paraguay 4.4 3.8 3.2
Source: Oxford Economics/Haver Analytics
GDP growth (%)

Page 8
Bolivia Macro Outlook
Market Outlook
Risk
Bolivia has been hit by the slump in commodity prices but the economy should benefit from the recovery in oil
and gas prices. While growth should outperform Latam as whole, income levels are relatively low
Page 9
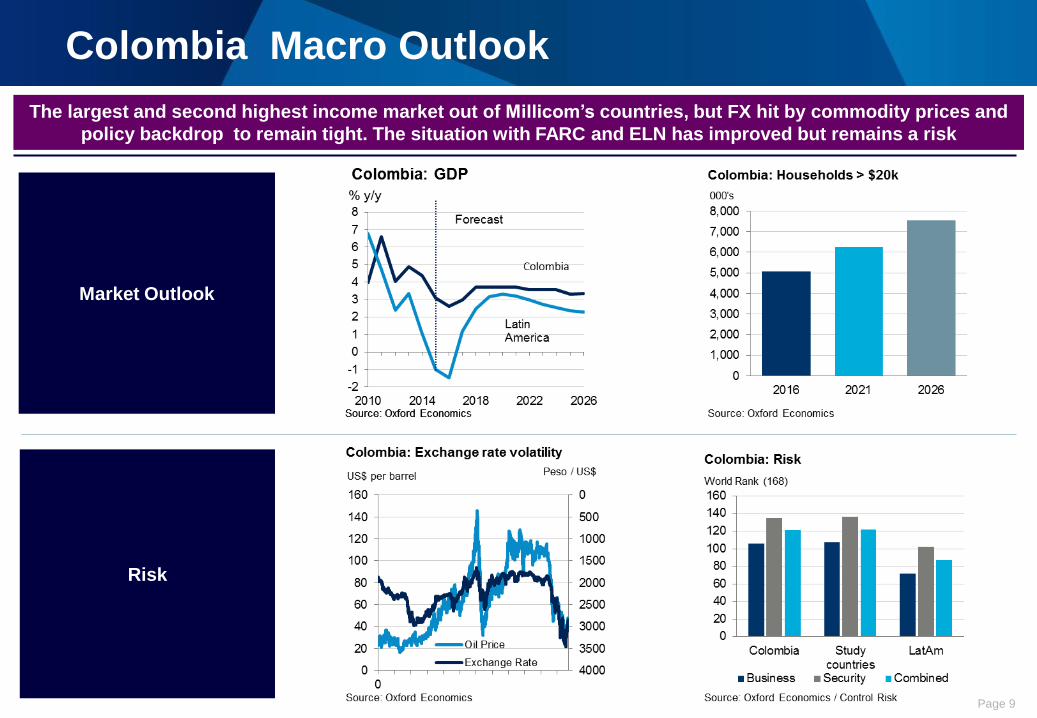
Colombia Macro Outlook
Market Outlook
Risk
The largest and second highest income market out of Millicom’s countries, but FX hit by commodity prices and
policy backdrop to remain tight. The situation with FARC and ELN has improved but remains a risk
Page 10
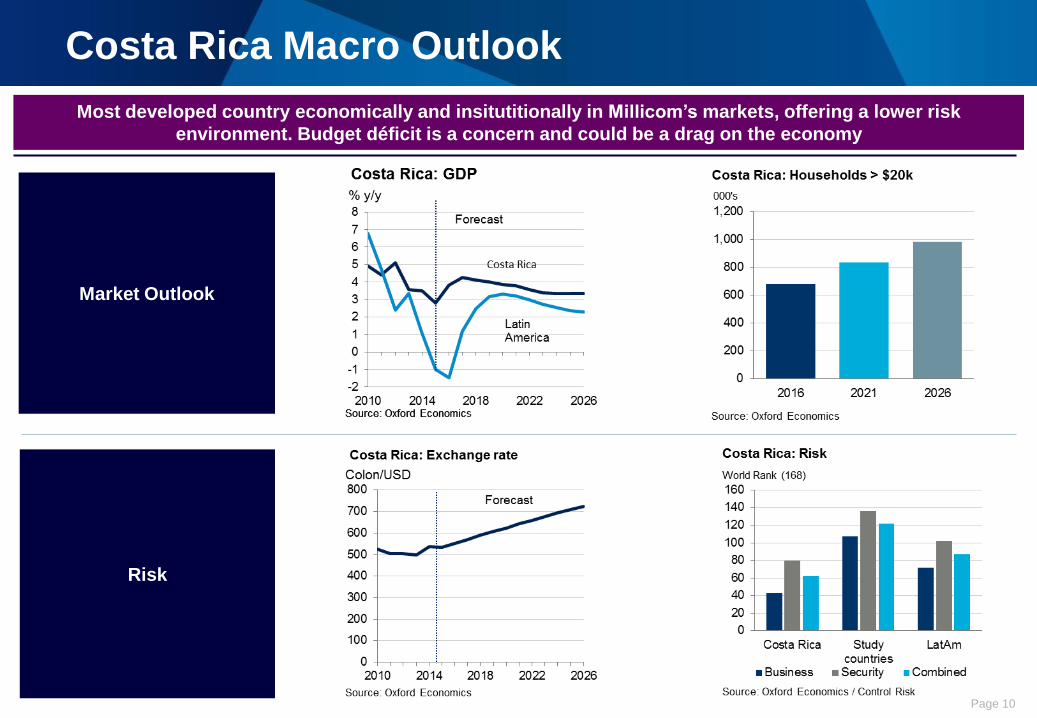
Costa Rica Macro Outlook
Market Outlook
Risk
Most developed country economically and insitutitionally in Millicom’s markets, offering a lower risk
environment. Budget déficit is a concern and could be a drag on the economy

Page 11
El Salvador Macro Outlook
Market Outlook
Risk
Security threat and criminality clouds the outlook and the weak political backdrop means progress to creating a
more business-friendly environment is likely to be slow

Page 12
Guatemala Macro Outlook
Market Outlook
Risk
Dependent on the US, especially for remittances, which should help growth over the next couple of years, while
rapid population growth should help medium term prospects. Security remains a risk to business, however

Page 13
Honduras Macro Outlook
Market Outlook
Risk
Growth set to accelerate, underpinned by recovery in US and solid fundamentals. Progress on reforms to
promote the business environment are needed
Page 14
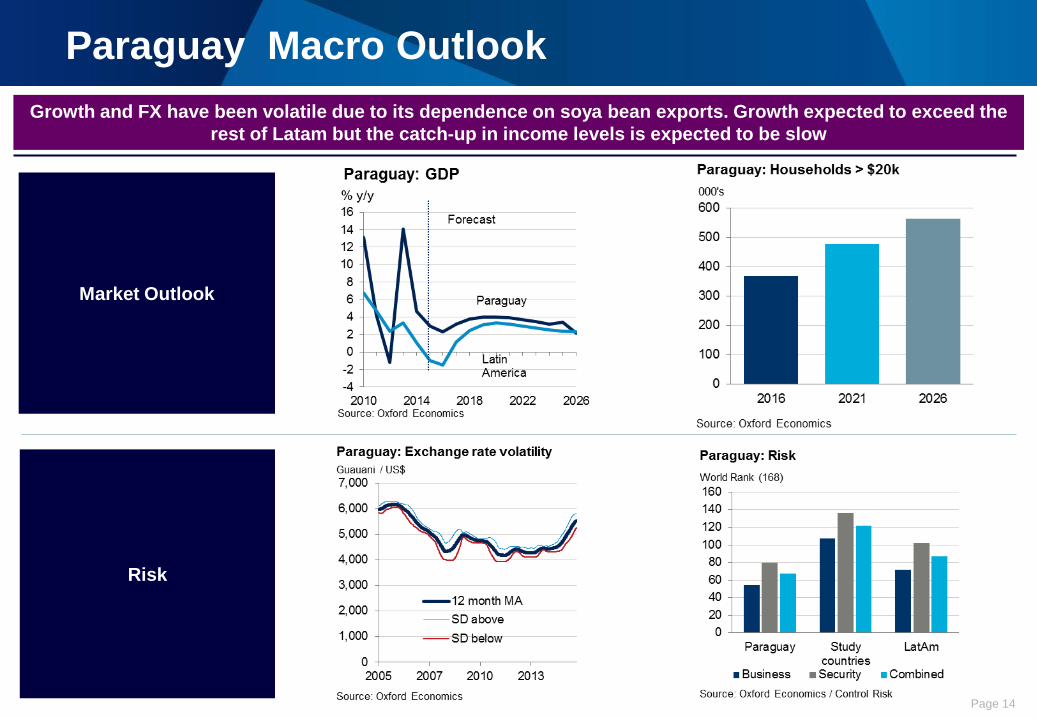
Paraguay Macro Outlook
Market Outlook
Risk
Growth and FX have been volatile due to its dependence on soya bean exports. Growth expected to exceed the
rest of Latam but the catch-up in income levels is expected to be slow

Page 15
Market Attractiveness
Costa Rica is least risky but biggest returns could be in Bolivia and Honduras
Market attractiveness
Note: The size of the bubble indicates total
consumption in a market
Note: Countries ranked by their score with a low rank meaning a country performs well. Economic growth is drawn from Oxford
Economics’ forecasts, exchange rate risk, security risk, political stability and social cohesion are taken from the Economic and
Political Risk Evaluator, and business environment, infrastructure and health & education are sourced from the World
Competitiveness Report from the World Economic Forum.
Costa Rica offers the least risky returns, although it is not the fastest growing nor largest market in the study.
Bolivia and Honduras are attractive from growth but risks are higher with infrastructure poor in both countries and security a
concern in Honduras.
Colombia and Guatemala are larger, more mature markets with some structural challenges and operational risks
Paraguay is relatively unattractive as a small market with very under developed infrastructure, a poor growth outlook and
volatile exchange rate. Poor security dominates the outlook in El Salvador.
Bolivia Colombia Costa Rica El Salvador Guatemala Honduras Paraguay
Economic Growth 1 4 3 7 5 2 6
Exchange Rate 2 3 7 1 5 4 6
Business environment 3 4 1 4 4 4 2
Security 1 4 1 7 5 5 17 15 12 19 19 15 15
Operational Environment 1 3 2 6 6 3 3
Infrastructure 6 4 2 1 3 5 7
Health and Education 6 4 1 3 5 2 7
Political 7 1 1 3 3 3 6
Social Cohesion 5 6 2 2 6 2 124 15 6 9 17 12 21
Structural Factors 7 4 1 2 5 3 6

Appendix

Page 17
GDP growth
-2
0
2
4
6
8
10
12
14
16
2010 2012 2014 2016 2018 2020 2022 2024 2026
Bolivia
Colombia
Paraguay
Source: Oxford Economics
% y/y
Forecast
South America GDP growth
0
1
2
3
4
5
6
2010 2012 2014 2016 2018 2020 2022 2024 2026
Costa Rica El Salvador
Guatemala Honduras
Source: Oxford Economics
% y/y
Forecast
Central America GDP growth
% y/y 2005 2006 2007 2008 2009 2010 2011 2012 2013 2014 2015 2016e 2017e 2018e 2019e 2020e 2021e 2022e 2023e 2024e 2025e 2026e
Bolivia 4.4 4.8 4.6 6.1 3.4 4.1 5.2 5.1 6.8 5.5 4.0 3.4 3.8 4.1 4.5 4.8 5.0 5.0 5.0 5.0 4.9 4.9
Colombia 4.7 6.7 6.9 3.5 1.7 4.0 6.6 4.0 4.9 4.4 3.1 2.6 3.0 3.7 3.7 3.7 3.7 3.5 3.5 3.5 3.3 3.3
Paraguay 2.3 4.7 5.5 6.2 -3.9 13.1 4.2 -1.2 14.0 4.7 2.9 2.3 3.2 3.8 4.0 4.0 3.9 3.7 3.5 3.2 3.4 2.2
Costa Rica 5.9 8.8 8.0 2.6 -0.9 4.9 4.4 5.1 3.6 3.5 2.8 3.8 4.2 4.1 4.0 3.9 3.8 3.6 3.4 3.4 3.4 3.4
El Salvador 3.6 3.9 3.8 1.3 -3.1 1.4 2.2 1.9 1.8 1.4 2.5 2.6 2.3 2.0 2.1 2.1 2.1 2.1 2.1 2.1 2.1 2.1
Guatemala 3.3 5.4 6.3 3.3 0.5 2.9 4.2 3.0 3.6 4.3 3.8 3.4 3.5 3.5 3.5 3.5 3.5 3.5 3.5 3.4 3.4 3.0
Honduras 6.0 6.6 6.2 4.2 -2.4 3.7 3.8 4.1 2.8 3.0 3.7 3.5 3.7 3.8 4.0 4.0 4.5 4.6 4.7 4.5 4.5 4.6
Source: Oxford Economics

Page 18
Households and household income
Total households
(millions) 2010 2011 2012 2013 2014 2015 2016e 2017e 2018e 2019e 2020e 2021e 2022e 2023e 2024e 2025e 2026e
Bolivia 2.6 2.6 2.7 2.8 2.8 2.9 3.0 3.0 3.1 3.2 3.3 3.3 3.4 3.5 3.6 3.7 3.7
Colombia 12.2 12.5 12.7 13.0 13.3 13.6 13.9 14.2 14.4 14.7 15.0 15.3 15.5 15.8 16.1 16.3 16.6
Paraguay 1.4 1.4 1.5 1.5 1.5 1.6 1.6 1.6 1.7 1.7 1.7 1.7 1.8 1.8 1.8 1.9 1.9
Costa Rica 1.3 1.3 1.4 1.4 1.4 1.4 1.5 1.5 1.5 1.5 1.6 1.6 1.6 1.6 1.7 1.7 1.7
El Salvador 1.5 1.5 1.5 1.5 1.5 1.6 1.6 1.6 1.6 1.6 1.7 1.7 1.7 1.7 1.7 1.7 1.7
Guatemala 2.9 2.9 3.0 3.1 3.2 3.3 3.4 3.5 3.5 3.6 3.7 3.8 3.9 4.0 4.1 4.2 4.3
Honduras 1.6 1.6 1.7 1.7 1.7 1.8 1.8 1.8 1.9 1.9 1.9 2.0 2.0 2.1 2.1 2.2 2.2
Average household personal disposable income ($US at 2012 prices)
($ ‘000) 2010 2011 2012 2013 2014 2015 2016e 2017e 2018e 2019e 2020e 2021e 2022e 2023e 2024e 2025e 2026e
Bolivia 6.6 6.8 7.0 7.3 7.5 7.7 7.8 8.0 8.2 8.4 8.6 8.8 9.0 9.2 9.4 9.7 9.9
Colombia 19.9 20.6 21.0 21.4 21.8 22.0 22.2 22.5 22.9 23.3 23.8 24.3 24.8 25.2 25.7 26.2 26.7
Paraguay 13.7 13.9 14.6 14.9 15.2 15.3 15.4 15.7 16.1 16.4 16.8 17.1 17.3 17.5 17.7 17.9 18.0
Costa Rica 23.3 23.7 24.2 24.5 24.8 25.1 25.7 26.4 27.1 27.8 28.4 29.1 29.7 30.4 31.0 31.7 32.1
El Salvador 16.6 16.8 16.9 16.8 16.8 16.8 17.0 17.1 17.3 17.5 17.6 17.8 18.0 18.2 18.4 18.5 18.7
Guatemala 16.3 16.4 16.4 16.5 16.6 16.8 16.8 16.9 17.0 17.1 17.3 17.3 17.4 17.7 18.0 18.2 18.4
Honduras 9.8 9.9 10.0 10.1 10.2 10.2 10.3 10.5 10.7 10.9 11.1 11.3 11.6 11.8 12.1 12.4 12.6
Source: Oxford Economics
Source: Oxford Economics

Page 19
Exchange rates
Exchange rates (vs. US $)
2010 2011 2012 2013 2014 2015 2016e 2017e 2018e 2019e 2020e 2021e 2022e 2023e 2024e 2025e 2026e
Bolivia Bolivianos7.02 6.94 6.91 6.91 6.91 6.91 6.91 6.91 7.01 7.08 7.15 7.21 7.26 7.32 7.37 7.52 7.66
Colombia Pesos1,899 1,848 1,797 1,869 2,002 2,742 3,300 3,200 3,100 3,000 2,950 2,900 2,903 2,902 2,900 2,928 2,956
Paraguay Guaranies4,735 4,191 4,425 4,321 4,462 5,205 5,658 5,670 5,698 5,732 5,784 5,859 5,947 6,042 6,145 6,253 6,362
Costa Rica Colones526 506 503 500 538 535 552 571 590 608 624 642 660 677 696 709 723
Guatemala Quetzales8.06 7.79 7.83 7.86 7.73 7.65 7.82 7.98 8.10 8.23 8.36 8.49 8.63 8.77 8.93 9.10 9.28
Honduras Lempiras18.90 18.92 19.50 20.36 21.02 21.98 22.90 23.36 23.83 24.31 24.79 25.34 26.00 26.83 27.74 28.70 29.69
Source: Oxford Economics