Embed Size (px)
Citation preview
1 @ 2014 Tetcos. This document is protected by copyright, all rights reserved
Tetcos White Paper
LONG TERM EVOLUTION (LTE) PROTOCOL
Verification of MAC Scheduling algorithms in NetSim
TM
Authors:
1. AdityaTiwari IIT Kharagpur
2. ShashikantSuman Tetcos
3. PranavViswanathan Tetcos
2 @ 2014 Tetcos. This document is protected by copyright, all rights reserved
Table of Contents
1. Abstract .......................................................................................................................................... 3
2. Introduction to LTE ........................................................................................................................ 3
2.1 Requirement of MAC scheduling .............................................................................................. 3
2.2 Round Robin ............................................................................................................................... 4
2.3 Proportional Fair Scheduling ..................................................................................................... 4
2.4 Maximum throughput scheduling .............................................................................................. 5
3. Introduction to NetSim .................................................................................................................. 6
4. Implementation .............................................................................................................................. 6
5. Testing ........................................................................................................................................... 7
5.1 Round robin throughput scheduling algorithm ......................................................................... 7
5.2 Proportional fair scheduling algorithm .................................................................................... 10
6. Reference .................................................................................................................................... 13
7. Appendix ...................................................................................................................................... 13
Table 1 : SNR – CQI Index mapping ......................................................................................... 13
Table 2: CQI – MCS mapping .................................................................................................... 14
Table 3: MCS – TBS index mapping ......................................................................................... 14
Table 4: TBS to Transport Block Size ....................................................................................... 15

3 @ 2014 Tetcos. This document is protected by copyright, all rights reserved
1. Abstract
In this paper, we compare NetSim’s LTE performance metrics with the equivalent NS 3 test
suite. The scenario involves multiusers in downlink using different MAC scheduling algorithms,
namely Round Robin and Proportional fair scheduling. (NetSim, in addition also has a custom
implementation of the maximum throughput scheduling algorithm, but NS3 test vectors do not
exist for this algorithm)
2. Introduction to LTE
LTE, an acronym for Long Term Evolution, commonly known as 4G LTE, is a standard
for wireless communication of high-speed data for mobile phones and data terminals. It is based
on the GSM/EDGE and UMTS/HSPA network technologies, increasing the capacity and speed
using a different radio interface together with core network improvements.
LTE uses new multiple access schemes on the air interface: OFDMA (Orthogonal Frequency
Division Multiple Access) in downlink and SC-FDMA (Single Carrier Frequency Division Multiple
Access) in uplink. Furthermore, MIMO antenna schemes form an essential part of LTE. In the
long term evolution (LTE) cellular communication system scheduling the user transmission on
the downlink is the biggest challenge.
2.1 Requirement of MAC scheduling
In LTE Radio Resource Management (RRM) is a challenging task as many operators nowadays
offer unlimited data plans and different services. One of the key RRM functions in LTE is MAC
scheduling, which coordinates the access to shared radio resources. In OFDMA-based LTE
systems, this coordination generally considers two distinct dimensions, the time dimension
(allocation of time frames) and the frequency dimension (allocation of subcarriers or subcarrier
groups). A key challenge in setting parameters for a MAC scheduler is to optimize resource
efficiency, while satisfying the users' QoS requirements and achieving a certain degree of
fairness.
The network scheduler logic is similar to a statistical multiplexer wherea packet to be forwarded
next is stored in a buffer which works as a queuing system. The buffer space is divided into
many queues, each of which is used to hold the packets of one flow, defined for instance by
4 @ 2014 Tetcos. This document is protected by copyright, all rights reserved
source and destination IP addresses. In each case the network scheduling algorithm determines
how the network scheduler manages the buffer.
2.2 Round Robin
Round Robin is the simplest scheduler which distributes the resources equally to all the users.
It works by allocating the resource blocks to the non-empty Radio link control (RLC) queues in
cyclic order. These non-empty RLC queues are also referred as active flows. If all the flows are
allocated to some RBGs (Resource block Group) then they all are transmitted in the same sub
frame. Otherwise, if some of the flows are left unassigned then the allocation in the next frame
will start from the last flowthat was not allocated. The modulation and coding scheme for
different transmission channels are allocated according to the received Channel Quality
Indicator (CQI).
2.3 Proportional Fair Scheduling
The Proportional Fair (PF) scheduling supports high resource utilization while maintaining good
fairness among network flows.A user is likely to be scheduled when its instantaneous channel
quality is high relative to its own average channel condition over time. Let 𝑀𝑖be the Modulation
and Coding Scheme Index (MCS) assigned to a user depending upon the corresponding CQI.
Using the Transport Block Size (TBS) mapping, 𝑆 𝑀𝑗 , 𝐵 be the transport block size as
defined in 3GPP standard TS36.213 where 𝐵 is the number of resource blocks used. Number
of resource blocks is decided according to the bandwidth of transmission channel. Let 𝑇𝑗 𝑡 , be
the past average throughput of the user 𝑗. Hence the rate achievable by the user 𝑗is given by
𝑅𝑗 𝑘, 𝑡 = 𝑆(𝑀𝑗 , 𝐵)
𝜏
Where𝜏 is the transmission time interval.
Scheduling of the users is done according to the following relation.
𝑖𝑘 𝑡 = argmax𝑗=1,…,𝑁
𝑅𝑗 𝑘, 𝑡
𝑇𝑗 𝑡
5 @ 2014 Tetcos. This document is protected by copyright, all rights reserved
The previous average throughput is given by
𝑇𝑗 𝑡 + 1 = 1 − 𝜆 𝑇𝑗 𝑡 + 𝜆𝑇𝑗 𝑡 , 𝑖𝑓𝑗𝑖𝑠𝑠𝑐ℎ𝑒𝑑𝑢𝑙𝑒𝑑
= 1 − 𝜆 𝑇𝑗 𝑡 , 𝑜𝑡ℎ𝑒𝑟𝑤𝑖𝑠𝑒
𝜆isa constant which is very close to unity.𝑇𝑗 𝑡 is the actual throughput achieved by user 𝑗in the
sub frame 𝑡.
2.4 Maximum throughput scheduling
The Maximum throughput scheduler maximizes the throughput of the base station. The
maximum throughput is achieved by allocating resources on the basis of channel condition only.
The user with the highest value of wideband CQI index is scheduled first. The scheduling and
calculation of the throughput is very similar to that of Proportional Fair scheduling algorithm. Let
𝑖, 𝑗 be the user index. 𝑆(𝑀𝑗 ,𝐵)be the size of the TB according to TS 36.213, where 𝐵 is the
number of resource blocks used. Achievable throughput for sub frame 𝑡is given by
𝑅𝑗 𝑘, 𝑡 = 𝑆(𝑀𝑗 , 𝐵)
𝜏
Where 𝜏 is the TTI duration.Finally user index I to be scheduled is defined by
𝑖𝑘 𝑡 = argmax𝑗=1,…,𝑁
𝑅𝑗 𝑘, 𝑡
Thus it selects the user with maximum throughput.
6 @ 2014 Tetcos. This document is protected by copyright, all rights reserved
3. Introduction to NetSim
NetSim, developed by Tetcos, is a popular discrete event, network simulation software used for
Network Research and Development. NetSim’s development environment platform allows users
to develop custom codes, simulate their models and statistically analyze performance metrics.
MAC scheduler with LTE in NetSim incorporates three different scheduling algorithms named
Round Robin (RR), Proportional Fair (PF) and Maximum throughput scheduling. In this paper
we explain the implementation and then compare the results against standard NS 3 test vectors.
4. Implementation
We incorporated a generalized algorithm to implement all three of the scheduling types. Steps
to be followed are listed below.
1. Initialize the number of user set
2. Find the maximum priority among the users
3. Assign priority as per the criteria mentioned in the equation
4. Sort all the users according to their priority value
5. Continue allocating the resources as usual
Consider the given expression
𝑖𝑘 𝑡 = argmax𝑗=1,…,𝑁
𝑅𝑗 𝑘, 𝑡 𝛼
𝑇𝑗 𝑡 𝛽
𝑅𝑗 𝑘, 𝑡 is the required throughput by a user 𝑗 and 𝑇𝑗 𝑡 is the previous average throughput of
the same user. 𝛼 and 𝛽 are constants.
Previous average throughput is calculated by the following formula
𝑇𝑗 𝑡 + 1 = 1 − 𝜆 𝑇𝑗 𝑡 + 𝜆𝑇𝑗 𝑡 , 𝑖𝑓𝑗𝑖𝑠𝑠𝑐ℎ𝑒𝑑𝑢𝑙𝑒𝑑
= 1 − 𝜆 𝑇𝑗 𝑡 , 𝑜𝑡ℎ𝑒𝑟𝑤𝑖𝑠𝑒
𝜆 is a constant which is very close to unity.
For proportional fair scheduling 𝛼 = 1and 𝛽 = 1, which implies that both the previous and
current possible throughput are considered for scheduling. Round Robin algorithm is
implemented by taking 𝛼 = 0and 𝛽 = 1, that is only previous throughput is used for
7 @ 2014 Tetcos. This document is protected by copyright, all rights reserved
scheduling. Maximum throughput algorithm uses 𝛼 = 1and 𝛽 = 0, which implies that the user
with highest possible throughput will get scheduled first irrespective of earlier throughputs.
5. Testing
For the testing of Round Robin and Proportional fair scheduling algorithm following scenarios
have been considered
5.1 Round robin throughput scheduling algorithm
Scenario
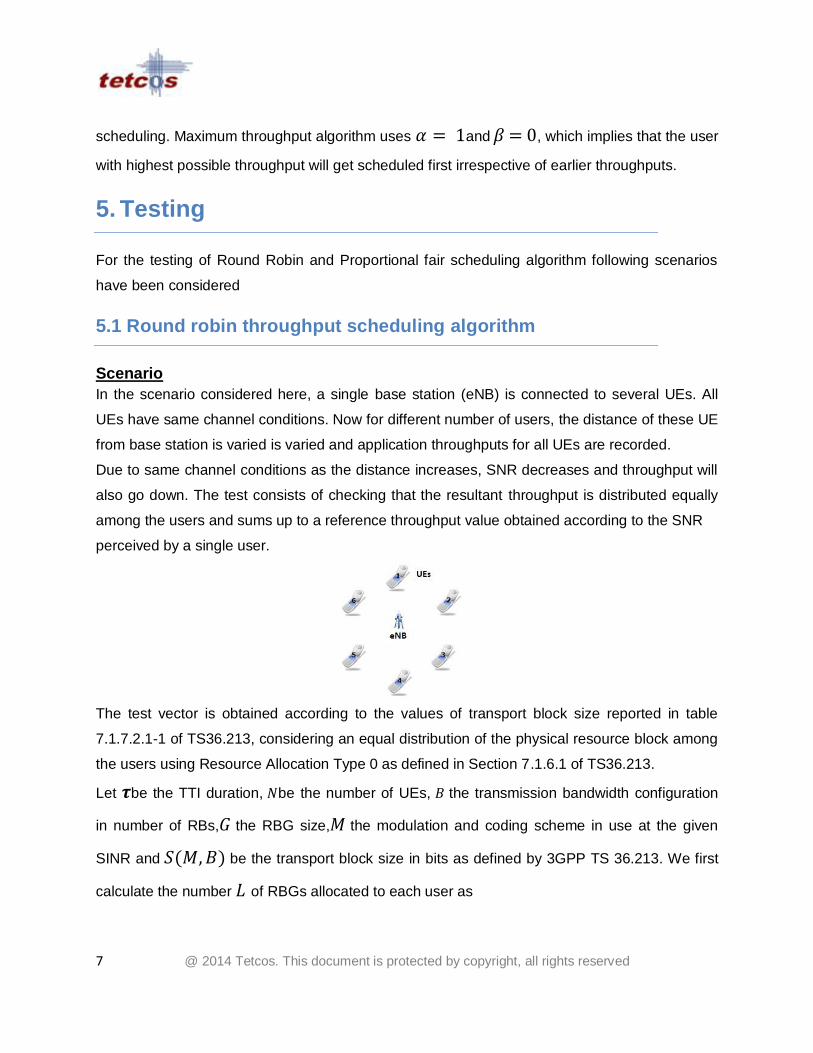
In the scenario considered here, a single base station (eNB) is connected to several UEs. All
UEs have same channel conditions. Now for different number of users, the distance of these UE
from base station is varied is varied and application throughputs for all UEs are recorded.
Due to same channel conditions as the distance increases, SNR decreases and throughput will
also go down. The test consists of checking that the resultant throughput is distributed equally
among the users and sums up to a reference throughput value obtained according to the SNR
perceived by a single user.
The test vector is obtained according to the values of transport block size reported in table
7.1.7.2.1-1 of TS36.213, considering an equal distribution of the physical resource block among
the users using Resource Allocation Type 0 as defined in Section 7.1.6.1 of TS36.213.
Let 𝝉be the TTI duration, 𝑁be the number of UEs, 𝐵 the transmission bandwidth configuration
in number of RBs,𝐺 the RBG size,𝑀 the modulation and coding scheme in use at the given
SINR and 𝑆(𝑀,𝐵) be the transport block size in bits as defined by 3GPP TS 36.213. We first
calculate the number 𝐿 of RBGs allocated to each user as
8 @ 2014 Tetcos. This document is protected by copyright, all rights reserved
𝐿 = 𝐵
𝑁𝐺
The reference throughput 𝑇 in bit/s achieved by each UE is then calculated as
𝑇 = 𝑠 𝑀, 𝐿𝐺
8 𝜏
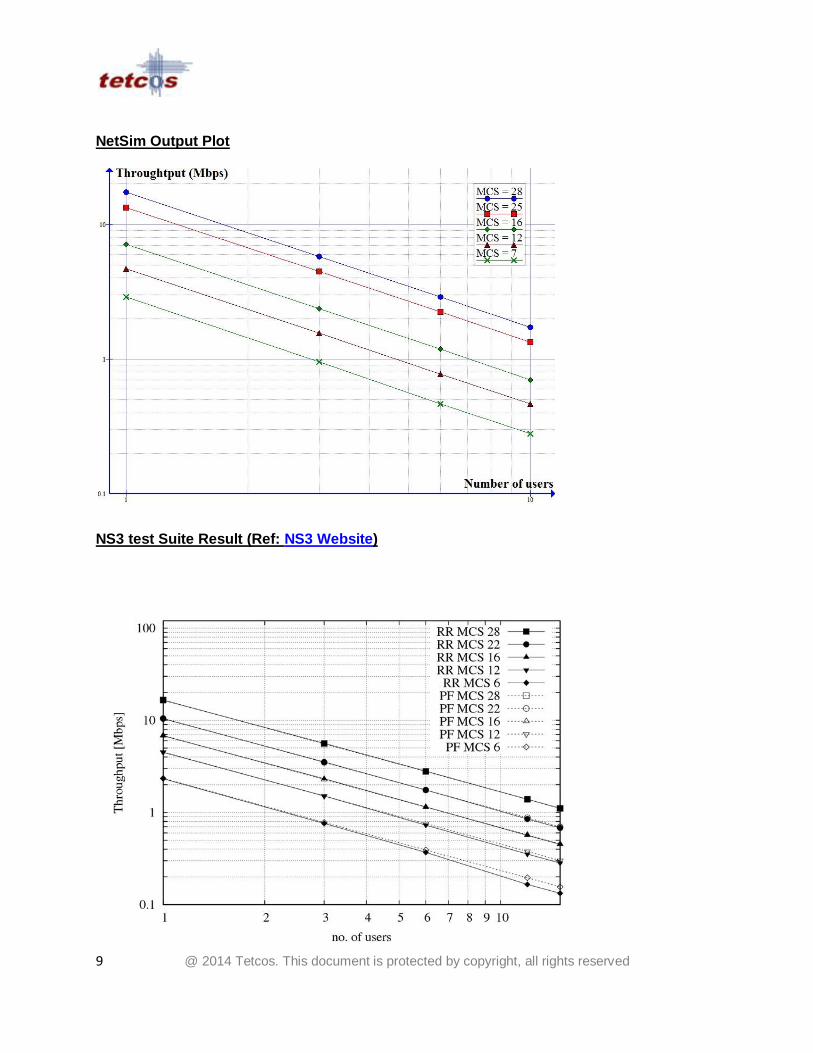
The test passes if the measured throughput matches with the reference throughput.
Results and verification:
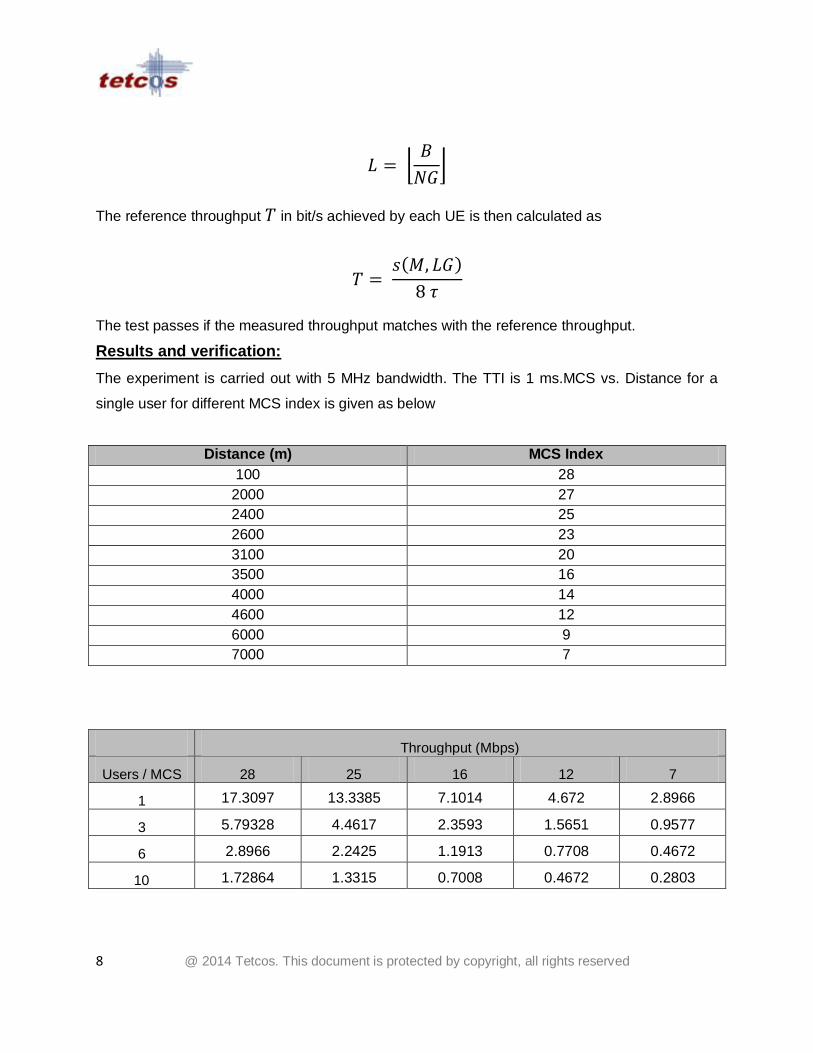
The experiment is carried out with 5 MHz bandwidth. The TTI is 1 ms.MCS vs. Distance for a
single user for different MCS index is given as below
Distance (m) MCS Index
100 28
2000 27
2400 25
2600 23
3100 20
3500 16
4000 14
4600 12
6000 9
7000 7
Throughput (Mbps)
Users / MCS 28 25 16 12 7
1 17.3097 13.3385 7.1014 4.672 2.8966
3 5.79328 4.4617 2.3593 1.5651 0.9577
6 2.8966 2.2425 1.1913 0.7708 0.4672
10 1.72864 1.3315 0.7008 0.4672 0.2803
9 @ 2014 Tetcos. This document is protected by copyright, all rights reserved
NetSim Output Plot
NS3 test Suite Result (Ref: NS3 Website)
10 @ 2014 Tetcos. This document is protected by copyright, all rights reserved
5.2 Proportional fair scheduling algorithm
Two scenarios have been considered to test the performance in terms of adaptive channel
conditions and to check its fairness perspective.
Scenario 1
In this scenario, all UEs are kept at a constant distance from the only eNBthat they are
connected to. Now the PF scheduling is used and throughput for different number of user at
different distance is recorded. The test consist of checking that obtained throughput
performance matcheswith expected throughput.
The PF should perform similar to round robin, since SNR for each of UE is same. Every user
should get an equal fraction of throughput which a single user should have achieved when using
all the resources.
Expected throughput𝑇for each user is given by
𝑇 = 𝑆(𝑀, 𝐵)
𝜏𝑁
Where 𝜏 is the TTI duration, 𝑀 is the MCS index, 𝐵is the number of blocks to be used, 𝑁is the
number of UEs and 𝑆(𝑀, 𝐵) is the TB size defined in TS 36.213.
Results and verification:
The result gives the same graph as obtained for Round Robin scheduling, which is correct since
each user have same radio bearer conditions.
Scenario 2:
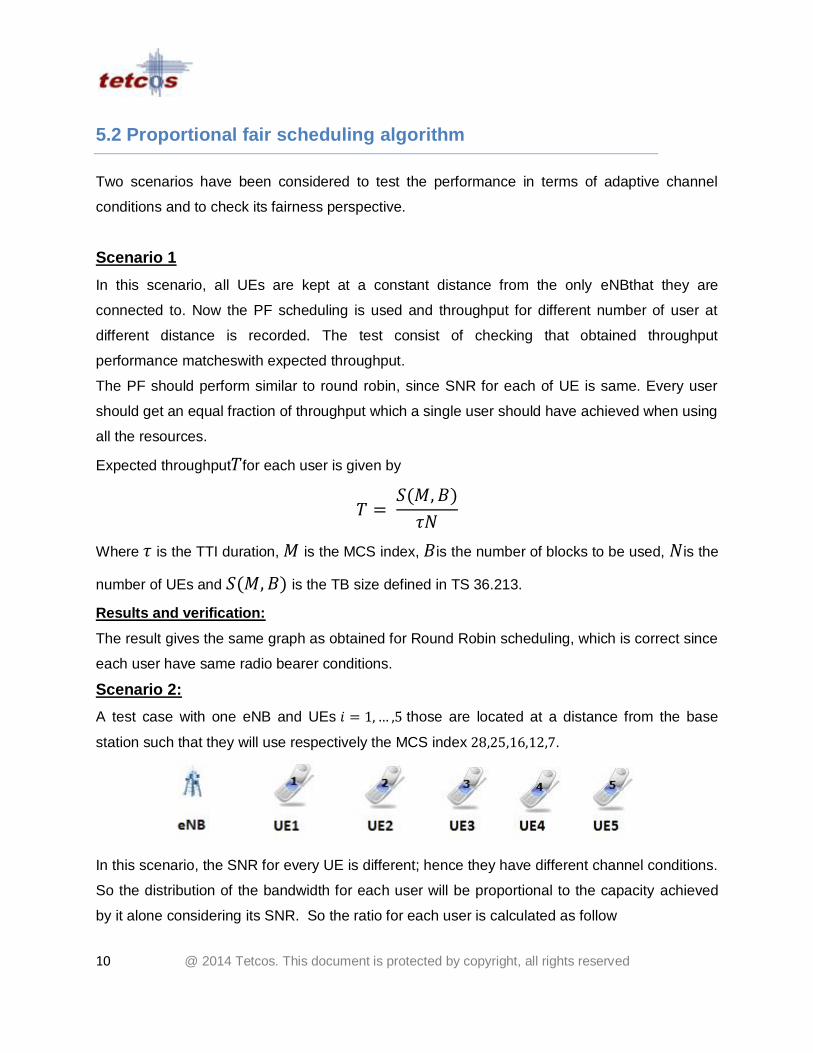
A test case with one eNB and UEs 𝑖 = 1, … ,5 those are located at a distance from the base
station such that they will use respectively the MCS index 28,25,16,12,7.
In this scenario, the SNR for every UE is different; hence they have different channel conditions.
So the distribution of the bandwidth for each user will be proportional to the capacity achieved
by it alone considering its SNR. So the ratio for each user is calculated as follow
11 @ 2014 Tetcos. This document is protected by copyright, all rights reserved
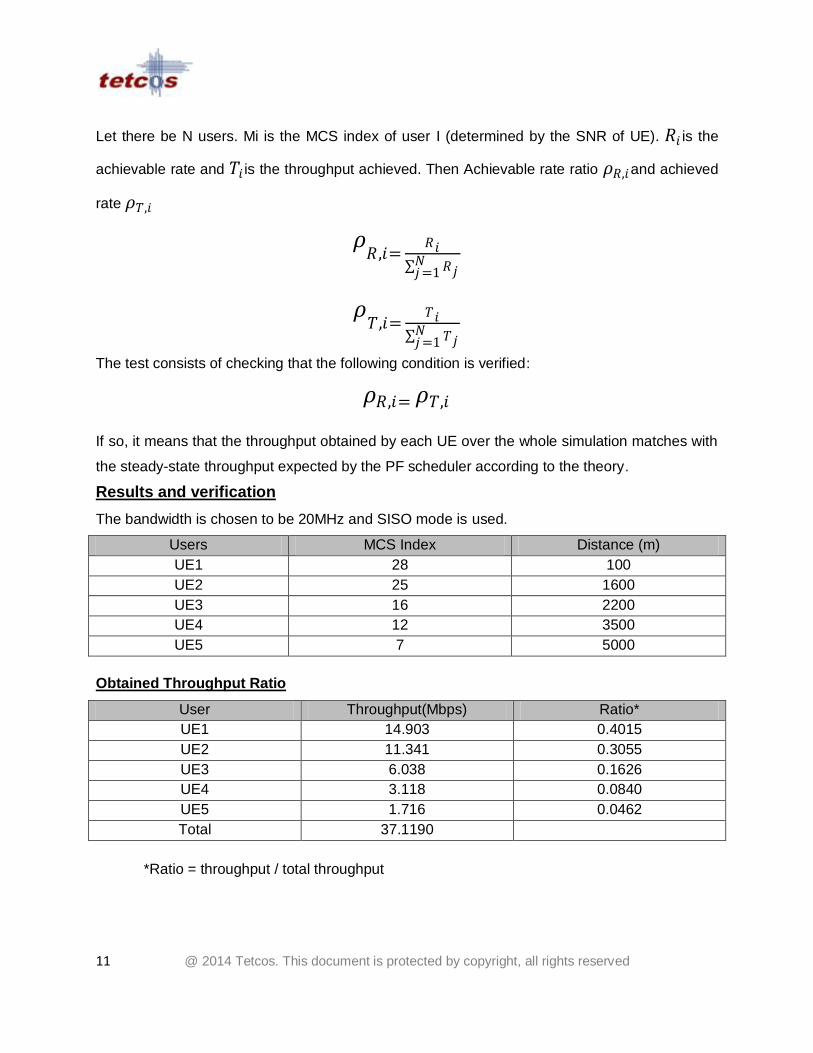
Let there be N users. Mi is the MCS index of user I (determined by the SNR of UE). 𝑅𝑖 is the
achievable rate and 𝑇𝑖 is the throughput achieved. Then Achievable rate ratio 𝜌𝑅,𝑖and achieved
rate 𝜌𝑇,𝑖
𝜌𝑅 ,𝑖=
𝑅𝑖
𝑅𝑗𝑁𝑗=1
𝜌𝑇,𝑖=
𝑇𝑖
𝑇𝑗𝑁𝑗=1
The test consists of checking that the following condition is verified:
𝜌𝑅,𝑖= 𝜌𝑇,𝑖
If so, it means that the throughput obtained by each UE over the whole simulation matches with
the steady-state throughput expected by the PF scheduler according to the theory.
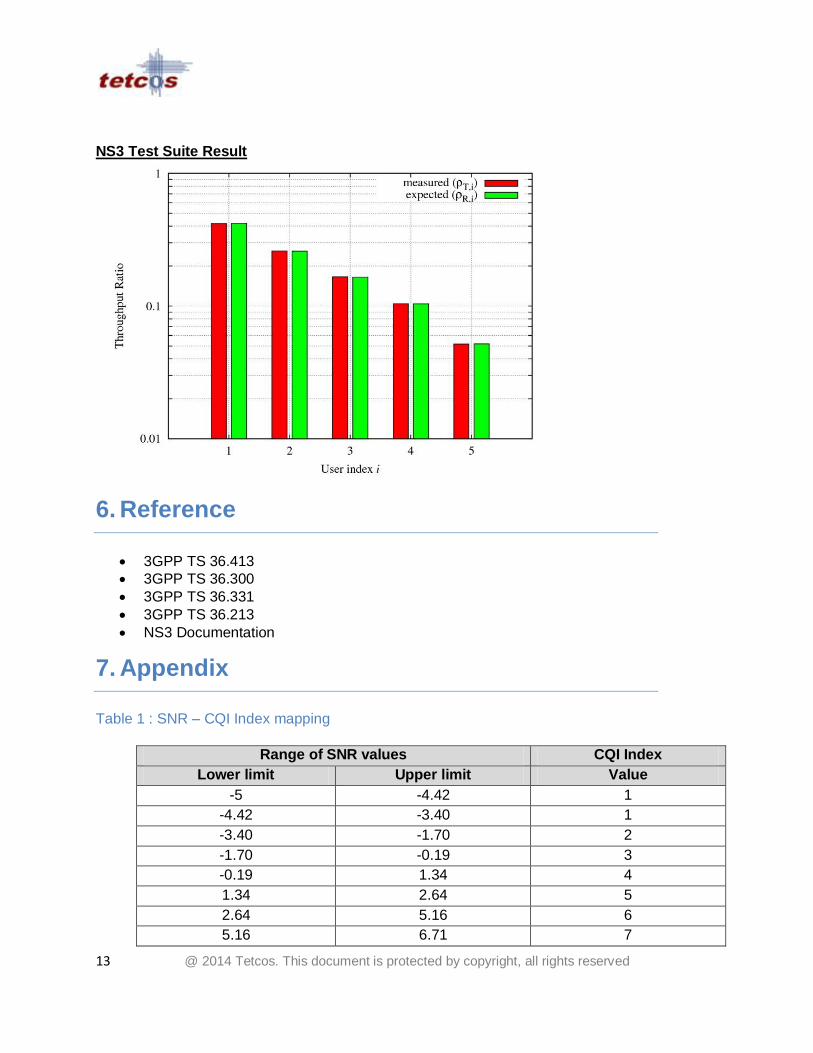
Results and verification
The bandwidth is chosen to be 20MHz and SISO mode is used.
Users MCS Index Distance (m)
UE1 28 100
UE2 25 1600
UE3 16 2200
UE4 12 3500
UE5 7 5000
Obtained Throughput Ratio
User Throughput(Mbps) Ratio*
UE1 14.903 0.4015
UE2 11.341 0.3055
UE3 6.038 0.1626
UE4 3.118 0.0840
UE5 1.716 0.0462
Total 37.1190
*Ratio = throughput / total throughput

12 @ 2014 Tetcos. This document is protected by copyright, all rights reserved
Expected Throughput Ratio
User Throughput (Mbps) Ratio*
UE1 74.4716 0.4013
UE2 56.648 0.3052
UE3 30.1928 0.1627
UE4 15.6278 0.0842
UE5 8.6315 0.0465
Total 185.5718
*Ratio = throughput / total throughput
NetSim Output Plot
13 @ 2014 Tetcos. This document is protected by copyright, all rights reserved
NS3 Test Suite Result
6. Reference
3GPP TS 36.413
3GPP TS 36.300
3GPP TS 36.331
3GPP TS 36.213
NS3 Documentation
7. Appendix
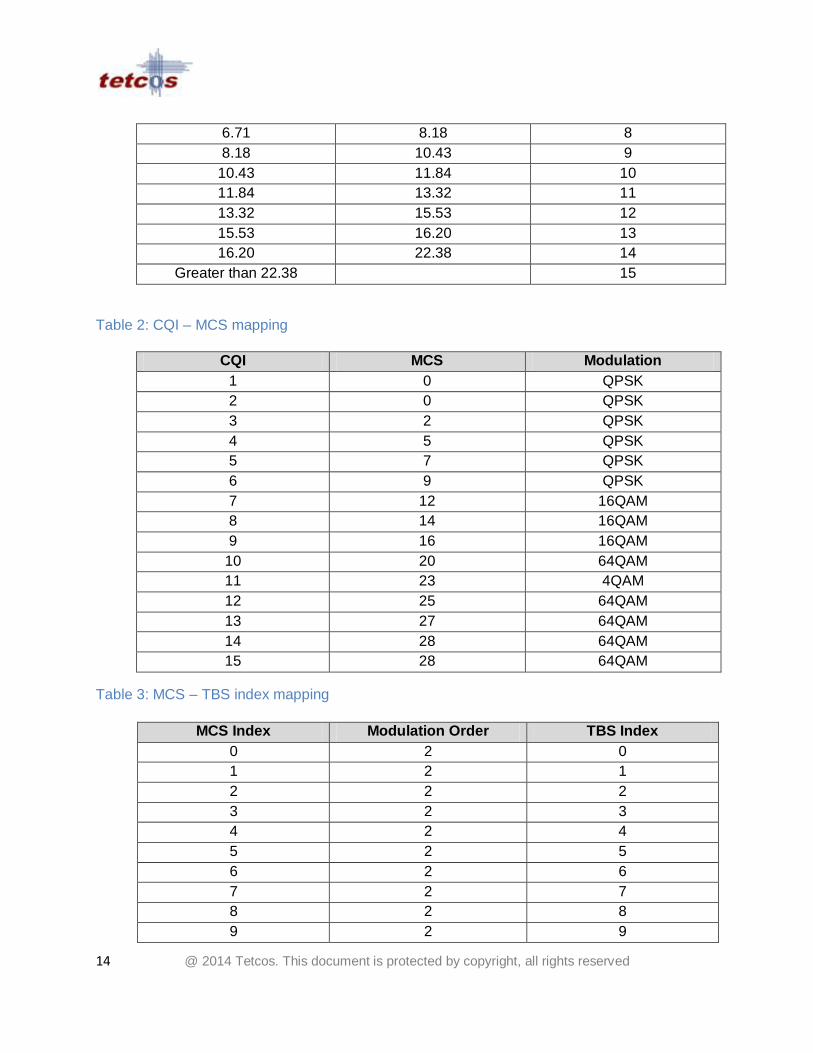
Table 1 : SNR – CQI Index mapping
Range of SNR values CQI Index
Lower limit Upper limit Value
-5 -4.42 1
-4.42 -3.40 1
-3.40 -1.70 2
-1.70 -0.19 3
-0.19 1.34 4
1.34 2.64 5
2.64 5.16 6
5.16 6.71 7
14 @ 2014 Tetcos. This document is protected by copyright, all rights reserved
6.71 8.18 8
8.18 10.43 9
10.43 11.84 10
11.84 13.32 11
13.32 15.53 12
15.53 16.20 13
16.20 22.38 14
Greater than 22.38 15
Table 2: CQI – MCS mapping
CQI MCS Modulation
1 0 QPSK
2 0 QPSK
3 2 QPSK
4 5 QPSK
5 7 QPSK
6 9 QPSK
7 12 16QAM
8 14 16QAM
9 16 16QAM
10 20 64QAM
11 23 4QAM
12 25 64QAM
13 27 64QAM
14 28 64QAM
15 28 64QAM
Table 3: MCS – TBS index mapping
MCS Index Modulation Order TBS Index
0 2 0
1 2 1
2 2 2
3 2 3
4 2 4
5 2 5
6 2 6
7 2 7
8 2 8
9 2 9
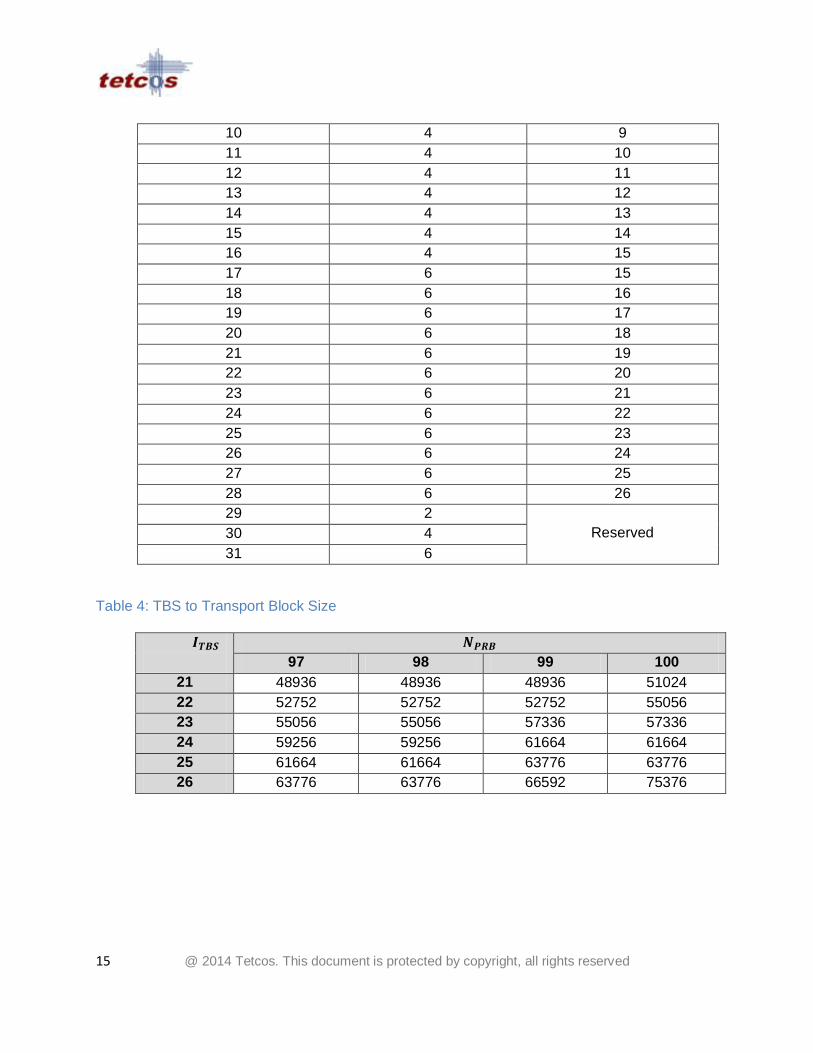
15 @ 2014 Tetcos. This document is protected by copyright, all rights reserved
10 4 9
11 4 10
12 4 11
13 4 12
14 4 13
15 4 14
16 4 15
17 6 15
18 6 16
19 6 17
20 6 18
21 6 19
22 6 20
23 6 21
24 6 22
25 6 23
26 6 24
27 6 25
28 6 26
29 2
Reserved 30 4
31 6
Table 4: TBS to Transport Block Size
𝑰𝑻𝑩𝑺
𝑵𝑷𝑹𝑩
97 98 99 100
21 48936 48936 48936 51024
22 52752 52752 52752 55056
23 55056 55056 57336 57336
24 59256 59256 61664 61664
25 61664 61664 63776 63776
26 63776 63776 66592 75376