Embed Size (px)
Citation preview

1
Logistical and handling solutions: Hydrogen Peroxide - The supply chain for the Norwegian fish farming industry
Master of Science Thesis in the Master Degree Programme, Supply Chain Management
VIKTOR ANDERSSON
RICKARD NILSSON
Department of Technology Management and Economics
Division of Logistics and Transportation
CHALMERS UNIVERSITY OF TECHNOLOGY
Göteborg, Sweden, 2011
Report No. E2011:016

2
Logistical and handling solution: Hydrogen Peroxide
The supply chain for the Norwegian fish farming industry
V. ANDERSSON
R. NILSSON
© V. ANDERSSON; R. NILSSON, 2011.
Technical report no E2011:016
Department of Technology Management and Economics
Chalmers University of Technology
SE-412 96 Göteborg
Sweden
Telephone + 46 (0)31-772 1000
Chalmers University of Technology
Göteborg, Sweden 2011

3
Logistical and handling solution: Hydrogen Peroxide
- The supply chain for the Norwegian fish farming industry
V. ANDERSSON
R. NILSSON
Department of Technology Management and Economics
Chalmers University of Technology
Abstract
In the beginning of 2010 Eka Chemicals entered a, for them, new market and started delivering hydrogen peroxide
to the Norwegian fish farming industry to be used as a de-lousing agent for the salmon lice problem. As Eka has
traditionally delivered the product to large fixed storage tanks in the pulp and paper industry, the logistics for fish
farms have been a complex matter. The method used to get an understanding of the current situation was mostly
qualitative interviews from the actors that are involved and internal sales figures from Eka Chemicals. The market
is growing rapidly and has a large seasonal variation, which is unprecedented at Eka, creating problems with
uneven flows and an overburdened supply chain.
From the investigation of the present situation, it was clear that the problems not only occurred at the transport or
the supply chain planning stage, but already in the order handling stage, where delays were common and caused
problems further down the chain. Hence a more formal order handling was proposed to make sure orders go
through the proper channels at the right time. This would lead to responsibilities being properly divided and
activities could be measured, preferably within the already existing SAP-system, in order to be improved. The
market is quite spread out presently and an area focus was suggested in order to establish the product and
method in this new segment and to show internally and externally that this is a business area for the future.
Keywords: supply chain, logistics, hydrogen peroxide, Norwegian fish farming industry, transport mode, environmental effects,
information structure, market analysis, seasonal variation, increasing volumes.

4
Table of Contents
1. Introduction .................................................................................................................................. 10
1.1. Background ............................................................................................................................ 11
1.1.1. AkzoNobel ...................................................................................................................... 11
1.1.2. Eka Chemicals ................................................................................................................. 11
1.1.3. Hydrogen Peroxide ......................................................................................................... 12
1.1.4. The fish farming industry ................................................................................................ 12
1.1.5. Customer location .......................................................................................................... 13
1.2. Purpose.................................................................................................................................. 14
1.3. Problem analysis .................................................................................................................... 15
1.4. Limitations ............................................................................................................................. 15
1.5. Outline ................................................................................................................................... 16
2. Frame of reference ........................................................................................................................ 18
2.1. Supply chain and networks ..................................................................................................... 18
2.2. Service level ........................................................................................................................... 19
2.3. Agile supply chain .................................................................................................................. 20
2.4. Seasonal variation .................................................................................................................. 20
2.5. Warehouses and storage ........................................................................................................ 21
2.6. Transportation in general ....................................................................................................... 21
2.6.1. Single wagon load ........................................................................................................... 22
2.7. Inter-organizational relationships ........................................................................................... 23
2.7.1. Network and control ...................................................................................................... 23
2.7.2. High- and low-involvement relationships ........................................................................ 24
2.7.3. Economic consequences ................................................................................................. 25
2.7.4. Structural power and balance ......................................................................................... 25
2.7.5. Trust ............................................................................................................................... 26
2.7.6. Evaluation ...................................................................................................................... 27
2.8. Porter’s five forces ................................................................................................................. 27
2.9. The marketing mix ................................................................................................................. 28
2.10. Sustainability ...................................................................................................................... 28
2.11. Green transportation ......................................................................................................... 29

5
2.11.1. Road transportation ....................................................................................................... 29
2.11.2. Railway transportation ................................................................................................... 31
2.12. Dangerous goods................................................................................................................ 31
3. Method ......................................................................................................................................... 33
3.1. Process .................................................................................................................................. 33
3.2. Methodological limitations and consequences ....................................................................... 34
3.3. Choice of research approach .................................................................................................. 34
3.4. Selections............................................................................................................................... 35
3.5. Collection of information ....................................................................................................... 35
3.5.1. Literature ....................................................................................................................... 35
3.5.2. Interviews ...................................................................................................................... 36
3.6. Reliability and validity ............................................................................................................ 36
4. Empirical findings .......................................................................................................................... 38
4.1. The different flows ................................................................................................................. 38
4.1.1. The actors ...................................................................................................................... 38
4.1.2. Ownership of the product............................................................................................... 38
4.1.3. The physical flow ............................................................................................................ 39
4.1.4. The monetary flow ......................................................................................................... 39
4.1.5. The information flow ...................................................................................................... 39
4.1.6. The order handling ......................................................................................................... 40
4.2. Relations within the Supply Chain .......................................................................................... 38
4.3. Internal specifics .................................................................................................................... 41
4.3.1. Production capabilities ................................................................................................... 42
4.3.2. Storage facilities ............................................................................................................. 42
4.3.3. Demand ......................................................................................................................... 43
4.3.4. Distribution channels ...................................................................................................... 44
4.3.5. Transportation costs ....................................................................................................... 45
4.4. Market situation .................................................................................................................... 41
4.4.1. The market size .............................................................................................................. 47
4.4.2. Five Forces ..................................................................................................................... 47
4.4.3. Expanding the market..................................................................................................... 50
4.5. Alternatives in transportation ................................................................................................ 50

6
4.5.1. Railway ........................................................................................................................... 51
4.5.2. Road transport by container ........................................................................................... 51
4.5.3. Road transport by tanker truck ....................................................................................... 52
4.5.4. Air freight ....................................................................................................................... 52
4.5.5. Sea freight ...................................................................................................................... 53
4.6. Current environmental work .................................................................................................. 53
4.7. Dangerous goods ................................................................................................................... 53
5. Analysis ......................................................................................................................................... 56
5.1. Market ................................................................................................................................... 56
5.1.1. Problem description ....................................................................................................... 56
5.1.2. Long term goals .............................................................................................................. 56
5.1.3. Proposed changes .......................................................................................................... 57
5.1.4. Potential savings............................................................................................................. 57
5.2. Relationships.......................................................................................................................... 59
5.2.1. Problem description ....................................................................................................... 60
5.2.2. Long term goals .............................................................................................................. 60
5.2.3. Proposed changes .......................................................................................................... 60
5.2.4. Potential savings............................................................................................................. 61
5.3. Information structure ............................................................................................................. 62
5.3.1. Problem description ....................................................................................................... 62
5.3.2. Long term goals .............................................................................................................. 62
5.3.3. Proposed changes .......................................................................................................... 62
5.3.4. Potential savings............................................................................................................. 63
5.4. Seasonal variation .................................................................................................................. 64
5.4.1. Problem description ....................................................................................................... 65
5.4.2. Long term goals .............................................................................................................. 65
5.4.3. Proposed changes .......................................................................................................... 66
5.4.4. Potential savings: ........................................................................................................... 67
5.5. Increasing volumes................................................................................................................. 68
5.5.1. Problem description ....................................................................................................... 68
5.5.2. Long term goals .............................................................................................................. 68
5.5.3. Proposed changes .......................................................................................................... 69

7
5.5.4. Potential savings: ........................................................................................................... 69
5.6. Transportation modes ............................................................................................................ 71
5.6.1. Problem description ....................................................................................................... 71
5.6.2. Long term goals .............................................................................................................. 71
5.6.3. Proposed changes .......................................................................................................... 72
5.6.4. Potential savings: ........................................................................................................... 72
5.7. Allocation ............................................................................................................................... 73
5.7.1. Problem description ....................................................................................................... 73
5.7.2. Long term goals .............................................................................................................. 73
5.7.3. Proposed changes .......................................................................................................... 74
5.7.4. Potential savings: ........................................................................................................... 74
5.8. Environmental aspects ........................................................................................................... 76
5.8.1. Problem description ....................................................................................................... 76
5.8.2. Long term goals .............................................................................................................. 77
5.8.3. Proposed changes .......................................................................................................... 77
5.8.4. Potential savings: ........................................................................................................... 77
6. Discussion ...................................................................................................................................... 79
6.1. Research Questions ................................................................................................................ 79
6.2. Further Research .................................................................................................................... 80
7. Recommendations ......................................................................................................................... 82
8. Bibliography .................................................................................................................................. 83
9. Appendices .................................................................................................................................... 88
9.1. Appendix A - Calculations for storage tank ............................................................................. 88
9.2. Appendix B - Investments for storage tank ............................................................................. 88

8
List of tables
Table 1, Production volumes, percentage of total volume produced. ..................................................... 42
Table 2, Average weights for transports during 2010. ............................................................................ 45
Table 3, Indexed freight cost (€ / ton-km). All based on Rjukan as production site. ................................ 46
Table 4, Different treatment methods against salmon lice (Nygaard, 2010). .......................................... 49
Table 5, Percentage of freight cost using container as primary transport, calculated per ton. ................ 59
Table 6, Contribution margin ratio using tank trucks as primary transport, calculated per ton. .............. 59
Table 7, Cost of outliers for freight during 2010. .................................................................................... 64
Table 8, Flattened demand and storage tank with increased volumes. ................................................... 68
Table 9, Modified average weights for transportation and savings for 2010. All numbers in tons unless
otherwise specified. .............................................................................................................................. 69
Table 10, Freight cost/ton Alby – Ottersøy. ............................................................................................ 73
Table 11, Allocation for 2010 volumes and potential savings with the same average weights. Note:
freight costs are the same for Alby and Rjukan to Herøy. ....................................................................... 75
Table 12, Summarized from the above table; savings for 2010 using proper allocation. ......................... 75
Table 13, Distances and emissions of CO2 in 2010. ................................................................................. 76
Table 14, Total CO2 emissions in 2010 and potential emissions if the allocation to Ottersøy would be
optimal. ................................................................................................................................................. 77
Table 15, CO2 emission if rail replaces Alby - Ottersøy with the optimal allocation in scenario 2. ........... 78
9
Figure 1, Map of production sites and customer location....................................................................... 14
Figure 2, The supply chain network. ...................................................................................................... 18
Figure 3, Customer Service. ................................................................................................................... 19
Figure 5, Single wagon load (Xrail, 2010). ............................................................................................... 22
Figure 4, Split point distribution system. ................................................................................................ 22
Figure 6, Costs vs. profits, low- and high-involvement relationships. ...................................................... 25
Figure 7, Porter's five forces model (Porter, 1980). ................................................................................ 28
Figure 8, Load and utilization factors in Germany based on ton-km. note: loaded trips do not include
empty return trip (den Boer, Brouwer, Schroten, & van Essen, 2009). ................................................... 30
Figure 9, Breakdown of external costs of HGV traffic in EU, numbers in billion Euros. Note: congestion is
a rough indication (den Boer, Brouwer, Schroten, & van Essen, 2009). .................................................. 31
Figure 10, Process flow of the thesis. ..................................................................................................... 33
Figure 11, The product information is at the core of the surrounding knowledge areas. ........................ 35
Figure 12, Physical and ownership flows. ............................................................................................... 38
Figure 13, The information flow involving all actors and the specific order of the monetary flow. .......... 39
Figure 14, The order chain of hydrogen peroxide from user to producer. .............................................. 40
Figure 15, Differences in demand for 2010 and the forecasted values for 2011, indexed by highest
volume. ................................................................................................................................................. 43
Figure 16, Forecast by Eka to fish farming industry, 2011, indexed by highest volume. .......................... 44
Figure 17, Transportation cost of total revenue for each delivery harbor, 2010. .................................... 45
Figure 18, Volumes for each harbor, indexed by largest volume, 2010. .................................................. 46
Figure 19, Sale in tons of Atlantic salmon from Norway 1999-2009. ....................................................... 47
Figure 20, Suggested ordering flow. ....................................................................................................... 63
Figure 21, Modified demand and leveled transports. ............................................................................. 67
Figure 22, Transportation benefits per mode. ........................................................................................ 71

10
1. Introduction The introduction chapter gives a general description and overview of the product and what the logistical
concerns involved are, in order to fully understand the situation as well as the outcome of the thesis. It
includes background information followed by the purpose of the thesis, problem analysis, the set
limitations and an explanation of the outline in this report.
Hydrogen Peroxide (HP) is most commonly known as a bleacher in the chemical industry as well as the
pulp and paper industry but its scope of use extend to other industries as well. As the large pulp and
paper industry has matured and the competition has lowered the profit margins in this area, Eka
Chemicals (Eka) is looking to extend their special applications sales. They have been instrumental when
it comes to developing markets in the past and adapting their products for the set task which is one of
the major reasons Eka has become the company that they are today. Eka sees this as future possibilities
and even has innovation as a core value, many times working together with their customers, developing
the processes to enhance both sides.
One of the interesting areas is the Norwegian fish farming industry where salmon lice are a big problem,
causing a damaged or deceased salmon, costing the industry large amounts. The Norwegian market for
hydrogen peroxide, used for de-lousing the salmons, is growing at a rapid pace which started with the
first delivery in 2010, providing the supply chain with large structural challenges. Complicating the
matter even further is currently a large seasonal variation since the delousing is only performed twice a
year and a forecast that predicts a doubling of sales in 2011. The variations are not large compared to
Eka’s total production but for this market alone it is definitely a factor to consider.
There are alternative methods for de-lousing salmon but their effectiveness has dropped due to the lice
developing resistance towards them. The use of HP is only one of the available methods on the market,
but has proven to be very effective, although difficult to use due to the large amounts that require extra
handling. HP is Eka’s only product on the market and they are focusing the development on more
efficient ways of using the product rather than new products to solve the problem with salmon lice.
The supply chain is complex compared to how Eka usually deals with their customers, where the
common method is to deliver large amounts in bulk directly to the customer. The customers often own
a storage tank that is monitored and kept at specific levels by Eka and the hauler, which is shipped by
full truck loads straight from Eka’s production sites to the end customer, usually large actors in pulp and
paper as previously mentioned.
In the case of the HP sent to fish farms, Eka is collaborating with a distributor in Norway who handles
customer relations and brings the medical knowledge of distributing pharmaceutical products in
Norway. This is due to HP being considered a pharmaceutical product in the de-lousing operations unlike
when used in other operations. The hauler involved in the supply chain is the sole hauler used by Eka for
all regular transportations to and from Norway. The distributor and the hauler are not mentioned by
name in this report due to secrecy agreements.

11
Currently the supply chain is suffering from many late orders causing disruptions to long term planning
and problems with destinations being mobile when required to meet a ship coming to a certain harbor
causing delays and difficulties. Further problems include expensive or lack of storage close to customers,
the seasonal variation and the increasing volumes, which all can contribute to it being difficult to get
enough of the product to the customers at the right time for it to be satisfactory.
The task is to evaluate the current logistical solution and also present alternatives that are of interest to
Eka Chemicals and their closest collaborators. This must also solve the structural problems such as
alternative transportation modes, restrictions regarding the laws of each country and also the different
actors within the supply chain.
1.1. Background
1.1.1. AkzoNobel
AkzoNobel, a global fortune 500 company, is present all over the world with more than 55 thousand
employees in over 80 countries but the headquarter is located in Amsterdam since this is where
AkzoNobel is originally from. They are the largest global paints and coating company in the world, with a
yearly turnover of almost €14 billion, and are in the top regarding specialty chemicals, which is where
hydrogen peroxide is included.
Along with their large environmental and sustainable focus they also value entrepreneurial thinking as
well as a customer focus. They are currently top three in Dow Jones Sustainability Index and
sustainability is clearly a core value. (AkzoNobel, 2011a)
AkzoNobel has an extensive environmental work and has, for example, set goals of reducing their
cradle-to-gate carbon footprint per metric ton of product by 10% in 2015 and by 25% in 2020, both
compared to the emissions in 2009. (AkzoNobel, 2011b) The sustainability process is, according to
AkzoNobel (2011c), firmly and fully integrated in the regular business processes and strategies.
Sustainability is clearly a focal subject for AkzoNobel and is “at the heart of everything we do”
(AkzoNobel, 2011c).
1.1.2. Eka Chemicals
Eka Chemicals is a Business Unit within AkzoNobel situated globally around the world. Their main focus
is the customers within the pulp and paper and chemical industry divided into three regions, Europe,
Americas and Asia-Pacific. (AkzoNobel, 2011d) Besides their products for these industries they also offer
specialty chemicals for water treatments and packing materials, for example. (AkzoNobel, 2011e)
As expected, Eka shares the goals and strategies of AkzoNobel but also focus on their own visions such
as growing through innovation as well as developing related businesses. Here, sustainability can also be
found as one of the cornerstones of the company and has been for many years, illustraded by their goal
of making their eco-premium products at least 50% of their total sales by 2012 (AkzoNobel, 2011f). Eka
was founded in 1895 in Bengtsfors by Alfred Nobel and started producing hydrogen peroxide 1930 due
to economies of scope from the chlorine production already in progress. (AkzoNobel, 2011a)

12
1.1.3. Hydrogen Peroxide
Hydrogen peroxide was first produced as a technically usable product in the beginning of the 20th
century. (Eka Chemicals, 1997) It has a sharp smell and is a colorless liquid soluble in water and in ethe.
(Swedish Chemicals Agency, 2010) Since oxygen is willingly emitted by HP, the substance is a very
effective oxidant. This process can be accelerated by factors such as metals, metallic salts, alkali and
heat.
1.1.3.1. Producing
Eka Chemicals produces HP at several locations such as Alby and Bohus in Sweden, Rjukan in Norway as
well as in the US and Venezuela. HP is delivered and sold after being stabilized with water and small
doses of substances giving it a certain degree of tolerance towards unintentional contamination. The
final concentration of hydrogen peroxide is then roughly 35, 50 or 70 per cent where weight per cent is
always used.
The process is very energy consuming but the largest cost related to producing hydrogen peroxide is the
raw material used. Natural gas is bought in order to produce the hydrogen gas at the Bohus site.
(Staberg, 2011) The main difference between the production locations is the production cost, due to
sites using different production solutions regarding electricity and hydrogen gas.
1.1.3.2. Transportation and handling
The transportation and handling of HP is heavily regulated through laws and classifications applicable on
the means of transportation. For example air freight of hydrogen peroxide is only allowed for
compounds up to 40 weight per cent. (Eka Chemicals, 1997) During transport, the HP should be
packaged in containers with vented caps, otherwise there is a risk of the container bursting. (Hydrogen-
Peroxide.co.uk, 2010)
The HP can be transported in different vessels, such as containers, tanker trucks or tank wagons which
can hold as much as 27-29, 34 and 68 tons respectively (Rahmquist, 2011a). The majority of the
transportations involve ISO-containers which is a standard unit for containers but it becomes a
limitation as they can only hold between 27 and 29 tons of HP. Containers can be used both on truck but
also on railway and they are flexible since they can be used as storage but associated with high costs. HP
is primarily transported and sold in concentrations of 49.5 % due to classifications for transport
regulations – concentrations greater than this are subject to more stringent and costly regulatory
requirements. No other concentrations will be considered here. All figures concerning HP will be with
the transportation concentration in mind, so numbers can be compared more easily.
1.1.4. The fish farming industry
Norway is a very large producer of salmon, amounting to one million tons every year which makes this
one of the main industries in Norway, only exceeded by China in fish export globally (Workman, 2007).
The salmon are grown in large net enclosures along the Norwegian coast until fully grown (Hartmann,
2010). It takes around 16 months for a salmon to grow to a reasonable size for slaughter
(representative-distributor, 2010). The enclosures are up to 160 meters in circumference and can
contain 200,000 salmons (Larsson, 2011).

13
When the salmon lives in the wild, it is naturally infected by parasites, salmon lice for example.
However, when the salmon is grown in enclosures this parasite reaches unhealthy proportions and can
eat through the skin of the salmon, exposing the flesh to the salt water. This leads to a damaged product
or even to the death of the salmon. Up until recently this has been treated with a biological pesticide
but the lice have grown resistant to this treatment so the growers had to once again turn to the use of
hydrogen peroxide. This was used as early as the beginning of the 1990s but replaced by the cheaper
and more manageable biological pesticide which required much smaller quantities for the same result.
(Dalin, 2011)
Going back to 1989-90, scientists within Eka Chemicals believed that hydrogen peroxide could be used
to help the Norwegian fish industry with their parasite problem, so they contacted an institute in
Norway and sponsored research to be done within this field. As Eka were the owners of this research,
they could claim the patent rights to the process which was developed to remove the lice from salmon.
(Hartmann, 2010) (Larsson, 2011) The patent has since expired, but Eka Chemicals has once again
become a large actor in this sector. The process is quite simple in theory when performed in a controlled
environment, but becomes more complex when it has to be performed on site at the different salmon
net enclosures. The idea is to keep the fish in a crowded container of some sort, add hydrogen peroxide
to receive the correct concentration for the correct amount of time, and then replace it with water to
rinse off the salmon. (Hartmann, 2010) One treatment can be used for 150 tons of salmon and takes
around 30 minutes (representative-distributor, 2010).
The use of hydrogen peroxide on fish is a prescription drug which needs a veterinarian’s approval to
decide the levels and dosage, before administered, although the veterinarian does not need to be
present (representative-distributor, 2010).
1.1.5. Customer location
To get a better understanding of the production in Eka and its customers, a map (Figure 1) is provided of
the three production sites and the six sites which Eka plan to deliver to during 2011, according to their
forecast. The three production sites are as mentioned earlier, starting in the north with the house
markers; Alby, Rjukan and Bohus. The customers are symbolized with a fishing marker and again starting
from the north; Bodø, Ottersøy, Namsos, Frøya, Fosnavåg and Bergen. The percentage number next to
the location name represents percentage of total forecasted sales for 2011. This is to give an idea of
where the customers are located and where the majority of the product needs to be delivered.

14
1.2. Purpose
The purpose of the thesis is to describe the current supply chain regarding hydrogen peroxide within the
fish farming industry and to also describe the advantages and disadvantages of the same. The thesis will
also identify potential improvements regarding the transportation and handling solutions in order to
achieve the best possible outcome for Eka. This will include an overview of the current actors involved in
the supply chain and the most suitable level of collaboration.
The thesis objectives are to evaluate the suitability of the current solution which is dependent on two
countries separate regulations such as road transportation and the transportation of dangerous goods,
just to mention a few. The cost of handling, storage and transportation will be estimated and compared
between various alternatives as accurately as possible. Finally, the environmental impacts will be
assessed generally in order to see the differences and risks that relate to the transports.
Even if the thesis is carried out with Eka’s best interest at hand, a solution that satisfies all current actors
in the supply chain is preferred to encourage future cooperation. The problems that require
consideration include determining which factory to source from, what transportation mode should be
used and how to overcome the geographical problems in Norway. A solution for how to solve storage is
also a key issue for the supply chain.
Figure 1, Map of production sites and customer location.

15
The following research questions will be answered to fulfill the purpose of the thesis:
- How is the current supply chain structured and what advantages/disadvantages does it bring?
- What modes of transportation are suitable for delivering the hydrogen peroxide to the coastline
of Norway?
- Are there any possible solutions regarding the storing of the product closer to the customer?
- How is the product allocated from the different factories? Is this a factor to improve?
- What does the optimal supply chain look like and why is this solution the most suitable?
1.3. Problem analysis
When producing a commodity product in a mature market, it is always important to cut costs wherever
possible along the supply chain to stay competitive. In this case it is still a commodity product but in a
brand new market, with a large growth potential where it may be worth doing investments to ensure
customer satisfaction and service level. The three biggest costs in this equation will be the freight cost,
the container lease cost and capital for possible investments. These will have to be weighed against the
possibility of securing future market shares and the uncertainties of a new market.
The two main problems that differ compared to other markets for the same product are the seasonal
variation and the fast growing market. The newly sprung market also has some consistency problems
with delivery locations and delivery times due to limiting factors from the customer side. To get an
understanding of the market, the actors and the relationships between these, an introductory analysis
of the market has to be conducted which take into account the owner structures.
The logistical solutions such as transport modes as well as cost efficient transports are key issues as well
as the overall supply chain structure. Last, but not least the environmental and sustainability aspects of
each alternative will be considered to ensure they coincide with the goals Eka and AkzoNobel have set
for their operations.
1.4. Limitations
In the report, there have been several limitations imposed in order to present a plausible
recommendation. These limitations have been selected with respect to the changes and risks inflicted
on the final report. There have also been selections with respect to standard procedures within the
industry as well as some reasonable logic and findings that are considered general within the industry.
One limitation that has been made is regarding the potential and existing market. The report has only
analyzed the existing Norwegian fish farming market, especially salmon. In order to consider other fish
farming markets, it would require large knowledge regarding the possible problems and solutions to the
specific markets and it is therefore a complete new set of problems if it would become an actual
possibility. Also, regarding other nationalities as a market would require a much deeper understanding
of both the market development as a whole and also the strategic possibilities and interests of Eka
Chemicals.

16
Throughout the report, the calculations are based on HP in concentrations of 49.5 % which is the final
product that is sold to the customers. Also, future or present production capabilities and limitations
thereof have not been focus of the report.
There have been some limitations regarding the fact that it is a product classified as dangerous goods.
One could go in much more in this complex situation and explore all the different options in this matter.
However, it was assumed in this study that the current way of handling and transporting the dangerous
goods is satisfactory and therefore not a variable when looking at the different alternatives. Eka both
produces and sells different concentrations of hydrogen peroxide as well as other products. These are of
no concern to the report and will not be of interest to the outcome.
The environmental impacts of this product and its supply chain can be divided in three parts, the first
being the external effects of the transportation. This will be considered and used as a deciding point for
the final recommendation. The possibility of accidents occurring during transport and contaminating the
environment is estimated to be roughly the same for tank trucks and containers on trucks; hence this
potential impact will be disregarded. Finally the usage of the product and the long term effects on the
sea will be left to the appropriate experts who are already involved in this project, contracted by the
distributor.
The report only deals with market changes and competitors from a general point of view. It is not the
intention to analyze the other actors and their supply chain in the same way as Eka and its supply chain.
This is due to the wish and preference of Eka as well as the fact that this would greatly exceed the time
span for this thesis.
The handling costs of every specific alternative and transport mode will not be measured and calculated.
In many cases, an estimate will be used along with common practice as well as information from Eka.
This will still affect the total outcome in the right direction but for more exact numbers, calculations and
measures should be made.
The forecast and expected sales numbers were provided to us by Eka. It is not our intention to review
the forecasting process of Eka and therefore these numbers are the primary basis of our evaluations in
this report along with other information and aspects found.
Another limitation is the decay of the product. Hydrogen peroxide has a decay of about one per cent per
year at room temperature. This will not be accounted for due to directions from Eka and it is not
plausible that it would change the final outcome since there are several other unsecure variables that
could result in a bigger possible difference.
1.5. Outline
The abstract provides an overview summary of the thesis in order to quickly get the answers one might
be looking for. It briefly describes the problem, the work carried out, and brings forward the final
recommendation.

17
The current chapter, the introduction, describes the focal company along with background information
regarding hydrogen peroxide and the fish farming market. It also puts the problems in the right context
and describes the purpose.
The frame of reference is there in order to help understand the concepts as well as the different models
and theories used. It is, as stated, a reference which the thesis analysis work relates to. It also described
the sustainability aspects of transportation from which the environmental aspects in the report derives.
The method chapter presents the structure of the work together with how the process was carried out.
The structures of the interviews as well as the collection of information are key areas presented in this
section.
After the process and the background information have been described, the empirical findings are
presented. This section describes the information found and processed through the models and theories
explained earlier. In order to better understand the full picture there are also more in-depth
descriptions of the situation as the authors see it with support from the frame of references. It also
contains the possibilities and constraints of the different transport modes.
The report then moves on to the analysis which discusses the main problem areas addressed, starting
with the more general areas and progressing to more specific areas. This chapter also includes the
proposed changes as well as potential savings estimated in order to give a good overview of the full
potential.
The discussion chapter states and summarizes the outcome of the analysis and also presents the main
recommendations resulting from the thesis work. The connections and links to the problem areas are
briefly explained and discussed. The last chapter presents the final recommendations and states which
aspects that are important to consider when going further with the recommended changes.
18
2. Frame of reference In this section the theory and the models that are used throughout the thesis are described. These are
the tools for the analysis performed later in the thesis. With models such as Porter’s five forces the
further work can be related to a reference and is therefore easier to combine with the information
provided or found. Through the theory of inter-organizational relationships the situation which Eka is in
can be explained better and thereby make more use of the results. Obviously, the environmental aspects
are part of the chapter in order to understand the theory behind the effects.
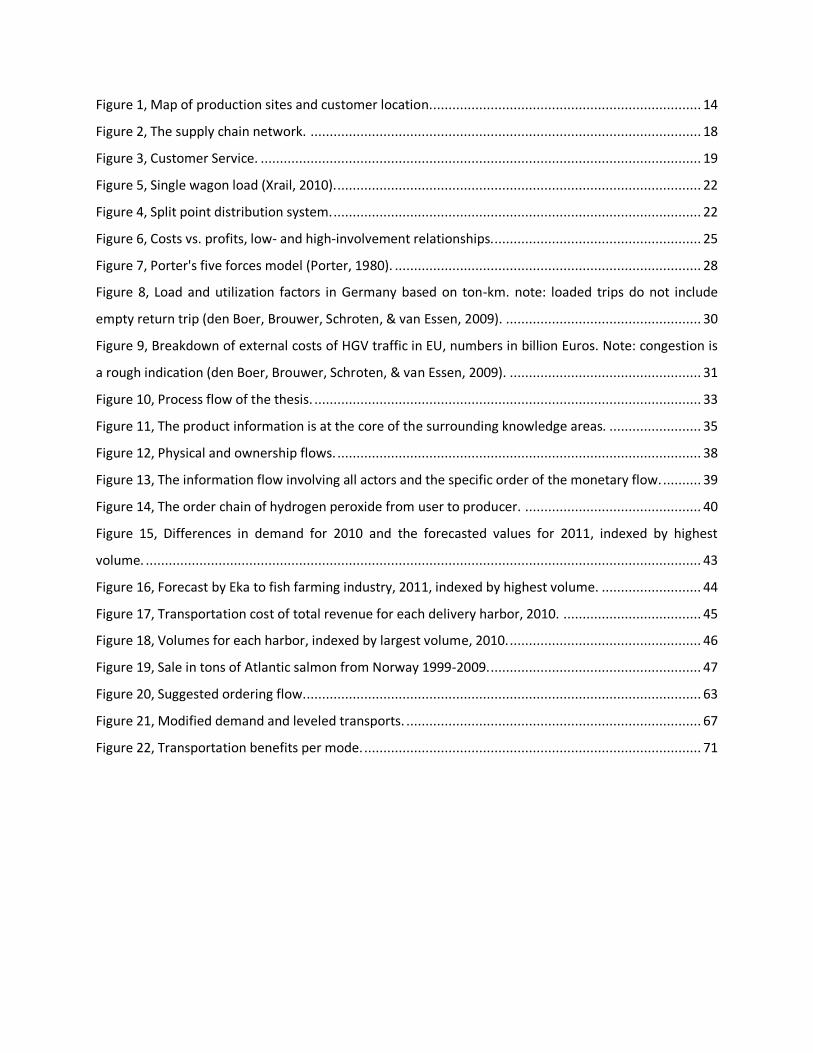
2.1. Supply chain and networks
The term supply chain is traditionally defined as the supply of and to the consumer, from first supplier to
the final customer (Lumsden, 2007). The supply chain consists of tiers of suppliers that are linked to the
focal company and its customer tiers, representing both the inbound and the outbound logistics
(Harrison & van Hoek, 2002). The supply chain can be used both in a business-to-business (B2B) and
business-to-consumer (B2C) environment and can be viewed as products going downstream or money
flowing upstream (Figure 2). Harrison and van Hoek (2002) propose that it is possible to compete with
logistics through meeting the end customer’s demand by supplying what is needed in the right form,
when it is needed, at a competitive cost.
Traditionally it was the flow of material that was seen as the primary flow of logistics. It consists of large
values which has a direct effect on the environment and requires large resources to perform (Jonsson &
Mattsson, 2005). It is primarily raw material and resources that go downstream and the majority of
upstream goods are returns and recycling. Jonsson and Mattsson (2005) points out that the information
flow consists of customer demand, available capacity, utilization and available material within the own
company as well as ones suppliers capacity. Most commonly, some kind of shared IT system, such as an
ERP-system, is used to track this in real time. The monetary flow is initiated by an invoice or other
predetermined mechanism and flows in the opposite direction of the material flow.
2nd tier
supplier
1st tier
supplier
Focal company Customers
Flow of products
Flow of information
Monetary flow
Figure 2, The supply chain network.

19
Being part of a network can bring many benefits but it does require some additional considerations
when making decisions. The decision made by the focal company will not only affect them, but every
actor in the network, perhaps in different ways, making it a complex and multidimensional task to know
the exact consequences of a decision (Gadde & Håkansson, 2001). To achieve benefits across the board,
one must think and plan in network terms. It may be necessary to explore the network boundaries to
develop the thinking and to formulate new strategies.
2.2. Service level
Harrison and van Hoek (2002) describe the quality of supply chain as the service level the customer is
provided with. This can be dependent on unavailable product, defects and how fast they are solved and
late deliveries. The service level can also consist of the focal company providing the customer with
technical know-how and education, which can lead to customer service enhancement by exceeding
customer expectations. A more practical approach to service level is given by Jonsson and Mattsson
(2005) who base it on how well the focal company can adapt to a changed customer request on a
current order. This can include changing the time of delivery, change in quantity or even destination of
delivery. There is a distinction between the focal company’s ability to meet changes in demand before
the order is received and during order, meaning the time from order to delivery. As Figure 3 shows,
customer service is based on three aspects; delivery service, information exchange and logistical services
(Jonsson & Mattsson, 2005). Information exchange is beneficial for everyone concerned as it can
decrease the delivery uncertainties, something that can be very costly.
Figure 3, Customer Service.
To achieve a desired service level it is important to be aware of what the customer actually values and
that should serve as the basis for customer service priorities (Harrison & van Hoek, 2002). These factors
should be visible to every actor in the network to facilitate the progress of the performance. Robust,
dependable processes are desired both from an external perspective as well as an internal one to be
able to trust the process and reduce costs by eliminating errors. This can give a flexibility advantage as
the processes capabilities are known and less adjustments are needed in time restricted situations.
(Harrison & van Hoek, 2002)

20
2.3. Agile supply chain
An agile supply chain is a gathering of flexible processes that can adapt to turbulent markets rapidly
while at the same time manage low volume products, according to Harrison and van Hoek (2002). This
requires a focus of customers and their needs and staying up to date with these, ready to meet any
change that may come. The suppliers included in the process are an important part of achieving high
customer satisfaction as it is not one actor alone capable of this, every trading partner becomes a vital
link. Agility is not about short lead times (even if it can be beneficial to achieve the primary goal) nor
offering the same service with less resources but actually the ability to respond to changes in demand.
(Power, Sohal, & Rahman, 2001)
Supply chain agility is a network’s ability to consistently identify and engage in business opportunities
before ones rivals. This can be facilitated by well functioning relationships within the supply chain to
keep a high level of customer satisfaction (Li, 2009). Christopher (2000) defines agility as business-wide
capability that embraces not only organizational structures but also information systems, logistics
processes and, perhaps most importantly, the mindsets of everyone involved. The key word throughout
the supply chain must be flexibility.
2.4. Seasonal variation
This means that the product has a distorted demand over the course of a year. The product can for
example be more popular during the summer months, such as ice cream and garden furniture, for
obvious reasons. The sale of toys will instead go up before Christmas and high fashion has two main
seasons and two shorter ones, where each may only last for a couple of weeks. In extension this means
that it will be hard to level one’s production as demand is all over the place. (Harrison & van Hoek, 2002)
There are two main ways of counteracting seasonality, which will depend on the product and the
market. A chase production approach can be used to satisfy increased demand during shorter periods of
time. This will be done by implementing extra shifts, paying for overtime or, perhaps as a last resort,
employing a hire/fire policy to keep only the personnel needed. This is mostly adaptable in an industry
with high manual labor or a production site with demand on personnel being present. An automated
process with very high fixed costs would not be able to implement this. For this kind of operation a
leveled production approach might be the better choice, where the production is stabilized and
continuous during the year, building up a finished goods inventory in anticipation for the increased
demand. (Inman, 2011)
Another way of evening out the demand is to influence the customer to buy when it is more beneficial
for the producing company. This is most commonly done by having a pricing strategy that can push
some of the demand from the peak towards the dips. (Lumsden, 2009) For this to work a comparison
between the costs of carrying the finished goods inventory versus the loss of revenue from a lower price
must be done.

21
2.5. Warehouses and storage
To be able to provide a customer with a desired service level, it may be necessary to provide storage
closer to he customer, which can be done in several ways. Common approaches are centralized or de-
centralized warehouses or distribution centers. Centralized inventory is advantageous in terms of
inventory-holding costs and require less total inventory for the same level of safety stock. This is
important for high-value goods where there is a need to keep inventories to a minimum but it will also
make it increasingly complex to respond to local market opportunities. De-centralized warehouses bring
a greater risk of product obsolescence and higher inventory holding costs, but in return offers increased
flexibility and a lowered transport cost. (Harrison & van Hoek, 2002)
Storage costs exist in most manufacturing companies and come from finished goods stocks, waiting for
transportation, distribution stock and usually ending up in a material stock at the customer (Jonsson &
Mattsson, 2005). Stocks can be used to balance peaks in demand across regional markets and central
warehouses are usually relevant when inventory costs are more important than the distribution costs
(Harrison & van Hoek, 2002). This applies for products which have a high cost per volume unit, usually
not a bulk product as distribution costs have a marginal impact on logistical costs per product, when
considering the transport costs as based on volume and weight. An exception applies to products which
require special attention during transport, such as art (fragile), confidential documents (security) or
dangerous goods, which all might have a different operating environment. (Harrison & van Hoek, 2002)
2.6. Transportation in general
The transportation industry has had a steady increase due to three factors: innovations in transport
technology, commoditization of transport (primarily due to container ships) and the oversupply of
available transport. This has meant physical distances are less of an issue, even for bulk transportation,
meaning it is possible to stay competitive with competitors on far away markets. (Harrison & van Hoek,
2002)
There are many types of distribution available; most of them focusing on utilization and truck fill rates.
One of these is the hub distribution, sometimes referred to as hub and spoke, which gives a high
utilization of the resources used together with frequent transports and high flexibility. It does, however,
also bring long lead times due to waiting for goods to be consolidated and increased handling of the
goods. For it to be truly efficient, a functioning goods tracking system is required. (Lumsden, 2007)
The split point distribution system (Figure 4) is dependent on weight and volume, working with unit
loads final destination points being close to the split point. The flow of goods can be uneven to the split
point if large shipments are sent periodically but will be cost and transport efficient. It may require less
handling but even if the distribution is somewhat direct, the large quantities lower the average lead
time. The most efficient way of transport is using direct relations between two actors and having full
truck loads to occupy the distance. (Lumsden, 2007)

22
Lumsden (2009) presents four types of cost
associated with optimal carrier size. First off is
the direct line and supply cost which is linked to
each vehicle used and its fixed costs. Using
terminals will increase the cost as a larger carrier
requires more time and resources to consolidate
and organize larger loads. The third cost is the
time spent on the road and in warehouses and
increases the cost of tied up capital. Finally and
perhaps most importantly, is the cost of external
effects that will dramatically decrease when
carrier size increases. This is simply because
fewer trucks, trains and vessels are necessary to
perform the same amount of work.
Being a transport provider, or even a buyer, means dealing with a special service as it cannot be stored
and it is very much dependent on time and location benefits. Goods are worth more at a certain
location, delivered at the right time providing value for the society by three factors: service, technique
and economy. (Lumsden, 2009)
2.6.1. Single wagon load
The single wagon load is the railways equivalent of road transportations hub and spoke system. As
Figure 5 shows, this system is capable of consolidating wagons from different sources to one large train,
dropping them off at specified locations and adding new wagons before arriving at the end destination.
The re-arranging of the wagons is done at a marshalling yard and wagons (or containers) can be brought
there by either feeder train or a truck of some sort. (Rail Freight Portal, 2011) The departure times are
predetermined and can be resembled to a timetable of a bus. Single wagon loads are responsible for 50
% of the European cross border rail freight, amounting to 100 billion ton-km (Rail Freight Portal, 2011)
(CER, 2010).
Figure 5, Single wagon load (Xrail, 2010).
Split point
Origin
Destination
CDestination
B
Destination
A
Figure 4, Split point distribution system.

23
The system is quite flexible, allowing for customers to know departure times in advance and offer them
the possibility of adjusting their volumes on a day to day basis (CER, 2010). However, there are problems
with transport reliability and transport information. This creates problems as there is fierce competition
from the trucking industry and they have a massive market advantage in full truck loads compared with
single wagon loads with nine tenths of the market (Xrail, 2010).
As railway has 90 % of its costs in fixed costs, they need to find ways of increasing their volumes. One
way to do this is to make it more customer friendly, which is the idea of the newly created Xrail
collaboration between seven major operators in central Europe. These include DB Schenker in Germany
and Green Cargo in Sweden. (Railway Gazette, 2010) Despite this, the overall network coverage is
declining in many countries, including Spain and Norway (Xrail, 2010).
2.7. Inter-organizational relationships
Relationships on different levels have always been a part of companies and some see it as an obvious
structure and pay little attention to it. Others realize that this can be a way of gaining competitive
advantages and embrace the relationship. In a globalized world, it is just about impossible to expect one
organization to include the competence and means of supporting a product from raw material until it is
in the hands of the end user. This calls for a need from external sources that work for the organization
or a joint collaboration that use each other’s strengths to their advantage. If the product is standardized
and all competitors offer the same, something must distinguish them from each other.
2.7.1. Network and control
This leads to a battle between supply chains and how cheap it is possible to manufacture, transport and
have it available for the customer along with the desired service level and delivery precision (Skjoett-
Larsen, Schary, Mikkola, & Kotzab, 2007). This provides the focal company with the benefits from its
own organization as well as its business partners. To fully utilize this extended network with deepened
relationships, the managers’ capability of developing and maintaining trust-based, long-term
relationships are crucial.
The extended network can be viewed as heavily dependent on social capital as it influences the
formation of the network and affects the industry growth (Walker, Kogut, & Shan, 1997). Even though
different views are presented, they all come together and agree on that the network formation is
dependent on social capital. It is also suggested that individual agents are necessary to overcome the
“structural holes” that exist in relationships and are hindering the collaboration in some way. An
individual entrepreneur can seek out these gaps in information which will transform the network
structure (Burt, 1992).
At first glance it can seem like only positive changes come with engaging in closer relationships, but as
most things, the complexity it brings can be expensive to handle. Dekker (2004) identifies two control
problems when engaging in inter-organizational relationships: the management of appropriation
concerns and the coordination of tasks. This creates an increased need for monitoring and control
between organizations in the supply chain. Furthermore, it can lead to a decreased overview of the flow
between organizations concerning planning, budgeting and control, making it hard to actually

24
€
Time
Cost-Low Profit-Low
€
Time
Cost-High Profit-High
acknowledge what makes the organization successful. Most failures in inter-organizational relationships
come from the difficulty of managing them, putting more pressure on managers and what structure is
chosen for the relationship. Dekker (2004) concludes by stating that many of the problems can be
avoided or mitigated by simply choosing a ‘good’ partner and this reduces the need for expensive formal
governance, although exactly how to know a partner is ‘good’ beforehand is not mentioned.
The matter of control is also a trade-off with flexibility. With lower control needs, the possibility for
higher flexibility increases and vice versa. These concepts are both multi-dimensional, however, which
makes the trade-off a more complex matter than first expected since a company’s fully controlled area
may also be attained through resource control from its co-operation with other companies. (Gadde &
Håkansson, 2001)
2.7.2. High- and low-involvement relationships
Low involvement in the relationship with suppliers leads to a so-called ‘arm’s-length relationship’ which
means avoiding entering any mutual adaptations or linking activities. The low-involvement relationships
have lower handling costs since there are only simple transactions performed but there may be
increased hidden costs within the company due to necessary adaptations within the company to fit the
available supply. Also, there is a possibility of increased delivery uncertainty and therefore the need for
a buffer, or safety stock, is enlarged. The risks associated are in this case external and more difficult to
monitor compared to when the supplier is part of a high-involvement relationship where the risk then
may be seen as internal and easier to adapt accordingly. (Gadde & Håkansson, 2001)
Examples of high involvement-relationships are when the companies develop and improve products or
in some way the combined knowledge and skills are put to good use for the sake of both companies.
High-involvement relationships are often costly but also more beneficial (Gadde & Håkansson, 2001).
The benefits are mainly increased revenues through, for example, better quality while the adverse
aspects especially include large costs.
A high-involvement relationship follows investment logics in many aspects. There are often large start-
up costs and is beneficial after some time. The adaptations needed have already been done and there
are greater possibilities in reaping the associated benefits. See Figure 6 to see the theoretical costs and
profits for both high- and low-involvement relationships. There are also obvious risks of lock-ins, i.e.
forced to stay with the selected supplier, which may develop negatively compared to other possible
routes for the company. (Gadde & Håkansson, 2001)

25
2.7.3. Economic consequences
The economic consequences are difficult to evaluate and should not only be evaluated from the product
and service content (Gadde & Håkansson, 2001). There are numerous solutions, technical and
organizational, that affect the costs as well as the benefits.
As Gadde & Håkansson (2001) describe associated relationship costs, they include direct procurement
costs, direct transaction costs, relationship handling costs and supply handling costs. When performing a
transaction, there are most certainly other costs involved besides the direct procurement costs, i.e. time
and money spent during negotiations etc. There are also costs that can only be related to a specific
supplier but not the specific transaction, for example when a relationship requires adaption and other
kinds of investments in order to gain access to the supplier. (Gadde & Håkansson, 2001)
There can also be benefits related to relationships, both cost and revenue streams may be beneficial for
the companies. The problems evaluating this, however, can be even greater with potentially large costs
to identify them. (Gadde & Håkansson, 2001)
2.7.4. Structural power and balance
Even if a relationship can evolve over time and by doing so, is strengthened for both parties involved
(Skjoett-Larsen, Schary, Mikkola, & Kotzab, 2007), it does not mean it will change the balance of the
relationship. Due to the inert nature of relationships, it is usually set early on in its history what position
each party will have, a balance that is difficult to shift (Walker, Kogut, & Shan, 1997). Even the social
capital can be associated with constraints and outdated commitments leading to impeded competition
and lack of change.
A network has a profound power structure where different individuals can contribute as well as
influence other actors. This power structure sets the stage for how each party defines its strategies in
this specific organization. It has to do with how they perceive themselves and how others perceive their
role in the relationship. Because of this, social networks will form between the parties where informal
cooperation occurs that become invisible assets to both companies. Without the need to go through
formal channels, problems can be worked out by direct communication, providing a benefit that is hard
Figure 6, Costs vs. profits, low- and high-involvement relationships.

26
to match by a competitive company. Even though it is informal dealings with a collaborator, it is
something that needs to be noted when considering ex ante costs vs. ex post costs which is the cost of
searching for, evaluating and negotiating with new suppliers vs. the cost of enforcing agreements and
solving disputes with current suppliers (Skjoett-Larsen, Schary, Mikkola, & Kotzab, 2007). As mentioned
earlier, control is important in a relationship which includes the power structure but also the power
balance between parties.
Power is an ever present phenomenon, even if some may think it is not and that it will be counter-
productive for the relationship, something which is not proven (Hingley, 2005). Abusing the power is
very much a destructive path for a relationship but due to size differences in some relationships,
exercising one’s power can increase efficiency and happens on a regular basis through punitive action or
functional conflict. Even with a large size and power difference, it can still be profitable to engage in
business between two parties. Some find it more comfortable to do business with larger actors, with the
stability they bring, even if it sometimes comes with a certain degree of rigidness. Dependent on the
product, the distributor or customer can find it more preferable to deal with an actor that does not have
too much power on the market and can get to a position where they can put leverage on the buying
party (Hingley, 2001).
The number of actors on a market can also change the use of power as a market with few actors is more
dependent on mutual trust and can likely not survive if some actors are overlooked (Dapiran & Hogarth-
Scott, 2003). What was earlier seen as power demonstrations can now, with high involvement
relationships, simply be seen as a joint decision by two partners.
2.7.5. Trust
Even with quite clear power imbalances, two companies can work together seamlessly if there is a
common sense of trust between them. Many definitions of trust exist depending on the perspective,
which can vary from psychological and sociological to anthropological and economic (Skjoett-Larsen,
Schary, Mikkola, & Kotzab, 2007). Of the mentioned definitions there is one especially that is interesting,
coming from Mika Sako, where it consists of three conceptions of trust: contractual, competence and
goodwill trust.
Larger organizations tend to shy away from all things related to risks and uncertainty, but for one actor
to uphold their part of a contract a contractual trust exists (Sako, 1992). Even if a partner is willing to
fulfill a contract, they may lack the resources or competence to do so according to set standards and
time limits. This is associated with competence trust and is common in ship-to-stock setups where the
supplier is responsible for the quality and delivers straight to the buyer’s assembly line. Finally a third
type of trust can be present, namely goodwill trust, which is a mutual commitment and expectation
between parties. This is the ability to take initiatives in a way of not gaining advantages towards the
buyer. If there is a tendency towards opportunistic behavior, this trust will decay rapidly. A goodwill
trust can grow over time and increase the involvement between actors giving both parties advantages, if
they share principles of fairness and are willing to put in the necessary time (Sako, 1992).

27
This requires both formal and informal relations but a risk can come from too many informal relations
that rely on individuals that can for various reasons leave the company and bring down the relationship
that has been built (Skjoett-Larsen, Schary, Mikkola, & Kotzab, 2007). To counter this, a mix of formal
and informal relations is preferred but in the startup, formal contacts are more common when the trust
between parties has not yet been developed.
Having a supply chain where there is a profound sense of trust between actors can increase their
willingness to make things work even if it is not the most beneficial act for oneself each transaction, and
provide a basis for increased flexibility for all involved. This will create lock-in effects with the current
actors but also bring higher value for the customer reducing their need to change provider. (Pandey &
Garg, 2009)
2.7.6. Evaluation
In order to fully grasp what situation and supply chain the company is currently in, one must evaluate
the partnerships. Kodak, for example, has eight criteria for evaluation in this matter from which they
assess the supplier (Gadde & Håkansson, 2001).
- Amount of technical support
- Number of innovative ideas
- Supplier’s ability to communicate effectively on important issues
- Flexibility shown by supplier
- Cycle time, responsiveness and improvements shown
- Supplier identification with Kodak goals; are our goals common?
- Level of trust that exists in dealing with the supplier
- Strength of the relationship at each plant
When supplier performance is unsatisfactory, the buying company can either change supplier or
enhance the relationship involvement through discussions, training or assisting the supplier in different
ways. (Gadde & Håkansson, 2001) The continuous level of involvement in a relationship must be
monitored and adapted in order to gain full benefit from it. Otherwise, there is a risk committing too
much or too little and losing opportunities or spending more money than necessary.
2.8. Porter’s five forces
The five forces is a model designed to help dominate a market, where the alternative is finding a new
market, a so called blue ocean strategy (Burke, van Stel, & Thurik, 2010). Porter’s model simplifies the
micro-economic theory into five major influences in order to help managers better apply the full
contextual thinking. The five forces affect the industry’s competition and ultimately determine the
profitability of an industry. (Grundy,
2006)
Four forces are actively influencing the
fifth force, rivalry among existing firms,
see Figure 7. The total of the five forces is

28
the primary reason in deciding how the industry competitors are situated related to the industry.
The supplier and buyer power consists of what leverage and bargaining power the actors possess
towards the market. For example, if the demand is larger than the supply, the suppliers will then make
good profits leading to more suppliers entering the market etc. The model also states that it is a
question of how easily new actors enter the
market and pose another threat for the
existing market actors. There can be entry barriers in the shape of patents, regulations or highly skilled
knowledge required. Another force influencing the profitability of the industry is possible substitutes of
the product. If a product can be substituted with another product, then the original industry is at risk of
losing revenue due to a lack of customers. Finally the existing firms compete among themselves; this
rivalry also decides how profitable an industry can become. (Porter, 1980)
2.9. The marketing mix
The marketing mix is a model that contains the four categories that can be controlled by the marketing
manager, i.e. address the categories in such a way that perceived value is achieved and the positive
customer response increased. It is a way of ensuring that the company can create a successful mix of the
right product, sold at the right time, in the right place with the most suitable promotion. (BBC, 2011)
This is referred to as the 4 P’s of the marketing mix: product, price, place and promotion. (The Times
100, 2011)
The product may be differentiated depending on the industry. The term refers to both the physical
products as well as the service, i.e. what is offered to the customer. This might include brand name as
well as warranty and quality. There can be different pricing strategies that affect the price as well as
bundling and seasonal pricing to just mention a few. A higher price can alter the perceived value in
different directions since the customer may relate the price paid to the quality expected.
Place consists of the point where the product is made available to the customers (BBC, 2011). Decisions
affecting the place concern for example how the distribution channels are set up, what transportation is
used as well as how the warehousing and storing is performed. Promoting a product is not only about
the advertisement in newspapers and TV but also the promotional strategies and marketing channels
used. Even how the product is displayed towards the customer is a large part of the promotion. (The
Times 100, 2011)
2.10. Sustainability
Thinking long-term might not be the highest priority for a company that is pressured to deliver and keep
shareholders content but as the governments increases the amount of regulations concerning
sustainability and, more importantly, the gazing public eye; it cannot be ignored any longer. Many
companies have seen this coming and been pro-active, realizing that there are actually costs to cut from
introducing eco-efficient solutions and have made this change in the entire supply chain.
The concept of cradle-to-cradle has increased in popularity since Walter Stahel (1976) introduced the
economy in loops which is based on the product-life factor. It comes from the concept of cradle-to-grave
Figure 7, Porter's five forces model (Porter, 1980).

29
which indicated that the responsibility of the product goes all the way to its grave but Stahel insisted
that to be truly sustainable the product must use durable goods so it can be returned to the cradle (The
Product-Life Institute, 2008). Mr. Stahel moved on to analyze manufacturing on a micro-economic and
macro-economic basis from which he could conclude that it saved large amounts of resources when
extending the product-life versus manufacturing a new product (Lovins, 2008).
Mr. Stahel’s research, now over 30 years ago, has one wondering why more companies have not
realized the benefits of eco-efficiency today and made it into more than a statement on their website.
Szymankiewicz’s (1993) research suggests that companies do not see the potential of implementing
environmental policies and that they instead believe it will increase costs. This leads to the perception of
a gap in innovations concerning eco-efficiency changes, when companies see it as a necessary evil and
not a way of gaining competitive advantage or cutting costs.
2.11. Green transportation
When it comes to the environmental effects from transportation, it is primarily a question of behavior
and a lack of environmental awareness during decision making. Transport purchasers need to realize
that they can and should put demands on the provider, which will for example give their purchasing of
higher Euro class trucks grounds for investments. As so many other problems and origins of waste, it can
be solved with better communication and planning. (Naturvårdsverket, 2009) Today’s transportation
network is built for small frequent delivers with high demands on speed, often overnight deliveries. In
many cases this is overdoing it and creating unnecessarily high service levels which should be prevented
during the customer’s planning, giving the transporter more time to plan for efficiency (Börjesson,
2010). Due to transportation, in many cases, being relatively cheap compared to the products and seen
as something that must be done, little attention is paid to it and even less so to the environmental
effects of transportation.
2.11.1. Road transportation
It is a market which is easy to enter and consists of a massive amount of small haulers that has driven
the prices down towards the fixed costs. Cheap transportation has led to an increased use of immense
production sites that can lower the production cost and then distribute goods through central
warehouses and other facilities. Using trucks as the chosen transportation mode gives a high degree of
flexibility, usually cheaper than the alternatives, but at the cost of the environment and society in a
perhaps non-obvious way. The biggest reason for choosing road transportation is its ability to deliver
goods from the supplier directly to the customer without reloading or any handling (Jonsson &
Mattsson, 2005). As mentioned earlier, transportation has grown rapidly the last 20 years and road
transportation is the most expansive mode of transportation.
A large problem with trucks is that the fill rate is so low, only 40-45%, due to short trips leading to them
running empty on the way back. An even bigger concern is that it is a negative trend; the utilization of
trucks is actually decreasing. This can somewhat be circumvented by larger actors gaining volumes,
allowing for better route planning and the means to increase fill rate. One area where the fill rate is
moving towards reasonable levels is in bulk transportation, going upwards to 80% (Figure 8). (den Boer,
Brouwer, Schroten, & van Essen, 2009)

30
Figure 8, Load and utilization factors in Germany based on ton-km. note: loaded trips do not include empty return
trip (den Boer, Brouwer, Schroten, & van Essen, 2009).
Looking at the environmental concerns from road transportation, the biggest worry seems to be the
emissions of CO2, which have not gone down per truck the last years but has decreased when looking at
a per ton delivered average (den Boer, Brouwer, Schroten, & van Essen, 2009). Another concern is that
the emissions from road transportation contribute to global warming more than for example aviation,
not only short term, but also long term (CICERO, 2008). Emissions of the air pollutants NOx, CO and PM
(particle matter) have decreased steadily the last 10 years thanks to the euro class regulations dictating
steady decline (den Boer, Brouwer, Schroten, & van Essen, 2009).
All these environmental effects are external costs that den Boer et al (2009) try to translate into
monetary values. Some are standardized, such as many air pollutions, but effects such as congestion and
accidents, valuing human life for example, can be debated. Figure 9 shows a summary of external costs
from HGVs (Heavy Goods Vehicles) in the EU. Euro class was mentioned earlier and it is a European
classification system that ensures that HGVs are continuously renewed and provides a way for
customers to demand certain levels of quality. Local governments have also instituted green zones
inside city centres or environmentally sensitive areas that only allow certain high Euro class vehicles to
travel in or through. A more international standard is the ISO- certification that more and more haulers
are being forced to incorporate to stay competitive on the market, when customers are establishing firm
environmental policies.
0%
20%
40%
60%
80%
100%
bu
nd
led
go
od
s
pal
lets
con
tain
er
dry
bu
lk
flu
id b
ulk
1000
+ km
500
-100
0 km
150
-500
km
101
-150
km
50-1
00 k
m
0-5
0 km
cargo distance average
loaded trips
all trips

31
Figure 9, Breakdown of external costs of HGV traffic in EU, numbers in billion Euros. Note: congestion is a rough
indication (den Boer, Brouwer, Schroten, & van Essen, 2009).
2.11.2. Railway transportation
Historically, railway transportation has been seen as the long distance, time consuming choice for bulk
transportation. Due to extensive load times, its lack of direct delivery to most customers and its limited
flexibility, road transportation could grow more rapidly. Railway also consists of an expensive
infrastructure but will easily compete with road when it comes to the transportation of heavy goods
sent in bulk. The environmental effects of railway are limited, negating many of road transport’s harmful
effects, such as congestion, air pollution and accidents. In Sweden, the railway is powered exclusively by
electricity from hydroelectric power plants, which means the air pollution levels are close to zero. This is
not the case for all of Europe where some trains still use diesel locomotives. Rail is still 2-5 times more
energy efficient then road, maritime and aviation. (CER & UIC, 2008)
Even with all the positive benefits from railway concerning the environment, the problems with extra
loading and re-loading for the goods to reach the customer is still a problem and the fact that it is a
more time consuming alternative to trucks (Jonsson & Mattsson, 2005). But with the transport seeing a
25% increase in greenhouse gas emissions in the last 20 years at the same time as all other major
industries have gone down (CER & UIC, 2008), something must be done and it can be that railway will
make a comeback on the market.
2.12. Dangerous goods
Dangerous goods is a generic term for substances and objects that have such dangerous properties that
they can cause damage to people, the environment or property if not handled correctly during
transportation. They are divided in classifications depending on their properties, where hydrogen
peroxide is classified as 5.1, an oxidizing substance. The notion of dangerous goods transportation does
not only include the time the goods are actual moving, but also during loading and unloading as well as
all kinds of storage. It does not include shorter transports within the manufacturing facility or the
consumer’s facility. (MSB, 2010)
Infrastructure; 51
Accidents; 30
Congestion; 24
Noise; 18
Air pollution; 16
CO2; 5

32
To transport hazardous materials by road between countries, one must follow the ADR rules and
regulations, which is the European Agreement concerning the International Carriage of Dangerous
Goods by Road. Currently 45 countries use this regulation, including Sweden and Norway. The
equivalent to ADR for railway transportation is RID, which is also followed in both Sweden and Norway.
(MSB, 2010)
When transporting dangerous goods by road, there are limits to what roads one can chose governed by
the local authorities in Sweden; Länsstyrelsen. This is done to limit the exposure of sensitive areas if an
accident does occur. All drivers transporting dangerous goods must take part in a training course which
inform about the dangers, how to avoid them and what to do if an accident happens (MSB, 2009).

33
3. Method The method chapter describes the process of the problem solving in this thesis. It contains information
regarding how the information was collected as well as what selections and decisions that have been
made regarding the manner in which the thesis is done. It first describes the process and then clarifies
specific aspects such as the reliability and validity of the thesis.
3.1. Process
The thesis has been divided into several smaller activities such as background, literature review and
analysis, thus simplifying both the writing process as well as the reading. The thesis started with a
general discussion, both with and without Eka’s involvement in order to fully grasp the problems at hand
and understand the entire concept and implications related to the suggested thesis. It was Eka
themselves who suggested the thesis subject and presented the problems from their point of view. This
made the initial phase easier since it was a predefined problem as well as a direct need for the outcome.
After the general discussions and clarifications of the problem the background had to be looked in to. In
order to better understand the situation and the context, the background is an important cornerstone
and this was achieved through interviews, internal documents and external industry articles.
The literature review and empirical framework were in many ways conducted in parallel. This was
chosen due to the possibility of related activities and theories more closely linked to the empirical data
and therefore a context that is more put together. This also helped putting things in perspective and
simplified the innovative process. The interviews were conducted at the same time as relevant
knowledge was gained through literature and articles relevant to the topic.
Following the empirical framework is the analysis which features the areas identified for improvement
and the proposed changes to these. The discussion completes the process and is the argument for the
recommendations to Eka and its supply chain.
Figure 10, Process flow of the thesis.
As seen in Figure 10 the process has overlapped between the different phases and parallel work was
involved at several occasions. The initial phase included both setting the purpose as well as analyzing
the problems. During the collection of background information, both the literature review as well as the
general empirical study was performed as mentioned previously.
Initial phase
•Purpose
•Problem analysis
Background information
•Literature review
•General study
Elaboration
•Alternatives
•Specific study
Analysis Recommendation

34
There have been no evident roles for the thesis authors throughout the process, such as document
administrator or coordinator. Instead, communication has been a cornerstone in the process requiring
full attention and also an open mind to the different opinions. Since it only involves two authors this was
chosen since it is important to get two views on every matter throughout the entire process. It also
helped to gain a more common understanding of every part of the thesis.
The work has mostly been done at Eka’s site in Bohus, north of Gothenburg, but also at Chalmers
University on a regular basis. This was chosen in order to come closer to the organization and the
problem at hand; with a more direct communication channel to the people involved, the process could
become more effective and also better in terms of quality desired by Eka.
3.2. Methodological limitations and consequences
Since the literature review was chosen to be performed, in many ways, parallel alongside with the
empirical framework, the total outcome may have been improved. With the ability to easily reject or
proceed with any findings as well as controlling the literature according to the current situation is
something that has been a key factor to present relevant literature and data. This process obviously
requires more time and attention from the authors but was a choice in order to obtain the best results.
The number of actors involved in the thesis was fixed since the supply chain is closely linked and related
to each other. However, Eka deals primarily with the transporter and the distributor and therefore they
are included in the actors chosen to be more closely analyzed in the thesis. The fish farmers and the
operators of the fish carriers have been monitored but are not the subject of a more in-depth analysis.
The persons interviewed during the process are all related to the topic at hand and both internal, Eka,
and external, the distributor and the hauler, were interviewed mainly to get information regarding the
current situation and the upcoming future. All interviewees have been connected first hand to the
problems to be able to rely on as precise and correct information as possible.
3.3. Choice of research approach
The data have been collected in qualitative form, mostly through interviews. Through the interviews, the
thesis will gain primary data which will be compared with external sources such as industry magazines,
articles and government websites. Through this, the thesis gains in-depth knowledge and understanding
of the current situation and the market. The different attitudes and experiences will be prioritized
among the data in order to meet the identified challenges.
There are certain risks connected to this chosen interview method such as the response in questions
due to the interviewers’ intonation or body language when asking the questions as well as during the
entire interview. It is also a sense of state of mind and the attitude towards each other and between the
interviewers. If the interviewee is feeling uncomfortable there is an apparent risk of impairing the
quality of the interview. The interview is not a tool but an encounter (Schostak, 2005) and should be
treated accordingly. Schostak (2005) also states the fact that the discussion and therefore the
differences between the parties that is the heart of the interview.

35
Logistical aspects
Market
Company
Usage
Product
The thesis outcome is partly deductive in the sense that models are presented from general definitions
and principles, but also partly inductive due to the use of models and information given by Eka. A
consequence of the chosen approach is that the thesis does not present any statistical results regarding
the different results or outcomes.
This report is performed using a case study which according to (Yin, 1994) is “an empirical inquiry that
investigates a contemporary phenomenon within its real-life context”. In this context the case problem
studied have been studied solely instead of several similar problems. This increases the analytical
aspects of the problem at the expense of the statistical aspects meaning that the sole problem will get a
more in-depth analysis when only focusing on the problem at hand. Hence, there is no room studying
several issues in order to ensure the statistical value.
3.4. Selections
The selection within the thesis concerns only the literature review since the different actors involved
was a pre-requisite and not a selection, as they were involved in the matter and therefore obvious to
interview. The literature review is a reflection of the largest problems in the thesis. There are infinite
possible problems to the thesis but there had to be certain limitations in order to elevate the quality and
relevance.
Much focus has been spent on the supply chain theories such as relationships and also market
structures because these are key factors in the discovered problems. Other selections regarding the
literature review have all been done alongside with the empirical framework and conceptualization of
the problem.
3.5. Collection of information
The information always serves as a basis for the results, and so it is also in this case. The information in
the thesis is collected from both literature and interviews. During the process of collecting information
the first priority was to gather knowledge of the product and the usability of the same. This priority was
made due to the fact that it was a natural learning curve to first understand the product and company
which the report would consider.
This was followed by the information and in-depth knowledge of
the market and especially the logistical aspects of the current
state. In order to have a clear focus on what information to
collect, the priorities made were from the point of the
product as it is closely linked to the core of the report and its
outcome.
3.5.1. Literature
The literature used is primarily from books and articles used
Figure 11, The product information is at the core of the
surrounding knowledge areas.

36
previously during courses at Chalmers University of Technology and found via Chalmers’ library. These
are, mostly, in the field of logistics, supply chain management and environmental aspects.
The information regarding Eka, its’ competitors and the relevant markets have generally been found
through public sources. Some information is internal documents from Eka or AkzoNobel, this
information has been verified, when possible, with external sources.
3.5.2. Interviews
Interviews have been conducted with twelve persons within the supply chain, nine of these are from
inside Eka. These have been performed by both authors, in most cases, in order to ensure the quality of
the interview and gain a better understanding of the opinions and shared information (Lantz, 2007). By
dividing the responsibilities during the interview, the authors could focus more on their specific task.
The interviews were performed as discussions to get a better qualitative depth in the information as
well as more easily gain hidden information that the authors did not know existed (Schostak, 2005).
We chose to perform face-to-face interviews in all cases in order to gain a higher quality and especially
to increase the opportunity for follow-up questions and by coordinating the responsibilities with each
other as much as possible this could be enhanced even further (Trost, 2005). There is a risk, however,
that the answers are not as well thought out as they could have been if using, for example, e-mail as
basis for the interview. When writing the answers the interviewee automatically gets a second chance to
reflect and consider what to respond but in a face-to-face interview the body language along with
follow-up questions and explanations are more beneficial.
With mostly open-ended questions the interviewee could without difficulties discuss relevant topics in
the specific matter. Along with the fact that both authors were present and could ask follow-up
questions the quality of the interview could be guaranteed. The interviews were also half-structured in
order to gain full momentum of the discussions and interviews. A half structured interview consists of
follow-up questions after the structured ones and can therefore be modified depending on the subjects’
answers (Lantz, 2007).
The responses given to the authors during the interviews may be biased due to the different
experiences and background each subject has. Subjective answers may be given, even though not
intentionally. Hence, an ideographic approach must be used. (Lantz, 2007)
There were also follow-up interviews when necessary and possible, because of the possibility of testing
ideas and double-checking the information given at previous occasions.
3.6. Reliability and validity
Regarding the validity, the thesis can only be applicable to this specific product and company and is
therefore not valid for other companies, but can most likely be used for other supply chains inside Eka
that deal with the same product. The factors in this study are so specific to the supply chain that results

37
cannot be translated into other situations without changing these factors, even if many of the
improvements found are to be applied for most segments. It was not the intention to be able to apply
the results in another company due to the fact that Eka themselves requested this specific situation to
be looked into. Some parts are obviously applicable as well as the combined theory, but every new
situation should be looked at from its specific perspective.
The reliability of the study is fairly good. There has been a lot of focus on determining what information
is needed for the thesis and double-checking facts and opinions when possible. The likelihood of
reaching the same outcome in another study of the same problem is high. The reliability has also been
strengthened through several interviews where both authors took part in order to certify a common
interpretation of the information given. In order to clarify some information or questions, follow-up
interviews were performed, increasing the reliability even further. The reliability may have been
lowered in external interviews where the interviewers may have been seen as employees of Eka.
The interviewees have also been asked to review their statements used in the thesis in order to ensure
that the information is correct and reliable.

38
4. Empirical findings The empirical findings in this thesis describe the present situation for Eka. This is primarily done from an
outside perspective to ensure the best possible outcome. With the theory as a reference, the information
and data collected can be explored and presented.
4.1. The different flows
The supply chain consists of several different flows, such as physical and monetary flows. These differ
since each actor is not part of every flow and the relationship changes between the actors depending on
which flow is considered.
4.1.1. The actors
Eka is the producer at the start of the supply chain, when looking at a regular physical flow. They are, by
far, the largest actor in the chain and the focal company of this thesis, meaning they become the center
when alternatives are considered.
The hauler provides a transport service to Eka. They are stationed in Norway, close to Eka’s site in
Rjukan, and transport Eka’s entire production of HP in Rjukan to customers in Norway. They are a
relatively small company with only a few employees and a yearly turnover of roughly one million euro.
(Finnfirma.no, 2011)
Eka uses a distributor in Norway for the fish farming industry and they are the official connection to the
customers. They buy the HP from Eka and sell it to the fish farmers. The distributor distributes the HP to
the fish farmers, the users, along the coast of Norway (The distributor, 2009).
4.1.2. Ownership of the product
The ownership of the product changes along the chain. Originally Eka owns the product as they are the
ones that produce the hydrogen peroxide and they maintain ownership during transport. The distributor
gains ownership when the product is placed at the harbor for distribution to the users. They own the
product until it is used at the fish farms. This is due to regulations that designate the HP as a
pharmaceutical product in this application and it is therefore only allowed to be owned and handled by
a veterinarian (Larsson, 2011). As this is a short ownership chain it supports simplified handling between
the concerned actors (Figure 12).
Figure 12, Physical and ownership flows.
Ownership of product
The distributor Eka Chemicals The hauler
Physical flow

39
4.1.3. The physical flow
The product is produced by Eka but all handling of the product outside of production is done by the
hauler, from the loading at the production site to unloading at the destination. The hauler performs all
this for all the delivery locations along the coast of Norway. They are the sole transporters for HP to fish
farms in Norway and thereby, they have close contact with the delivery sites in order to meet the users’
demands. The hauler then either delivers to the distributor’s storage depots or directly to the
consumers’ boats. The physical flow is similar to Eka’s other products but with a more in-depth
involvement from the actors. In this case, the hauler is very involved in the process and also has deeper
knowledge about the technology used. What differs from Eka’s other customers is the fact that there is
no dedicated storage facility at the customer site and that the delivery location is often mobile,
increasing the complexity.
4.1.4. The monetary flow
The monetary flow of the chain (Figure 13) is more complex as the users only pay the distributor when
the product is used and for the amount that was required. The distributor cannot invoice the users
before the product is put to use due to its restrictions as a pharmaceutical product and only the exact
amount used can be sold to the users (The distributor, 2009). Eka does, however, send the invoice to the
distributor when the product leaves the premises. The hauler on the other hand invoices Eka for the
services they perform. Eka has found it to be more profitable to work with a few haulers in their other
operations and has lowered the total number of haulers used substantially the last few years, which has
also been a strategic direction from its owner, AkzoNobel (Himmelmann, 2011).
4.1.5. The information flow
The information flow is essential in this supply chain. It flows in both directions and also between all the
actors creating a network of information sharing. Eka both receives and gives information to the
distributor as well as the users even though they are not linked directly to them.
The hauler is a hub in the network since they manage the delivery information and are also involved in
the usage of the product at the end customer. The entire network is very integrated regarding the
information sharing with unclear boundaries of what information belongs to specific actors, making it a
Figure 13, The information flow involving all actors and the specific order of the monetary flow.
The distributor Eka Chemicals The hauler
Information
flow
User
Monetary flow

40
very flexible and agile chain that can respond to fast changes in demand from customers and deliver in a
short space of time. The hauler keeps up to date with demand by direct contact with the fish carriers,
not only for delivery location but also amounts needed.
Eka has an internal SAP system that can be used by the transporters in order to better receive delivery
information and allocation of the product. The orders are entered manually into the system and Eka has
a recommendation for orders to be placed five days prior to delivery. However, this system does not
seem to work satisfactorily for the hauler in all aspects. It is especially problematic regarding the
customs requirements and the system is therefore mostly seen as an obstacle.
4.1.6. The order handling
The order handling is a complex flow within the supply chain. It is not a simple order from user to
producers but instead involves everyone in the chain, some more than once.
The order starts with the fish farmers having a veterinarian issue a prescription stating how much HP is
needed. The prescription is then sent to the distributor which has a pharmacist that approves the
prescription’s content which is then sent back to the fish farmers. The distributor then sends a gross
order to Eka which is not based on the prescriptions but more on forecasting and appreciations of the
future market. This order states the maximum amount that could be needed and is often on the upper
boundary of what could be needed.
The fish farmer contacts the fish carrier and states how much and when they would like a de-lousing.
The fish carrier can then order an amount from the hauler and also give information regarding where it
should be delivered. This is often done with just a few days notice if any at all.
It is now up to the hauler to contact Eka to see if there is a valid order. If so, the hauler picks up the HP
at one of the sites based on both Eka’s preference and the current needs and possibilities of the hauler.
If there is not any order from the distributor at Eka, the distributor must then quickly place an order for
the HP to be able to be delivered. This procedure is clearly complex and allows many errors as well as a
less efficient supply chain.
The distributor
Eka Chemicals
The hauler
Fish carrier
Fish farm Veterinarian
Pharmacist
Figure 14, The order chain of hydrogen peroxide from user to producer.

41
4.2. Relations within the Supply Chain
In the existing supply chain, the relations are affected by several activities and structures. The fact that
Eka is a much larger actor than both the distributor and the hauler sets the framework for many
possibilities but also limitations.
As seen regarding the different flows, such as order handling and information flows, there are many
opportunities for the informal communications to take place. This kind of communication between the
actors is a large part of the existing relationships. These communication methods are time-demanding
compared to other Eka supply chains but are still an important hidden asset which has been used in
order to raise the interest of the treatment. The informal communications has vastly improved the
flexibility of the supply chain which has been crucial for the outcome of the market, which is also
described in the theoretical framework. The hauler has been able to meet the demands from the fish
carriers in a better way through the informal network within the supply chain as well as with the
distributor being allowed a more flexible approach when it comes to order handling, for example. It has
certainly been a key towards creating the existing market but with growing volumes this approach can
be a problem.
There are large differences in size among the actors in the supply chain and therefore a more apparent
difference in power structure which has not been a problem so far with the common goal of satisfying
the demand on the market. Hence, it could even have been an advantage for the actors involved to have
a clearer division of responsibilities and labor regarding the activities, which is not something that has
been found in this case.
The trust among the actors has been satisfactory from the start. The contractual trust exists simply due
to the agreements met and also due to the activities upholding these. The competence trust however
can be questioned due to the fact that both the distributor and the hauler might have resource
problems if the demand increases but this has not been an issue in the present state. The goodwill trust
however, has been solid through well established intentions and proven success.
Through the relationships within the supply chain, one has been able to meet the criterias and demands
from the market, allowing the market to expand. This agile supply chain has, through high flexibility and
responsiveness, also been successful in positioning the entire supply chain as a solid actor on the market
with satisfactory market shares (Pandey & Garg, 2009).
With informal communications being the standard way of communicating within the network there
have not been any formal requirements regarding service levels or other measurements. With the
possibility of increased volumes there may be difficulties in keeping the informal structure when the
supply chain is put to the test further on.
4.3. Internal specifics
The data collected during the process is quite extensive and a selection of this will be presented,
depending on relevance and what will be used as the foundation for the analysis.

42
4.3.1. Production capabilities
As mentioned previously, Eka has three HP production sites in the Nordic countries. Currently Eka
wishes to use Alby as the main source of HP for all the customer sites north of Bergen and Rjukan for
those in southwest and south Norway. The production volume of each differs and is allocated as follows;
Table 1, Production volumes, percentage of total volume produced.
Production Unit Alby Rjukan Bohus
Produced volume 44.5 % 9.8 % 35.7 %
Using Bohus production site as an example, it is producing 350 days a year with an uptime of around
96% and it can produce 0.1% of the total Nordic production each day. (Staberg, 2011)
The production cost is largely dependent on energy cost and all of the production units use different
energy sources; this means different production costs at the different sites. The production is assumed
to be running at full utilization in order to calculate example costs without an additional variable. To
determine which customers will receive product from each production site, Eka has a planning tool
called WhatsBest. This will take into consideration factors such as freight costs and production costs.
4.3.2. Storage facilities
As the product is delivered in different concentrations to the customers, separated storage facilities are
needed and the Bohus production site has nine in total. It is a combination of 500 m3 and 200 m3 storage
tanks which are necessary in order to always have the right product available when a delivery needs to
take place. This storage is situated within the factory premises and has connections to both the railway
and the transport roads leading out of the production area.
The storage volume is comparable to one week’s worth of production. This is mainly because they
deliver more then they produce during the weekdays and are then able to build some inventory during
the weekends. Most of Eka’s customers have their own storage tank which is, depending on
agreements, monitored by either Eka or the transporter, keeping it at previously determined levels. This
has not been the case with the fish farming industry and instead containers have been used as storage
facility, which is quite costly and impractical. However, it does bring a certain degree of flexibility and no
need for other investments regarding storage facilities.
The mentioned minor depots have been used as something that is very similar to a split point system
where a larger sized carrier can deliver to this split point and then smaller carriers move it forward. This
is used in a combination with direct deliveries to the boats which is at this time roughly 60-70% of the
deliveries (representative-distributor, 2010). These depots will work as a buffer to keep the service level
up, at a cost of the container and the extra handling costs. There are, however, regulations for placing
containers in harbors, including specifiying the area they occupy. The depot in Fosnavåg is allowed to
have five containers on the wharf and two additional ones about 200 meters further in, creating an
otherwise unnecessary need for short distance movement.

43
4.3.3. Demand
The demand is influenced by two major factors, which are described in the introduction: drastically
increasing volume (Figure 15) and the seasonal variation (Figure 16). This shows a doubling of the
demand from 2010 to the forecasted numbers of 2011. As this is a treatment with many variables, the
exact dosage can differ depending on how bad the lice problem is, making it hard to forecast. Looking at
the actual demand for the first few months of 2011, the forecast is accurate in most areas but was
distorted in other where the water has been too cold to conduct treatments in. Even so, the demand is
expected to catch up and as treatments are moved into the summer months (representative-distributor,
2010).
Figure 15, Differences in demand for 2010 and the forecasted values for 2011, indexed by highest volume.
The seasonal variation is due to de-lousing traditionally taken place during the spring because of
government regulations. There are also tendencies in the market to even itself out with some fish
farmers expressing a wish to do some treatments during the summer. This could perhaps lead to two
more separated peaks, allowing for deliveries to be done in the months leading up to the peaks, of
course demanding storage facilities if that would end up being the case.
0%
10%
20%
30%
40%
50%
60%
70%
80%
90%
100%
Bodø Ottersøy Namsos Frøya Fosnavåg Bergen
2010 2011

44
Figure 16, Forecast by Eka to fish farming industry, 2011, indexed by highest volume.
The development in the coming years is hard to predict with such a new market as it is growing rapidly.
The biggest salmon grower in the world, Marine Harvest, has a one year deal with the distributor which
can indicate that they are not that interested in this method or that they want more options in a fast
growing market. A one year deal is not unusual but the fact that Marine Harvest chose to split its supply
between two distributors is also a strong indication. It would be preferable for Eka and its collaborators
to have the customers commit in some way so that more investments would be viable. No one knows
where the market will end up, with some saying this is the peak and others predicting it can grow five to
six times still.
4.3.4. Distribution channels
The distribution channels for the hydrogen peroxide are more complex than normal for Eka. Regarding
the transportation, only trucks are currently used, either carrying an ISO container or a using tank truck.
Eka deals with a distributor in Norway who handles the customer contact and most official dealings in
Norway concerning the method and holds the license for selling medical drugs in Norway. (Larsson,
2011) Due to an exclusivity deal with the distributor, no changes in number of distributors can currently
be made.
Considering the transportation there are no exclusivity deals but a close partnership has been formed
with the hauler who is very involved and a driving force in this project. The hauler is a small actor
compared to Eka but has provided a great deal of extra value in the form of unofficial connections and
knowledge about local matters. Using only one transporter limits Eka’s choice in means of
transportation and the alternatives will be discussed later in this chapter. Important factors in this
aspect are not only the financial costs but also knowledge and service provided in addition to the
transports.
The demand for short lead times from customers has made this distribution channel a complicated
network with undefined delivery locations and a daily routine dependent on communication. This issue
heavily affects the hauler which is therefore involved in both delivering the product and all the
0%10%20%30%40%50%60%70%80%90%
100%
2011

45
necessary communications between the actors. They may also be involved in the order handling
primarily between the distributor and Eka. The distribution channel is a complex network held together
by the heavily involved actors.
4.3.5. Transportation costs
In order to establish the relative amount of the transportation cost, information was provided
concerning where the product was delivered from and to which harbor it was delivered to. This,
combined with the freight costs that are in the agreement with The hauler and price levels for The
distributor, was used to calculate a transportation cost based on revenue (Figure 17). This shows that
the transportation cost is between 22 and 38 percentage of the revenue, a large difference depending
on the HP sourcing location. This says nothing about the actual volumes being sent to each harbor,
which is why Figure 18 is presented. Especially Ottersøy shows a large problem with product going from
the non-ideal production site and as it is such large quantities, it does not seem to be the result of last
minute orders.
Figure 17, Transportation cost of total revenue for each delivery harbor, 2010.
The freight cost is a fixed price per transport, regardless of what kind of truck is used and how much
product it carries. The transports done during 2010 had the following average weights:
Table 2, Average weights for transports during 2010.
Production site Alby Rjukan Bohus Total
Average weight 29 tons 28.4 tons 27.9 tons 28,4 tons
These numbers would indicate that more tank trucks are being used from Alby and that Rjukan and
Bohus most likely had its average lowered by small emergency transports, for which exact data has not
been found. Altogether this shows quite clearly where it is most beneficial to deliver the product from,
0%
10%
20%
30%
40%
50%
60%
70%
80%
90%
100%
Ottersøy Namsos Frøya Herøy Bergen
Alby
Bohus
Rjukan

46
assuming there was excess product at all production sites. This might not be the case, which is why the
program WhatsBest is being used, as it takes all customers and all freight costs, production costs and so
on into consideration for all of Eka.
Figure 18, Volumes for each harbor, indexed by largest volume, 2010.
Comparing Eka’s transportation costs for the fish farming industry to other customers, in the same
region, can give some idea of the size of the transport cost. One does, however, need to keep in mind
that the fish farming industry is a special case and that the hauler provides so many extra benefits here.
Table 3 shows the freight costs based on distance and size of truck showing that the fish farms are not
much more expensive than other HPSA customers (hydrogen peroxide special applications). A large
difference compared to a regular paper mill customer is evident and largely based on the volumes being
considerably bigger.
Table 3, Indexed freight cost (€ / ton-km). All based on Rjukan as production site.
Customer Container Tank truck Distance (km)
Bergen 61 % 61 % 350
Herøy 100 % 100 % 420
Paper mill 37 % 43 % 180
Other HPSA 76 % 76 % 200
It should be noted that the table is misleading as every transport consists of a variable cost depending
on kilometesr and a fixed cost that is divided per kilometer, which would increase if it is a shorter trip.
The noteworthy figures are not affected as the lowest cost is presented by the shortest distance. Even
the kilometers can be uncertain as special circumstances can affect this for some trips.
0,0
0,1
0,2
0,3
0,4
0,5
0,6
0,7
0,8
0,9
1,0
Ottersøy Namsos Frøya Herøy Bergen
Alby
Bohus
Rjukan

47
4.4. Market situation
4.4.1. The market size
The market size is hard to define as it is dependent on different factors starting with the entire salmon
farming industry which is a massive market with an estimate of one million tons during 2010 (Figure 19).
The Norwegian salmon growing industry is vast with sales amounting up to 20 billion NOK
(Fiskedirektoratet, 2010), making the need for working methods to de-louse an important issue.
Figure 19, Sale in tons of Atlantic salmon from Norway 1999-2009.
Market growth rate for the fish farming industry has been positive for many years with an exception in
2008 which is most likely due to the global economic crisis. Following the growth trend the last 10 years
(Figure 19), there will be an increase of 15-20% in 2010, breaking the 1 million tons of sold salmon
(Fiskeridirektoratet, 2010).
The growth cannot continue forever both due to the lice problem (DN.no, 2010) and also the fact that
the salmon are fed with other fish that are becoming endangered if this continues. Currently it requires
4 kg of feed to produce 1 kg of salmon (Valestrand, 2008). The main problems with increased lice
infestations are that even though the net enclosures are becoming larger and larger, there is less space
for each salmon and this increases the lice problem exponentially (DN.no, 2010).
There are however no visible trends of slowing down in the salmon farming industry and they are
confident that the lice can be controlled with the proper use of a variety of methods, where hydrogen
peroxide is one (DN.no, 2010). During 2010, the total estimated market for hydrogen peroxide was a bit
more than 3 thousand tons of solution (Mugaas Jensen, 2011). The current methods for de-lousing are
dependent on alternatives to avoid the lice developing resistance towards these substances (Berglind,
2011).
0
100 000
200 000
300 000
400 000
500 000
600 000
700 000
800 000
900 000
1 000 000
1999 2000 2001 2002 2003 2004 2005 2006 2007 2008 2009
Atlantic Salmon

48
Since the entire fish farming market does not use hydrogen peroxide as their primary de-lousing product
the HP market is limited (Larsson, 2011). Although, this leaves possibilities of the HP market to expand
further to fish farmers currently not using the method. There are also further sales to be made to the
fish farmers already using the HP method, resulting in a good potential market size for HP. One must
realize that the market is not likely to keep growing at the same pace for several years. It is a re-
emerged market that needs to mature before any exact conclusions can be drawn on where a steady
supply will be demanded.
4.4.2. Five Forces
Market profitability can be described by Porter’s five forces which make up a framework for this and
also map the dependencies between actors. This has been explained in the frame of reference (2.8. )
which is the basis for the following section.
4.4.2.1. Supplier power
First off, the supplier power is a force which seems to be large in this particular case. It is a market that
requires the product to solve their problem, not only to ensure the salmon is healthy and alive when
arriving at its destination but also due to Mattilsynet enforcing limitations on how many lice can be on a
salmon in average (Berglind, 2011). If this is not reached after trying different methods of de-lousing it
can go as far as the fish farm being forced to slaughter all of its salmon to reach suitable louse levels,
which greatly affects the revenue for the fish farmers (Mattilsynet, 2010).
The supply is therefore more important to the buyer than the supplier since this is a side business for
most hydrogen peroxide producers and not something they would prioritize over their very large pulp
and paper customers. The supplier power is somewhat limited by the uneven demand and even the
transportation can be a limiting factor here when the peaks in demand call for high frequency.
4.4.2.2. Buyer power
The buyer power is a bit questionable for this product as the suppliers, such as Eka, need to prepare
weeks in advance for the large delivery for the springtime de-lousing. It would be preferable for the
hydrogen peroxide producers if the market matured and evened out at a reasonable level. This could
also strengthen the buyer power since the supply then would become even more standardized, now in
terms of distribution. This could lead to tougher competition among the hydrogen producers.
The fact that the fish farming industry needs to alternate methods speaks in favor of hydrogen peroxide.
Even though there are several methods available, the market is so big that the demand will most likely
be there unless a new improved method enters the market. The sheer size of the market shows that the
buyer power is large; someone will always be after the product. What makes this a limiting factor is the
industry’s reluctance to sign long term deals with a method they feel requires too much handling,
making any investments subject to short pay off times.
As the process requires a large amount of product when using hydrogen peroxide, the location of
production becomes important to provide profitability on this, geographically, remote market. This gives
Eka an advantage in having a production site in Norway and two others very close. Eka are at the
moment the closest supplier by far, leading to fewer possibilities for the buyers on the market since the

49
distribution is currently complex and therefore favors the production location heavily. This leads to the
buyer power being partially diminished in this aspect.
4.4.2.3. Substitute products
As seen in Error! Not a valid bookmark self-reference. there are different treatment methods for
salmon lice. The main methods are leppefish, biological and medicinal tablets. The leppefish is a specific
fish that eats the lice from the salmon, which is environmentally friendly but expensive and difficult
handling. The biological products are poured into the water and affect the lice from their surroundings
while the medicinal tablets are fed to the salmon, which mean the lice are affected from the salmon
instead of the water. (Nygaard, 2010)
Table 4, Different treatment methods against salmon lice (Nygaard, 2010).
Method Product Dose
Leppefish Certain fish that eat the lice -
Biological Alpha max 0,2 ml/m3
Beta max 0,3 ml/m3
Salmosan vet. 0,2 g/m3
Hydrogen Peroxide 1,8 kg/m3
Medicinal tablets Slice Min. 50 % of daily food for min. 7 days
Releeze vet. Min. 50 % of daily food for min. 14 days
Ektobann vet. Included in food for at least 7 days
Substitute products, such as the biological methods, are currently available and more will most likely
appear on the market (Berglind, 2011). However, it can be hard to predict since the research is only
partly the obstacle towards new methods, the second being getting it approved for use and having all
the proper manufacturing licenses. All this is both good and bad from the perspective of the hydrogen
peroxide producers since there will always be a demand for several methods, including HP, to avoid the
lice developing resistance against any one method. It is bad in terms of the never-ending competition
from several different methods and thereby difficulties determining the total possible market.
Regarding substitute products it would be damaging if a new, more easily handled product would enter
the market. Especially when handling costs are high and the sheer amounts of hydrogen peroxide
needed can be seen as arguments for the fish farmers to use alternative methods. The HP itself only
makes up 10% of the cost for the treatment (representative-distributor, 2010). However, the buyer
power is, as mentioned, a limiting factor for the sales of HP as the fish farmers, if given a choice, would
prefer other alternatives over hydrogen peroxide.
Even though research is being done in this area, it is unlikely that an alternative will appear on the
market in the next few years. It is a long process to develop, test and new treatments approved,
especially as it is dealing with a medical product and the rigorous scrutiny this brings (Mattilsynet, 2010).
This includes how the method affects the salmon, the consumer of the salmon and the ocean in which

50
the treatment takes place, both direct problems and long term effects, making it a very complex
process.
The current method of treatment in the fish carriers may be phased out in favor of direct treatment in
the net enclosures. This would eliminate the need for using the very expensive fish carriers but would
require more hydrogen peroxide per ton salmon. (Berglind, 2011) The treatment could suffer in terms of
effectiveness but this is something that could be avoided by more tests and new equipment. Problems
include being more weather dependent and having to move the net enclosure which is being used as a
treatment facility. There is also research being done on combining the use of HP with rinsing the fish
with water, something that is lethal with too high water pressure, but could be successful if it allows for
HP to remove 80% of the lice and water rinsing to remove the last 20%. (representative-distributor,
2010)
4.4.2.1. Potential entrants
New entrants into the market are not that likely at the moment. Even though the hydrogen peroxide as
a product is standardized and does not differ in quality among producers, there are heavy investments
required in order to start producing HP. Existing producers could more easily enter the market, but a
high knowledge level is required in terms of local knowledge as well as buyer connections. Since it is a
highly standardized product, the producers must instead provide additional benefits to the fish carrier
vessels and focus must be on the accuracy and precision connected to the logistics. The existing
producers could enter the market merely as a supplier and by doing so avoid the need for local
knowledge.
It is necessary for the producers to have a license to produce and sell medical products in Norway, but
an exception has been given to the distributors as this was such a new area for the product. These will
however stop being valid as soon as one producer is granted a full license. Applying for this license also
gives an early indication of when competitors are moving in on the market. (Larsson, 2011)
4.4.2.1. Rivalry
The current competition between the suppliers is not a burden at this point since the market is growing
faster than the producers can distribute. However, the rivalry can increase when the market matures
and the actor’s positions in the market become clearer. Currently the biggest limitation on this market is
the lack of fish carriers, creating some rivalry between distributors on who signs deals with the boats
first. There will also be some rivalry between treatment methods as they need to show the highest
possible survivability of salmon, while at the same time removing as much as possible of the lice.
4.4.3. Expanding the market
Expanding the market to other countries is not of interest at the moment as it is in Norway that Eka has
been active due to the closeness to its plants. This could be of future interest for Eka and its production
sites when the Norwegian market has matured but would need a more strategic approach after Eka has
gained more knowledge and experience regarding the possible outcomes.
The domestic market in Norway is still far from exploited and the growth possibilities are immense if no
limitations from the supply side were impacting it. The current customers that the distributor deals with

51
do not solely use HP as their treatment for lice and there are even more customers that have not even
tried the treatment. But as mentioned previously it is not realistic to look at the entire market as a
potential market, simply due to the sheer size of it.
The problem with increasing the customer base is that they are very spread out along the coast and that
it can limit the economies of scale that increasing the volumes should bring. This can make it more
beneficial to center one’s customers and focus on a special area of the coast, at least in an initial phase
to see the progression and then evaluate this before expanding.
4.5. Alternatives in transportation
4.5.1. Railway
As railway is currently used by some of its customers, Eka has the know-how as well as existing handling
equipment but the railway infrastructure in Norway is limited, especially close to the coast, where all the
customers in the fish farming industry are located. If the train cannot deliver straight to the customer, a
reloading will need to take place, adding large handling costs and delaying the transport. There have
been internal discussions in Eka about using railway for their Norwegian customers but the low volumes
and the fact that the shortest route from Alby is not fully electrified ended the discussion. Currently the
Swedish railway system is 100% electrified but the route between Storlien and Trondheim is not,
creating a need for changing engines.
Even with a diesel engine, train is the best alternative from an environmental aspect. Train is also well
adapted for bulk deliveries because it can carry heavy goods to a much greater extent than road
transportation due to the weight restrictions. Railway freight has gone through some increases in price
in recent years - for example Green Cargo raised their prices by 7% during 2010 (Rahmquist, 2011a).
This along with the fact that there are few actors in the railway market, enabling risks for lock in effects
to a much further extent, creates difficulties in both flexibility and power towards the transporter.
From the Bohus production site, which has a direct connection to the railway system, the delivery would
either go through a central hub or through dropping off the container when the destination is reached.
Since Eka has no possibility to control their own deliveries via the railway system, a transporter must be
used. This transporter must then allow for wagon loads, which is not currently an option within Norway.
When shipping from the Alby production site, the distance is much shorter to its final destination,
especially for the northern customers and the current hub in Rørvik. The short distance is a disadvantage
due to railway transports not being as dependent on the distances since the large costs arise within
handling rather than from fuel and personnel costs.
Eka has past experience of railway deliveries in Norway with a chlorate factory in northern Norway but it
got increasingly difficult to use single wagon loads and they moved more and more towards using
containers on railway before finally closing the factory. The single wagon loads increased in price and
required more administration, which was an effort from the operators (i.e. CargoNet in Norway and
Green Cargo in Sweden) to discourage it. (Rahmquist, 2011b) In order to use tank wagons in Norway it
would be required to justify its own engine for the train. More and more containers are being used on
railway today, consolidating in terminals and redistributing before the next trip.

52
4.5.2. Road transport by container
Eka currently deals with a lot of containers, both for storing capabilities and also transportation. This is
used from all three production sites and is a well-established system within Eka and its supply chain.
Even though used heavily, Eka has no equipment for internal handling of the containers. This means that
containers cannot be loaded and unloaded at the sites in order to be stored or the to make the system
more effective. A container provides flexibility and the option of storage on site, although expensive, but
is low volume per transport compared to using a tanker truck. The container supply is limited and has a
long delivery time which creates a static framework of the container system.
The deliveries of hydrogen peroxide are always done in full truck loads straight from the production site
to the end customer for non-fish farming customers. As they all have fixed storage tanks and the time
frame is less of an issue the transportation can be planned well in advance. It is still in full truck loads, no
matter if it is ISO-container or tank truck.
The principle of how to use containers is simple. They arrive on a truck which is filled by the hauler at
the production sites, and there is then the possibility of using intermodal transport means or simply to
use a direct delivery either to the customer, to a storage tank, or to a specific destination. The method is
the same for all production sites which standardizes the handling for both Eka and for the transporter,
which can then pick up the product independently of the site.
The system is flexible with small volumes and low tied up capital but, because of this, is also not efficient
and has no economies of scale compared to many other alternatives. The environmental effect is
unfriendly, combined with the exhaust and increased congestion, noise and barriers. It is, as of today,
not a sustainable option due to its dependency on fossil fuels but it has several upsides such as short
response times as well as a competitive market for the transporter.
4.5.3. Road transport by tanker truck
Just as with the road transport by container, this is also currently used at the different production sites
within Eka. All in all it is the same mode of transportation as road transport by container but has a few
other characteristics. One limitation with using a tanker truck compared to container is that the tanker
truck needs to be present when the ship arrives in the harbor. The container can simply be left there
and the driver of the truck can plan his rest-time accordingly. (representative-distributor, 2010)
The volume is larger compared to using containers but much smaller compared to the other transport
modes. There is of course a loss of flexibility when the tank cannot be left behind and used as a storage
option similar to the container. Instead, the truck is tied up as long as it holds the product. It is also less
flexible due to the lack of intermodal transportation adaptations, in order to be used in an intermodal
transport system. The product must be unloaded into another storage option during parts of the
journey. If this is done, requirements for handling hydrogen peroxide must be followed and there is the
need forspecific facilities and supervision, etc.
It is, however, a more effective use of road transport since it transports a larger volume of product each
time and limits the need for, and thereby the costs for, containers.

53
4.5.4. Air freight
When using air freight, the possible option is from an airport close to the production sites in Sweden to
an airport close to the final destination in Norway. The product must be delivered from the destination
airport by truck to the final destination where it is stored in the transportation container or in a
stationary container at the destination.
There are several limitations that apply in this option such as only 40% soluble solution is allowed for air
freight which of course is problematic when the users demand a solution that is close to 50% soluble
solution (Eka Chemicals, 1997). This would either mean increased volumes as well as another production
process after the transport or it would mean revising the entire method to adapt it to the lower
concentration.
There is also the reality that air freight would minimize or remove the usage of tanker trucks and instead
require containers adapted to the handling equipment for air freight. Since air freight is mostly
associated with high value merchandise and not bulk commodity it would be an unusual choice of
transport mode which also increases the environmental effect from transportation. The positive effects
with air freight in this matter would be short delivery times and could therefore lead to less tied up
capital.
4.5.5. Sea freight
Sea freight is only reasonable from the Bohus production site due to the distances to the ocean from the
other two sites and includes unreasonable detours. This makes the alternative irrelevant in most cases
since Eka currently prefers deliveries from the sites in Rjukan and Alby.
If this situation changes, it would be somewhat beneficial to arrange a milk run with a large tanker that
originates from the Bohus site. This would require necessary volumes in order to make it profitable as
well as ports or other unloading spots available for not only the freight vessel but also the fish carriers.
This alternative would result in tremendous tied up capital in terms of the storage of the product until
the freight vessel are filled above a minimum break-even point. There are also significant costs for the
freight vessel making it an extremely expensive mode of transportation since the freight vessel would be
in the harbor for a long period of time while being filled.
This alternative is, however, relatively environmental friendly and can handle, and supports, large
volumes. Unfortunately these specifics also make this alternative very inflexible and it would have a
hard time meeting the criteria set by the market.
4.6. Current environmental work
Eka follows AkzoNobel’s overall environmental goals and consider sustainability to be a cornerstone of
the company. Therefore the environmental aspects should be a part of the everyday work and
something that is naturally given consideration in every major decision within the organization.

54
Eka have yearly environmental reporting demands established for their transporters. They have for
example general environmental goals for the transporters which are discussed quarterly with the
transporters during the original meetings. There are four general goals which are:
1. Climate target and mitigation plan
• All carriers should have a climate target and a mitigation plan for achieving their target.
The target can for example be achieved with fuel reductions, use of alternative fuels or
increased use of train or ship.
2. Euro class
• In 2011 the lowest Euro class level acceptable for transport performed for AkzoNobel
will be Euro class 5. Exceptions can be made if a development plan for the upgrading of
the fleet is presented.
3. Eco-driving education
• Regular training in Eco-driving or BBS (where Eco-driving is one part) is mandatory for
ALL drivers.
4. Regular monitoring
• All carriers should have a monitoring system for operations and maintenance of the
fleet (fuel consumption, tires, oil, etc.).
AkzoNobel do follow-ups of the environmental performance of the transporters based on these goals
and also uses follow-up measures in order to better align with the general goals.
The hauler is performing well in the overall environmental performance. They are not one of the leading
transporters but far from being at risk of getting replaced based on the environmental aspects. They are
doing quite well for all of the specified goals but with general comments that AkzoNobel suggests that
they should be more specific and develop clear targets and plans in their environmental work.
AkzoNobel has general ambitions with their environmental work such as reducing the carbon footprint,
in terms of cradle-to-gate, by 20-25 % in 2020. This will obviously affect all transporters and put more
demands on them regarding, for example, use of Euro class 5 and 6 trucks.
The hauler is set to meet the requirements of only using trucks classified as Euro class 5 by 2011. They
do not have a large fleet of trucks but are committed to upgrading continuously and thereby doing what
is needed in order to reach the general goals.
4.7. Dangerous goods
Dealing with a dangerous goods classified product provides no real problems for Eka as long as it is
considered early on and planned for. It does limit the concentration levels allowed for road
transportation and even more so for air freight. The real problems occur in the handling, especially

55
when re-loading between storage facilities as this is the biggest risk concerning spillage and
contamination. Drivers need to be educated in dealing with hydrogen peroxide specifically (Staberg,
2011) as well as have ADR certification to transport it.
A vessel needs to be authorized for transporting hydrogen peroxide but the same rules do not apply for
the vessel when it is used as treatment vessel, meaning the fish carriers get around the rules this way.
This could, however, prove to be a problem for transportation of hydrogen peroxide to the stationary
fish enclosures and doing treatment directly in them.

56
5. Analysis The analysis will be based on eight main areas which all have different focus and thereby give different
views on the subject. The challenges are chosen from the original problem description given to us by Eka
and also on the problems found to be somewhat of a foundation for the overall problems. Every area will
describe the related problem along with the desired long term goals, considered to be 5-10 years in the
future. These long term goals have been discussed and reviewed by Eka. After this, the proposed changes
are described along with indications of the potential savings for Eka.
5.1. Market
5.1.1. Problem description
There is a large uncertainty regarding several aspects of the market. In Section 2.9. the 4Ps (product,
price, place and promotion) of the marketing mix were discussed, and these can be applied when
analyzing the current and future market.
The product is, as mentioned in the market situation described in Section 0 a commodity and is
therefore nothing that Eka can compete with in terms of quality, for example. With the handling costs
and costs around the method being rather expensive compared to other methods, the use of HP may be
replaced with new methods that appear. It can be methods both using HP as well as other chemicals.
New alternatives, however, will not be introduced at the spur of the moment, but instead will be the
result of long tests, providing an early indication of the entry of new competing alternatives. The
possibility of substitute treatments is to be taken seriously but can be foreseen early on.
The users are not sensitive towards the base price of HP, but rather the treatment as a whole which
rules out the price being a competitive advantage towards competitors. There are more negative
aspects regarding the use of HP as a method when it comes to the total price of the treatment. The fish
farmers have to pay more for this method than other methods with the product price only being a small
part of this, one-tenth, leaving the end user fairly uninterested in the price of HP. The key is instead to
have a stable and reliable method.
However, the delivery location is most definitely the main aspect for the users. The mobility of the fish
carriers performing the treatment is very limited, leaving place as the primary aspect of the four P’s. This
is problematic due to constant changes in delivery locations and requires a more flexible supply chain
because of this even though the location of Eka’s plants gives them an upper hand compared to other
producers since they are geographically much closer to the end user.
The last P is promotion, which is a significant factor now but is likely to be even more so in the future. It
includes both promotion for Eka themselves and for the method itself. With a good reputation as a
foundation, Eka will profit from this when the competition from both other methods as well as other HP
producers increases. There is also the apparent risk of not knowing when the market growth will
stagnate and mature if the promotion is not of interest.
57
It is important to build a brand in order to keep the customers and thereby secure the future demand.
Herein lies the primary problem for Eka and its collaborators, in making the supply chain the competitive
factor in the future.
5.1.2. Long term goals
Eka’s long term goals are primarily to get a mature and stable market. This will lead to a better
possibility for planning, both regarding production and deliveries as well as investments.
The volumes must also be big enough to justify the investments made and the ongoing commitment to
the market. The volumes should be large enough both in the total market and also in terms of regional
locations supporting investments such as storage. Eka must see the area as profitable even when
considering administrative costs and all the extra attention it creates.
Another key issue regarding the market is that Eka will hold a leading position on the market but not be
responsible for all of it. This way, Eka does not have responsibilities towards every customer along the
Norwegian coast and sets the boundaries and structures by being the market leader.
5.1.3. Proposed changes
In order to gain understanding of the market and be able to predict changes more easily, which is crucial
in order to make the correct decisions, Eka will need an overall good reputation. The reputation will
allow Eka and its supply chain to stay informed regarding the user’s priorities and preferences through a
closer relationship and connection to the fish farmers as well as the fish carriers.
The good reputation is important not only for Eka but also for the method itself, keeping and expanding
the overall market for hydrogen peroxide. As seen from using Porter’s five forces (section 2.8), the
competition and rivalry is not of any concern at the moment. However, the substitute products are
closely linked to the future success of the HP method. Hence, the promotion (section 2.9) and thereby
the reputation is a key factor in order to combine market maturity along with a large volume.
Reputation is an important factor regardless of which future scenario one focuses on; it will still be
critical in order to both keep and develop the market.
The supplier power must be enlarged by Eka. If they were to put more pressure and demands on the
actors within the supply chain, the complex supply chain could be simplified. It is imperative that the
demands and pressure are not too much and that it is distributed along the supply chain in order for it
to be sustainable in the long term. Through increased demands and regulations, such as order formality,
introduced to the transporter and distributor they can more easliy adapt to the future changes as well
as put more pressure on the fish carriers and fish farmers.
The buyer power should therefore be reduced in order for the supplier power to be enhanced. It is still
important to take these aspects into consideration and not disregard the customer preferences
completely. In that case, there is an apparent risk of losing the market. Since the market uncertainties
are large and predicting future demand is not within the scope of this thesis, two scenarios will be
introduced to deal with this:

58
- Scenario 1: The market matures and becomes stable at the level of 2011. This makes it a small
overall segment for Eka but still a reasonable size for continuing to operate here. The demand in
2011 is roughly twice that of 2010.
- Scenario 2: The market has kept growing and is at three times the volumes of 2011. The
treatment has most likely been refined and been successful. No other treatments have been
introduced onto the market, making it possible for the hydrogen peroxide use to grow.
Both the supplier power and the buyer power will change depending onwhich scenario the future
brings. Using scenario 1 the demands and pressure put on the supply chain can push the market into a
more volatile state. Considering scenario 2 the supplier power increases automatically and more
pressure and demands can be presented with less risk involved.
If Eka is to expand the market, they must simplify much of the process. One possibility is by introducing
a more direct customer focus, say for example focusing on dealing with the fish farms that belong to one
large actor, such as Marine Harvest. If this proves successful, Eka could focus on larger settlements that
fulfill the requirements that are pre-determined, such as minimum volumes. Currently the three biggest
harbors make up ~77 % of the total volumes in scenario 1. If Eka were to only focus on the fish farmers
that satisfy a certain volume requirement and have a working administration, the transportation would
be simplified, the handling would be simplified and the market expectation and predictability would be
simplified, all leading to lowered costs for Eka and its supply chain.
Another approach is introducing a focus on specific geographical areas as it would increase the
simplifications and further lower the costs. This alternative is especially interesting when it comes to
investments in storage tanks and will also lead to greater opportunities in placing demands on the end
user.
Both customer focus and area focus will be more favorable if the future market triples resuling in a
larger volume for specific areas and customers, creating possibilities for a selection more appropriate for
Eka. This would require a minimum volume, dependant on factors such as which harbor, storage, etc.
that are available. Comparing the fish farming industry to Eka’s other customers in Norway, there is a
much higher margin for the fish farming customers but also higher transportation costs. This can be
credited to the new market and hidden start up costs that have been a supplemented charge.
What is clear is that if the organization around this industry would become more standardized and the
volumes would increase, the transport costs could be reduced. Table 5 shows the freight cost for some
fish farming customers and a standard pulp and paper mill (P&P) as well as a very small customer in the
hydrogen peroxide special applications (HPSA) section, all within Norway. This shows the benefits from
using an area focus with increased volumes in addition to steady flows to the HPSA customers, even
though they are quite small. All these transport costs are from the same hauler.

59
Table 5, Percentage of freight cost using container as primary transport, calculated per ton.
Fish farms Non-fish farms
To Bergen Herøy Ottersøy Ottersøy P&P HPSA
Production site Rjukan Rjukan Rjukan Alby Rjukan Rjukan
Freight cost of tot. 18,3 % 29,9 % 33,8 % 21,3 % 10,8 % 13,1 %
When considering possible focus areas, Eka must also take into account the risks associated with only
focusing on specific areas or customers. If the market triples then there are fewer risks associated but
they still may remain. There is also a risk of damaging the overall reputation if Eka chooses not to deliver
to certain areas, hindering the development there. With a damaged reputation it can be difficult to
return to areas or customers previously neglected. In other words, when focusing on, for example, areas
the potential market decreases and the risks involved increases.
5.1.4. Potential savings
The potential savings related to the market are hard to predict and extremely dependant on factors
outside of Eka’s control, and the only way to consider the repercussions is to present different aspects
of the effects.
Table 6, Contribution margin ratio using tank trucks as primary transport, calculated per ton.
To Bergen Herøy P&P HPSA Ottersøy Ottersøy
Production site Rjukan Rjukan Rjukan Rjukan Alby Rjukan
Contribution margin ratio 41,0 % 38,4 % 17,9 % 51,2 % 50,1 % 35,1 %
As seen from this table, there are significant differences in the contribution margin ratios to the
different customers. The contribution margin ratio is: (Price – Variable Cost) / Price. Variable costs
include items such as production, freight and container cost. It should be clearly noted that these figures
do not cover overhead costs and other administrative costs and that the margins in this case is only the
contribution margin and therefore not the total profit margin.
The contribution margin differs quite heavily, not only between the segments but also among the fish
farming industry as well as between production sites. This implicates that there are clearly some areas
that are more suitable than others, i.e. more profitable, which increases the positive effects from a focus
on certain areas as well as certain customers. The fish farming industries all have high margins, even
though they differ quite a lot. Alby - Ottersøy stands out with the highest contribution margin ratio
related to the fish farming industry.
These contribution margin ratios show the need for Eka to follow-up all related costs and should provide
a basis for future strategic investments, which should be aligned with Eka’s overall strategy as well as
the future aspects for the fish farming market. It is important to recognize the differences between
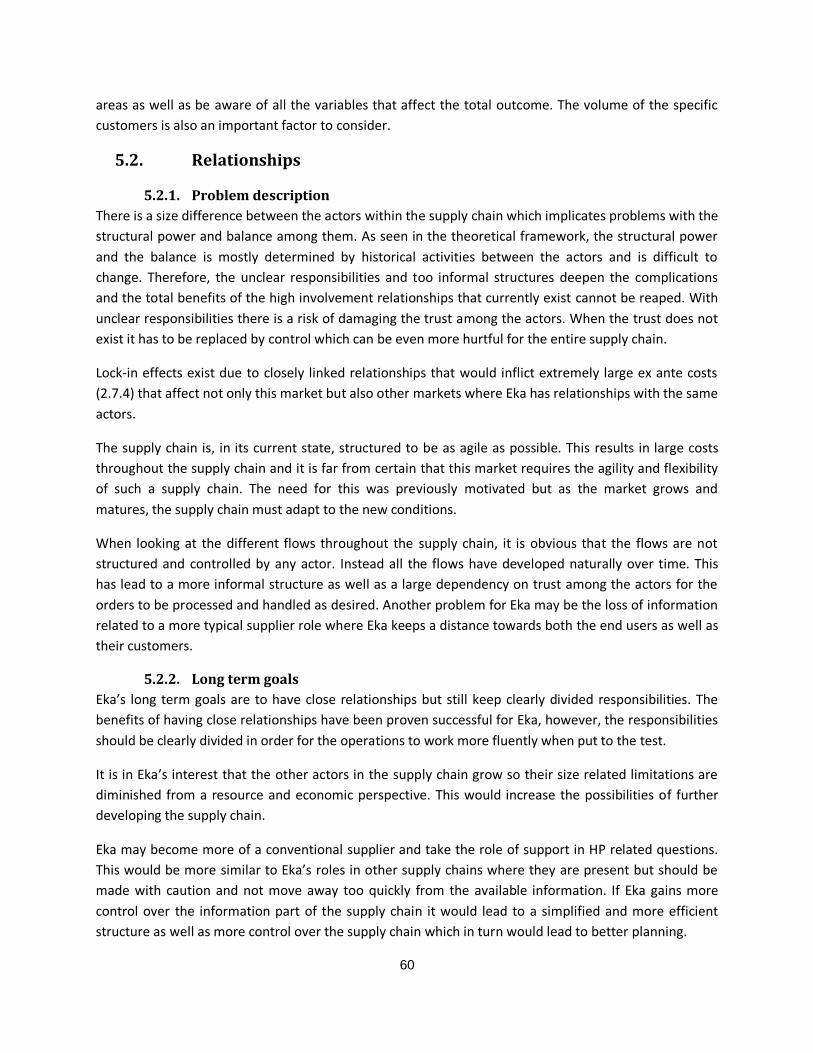
60
areas as well as be aware of all the variables that affect the total outcome. The volume of the specific
customers is also an important factor to consider.
5.2. Relationships
5.2.1. Problem description
There is a size difference between the actors within the supply chain which implicates problems with the
structural power and balance among them. As seen in the theoretical framework, the structural power
and the balance is mostly determined by historical activities between the actors and is difficult to
change. Therefore, the unclear responsibilities and too informal structures deepen the complications
and the total benefits of the high involvement relationships that currently exist cannot be reaped. With
unclear responsibilities there is a risk of damaging the trust among the actors. When the trust does not
exist it has to be replaced by control which can be even more hurtful for the entire supply chain.
Lock-in effects exist due to closely linked relationships that would inflict extremely large ex ante costs
(2.7.4) that affect not only this market but also other markets where Eka has relationships with the same
actors.
The supply chain is, in its current state, structured to be as agile as possible. This results in large costs
throughout the supply chain and it is far from certain that this market requires the agility and flexibility
of such a supply chain. The need for this was previously motivated but as the market grows and
matures, the supply chain must adapt to the new conditions.
When looking at the different flows throughout the supply chain, it is obvious that the flows are not
structured and controlled by any actor. Instead all the flows have developed naturally over time. This
has lead to a more informal structure as well as a large dependency on trust among the actors for the
orders to be processed and handled as desired. Another problem for Eka may be the loss of information
related to a more typical supplier role where Eka keeps a distance towards both the end users as well as
their customers.
5.2.2. Long term goals
Eka’s long term goals are to have close relationships but still keep clearly divided responsibilities. The
benefits of having close relationships have been proven successful for Eka, however, the responsibilities
should be clearly divided in order for the operations to work more fluently when put to the test.
It is in Eka’s interest that the other actors in the supply chain grow so their size related limitations are
diminished from a resource and economic perspective. This would increase the possibilities of further
developing the supply chain.
Eka may become more of a conventional supplier and take the role of support in HP related questions.
This would be more similar to Eka’s roles in other supply chains where they are present but should be
made with caution and not move away too quickly from the available information. If Eka gains more
control over the information part of the supply chain it would lead to a simplified and more efficient
structure as well as more control over the supply chain which in turn would lead to better planning.

61
5.2.3. Proposed changes
The proposed changes are closely interrelated to the problems related both to the market as well as the
information structure. The areas are all closely linked and therefore the changes will make a difference,
not only within their own area.
In order to solve the problems described, it is important that Eka manages to divide the responsibilities
along the supply chain. This can be done through letting the distributor be more responsible for future
markets and forecasts and the hauler responsible for the requirements related to the transports. Letting
the distributor be responsible for the end users and future strategic areas, etc. can be handled through a
larger incentive for them in optimizing the customer basis, for example requiring the distributor to
confirm every order well in advance and hold them accountable for any changes.
This will lead to a better structural power and balance since the control is divided along with the
responsibilities. Through this set up, there are better chances for a good mix of the stability brought by a
large actor, such as Eka, and the flexibility and agility provided by the smaller actors, the hauler and the
distributor. This mix would also further improve the power structure and the balance which would not
only improve the efficiency of the supply chain but also increase the competence trust in a longer
perspective while upholding the goodwill trust as well as the contractual trust (2.7.5).
In order to see differences over time as well as making sure the entire supply chain is on the right track
Eka would benefit from evaluating the actors from time to time, to help the actors in the supply chain
reach their goals (2.7.6). The evaluation should be done on a predefined basis where the factors of key
interest are measured. The ex posts costs (2.7.4) must also be taken into account in order to see how
valuable the relationships are, information on the monetary risk is especially of interest to Eka.
The agility and flexibility throughout the supply chain is of great value for the customers. However, this
is very costly and there is no need for the level of agility shown so far as the market slowly enters a new
phase with more predetermined customers and deliveries. If further demands and restrictions can be
put on the actors and thereby the end users, the costs can be reduced further. This is very much up to
the distributor to impose, but in order for them to put demands on the end users, Eka must put more
pressure on the distributor where necessary, such as in the area of the order handling.
If Eka were to switch transporter due to the hauler being found to be too expensive, extra costs would
arise such as lost flexibility and thereby market shares. As seen in the theoretical framework (2.7.2),
there are large benefits in high involvement relationships after a certain amount of time. There are also
other economic consequences to consider such as ex ante costs, the costs of switching supplier.
There can also be a loss of trust and other benefits if the hauler no longer were required for the fish
farming industry, which must be taken into account if evaluating the idea of switching supplier. It is
largely due to the hauler that the market has emerged and their knowledge is still very valuable for the
supply chain. This makes switching transporter not an option at the moment. However, Eka should see
the possibility of using another transporter in areas were the hauler clearly has difficulties such as the
route between Alby and Ottersøy. Also, considering scenario 2, the increasing volumes may very well be
a problem for the hauler which is not easily handled with them as the sole supplier of transportations.

62
Therefore, Eka is in that case wise to include other transporters in certain areas to relieve potential
problems with the hauler.
5.2.4. Potential savings
The potential savings related to the relationships are the costs linked to the hauler not being able to
perform at the optimal level for Eka and the supply chain. Currently this is natural due to the market
evolving at a rapid pace but should be considered in the near future, for both the scenarios.
Other potential savings are difficult to develop further since the proposed changes all lay a foundation
towards implementing the other proposed changes.
5.3. Information structure
5.3.1. Problem description
There is currently a lack of clear routines between the actors in the supply chain. As described previously
in the analysis of the relationships, the lack of routines affects the relationships between them and also
affects the efficiency and the ability to understand the changes in the market and among the end users.
The problems related to information structure are therefore closely linked to how the relations are
structured which in itself is a potential improvement for Eka.
The official orders are placed too late for the supply chain to work efficiently. With late orders comes
late information and late decisions which increases the need for flexibility and therefore the related
costs. With less supervision and control of the information, Eka is therefore dependant on the trust
towards the other actors without many possibilities of making the order handling easier throughout the
supply chain.
This also results in much risk for Eka. The transport aspects are necessary to take into account since Eka
often have no time to react or to modify regarding where the product is located or its final destination.
Another aspect is the apparent risk of Eka being left with large costs, such as containers in the short
term, when there are changes in the market that otherwise would have been spotted earlier if there
was a more structured information flow.
Another large risk for the supply chain is the dependency on a few individuals located at the different
actors. These individuals possess great knowledge and valuable understanding as well as many
important connections within the industry. If this is lost the entire supply chain is affected and at worst,
diminished. The supply chain is therefore too fragile to be able to further invest and commit to the
industry.
5.3.2. Long term goals
It is in Eka’s interest to structure the order handling flows in a clear and more logical way. This applies
both to product and to transport orders throughout the supply chain. With a separated order handling
of product and of transportation, the true demands can be more easily monitored.
An order done through the correct channels and in time, not only saves money with regards to a more
efficient use of resources and time, but also eases the possibilities for different follow-ups needed to

63
Figure 20, Suggested ordering flow.
simplify the communication and activities. This is however not usual for Eka since the orders are not
always done properly and on time even in stable markets. A big difference is, however, that those
markets have a more easily monitored output and demand along with a more standardized supply
chain.
5.3.3. Proposed changes
In order to best handle the information structure it is important to realize the full potential of the supply
chain. If the supply chain would work more efficiently the order flow of the product and of the transport
would be separated. This would create a more structured approach which is needed for an
uncomplicated handling system without too much administration.
The physical flow as well as the monetary flow should not be changed since they are simple and
direct,;this also can be said about the ownership of the product. However, the information flow as well
as the order handling can be improved substantially. Most importantly it might be the mindset that
needs to change about how orders are traditionally handled at Eka. An alternative to the current order
handling is visually described in Figure 20.
Eka cannot make any changes in the initial order handling so therefore it is assumed to be the same as
described in the empirical references (Figure 14). Instead, when the distributor receives orders and
information regarding the outlook of the market they make a preliminary order to Eka, which should
take place two weeks to one month prior to delivery. These orders should contain the amount needed
as well as be specified to what region it should be delivered and when. The order is confirmed by the
distributor as early as possible with a minimum requirement of days prior to delivery date, for example
three working days or what is most suitable for every actor. This provides Eka with the information
needed in order to plan the deliveries as well as the production output.
The hauler gets the order, both the preliminary as well as the confirmed order through the SAP system.
Since they receive information regarding both time and place they can take advantage of economies of
scale along with deliveries to other customers. For example, the deliveries from Alby to Ottersøy could
be planned better and therefore increased which would be less costly than shipping from Rjukan.
The distributor
Eka Chemicals
The hauler
Fish carrier
Fish farm Veterinarian
Pharmacist

64
It will be important that the hauler confirms the delivery, both prior to delivery as well as after. This is
done in order to better control the output flow of the product sold and how the product was allocated.
It will provide all the actors with better information regarding both the customer needs and also the
efficiency of the supply chain. Through this, the distributor will also receive confirmations regarding that
the product has been delivered according to the agreements.
The order handling should not be compared to the information flow and be as simple and
straightforward as possible to minimize the administrative costs and unnecessary activities. Information
will still be exchanged freely among the actors, to keep everyone updated on how the market is
changing as well as keep a certain degree of flexibility. This is to ensure the trust is kept and that all
information is visible to every participant.
In order to better take advantage of the separated order handling it is crucial to perform follow-ups. This
should measure certain key points and the service level specific to the needs and desires from the actors
along the supply chain. As described in the theoretical framework (2.2. ), the service level can be defined
in different ways and should be treated thereafter. For example, it is easy to monitor the actual demand
for every region which can be valuable information when deciding whether to expand to certain areas.
Follow-ups are crucial in understanding how the collaboration is performing and without it no
improvement areas can be identified. The importance of improving every part of the supply chain will
continue to grow as the entire market grows.
Eka has service levels that are centrally controlled in every SLA (Service Level Agreement) which state
the agreed upon levels for delivery on time and the required loading on time. The problem here is that
every transporter is liable to report this by themselves and no special attention is given to it. With the
proposed increased usage of SAP, this would automatically transform into service levels and make the
follow-ups more visible.
5.3.4. Potential savings
The potential savings to be made are hard to predict since the changes mostly affect the overall factors
such as better planning and a more feasible market control. However, possible potential savings may
arise especially in the administration around the order handling. With less administration there can be
significant cost reductions in a longer perspective, especially if this is extended to include other
industries outside of the fish farming segment. One must acknowledge, as seen in the theoretical
framework (2.7.3), that the economic consequences of relationships are not always as clear as one
might expect. It is an apparent risk that the local administration may increase when shifting the order
handling which could present difficulties when implementing this alternative.
For example, if the order handling would be improved the planning would be made in advance. Hence,
the deliveries that are not a full truck load, outliers, could be minimized and thereby savings would be
made through fewer transports.
Table 7, Cost of outliers for freight during 2010.
No. of outliers Current freight cost Volume Savings

65
2010 7 € 28 826 149,5 ton € 10 170
Scenario 1 - - - € 20 999
Scenario 2 - - - € 62 997
Table 7 shows the potential savings if the outliers where minimized and instead driven in full truck loads
with tank trucks. As seen, the savings are almost one third of the freight cost for these transports. The
potential savings for scenario 1 are more than twice the amount in 2010 due to the estimated doubling
of the market. However, if the pressure increases on the supply chain during 2011 there is an apparent
risk of requiring more outliers leading to further potential savings. The opposite can also be true as a
more efficient supply chain will lower the number of outliers. The savings presented for scenario 1 and 2
are assuming the same percentage of outliers as in 2010.
In the shorter perspective there are no direct cost reductions that are feasible within the information
structure. Instead, this will help other savings to take place, described in the other sections. For
example, the transportation can more easily be planned and therefore the costs can be lowered, both in
terms of better planning and the possibility of using economies of scale and also through a better
possibility of following the theoretically calculated allocation.
The risk of the existing information structure is that it might break down when the volumes increase.
Therefore this alternative can be seen as an investment in order to ensure savings further on. A more
efficient supply chain can also lead to an improved reputation for the supply chain which can provide a
natural growth within the existing market and thereby lower costs through economies of scale. A well
working information structure may be a requirement for the future market.
5.4. Seasonal variation
5.4.1. Problem description
The distributor is Eka’s only customer which has a demand with seasonal variation. The size of Eka’s
other customers range from small to very large, but are usually quite stable in demand, creating an
unfamiliar procedure for Eka in this case. It causes problems with the storage only being used for a short
time of the year, adding additional costs when bringing containers back to the production sites and
limiting the usage of tank trucks. It gives no incentives for the hauler to dedicate equipment and vehicles
to the fish farming industry as there are no guaranteed volumes for each month.
Irregular flows will also increase the need for maximum storage at the customer, currently in the form of
containers, which is an expensive type of storage. Eka has a production process that is highly dependent
on it running at a stable and continuous level and it will add complexity to the planning if the seasonal
variation continues growing. As this is a unique situation for Eka, it will be treated as a separate issue
compared to increasing volumes and different changes will be proposed.
5.4.2. Long term goals
In an ideal world, Eka would have even output from its production sites over the course of the year,
delivering full truck loads straight to customers without the need for inventory, but this is rarely the

66
case. In reality, it is desirable to even it out as much as possible, with the use of storage, to make the
transportation able to have steady flows, lowering transportation costs.
To achieve this, Eka wants to work with everyone involved in the supply chain to reduce the peaks in the
seasonal demand, even if the actual usage of the product will still be centered on some specific months.
This is primarily due to the governmental regulations that are in place and unlikely to change. Eka can
use strategies as well to lower the peaks, for example by implementing a price differentiation strategy.
5.4.3. Proposed changes
Standard ways of fighting seasonal variation (2.4. ) are either to use chase or leveled production plan
where chase is not relevant in this case as the output is already at a constant maximum (4.3.1). A leveled
production schedule could be used in the sense that an inventory is built during the months of no sales.
If the inventory is at the production sites, the transportation would still experience seasonal variation
and become a constraint. As discussed in 2.5. concerning centralized or de-centralized warehouses, the
product in question is not being consolidated at any point or divided for different customers. Because of
this and the high costs of additional transport, it is more suitable for direct deliveries to de-centralized
warehouses which act as the final destination for land transport.
The de-centralized warehouses would need to be in connection to a harbor which is used on a regular
basis to increase the utilization. On the other hand, if storage is to be built along the coast of Norway,
several depots would be needed; either formed by ISO-containers or fixed storage tanks. These depots
would in turn act as the hub in a split point system where the boats act as last mile transport vehicles. At
the volumes of scenario 1, a depot consisting of containers is preferred as it provides flexibility and the
volumes just are not there yet.
If the volume would triple, as scenario two suggests, it would suddenly become unworkable with
containers, as the administration to keep track of them and have them shipped back and forth for
maintenance outweighs the investment cost of a storage tank. For the sake of argument, say volumes
increase as in scenario 2 and everything should be stored in containers. Taking the fastest growing
harbors Fosnavåg and Bergen and the largest harbor Ottersøy, they would each require 4-5000 tons of
solution per year. With the current seasonal variation, that means these harbors will peak at 1000 tons
per month, amounting to 30 tank trucks delivered in a month. If it is assumed that the demand is linear
over the month that means 250 tons are needed each week or 8 tank trucks. Turning this into a case of
estimated storage tank costs and a simulated smoothed demand will look as follows:

67
Figure 21, Modified demand and leveled transports.
The size of the storage tank is based on the maximum inventory needed, in this case a 300 m3 tank. A
further aspect in this is that some of the demand is shifted towards the summer, for two reasons; the
first being the utilization of fish carriers is evened out and the second being that Eka could offer a
discounted price on hydrogen peroxide during the summer months. Details of this are found in
Appendix A but summarized it is shown that the investment could be profitable when considering the
savings from reduced container usage and if there was a negotiated price drop by The hauler of a
minimum of 15%. Anything above this would be pure profit from Eka’s side and should be possible due
to the current high prices for freight to fish farmers. This is based on the fact that the hauler would gain
from this by having a fixed tank to deliver to and primarily that they would be guaranteed a quite
substantial minimum volume each week.
The above scenario assumes that the demand could be influenced, but that is something that is not
unreasonable as even during 2011 there is a tendency of it being smoothed out as some farms have
already planned to do treatments in May. A discount in price, as described in section 2.4, was calculated
for the months where treatment is generally not done, providing incentives for the fish farmers to
schedule them off-season. It may also be possible that it will be more viable in the future of different
areas doing treatments together, starting in the south for example in March and southwest in April and
so on.
5.4.4. Potential savings:
Estimating the potential savings of lowered seasonal variation is unreasonable and requires quite a few
estimations to be made. The proposed storage tank of 300 m2 will bring many benefits to the supply
Jan Feb Mar Apr Maj Jun Jul Aug Sep Okt Nov Dec
Demand 10,9% 9,1% 9,5% 9,5% 5,9% 3,9% 3,9% 5,9% 7,1% 12,0% 12,0% 10,2%
Deliveries 8,3% 8,3% 8,3% 10,4% 6,3% 6,3% 6,3% 6,3% 9,4% 10,4% 10,4% 9,4%
Inventory 3,8% 2,6% 0,8% 1,1% 1,1% 3,0% 5,0% 5,0% 6,7% 4,4% 2,1% 0,7%
0,0%
2,0%
4,0%
6,0%
8,0%
10,0%
12,0%
14,0%P
erc
en
tage
of
tota
l de
man
d

68
chain and allows for most stable flows of goods to this location. It will be incentivized by a reduction in
containers and transport savings primarily, specified in Table 8. The summary from the investment
calculations are in Appendix B. This shows an IRR of 14,2 %, which Eka deems enough and a payback
period of 5,3 years that can seem a bit long for a 10 year investment.
Table 8, Flattened demand and storage tank with increased volumes.
Changes
Investment € 566 000
Price differentiation cost (5 %) € 25 478
Container savings € 47 450
Transport savings (15 %) € 102 288
Decreased tied-up capital € 3397
Internal rate of return 14,2 %
Payback period 5,3 years
As this is based on a transport saving of only 15%, there is still much to gain in this department as
transport costs would still be considered high. The lowered transport costs can be motivated by
guaranteeing a minimum volume, smoother delivery to a fixed tank in a fixed location and economies of
scale from scenario 2 volumes.
5.5. Increasing volumes
5.5.1. Problem description
Determining the demand one or two years in advance is very hard in this uncertain market. The reasons
for this have been discussed previously and the effect it has is primarily that investments will be hard to
justify in the short time frames without taking excessive risks. This section on increasing volumes will
instead focus on where limitations will arise if the demand keeps growing at this pace. As this is a HPSA
area for Eka which is showing promise the increasing volumes will be looked at favorably as long as the
product can be delivered with the same service level and quality. If Eka would simply start selling
hydrogen peroxide to every fish farmer without bothering to test the boats, the quality would soon drop
and Eka’s and the distributor’s reputation with it.
Going back to the limitations of increasing the volumes, the first one is the availability of the fish carriers
where the treatment is performed. There is not an unlimited supply of these and they are expensive to
use, although more are being built and some are being put into circulation this spring. If this limitation
was circumvented the transportation of HP would become the next bottleneck in the supply chain. As
this is a more then usually complex supply chain for Eka, it has some problems now that would become
more obvious as volumes increase if the key people in the chain are not able to cope with the amount of
information anymore.

69
The output from Eka’s production sites has been a problem at times, but as the market grows so will the
confidence in it from Eka’s side and it will become more of a priority. It does not fall within the scope of
this thesis to decide what markets Eka should focus on and which ones are most promising, as discussed
in 4.4.3. A final limitation which can arise is the relatively small size of Eka’s partners, the hauler and the
distributor, who both would need to grow in order to satisfy the market demand.
5.5.2. Long term goals
This is closely linked to the long term goals in the market section, with it reaching a stable level while
still being enough to make this profitable for everyone involved. Eka wants it at reasonable levels which
they can handle and perform well with realistic service levels that rely on either storage close to the
customer or increased transport possibilities. They do not wish to be the sole supplier of HP in Norway,
just as was pointed out in the market section of the analysis. For this supply chain to succeed there must
be a more detailed information structure and formal communication. As this is an expanding customer
segment, the opposite to most of Eka’s other customers, there is potential to grow and this is something
Eka wants to explore further.
5.5.3. Proposed changes
The changes in this section will mainly focus on removing or reducing the limitations and the risks that a
growing market brings. From Eka’s side it is hard to influence the production of fish carriers except with
respect to providing a stable and safe treatment in the boats, raising the profile of this treatment. Eka
should continue their testing of ships before they perform live runs and by doing so, ensure the quality
of the treatment. It may also be advantageous to ensure that an area needs a minimum level of product
before starting up there, to ensure that the desired service level can be reached within reasonable time
frames.
One thing they are working on to reduce this limitation of the fish carriers is to perform the treatment
directly in the fish enclosures, reducing the need for the expensive fish carriers. This would also require
more hydrogen peroxide per ton of salmon but would still be outweighed by the reduced cost from not
needing fish carriers. The transportation limitation can be addressed by two different approaches, one
referring to the solutions of seasonal variation. This would mean there are even flows of transportation
and no high peaks in the demand.
Another solution is to give the hauler longer notice of when a transport needs to be performed so they
can plan for it and utilize their vehicles better. As there currently is a tendency within the supply chain to
be reactive instead of pro-active, a behavioral change needs to happen concerning late orders and lack
of planning. Hopefully this is something that can be addressed from the perspective of information
structure and that everyone will realize this must be done to have a functioning organization for when
the volumes increase. If the increased volumes can enable the hauler to increase the use of tank trucks
for most distances, the freight costs can be reduced substantially.
Table 9, Modified average weights for transportation and savings for 2010. All numbers in tons unless otherwise
specified.

70
Allocation Savings
Production site Alby Bohus Rjukan 2010 Scenario 1 Scenario 2
Current average weight: 29 28,4 27,9 - - -
New average weight 1: 32 29 32 € 63 344 € 124 998 € 374 993
New average weight 2: 33 30 33 € 78 530 € 154 965 € 464 984
Table 9 shows the potential savings from using tank trucks over containers during transportation,
primarily due to the prices being based on trips rather than volume. This is based on the data received
concerning 2010 and during that time period 78% of the transports were done with containers. Some of
the low average weights can be warranted by some testing volumes being sent in the startup phase or
results of hasty orders needing quick deliveries. Every container used in transportation will reduce the
average weight but some containers moved back and forth will most likely be necessary to keep some
flexibility in the supply chain, which is why the average weight 1 does not entirely consist of tank trucks
and still has 20% of containers in the transportation.
Increased volumes will also likely place Eka in a favorable negotiation position towards the hauler as
both will gain from having steadier flows. An increased average weight is not only a gain in monetary
terms but also reduces the external effects that will be discussed later on in this chapter.
As Eka wants to reduce the risk they take in all aspects of the supply chain, the unknown growth of the
market does not ease this in any way. Using the pre-determined scenario of a large increase in volume,
several positive effects will follow, the primary being that the hauler can be ensured of having stable
flows, providing better utilized transportation. Another effect is that the distributor and hauler can grow
together with the market, as discussed in the relationship section of the analysis, which reduces the
risks for Eka and this is what has happened with the Swedish haulers they use for the bulk of their
transportation. They started out as small family haulers with a few trucks and have now grown so that
they can provide Eka with the necessary transportation.
5.5.4. Potential savings:
The benefits are that increased volumes provide economies of scale for Eka and give them a better
negotiation position towards the transporter with benefits for both parties. A more intangible product
of this is that the service level will increase with steadier flows and having the product located closer to
the customer. The one saving that is obvious and dependent on fixed cost per delivery is that if average
weights would increase, costs can be reduced significantly (Table 9).
The negative aspects of keeping storage close to the customer is the investment cost of this and that the
product is quite spacious, demanding certain volumes and requirements on storage.

71
5.6. Transportation modes
5.6.1. Problem description
As mentioned in previous sections, it is favorable to limit the use of containers for several reasons; the
long lead time to obtain more containers, the administration to keep track of them and the cost most of
all. Eka leases the containers and passes on some of the cost for them to their customers but the
positive effects of lowering the number of containers in general still outweigh the negative. Especially as
the problem is the growing dependence on containers and it will only increase as the market grows.
A basic concept in transportation is that ‘the larger the carrier, the lower the cost per unit’ and this is just
as true in the case of bulk transportation. It does, however, bring additional costs in the form of tied up
capital and perhaps more importantly, in moving more product from Eka’s internal storage to remote
locations in Norway, ending up with less safety stock for remaining customers. Focusing on the
transportation and its alternatives, Figure 22 shows the benefits summarized from different transport
modes. This figure demonstrates that air for example is useful for small volumes of high value goods
that are time sensitive and where cost is less of an issue. Sea is in many cases the opposite and should
be used for large volumes of bulk material that can be transported with long lead times.
One can quite easily eliminate both sea and air as the volumes are not large enough to justify a sea
transport and the volumes are too large for air to be a candidate. This requires no complex calculations
but rather common sense to realize that only the Bohus production site would be adaptable to sea
freight but this is the least optimal production site for Eka at the moment, when considering the bigger
picture. For airfreight the reasons are also obvious - it brings additional limitations on concentrations
during transport and this together with the fact that it is a bulk product, makes air a poor choice.
Road transportation is the only option used currently, both with containers and tank trucks, providing
the problems already mentioned in the increased volumes section. A railway solution could improve
several aspects of the supply chain even if it might increase the lead time and the handling costs. A
direct train route and combinations of rail/road will be considered in the proposed changes. A positive
effect that makes it interesting to Eka and the main reason for them to want to explore this further is
the reduced environmental effects from railway. Train has been successfully used in prior situations in
Norway for Eka, but they have no rail transportation in Norway currently and railway is dependent on a
very limited infrastructure. Problems will also occur depending on what type of railway transport is
Figure 22, Transportation benefits per mode.

72
chosen. If it is containers on railway, more containers would be needed due to longer lead times and if it
is tank wagon, there needs to be locations for re-loading the HP to trucks for the last part of the journey.
As hydrogen peroxide is classified as dangerous goods (classification 5.1) there are certain limitations
with respect to transport and handling. Every driver needs a standard ADR-license and in addition they
need to have basic instructions from Eka in order to do the fill ups and drop offs of the product. It can
also cause problems when they are meeting the fish carriers in certain harbors, as these can be heavily
frequented by pedestrians and other cargo. Another aspect is the re-loading during railway transport
that can pose problems in the goods station.
5.6.2. Long term goals
Eka wants a transportation solution which is environmentally sustainable, cost efficient and provides the
necessary service level to its customers. It should be adaptable to a growing market and the risk of
increased freight costs. The structure around the chosen transport mode should also be changeable
depending on volume when it comes to storage facilities.
The final strategy should not only consider current volumes for the fish farmers, but also be adaptable
to growing synergy effects from other Norwegian customers, perhaps making a previously discarded
option viable.
5.6.3. Proposed changes
The choice between tank truck and container has been shown to be very important due to the freight
costs being based on trips rather than a price per ton and the extra cost that a container brings (5.5. ). If
the transport containers are reduced, more could be used for storage if no tanks are implemented or it
can be seen as a reduced cost for Eka. With the market growing, so will the number of containers and it
can reach unreasonable levels in a few years. Another option is to get a proper control system for them
so that Eka can track them and use them more strategically.
Implementing a railway option comes with some restrictions, first and foremost is the infrastructure and
state of the current railway. The most likely choice, in the example of Alby - Ottersøy, for delivering by
railway is to transport it by train from the production site in Alby to the train station in Trondheim.
However, this route is currently not in use, instead, the possible route is from Alby, down south to
Kristineberg, close to Karlstad, Sweden, and then up into Norway to Trondheim.
From there truck must be used for the last ~213 km of the journey. This is obviously not a straight trip
and adds much extra distance but is the only possible option currently. In order for the shorter route to
be an option, the volumes in scenario 2 must be realized. Since the handling and reloading of dangerous
goods requires permits in Norway, the reasonable alternative is to use containers instead of tank
wagons. (Westring, 2011)
As seen in Table 10, the total costs of shipping via railway and sending via truck from Trondheim-
Ottersøy is larger than sending it by both container and tanker truck directly from Alby. The rail
alternative is calculated through estimation that Trondheim-Ottersøy has the same cost/km as the
container and tanker truck option. For train to even be considered, a stable flow with large enough

73
volumes must be established, which is only applicable in scenario 2. Even then, the rail is only an option
if the shorter route, Alby-Trondheim, is possible and thereby lowering the freight cost for the rail option.
Table 10, Freight cost/ton Alby – Ottersøy.
Alby - Ottersøy Container Tank truck Railway
Cost € / ton 108 92 112
Freight costs scenario 2 € 552 603 € 468 875 € 571 620
As Eka has more than the fish farming customers in this region, synergy effects can most likely be
established with other customers and make rail a more viable option and through using a split point
system (2.6. ) there can be economies of scale in transporting large amounts of HP to a selected hub
somewhere in Norway.
Another situation where rail is the best alternative is for supply to the most northern parts of Norway
where there might be potential customers. This might lead to possibilities of using the heavily
frequented iron ore rail line between Kiruna and Narvik in Norway. But this is still several years into the
future and not something considered in this thesis. The risks of a more complex chain need to be
considered as well as the increased lead times that brings tied up capital and loss of flexibility.
The dangerous goods part of the transport is something Eka is used to and so are their haulers, from
having ADR-licensed drivers to using the approved routes properly. The only limitation it brings is that
Eka needs to approve the drivers personally in filling up the trucks on Eka’s sites, due to safety
regulations for everyone involved. The re-loading has not been a problem for the transport when using
trucks but if a train option is to be considered, the availability of an authorized re-loading location for
tank wagons need to be conveniently located.
5.6.4. Potential savings:
The potential savings regarding transportation mode is primarily when using tanker trucks instead of
containers. There will be a lowered total freight costs described in sections 5.5. & 5.6. as well as
environmental effects described in section 5.8.
Railway is unfortunately not an alternative at this point. It will only become an option if the route Alby-
Trondheim is up and running which is only plausible in scenario 2 but far from certain. The total cost for
this alternative can be assumed to be lower than the rail alternative of shipping via Kristineberg even
though using a diesel driven engine is not as good as an electrified.
5.7. Allocation
5.7.1. Problem description
With the Nordic production of hydrogen peroxide spread over three locations, the allocation of product
from the right source to the right customer is essential for Eka to minimize freight costs. This is
calculated with the tool WhatsBest and planned production stops for maintenance are considered. The

74
problems arise when haulers are given too much leeway in deciding where to get the product, sub-
optimizing in specific situations. Haulers have been given a lot of responsibility of the supply chain and
being in control of the storage tanks and the levels the customer needs to stay up and running until the
next delivery. Eka saves money from not having to be involved in this but for the HP to the fish farming
industry, this has started to become too costly due to the high freight costs involved.
It is easy for a hauler to argue that they have a truck close by at site A and ready to go when Eka in
reality would want them to get product from site B. In this specific situation, it is more beneficial for Eka
to agree to it and pay the increased freight cost. What is not properly considered is why the hauler did
not follow the guidelines for sourcing in the first place and how Eka can try to influence this without
showing distrust towards a hauler that is performing well in all other areas.
There are several contributing factors behind the reasons for not wanting to be locked in to any specific
routes. One is that Eka can gain new large customers in north Sweden that change their desired
allocation. Another is that the volumes can be reduced overall and depending on where the optimal
allocation is at the moment, different sites may reduce their production.
5.7.2. Long term goals
Eka does not only desire to use the production site which is the most cost efficient based solely on
freight costs but also takes into account all of their customers to find a theoretically optimal solution.
The optimal solution changes on a monthly basis as customers come and go to some extent. This creates
a need for Eka to have a flexible system that is not locked into fixed flows over an extended period of
time.
5.7.3. Proposed changes
The changes for allocation are closely connected to the ones for relations and information structure,
concerning the amount of responsibility given to the haulers and a more formal information structure
limiting the hauler’s choice. If a formal request for transport would go through the proper channels and
end up at the haulers, no choice of allocation would be possible, keeping not only the control at Eka but
also an increased cost due to the administration required. Eka has a desire to keep close relationships
with their haulers which is favorable in most situations and this would need to be considered in deciding
who controls the allocation.
Running WhatsBest has shown that a large part of the deliveries during 2010 were actually sourced from
the “wrong” location based on freight cost and the overview perspective. This is due to the immature
business of delivering to the fish farms and a very active hauler having a lot of influence, which has been
a key factor for this market to grow. Another important factor of this is that WhatsBest is used as an
advising tool within Eka and very little follow up is done to ensure that proper allocation is being done.
For this market to be successful a flexibility and especially speed towards the customer was needed to
satisfy unplanned demand and therefore some of the allocation can be due to taking the first available
transport. The results show a minimum of four trips in September using the non-optimal allocation,
confirmed by WhatsBest and the general outline towards the hauler to use Alby for deliveries north of
Frøya.

75
The allocation for 2010 is presented in three cases (Table 11), one being the one actually used, another
one for the optimal solution concerning freight cost and finally one using the original setup but
allocating 80 % of the transports to Ottersøy from Alby. The savings quite clearly show that due to the
volume advantage of Ottersøy it provides the largest entry in terms of savings. Notable is that 100%
correct allocation is unlikely to be realistic as there are planned production maintenance stops that will
affect this as well as the arrival of new containers for example, that will be filled up in Bohus before
being delivered. This will show as a non-optimal solution overall but in reality it will be the most efficient
use of resources in a given situation.
Table 11, Allocation for 2010 volumes and potential savings with the same average weights. Note: freight costs are
the same for Alby and Rjukan to Herøy.
A solution to the allocation problem can be to engage with another hauler for the transport going from
Alby to Norway, that may reduce the cost for this, in terms of freight cost, but the cooperation may be
damaged in other parts, which is undesirable. If the volumes turn out to be overwhelming for the
hauler, a natural transition for this may happen, in a time when the market has matured and become
more standardized regarding transportation.
5.7.4. Potential savings:
Proper allocation gives clear and direct flows within the supply chain in addition to the reduced freight
cost, a sum that, for example, amounts to over 35 % of the revenue for Rjukan – Ottersøy. This would
need to be solved without receiving the cost of positioning trips from the hauler, as these numbers
account for no such costs.
Table 12, Summarized from the above table; savings for 2010 using proper allocation.
Optimal freight solution 80 % fixed allocation
Savings in percentages: 19,3 % 13,0 %
Savings in euro: € 108 603 € 73 303
Table 12 shows the summarized numbers, note that this is for 2010 and the volumes will have doubled
Allocation 2010 Optimal for freight cost Change in Alby - Ottersøy
Alby Bohus Rjukan Alby Bohus Rjukan Alby Bohus Rjukan
Ottersøy 39 % 5 % 56 % 100 % - - 80 % - 20 %
Namsos 100 % - - 100 % - - 100 % - -
Frøya 33 % 26 % 41 % 100 % - - 33 % 26 % 41 %
Herøy 30 % - 70 % 50 % - 50 % 30 % - 70 %
Bergen - - 100 % - - 100 % - - 100 %
Savings: - 19,3 % / € 108 603 13,0 % / € 73 303

76
just in the last year, providing a larger benefit now and in the future in monetary values. Eka may have
to pay for this by losing some flexibility but hopefully this will not be noticeable in a more mature chain.
5.8. Environmental aspects
5.8.1. Problem description
The problems related to the environmental aspects are not an issue within the general aspects and
overall environmental work within AkzoNobel as such. The problems may instead be that the
environmental aspects are overlooked in the day-to-day work as when transports are ordered or
potential customers are considered. There might also be a problem that the overall costs have gained
too much attention in relation to the company strategies which clearly states that sustainability is a
focus area.
There are risks during transportation due to dangerous goods and Eka have little or no control over the
transport planning and final destinations which presents problems regarding all of the existing and
possible external effects. Since AkzoNobel is primarily focusing on cradle-to-gate (from resource
extraction to the own company’s factory gate) when it comes to the transportations not cradle-to-cradle
(2.10. ), it will not show the full impact of the transportation and therefore not give the best outcome
for the total sustainability work but still a good and clear indication.
As seen in the theoretical framework (2.11. ) there are large differences in external effects between the
transport modes. It not only leads to difficulties in seeing the full potential in certain transport modes
but also in evaluating transporters when there is no basis of evaluation for the environmental aspects.
While the hauler has environmental goals such as only using euro 5 engines, they still lack specific
climate targets and a systematic monitoring system.
Table 13, Distances and emissions of CO2 in 2010.
Delivered 2010 Alby Bohus Rjukan Emissions
(kg CO2) Alby Bohus Rjukan
Ottersøy 24% 3% 34% Ottersøy 16,7% 4,4% 49,1%
Namsos 2% - - Namsos 1,4% - -
Frøya 3% 1% 2% Frøya 1,6% 1,5% 1,6%
Herøy 8% - 18% Herøy 6,4% - 14,6%
Bergen - - 4% Bergen - - 2,6%

77
Total 37% 4% 59% Total 26,2% 6,0% 67,9%
These numbers are calculated based on the assumption that every delivery must go empty back to the
production site. Based on deliveries made in 2010, the total emissions can then be calculated, where the
total amount of CO2 is shown in Table 13. (NTM, 2008) The deliveries are calculated as percentage of the
total amount delivered during 2010. The total amount of CO2 emissions for transports to the fish
farming industry was in 2010 almost 160 tons, much due to the great distances especially from Rjukan to
Ottersøy where much of the delivered HP were allocated from.
5.8.2. Long term goals
The environmental long term goals are to be perfectly aligned with Eka’s and AkzoNobel’s goals for
sustainability and environmental effects, that the transport mode chosen is the best from a triple
bottom line sustainable aspect, i.e. environmentally, socially as well as economically.
Hence, minimizing the risks taken while still profiting from an uncertain market is therefore included in
the overall sustainability related to the fish farming industry.
5.8.3. Proposed changes
There would be several positive effects of giving more attention to the environmental aspects of the
transportations. For example, it would be more in line with Eka’s overall strategies to be more
sustainable and using as much green transportation as possible in addition to encouraging haulers to use
non-fossilized fuel to a greater extent.
Eka evaluates the transporters as of now (section 0), although this could serve as a basis for more than it
currently does. For example, the environmental effects could be significantly lowered through both a
change of transport mode but also through better allocation.
As seen in section 4.1.2, Eka is the owner for the product during the transport and therefore takes the
risks associated with the transports in terms of environmental effects (section 0). Hence, a better
allocation is also favorable in order to minimize the environmental, and thereby economical, risks.
5.8.4. Potential savings:
The potential savings associated are mostly related to the transport mode as well as the allocation.
However other intangible savings exists such as goodwill and the value for Eka to better reach their
overall environmental goals and to find the most sustainable solution in terms of the triple bottom line:
environmental, economical and societal values.
Table 14, Total CO2 emissions in 2010 and potential emissions if the allocation to Ottersøy would be optimal.
Emissions (kg) 2010 New allocation
Ottersøy 112 240 68 055
Namsos 2 271 2 271
Frøya 7 547 7 547

78
Herøy 33 717 33 717
Bergen 4 162 4 162
Total 159 937 115 752
As seen in Table 14, if the allocation for transports to Ottersøy would solely be taken from Alby instead
of Rjukan and Bohus it would mean 44 tons less CO2 emissions. This reduction means that the total
emissions related to the transports to the fish farming industry would be reduced by 27.6 % simply by
following a part of the optimal allocation presented in section 5.7.
Table 15, CO2 emission if rail replaces Alby - Ottersøy with the optimal allocation in scenario 2.
Scenario 2 Distance (km) Emissions (kg)
Alternative 1
Road: Alby - Ottersøy 444 142 255
Alternative 2
Rail: Alby - Trondheim 380 8 259
Road: Trondheim - Ottersøy 213 68 244
Total
76 504
Reduction
46,2 %
As seen in Table 15, the rail alternative consists of rail from Alby to Trondheim and from there by road
to Ottersøy. Comparing this alternative to the new allocation option, the difference in CO2 emissions is
65 tons/year, a reduction of 46,2 %. (NTM, 2008) When regarding scenario 2, the total amount of HP
sold in Ottersøy is not tripled as it is when looking at the total amount of HP sold. Instead, there is a
limitation calculated that leaves the total amount of HP sold in the region to almost twice the level of
scenario 1.

79
6. Discussion As can be seen in the analysis, there are many problems related to the HP being sold to the fish farming
industry, but also many possibilities. Some of the problems that have been the focus of this report are
not anything Eka can affect by themselves. Instead they must rely on the growing market or external
decisions that affect the possibilities of a well functioning railway between Alby and Ottersøy for
example. The discussion is focused on problems that can be addressed and have been centered on three
implementations that will affect the problems discussed previously;
- Apply a structured order handling for the supply chain with clearer demands.
- Implement clearer divided responsibilities within the supply chain in order to follow-up and
continuously improve.
- Implement an area focus with fixed container depots. Focus more on these chosen areas instead
of trying to satisfy the entire market.
These three changes have large synergy effects and are best viewed as a whole since they all correlate
and support each other. Through these changes, the problems will be decreased and the potential
benefits and savings mentioned in the analysis can be achieved.
The order handling should be reconsidered as the analysis discussed and through it gain clearer
demands and increase the pressure on the actors involved. This may be difficult in some aspects due to
the lack of existing planning from the supply chain but that is exactly why it needs to be done.
This will primarily address the problems related to the market as well as the information structure. With
a more stable order handling, the market’s predictability will be improved as well as the visible
information, leading to more accurate decisions as the facts are brought into the light.
When dividing the responsibilities it is important to acknowledge the involved actors without
diminishing their opinions. Through a divided responsibility, the actors can focus more on their tasks and
gaining control over these. With the newly implemented responsibilities comes the possibility of more
standardized follow-ups and evaluations. This will help the entire supply chain to become more efficient
as well as increase the trust between the actors.
It is important to maintain solid relationships with both the hauler as well as the distributor, something
that these changes will take into consideration. With increased responsibility all actors may improve
separately in order to become a well functioning supply chain. It also tackles the problems related to
increasing the volumes with more focus and with desire for development, stemming from the divided
responsibilities. Furthermore it will help improve the allocation and thereby many of the environmental
aspects brought forth in the analysis.
When implementing an area focus it is crucial that it is based on correct facts and the right knowledge.
Hence, the distributor with their responsibility towards the market has a key role in providing the
correct analysis. These areas should provide a stable base for every actor involved through fixed
container depots allowing for easier transportation and handling as well as improved planning.

80
Through an area focus with container depots, Eka will completely or partially resolve the problems
correlated with seasonal variation and also with the market and increasing volumes. It is an important
step towards achieving long term perspectives towards the entire fish farming industry and is something
that may be crucial if the volumes do not increase heavily within the near future.
6.1. Research Questions
These research questions were stated in section 1.2. and are answered based on the report, especially
the empirical framework and also the analysis.
- How is the current supply chain structured and what advantages/disadvantages does it bring?
The supply chain and all its actors and components have been thoroughly discussed, primarily in the
empirical findings and the analysis. It does lack standardization and it is neither adapted for an increase
in volume nor to competing with a substitute product. To the contrary, the supply chain has taken the
form of an agile supply chain that is inappropriate for this kind of product. The proposed changes will all
help in streamlining the process and making it ready to face future challenges.
- What modes of transportation are suitable for delivering the hydrogen peroxide to the coastline
of Norway?
Large limitations set by the product and the transport modes themselves have focused the discussion on
what kind of trucks rather than which transport mode that is suitable. Infrastructure and geographical
difficulties both hinder the advancement of railway transportation in this area. Going back to the truck
options and the fact that it is, above all, full truck loads operating these routes, a larger vehicle is for the
most part more efficient. This leads to the advocating of tank trucks over containers as the cost of each
transport would be lower both by freight cost and reduced container cost.
- Are there any possible solutions regarding the storing of the product closer to the customer?
As the market is still growing and it is uncertain when it will stabilize, no investments will be suggested.
What should be done however is to use the currently available containers more as fixed depots and
store product closer to the customer, encouraging the use of tank trucks. If the volumes increase
upwards to scenario 2, it may be favorable to use stationary storage tanks of larger sizes at strategic
positions in the harbors that can satisfy it. Proper storage facilities will make transportation easier to
plan and carry out, allowing the hauler the option of treating it as any pulp and paper customer.
- How is the product allocated from the different factories? Is this a factor to improve?
During 2010, large discrepancies were found for the allocation and proved to be quite costly for the
company. This issue will be addressed by separating the product ordering from the transport ordering,
keeping the control at Eka. There have been recommendations set forth by Eka but no real follow-up has
been done to see why this was not carried out. Improvements should and can be done relatively easily
and with low costs.
- What does the optimal supply chain look like and why is this solution the most suitable?

81
It all comes down to what Eka sees as their strategy and future for this segment and how to make this
into an even more profitable business. As Eka is used to being a supplier and not much more, this should
be the aim for the fish farming segment as well. This will allow them to take fewer risks as they are
dealing with smaller actors and an uncertain market. It is now a quite unstructured and reactive supply
chain with many solutions on a case-to-case basis, which is something that would need to change as the
market grows. To improve a supply chain properly, service levels and points of interest need to be
measured in order to find weak spots and see if they are improving when things change. Another area of
improvement is to focus its means on a specific area that shows potential and establish that this
treatment can be competitive and structured, setting an example not only towards the market, but also
internally for Eka, that this is a promising segment.
6.2. Further Research
Further research may be needed depending on how the market alters in the future. If scenario 2 is
realized there are several topics that must be looked into. For example there is a risk of the hauler not
being able to cope with the large increase in volumes. Hence it would be a good idea to evaluate the
alternative of including another transporter on some routes. This will reduce the risks and potentially
give more allocation benefits.
If there is an increase in volumes, there is a possibility of investing in a storage tank which would
minimize the container costs and advocate the use of tank trucks. Other upsides include increased
control over the entire supply chain as well as easier transportation planning.
Also, it might be of interest to reconsider the railway alternative between Alby and Ottersøy when the
volumes have increased. Although, for this to be plausible, the existing railway must be upgraded and
have a real possibility of steady flows.
Further research needed in order to fully utilize every potential is to consider what synergy effects that
can be had, both from the alternative with scenario 2 and also as of now with the traditional customers
in the pulp and paper segment. For example, if there are customers requiring the same product, this can
lead to economies of scale when it comes to transports as well as in storage.

82
7. Recommendations
- Apply a structured order handling for the supply chain along with clearer demands – To allow
for better planning throughout the supply chain and ensure proper handling of hydrogen
peroxide.
Preliminary orders are to be registered in the system 2 weeks to 1 month prior
to delivery.
A confirmed order should be done at least a few days prior to the actual
delivery.
Information sharing with the hauler will allow them to better utilize their
resources and improve the efficiency of the transportation as well as allocation.
- Implement clearer divided responsibilities within the supply chain in order to follow-up and
continuously improve – So that each operation is controlled by a specific actor and that
individual improvements can be made.
Implement a visual tool that measures predefined service levels that are
relevant to the area, either for haulers or distributors. Evaluation should be on a
co-determined basis integrated in the SLA’s and used as an improvement tool.
Work together in order to improve and set shared long term goals.
Utilize the current SAP system properly and allow for direct access by the
distributor and the hauler.
- Implement an area focus with fixed container depots. Focus more on these chosen areas
instead of trying to satisfy the entire market – In order to build a functioning system that can
accommodate the market in targeted areas.
Select two to three areas that are already showing a large enough volume or a
potential of this in the coming years.
Implement stable flows with standardized routes and storage that can satisfy
the market in a less complex manner.
When these areas have matured and satisfied Eka’s goals, it can be used as a
benchmarking solution for the supply chain and towards potential customers.

83
8. Bibliography AkzoNobel. (2011a). About Us. Retrieved 01 23, 2011, from AkzoNobel:
http://akzonobel.com/aboutus/index.aspx
AkzoNobel. (2011b). Carbon Management through the Value Chain. Retrieved 02 04, 2011, from
AkzoNobel:
http://akzonobel.com/sustainability/managing_sustainability/key_focus_areas/carbon_management_v
alue_chain/index.aspx
AkzoNobel. (2011c). Managing Sustainability. Retrieved 02 04, 2011, from AkzoNobel:
http://akzonobel.com/sustainability/managing_sustainability/
AkzoNobel. (2011d). Homepage. Retrieved 01 23, 2011, from AkzoNobel Pulp and Paper / Eka
Chemicals: http://www.akzonobel.com/eka/
AkzoNobel. (2011e). Specialty Products. Retrieved 01 23, 2011, from AkzoNobel Pupl and Paper / Eka
Chemicals: http://www.akzonobel.com/eka/products/specialty_products/index.aspx
AkzoNobel. (2011f). Our vision and values. Retrieved 01 23, 2011, from AkzoNobel Paper and Pulp / Eka
Chemicals: http://www.akzonobel.com/eka/aboutus/visionandvalues/
AkzoNobel. (2011g). Sustainability at Eka. Retrieved 01 23, 2011, from AkzoNobel Paper and Pulp / Eka
Chemicals: http://www.akzonobel.com/eka/sustainability/sustainability_eka/
BBC. (2011). GCSE Bitesize: Elements of the Marketing Mix. Retrieved January 27, 2011, from BBC:
http://www.thetimes100.co.uk/theory/theory--marketing-mix-(price-place-promotion-product)--
243.php
Berglind, T. (2011, January 24). Technical expert. Technical aspects. (V. Andersson, & R. Nilsson,
Interviewers)
Burke, A., van Stel, A., & Thurik, R. (2010, May). Blue Ocean vs Five Forces. Harvard Business Review .
Burt, R. (1992). Structural Holes: the Social Structure of Competition. Cambridge: Harvard University
Press.
Börjesson, F. (2010, November 11). Miljöperspektiv: Miljöeffektiva transporter och logistiklösningar.
Göteborg, Sweden.
CER & UIC. (2008). Rail Transport and Environment - Facts and Figures. Paris: CER & UIC.
CER. (2010, February 18). New single wagon load alliance will improve European rail freight . Retrieved
March 28, 2011, from CER - the voice of European railways: http://www.cer.be/press/press-
releases/1967-new-single-wagon-load-alliance-will-improve-european-rail-freight

84
Christopher, M. (2000). The agile supply chain: Competing in volatile markets. Industrial Marketing
Management , 37-44.
CICERO. (2008, November 21). Road Emissions Dominate Global Transport Emissions. Retrieved February
3, 2011, from ScienceDaily: http://www.sciencedaily.com/releases/2008/11/081121081355.htm
Dalin, I. (2011, 01 19). Senior Project leader and Supervisor. Introduction. (V. Andersson, & R. Nilsson,
Interviewers)
Dapiran, G. P., & Hogarth-Scott, S. (2003). Are co-operation and trust being confused with power? An
analysis of food retailing in Australia and the UK. International Journal of Retail and Distribution
Management , 256-267.
Dekker, H. C. (2004). Control of inter-organizational relationships: evidence on appropriation concerns
and coordiation requirements. Accounting, Organizations and Society 29 , 27-49.
den Boer, E., Brouwer, F., Schroten, A., & van Essen, H. (2009). Are trucks taking their toll? : The
environmental, safety and congestion impacts of lorries in the EU. Delft: CE Delft.
DN.no. (2010, October 26). - Halvparten må slaktes. Retrieved January 25, 2011, from DN.no:
http://www.dn.no/forsiden/naringsliv/article2003233.ece
DN.no. (2010, June 13). Lite lus i oppdrettsanleggene. Retrieved January 25, 2011, from DN.no:
http://www.dn.no/forsiden/naringsliv/article1916450.ece
Eka Chemicals. (1997). H2O2 - En handbok om väteperoxid och dess hantering. Bohus.
Finnfirma.no. (2011, January 13). The hauler. Retrieved February 8, 2011, from finnfirma.no:
http://www.finnfirma.no/infoside/xxxxxxx/78457.html
Fiskedirektoratet. (2010, July 29). Nøkkeltall fra norsk havbruksnæring 2009. Retrieved January 25, 2011,
from Fiskedirektoratet: http://www.fiskeridir.no/statistikk/akvakultur/statistiske-
publikasjoner/noekkeltall-fra-norsk-havbruksnaering
Fiskeridirektoratet. (2010, December 01). Fiskeridirektoratets statistikkbank. Retrieved January 25, 2011,
from Fiskeridirektoratet: http://www.fiskeridir.no/fiskeridirektoratets-statistikkbank
Gadde, L.-E., & Håkansson, H. (2001). Supply Network Strategies. Chichester: John Wiley & Sons Ltd.
Grundy, T. (2006). Rethinking and reinventing Michael Porter's five forces model. Strategic Change , 213-
229.
Harrison, A., & van Hoek, R. (2002). Logistics Management and Strategy. Edinburgh: Pearson Education
Limited.
Hartmann, A.-C. (2010). Hydrogen peroxide keeps salmon healthy. OnSite The Eka Chemicals staff
magazine No4 December , 14.

85
Himmelmann, D. (2011, February 7). Transport purchaser Bohus. Regarding land transportation and
haulers. (V. Andersson, & R. Nilsson, Interviewers)
Hingley, M. (2005). Power imbalanced relationships: cases from UK fresh food supply. International
Journal of Retail & Distribution Management , 551-569.
Hingley, M. (2001). Relationship Management in the Supply Chain. The International Journal of Logistics
Management , 57-71.
Hydrogen-Peroxide.co.uk. (2010, 06 18). Transporting Hydrogen Peroxide. Retrieved 01 20, 2011, from
Hydrogen Peroxide: http://www.hydrogen-peroxide.co.uk/transporting-hydrogen-peroxide
Inman, R. A. (2011). Aggregate Planning. Retrieved January 15, 2011, from Reference for business:
http://www.referenceforbusiness.com/management/A-Bud/Aggregate-Planning.html
Jonsson, P., & Mattsson, S.-A. (2005). Logistik - läran om effektiva materialflöden. Göteborg:
Studentlitteratur.
Lantz, A. (2007). Intervjumetodik. Lund: Studentlitteratur.
Larsson, J. (2011, 01 20). Sales manager HPSA. The sales aspects. (V. Andersson, & R. Nilsson,
Interviewers)
Li, C.-f. (2009). Agile Supply Chain: competing in volatile markets. Management Science and Engineering
, 61-64.
Lovins, H. (2008, January 1). State of the World - Innovations for a sustainable economy. Retrieved
February 2, 2011, from The Worldwatch Institute:
http://www.worldwatch.org/files/pdf/SOW08_chapter_3.pdf
Lumsden, K. (2009). Economy of Transportation Systems. Göteborg: Division of Logistics and
Transportation.
Lumsden, K. (2007). Fundamentals of Logistics. Göteborg: Chalmers University of Technology.
Mattilsynet. (2010, July 1). Methods of salmon louse control. Retrieved January 31, 2011, from
Mattilsynet.no:
http://www.mattilsynet.no/english/news_archive/methods_of_salmon_louse_control_81594#Q6
Mattilsynet. (2010, June 29). The use of salmon delousing agents in Norway. Retrieved January 31, 2011,
from mattilsynet.no:
http://www.mattilsynet.no/english/news_archive/the_use_of_salmon_delousing_agents_in_norway_8
1441
MSB. (2010, February 9). Länder anslutna till ADR och RID. Retrieved February 1, 2011, from
Myndigheten för Samhällsskydd och beredskap: http://msb.se/sv/Forebyggande/Farligt-gods/Om-
farligt-gods/Lander-anslutna-till-ADR-och-RID/

86
MSB. (2010, December 18). Om Farligt Gods. Retrieved February 1, 2011, from Myndigheten för
samhällsskydd och beredskap: http://msb.se/sv/Forebyggande/Farligt-gods/Om-farligt-gods/
MSB. (2009, November 5). Utbildning för transport av farligt gods . Retrieved February 1, 2011, from
Myndigheten för samhällsskydd och beredskap: http://msb.se/sv/Forebyggande/Farligt-
gods/Utbildning/
Mugaas Jensen, P. (2011, March). Norsk Fiskeoppdrett .
Naturvårdsverket. (2009, March 25). Vad krävs på sikt? Retrieved February 2, 2011, from
naturvardsverket.se: http://www.naturvardsverket.se/sv/Klimat-i-forandring/Konsumtion-och-
klimat/Vad-kravs-pa-sikt/
NTM. (2008). Environmental data for international cargo transport. Göteborg.
Nygaard, S. M. (2010, March 26). Alternative bahandlingsformer mot lakselus. Retrieved March 21,
2011, from FOMAS: http://www.fom-
as.no/files/Lusenettverk/RFN/Lusekurs/Behandlingsalternativer_lus_mars_2010.pdf
Pandey, V., & Garg, S. (2009). Analysis of interaction among the enablers of agility in supply chain.
Journal of Advances in Management Research , 99-114.
Porter, M. (1980). Competitive Strategy. New York: The Free Press/Macmillan.
Power, D., Sohal, A., & Rahman, S.-U. (2001). Critical success factors in agile supply chain management.
International Journal of Physical Distribution & Logistics Management , 247-265.
Rahmquist, L. (2011a, Feb 07). Train and Container manager. Containers and transports. (V. Andersson,
& R. Nilsson, Interviewers)
Rahmquist, L. (2011b, March 28). Train and Container manager. Railway and containers. (R. Nilsson,
Interviewer)
Rail Freight Portal. (2011). Single wagon load. Retrieved March 28, 2011, from Rail Freight Portal:
http://www.railfreightportal.com/Single-wagon-load
Railway Gazette. (2010, February 18). Wagonload alliance launched. Retrieved March 28, 2011, from
Railway Gazette: http://www.railwaygazette.com/nc/news/single-view/view/wagonload-alliance-
launched.html
representative-distributor. (2010, March 9). General info about market and fish farming Industry. (V.
Andersson, & R. Nilsson, Interviewers)
Sako, M. (1992). Prices, Quality and Trust: inter-firm relations in Britain and Japan. Cambridge:
Cambridge University Press.

87
Schostak, J. F. (2005). Interviewing and Represenation in Qualitative Research Projects. Berkshire:
McGraw-Hill Education.
Skjoett-Larsen, T., Schary, P., Mikkola, J., & Kotzab, H. (2007). Managing the Global Supply Chain.
Copenhagen: Copenhagen Business School Press.
Staberg, H. (2011, january 25). Technical manager & Production Director HP. Guided tour, hydrogen
peroxide. (V. Andersson, & R. Nilsson, Interviewers)
Swedish Chemicals Agency. (2010). Hydrogen peroxide. Retrieved 01 19, 2011, from Kemi:
http://apps.kemi.se/flodessok/floden/kemamne_eng/vateperoxid_eng.htm
Szymankiewicz, J. (1993). Going Green: The Logistics Dilemma. Logistics Information Management , 36-
43.
The distributor. (2009). Brukerhåndbok Hydrogenperoksid til avlusning av laks. Bergen.
The Product-Life Institute. (2008, January 1). Cradle-to-Cradle. Retrieved February 2, 2011, from
product-life.org: http://www.product-life.org/en/cradle-to-cradle
The Times 100. (2011). Revision Theory - Marketing. Retrieved March 30, 2011, from The Times 100:
http://www.thetimes100.co.uk/theory/theory--marketing-mix-%28price-place-promotion-product%29--
243.php
Trost, J. (2005). Kvalitativa intervjuer. Lund: Studentlitteratur.
Valestrand, K. S. (2008, October 30). Villfisken ofres. Retrieved January 26, 2011, from TV2 Nyhetene:
http://www.tv2nyhetene.no/innenriks/villfisken-ofres-2347117.html
Walker, G., Kogut, B., & Shan, W. (1997). Social Capital, Structural Holes and the Formation of an
Industry Network. Organization Science , 109-123.
Westring, L. (2011, April 7). Sales representative, Green Cargo. (V. Andersson, & R. Nilsson, Interviewers)
Workman, D. (2007, December 1). Leading Fish Exporting Nations. Retrieved March 18, 2011, from
Suite101: http://www.suite101.com/content/top-fish-exporters-importers-a36749
Xrail. (2010, February 18). Xrail presentation. Retrieved March 28, 2011, from Xrail - the European
wagonload alliance:
http://www.xrail.eu/IMG/pdf/110222_XRail_presentation_wo_trailer_a_com_org_chart.pdf
Yin, R. K. (1994). Case Study Research - Design and Methods. Newbury Park, CA: Sage Publishing.

88
9. Appendices
9.1. Appendix A - Calculations for storage tank
- Removed due to secrecy agreement –
9.2. Appendix B - Investments for storage tank
- Removed due to secrecy agreement –


![Calcium-Dependent Hydrogen Peroxide Mediates Hydrogen-Rich … · Calcium-Dependent Hydrogen Peroxide Mediates Hydrogen-Rich Water-Reduced Cadmium Uptake in Plant Roots1[OPEN] Qi](https://img.dokumen.tips/doc/110x75/5f58dd1443c1f452644636dc/calcium-dependent-hydrogen-peroxide-mediates-hydrogen-rich-calcium-dependent-hydrogen.jpg)