Embed Size (px)
Citation preview

17-426 File D Page 1 of 128
Release
Publis
hed o
n DES D
isclos
ure Lo
g
RTI Act
2009

17-426 File D Page 2 of 128
Release
Publis
hed o
n DES D
isclos
ure Lo
g
RTI Act
2009

17-426 File D Page 3 of 128
Release
Publis
hed o
n DES D
isclos
ure Lo
g
RTI Act
2009

17-426 File D Page 4 of 128Release
Publis
hed o
n DES D
isclos
ure Lo
g
RTI Act
2009

17-426 File D Page 5 of 128Release
Publis
hed o
n DES D
isclos
ure Lo
g
RTI Act
2009

17-426 File D Page 6 of 128Release
Publis
hed o
n DES D
isclos
ure Lo
g
RTI Act
2009

17-426 File D Page 7 of 128Release
Publis
hed o
n DES D
isclos
ure Lo
g
RTI Act
2009

17-426 File D Page 8 of 128 Release
Publis
hed o
n DES D
isclos
ure Lo
g
RTI Act
2009

17-426 File D Page 9 of 128
Publis
hed o
n DES D
isclos
ure Lo
g
RTI Act
2009

Purchases made June 2017 Total4 vari desks $2,300.00Car fridge $1,689.003 operational mobiles $1,584.00PPE x4First aid training x4 $880.003 waterproof cameras $1,471.704 ergonomic charis $159.004 satchels/backpacks $396.00Portable desktop scanner and printer $159.00HD Camcorder $513.03
$9,151.73
Reef Budget for 2017/18Row Labels Sum of Total_Bud Sum of YTDAct
SRLConsumables $5,102 $0Employee Related Expenses $362,573 $336,473Network & Computer $6,432 $4,336Other Expenses $5,101 $3Telephone & Fax $1,680 $0Travel $22,000 $434
Grand Total $402,888 $341,246
17-426 File D Page 10 of 128
Publis
hed o
n DES D
isclos
ure Lo
g
RTI Act
2009

17-426 File D Page 11 of 128
Release
Publis
hed o
n DES D
isclos
ure Lo
g
RTI Act
2009

17-426 File D Page 12 of 128
Release
Publis
hed o
n DES D
isclos
ure Lo
g
RTI Act
2009

17-426 File D Page 13 of 128
Release
Publis
hed o
n DES D
isclos
ure Lo
g
RTI Act
2009

17-426 File D Page 14 of 128Release
Publis
hed o
n DES D
isclos
ure Lo
g
RTI Act
2009

17-426 File D Page 15 of 128
Release
Publis
hed o
n DES D
isclos
ure Lo
g
RTI Act
2009

17-426 File D Page 16 of 128Release
Publis
hed o
n DES D
isclos
ure Lo
g
RTI Act
2009

17-426 File D Page 17 of 128 Release
Publis
hed o
n DES D
isclos
ure Lo
g
RTI Act
2009

Page 1 of 1
Sales Order Confirmation
Date:
Account Number:
Customer Reference:
Customer Order Reference 1:
Customer Contact:
Delivery to:
Special Instructions
Sub Total
GST Total
Total
ITEM CODE QTY ORD QTY B/ O DESCRIPTION UNIT PRICE UNIT AMOUNT GST TOTAL
* Credit card details have been provided as payment for this order
STAPLES AUSTRALIA PTY LIMITED
8865709540
16/06/2017
NET37225850
Laura O'Brien
07 4999 6883
10405606
STAPLES Order Number:
STAPLES Order Reference:
07 499 6926
DEHP - CUSTOMER SERVICES
22-30 WOOD ST
MACKAY QLD 4740
ABN 94000728398PRIVATE BAG 16
ALEXANDRIA NSW 1435
www.staples.com.auENQUIRIES 13 26 44
Click Here To Track Your Order
Thank you for your order. Please note the Staples order number and use this in any enquiries withStaples. If you have a query about your order, please call 13 26 44.
All products are supplied subject to Staples' terms and conditions set out at staplesadvantage.com.au/terms orany company written agreement that you have in place with Staples. Some items, such as IT products andfurniture, have specific return policies please refer to the above terms and conditions.
$35.80
$0.00
$35.80
18930997 4 0 Ult Prtct Spf50+ Sunscrn 125ml Fliptop228850
$8.95 EA $35.80 $0.00 $35.80
17-426 File D Page 18 of 128
Publis
hed o
n DES D
isclos
ure Lo
g
RTI Act
2009

17-426 File D Page 19 of 128Release
Publis
hed o
n DES D
isclos
ure Lo
g
RTI Act
2009

17-426 File D Page 20 of 128
Release
Publis
hed o
n DES D
isclos
ure Lo
g
RTI Act
2009

17-426 File D Page 21 of 128Release
Publis
hed o
n DES D
isclos
ure Lo
g
RTI Act
2009

17-426 File D Page 22 of 128Release
Publis
hed o
n DES D
isclos
ure Lo
g
RTI Act
2009

17-426 File D Page 23 of 128 Release
Publis
hed o
n DES D
isclos
ure Lo
g
RTI Act
2009

2015/2016 Interim Reef Compliance Program Minerals and North Queensland Compliance Overview The interim reef compliance program commenced with a focus on communication and education, developed with the intent of working collaboratively with industry to achieve practice change.
The program started with the training of experienced regional compliance staff in the relevant provisions and requirements under the EP Act, and the basics of operating cane enterprises. This provided a base for an informed engagement with growers that recognises some of the on-ground challenges.
Engagement with industry was initiated by meeting with regional industry organisations to introduce ourselves, explain the program and our approach, and establish lines of communication. As a result these entities have provided information on the compliance program to the growers they engage with, and been able to respond to or redirect enquiries on the reef compliance program.
The on farm compliance activities were started by putting a call out to industry seeking volunteers to be part of the initial roll out. We received five responses from high profile growers and undertook compliance inspections with them. This enabled industry to form a view on the program in a controlled manner, and allowed compliance staff to develop their approach and engagement skills.
Compliance staff then initiated proactive compliance activities with growers. Overwhelmingly these were productive engagements, with an open dialogue between ourselves and growers. Initial indications during those engagement is that the majority will result in some level of practice change where needed, and this will be verified during follow up inspections in the 16/17 financial year.
TrainingDespite the existing compliance capacity within MaNQC, the unique nature of agricultural Environmentally Relevant Activity (ERA) regulation required a period of training and capacity building in staff to develop an understanding of both the industry and the specific Environmental Protection Act 1994 provisions associated with sugar cane farming.
Training was supported internally by contributions from the training and education unit, strategic compliance and the Reef Water Quality team as well as industry contributions from individual growers.
Key milestones include:
10 experienced regional compliance staff trained in nutrient requirements under the reef protection measures and engagement with cane industry (8 of these staff remain in the work unit).
Training included both office based and on farm learning (3 Burdekin and 3 Wet Tropics farms). Held a regional workshop following the completion of voluntary inspections to review the outcomes and what
was learnt, and ensure a common understanding and consistency of approach amongst compliance staff.
Engagement with cane industry It was acknowledged that in light of an absence of regulatory engagement with the sugar cane industry for a period of at least 3 years, significant investment was desirable in engaging with regional industry representatives to establish rapport and a foundation for ongoing working relationships.
Key milestones included
Thirty one meetings with regional cane industry entities (grower collectives, productivity services and mills), other government departments providing information on the proposed compliance program and nutrient requirements and establishing an open line of communication.
Met with the natural resource management groups NQ Dry Tropics and Terrain (via the Wet Tropics Sugar Industry Partnership).
17-426 File D Page 24 of 128
Release
Publis
hed o
n DES D
isclos
ure Lo
g
RTI Act
2009

2015/2016 Interim Reef Compliance Program
2
Established and manned a stall at the NQ field days resulting in engagement with an estimated 40 growers. As a result of meetings Burdekin Productivity Services and Farmacist included information on the interim
compliance program in their Burdekin shed meetings, which were attended by 281 growers which is about 53% of the growers in the Burdekin.
Compliance activities Given funding delays and the need to undertake recruitment, training, industry engagement and compliance planning prior to commencement of compliance inspections, the on ground site inspections commenced in March 2016.
Initial site inspections were conducted in consultation with industry on a voluntary basis. The grower collectives and productivity services were provided with an invitation to voluntarily participate in the first compliance inspections of the program. Five volunteers responded with two in the Burdekin, two in the Herbert and one from South Johnstone.
The KPI milestone for inspection targets was based on a pro-rata ratio of reef versus substantive MaNQC establishment. Given that eight of the forty eight compliance staff are reef funded the agreed inspection rate target KPI was 16% of the total number of pro-active compliance inspections undertaken during the period of the program.
Inspections commenced in March 2016 and in the period March to June 2016 a total of 189 pro-active inspections were conducted by MaNQC. Of this total, 27 inspections were on farm reef compliance inspections which equates to only 14.3% of all proactive inspections.
Notwithstanding this MaNQC also conducted 4 inspections of Sugar Mills with the express intent of sampling water quality ion on-site water containment structures to better understand the potential for nutrient discharge from this part of the industry. The inclusion of these additional 4 inspections increases the inspection rate to 16.4% which meets the KPI target of 16%.
Key milestones included:
Undertook a round of voluntary compliance inspections to start the compliance program which resulted in engagement with 5 high profile growers (2 Burdekin, 2 Herbert, 1 South Johnstone).
Undertook subsequent proactive compliance made up of 15 level B inspections, 7 desktop inspections and a further 4 activities still subject to finalisation (2 obstructionist behaviour, 1 illness and 1 rescheduling of meeting time).
The above compliance activities engaged with agricultural enterprises that cover approximately 8,698 hectares (area under cane hasn’t been calculated), see attached maps.
0
2
4
6
8
10
12
GrowerCollectives
GrowerMeetings
Mill Meetings ProductivityServices
FertiliserRepresentatives
NRM Groups OtherGovernmentDepartments
Series 1
17-426 File D Page 25 of 128
Publis
hed o
n DES D
isclos
ure Lo
g
RTI Act
2009

2015/2016 Interim Reef Compliance Program
3
Undertook 4 site visits of mills to sample and test water quality in storages with potential for discharge. (Mulgrave, Tully, Victoria and Inkerman). The sampling did not provide any indicative results in relation to Mills as a potential source of nutrient discharge to the receiving environment however it was acknowledged that the timing of inspection and sampling was at the end or after the crushing season and it is desirable to repeat the sampling during times of peak crushing during the 2016 season.
Practice Change Monitoring In light of the current educational approach to compliance within the industry and the need to establish a systematic methodology to targeting on farm inspection effort there is an acknowledgement that re-visitation of individual growers at short intervals will impede the total number of farms being accessed and may be counterproductive in developing trust and transparency within industry, particularly when industry is dominated by an ageing demographic and revenue is one of the primary drivers for practice change.
In the early stages of the compliance program it is envisaged that while the detection of non-compliance in individual growers requires follow-up inspection, this inspection may not require site visitation initially and a program of contact calls with non-compliant farmers within a defined interval (4-6mths) may be an alternative solution to recording practice change while also providing an opportunity to undertake a desktop risk evaluation regarding the need to visit the site.
Information garnered as a result of contact calls can be later verified or may be otherwise confirmed through the development of relationships with other key organisations including the Department of Agriculture Fisheries and Forestry or other extension service providers.
Water quality monitoring Minerals and North Queensland Compliance is currently contributing to the Department of Science, Information Technology and Innovation (DSITI) Healthy Waterways Program.
The DSITI program is sponsored through the healthy Waterways initiative of the Office of the Great Barrier Reef (OGBR) with the aim of developing a healthy waterways report card for the region.
DSITI developed a program of estuary monitoring in the region utilising existing Receiving Environment Monitoring Programs with the addition of three extra waterways to support the data set. MaNQC is currently supporting the sampling program for the additional three waterways, the Daintree River, the Hinchinbrook Channel and the Moresby River.
The monitoring is sampling for Nutrients (filtered and total), Chlorophyll, General YSI water quality parameters (pH, Conductivity, Temperature, DO, Turbidity and depth) and determining water transparency using a Secchi Disc.
Inspections
Farm Inspections
Desktop Inspectrions
Subject to finalisation
Sugar Mill Inspections
17-426 File D Page 26 of 128
Publis
hed o
n DES D
isclos
ure Lo
g
RTI Act
2009

2015/2016 Interim Reef Compliance Program
4
The sampling effort is contributing to OGBR outcomes in concert with DSITI but is also enabling the skills enhancement of compliance officers engaged in the reef compliance program. These are water quality monitoring skills that will be used during the course of the compliance program delivery.
The current resource investment from MaNQC is 3 days per month.
Key learnings Initial indications are there is significant ground to be made with growers in the communication and education end of the compliance spectrum.
The de-prioritisation of reef compliance following the previous program resulted in a widespread decline in compliance with the reef protection measures.
Interpersonal interactions significantly affect the outcomes of compliance engagements.
The department's renewed focus on the reef protection measures is prompting growers to amend their practices, particularly around record keeping.
17-426 File D Page 27 of 128
Publis
hed o
n DES D
isclos
ure Lo
g
RTI Act
2009

2015/2016 Interim Reef Compliance Program
5
Key issues identified Lack of/difficulty of access to landholder information (who owns what) along with contact details is a significant impediment to the compliance program.
The current CPM only partially covers the cane growing area, and a significant revision of input data and decision rules for compliance prioritisation is required.
Data capture and management systems require improvement to allow feedback and monitoring of compliance effort and results over time.
Priority actions Recruitment to regional Senior Program Officer position to replace the former Starategic compliance support
function and develop an enhanced 2016 / 2017 Reef Tactical Compliance Plan Spatial data project to consolidate existing information, improve data capture and management, provide
framework for risk based compliance targeting, identify key knowledge gaps, and support compliance planning and reporting, including practice change measuring. (initiated: Spatial Analysis Group and Senior Program Officer)
Review existing knowledge of risk factors for nutrient loss from cane farms to identify measures to inform revised CPM and assess feasibility of targeted water quality monitoring. (project for acting Program Coordinator during August)
Develop revised method for compliance prioritisation. (Senior Program Officer and Program Coordinator) Undertake training of an additional 8 compliance staff. Develop a water quality monitoring project for OGBR consideration.
2016/2017 Program The focus for quarters one and two will be on preparation and planning of the compliance program. Key actions during this period are the setup of system/s for data capture and management, the development and implementation of a framework for compliance prioritisation, the creation of a base data set that includes land owner and contact information, scoping of potential hotspot monitoring activities to inform compliance actions, ongoing communication with industry stakeholder groups, and planning and preparation for on farm compliance activities.
This pro-active planning cycle and industry engagement investment also critically aligns with the harveting cycle of the industry. The July to November period is the most active period for the industry and a time when EHP compliance officers are likely to contribute to significant angst amongst growers if required to acquiesce to regulatory inspections while competing commercial harvesting pressures are at their greatest. Notwithstanding this a strategic level of on farm inspections will still be planned during the first two quarters around those growers that have less demanding harvest pressure.
With the programs current focus on communication and education on farm compliance activities will be focussed in quarter three and four. This is the quieter time of year for cane growers and focussing our on farm activities then will increase the potential that growers will be receptive during our engagement. Additionally this will reduce the potential for negative interactions and staff safety issues by avoiding the time of year when growers can be time pressured and subject to high stress levels. The shortened time period for on ground activities will be offset by the expansion of the reef trained workforce with an additional 8 staff.
17-426 File D Page 28 of 128
Publis
hed o
n DES D
isclos
ure Lo
g
RTI Act
2009

2015/2016 Interim Reef Compliance Program
617-426 File D Page 29 of 128
sch4p4( 6) Personal Information
Publis
hed o
n DES D
isclos
ure Lo
g
RTI Act
2009

2015/2016 Interim Reef Compliance Program
717-426 File D Page 30 of 128
sch4p4( 6) Personal Information
Publis
hed o
n DES D
isclos
ure Lo
g
RTI Act
2009

2015/2016 Interim Reef Compliance Program
817-426 File D Page 31 of 128
sch4p4( 6) Personal Information
Publis
hed o
n DES D
isclos
ure Lo
g
RTI Act
2009

29T28T27T26T24T23T22T20T18T17T16T15T14T13T12T11T10T8T7T6T5T4T3T2T1T0T2016/2017 Interim Reef Compliance Program 29T28T27T26T24T23T22T20T18T17T16T15T14T13T12T11T10T8T7T6T5T4T3T2T1T0TQuarter 1 update 29T28T27T26T24T23T22T20T18T17T16T15T14T13T12T11T10T8T7T6T5T4T3T2T1T0TMinerals and North Queensland Compliance Training29T28T27T26T24T23T22T20T18T17T16T15T14T13T12T11T10T8T7T6T5T4T3T2T1T0TThe development of a revised reef compliance training package is underway with delivery to Townsville and Cairns staff planned for 25-26 October in Cairns and early November in Townsville. Training will involve both and office and field component aimed at familiarising officers with both the reef compliance work and the general operation of cane farms. The expansion of the reef trained compliance workforce is a key activity in the first half of this financial year and will contribute to an increased on farm compliance output.
Engagement with cane industry 29T28T27T26T24T23T22T20T18T17T16T15T14T13T12T11T10T8T7T6T5T4T3T2T1T0TEngagement with industry groups has been ongoing and focussed on keeping growers representative groups up to date with our compliance presence and seeking feedback on any compliance related issues that have cropped up. Engagement in Quarter 1 has occurred with 9 industry bodies.
Compliance activities 29T28T27T26T24T23T22T20T18T17T16T15T14T13T12T11T10T8T7T6T5T4T3T2T1T0TEleven proactive farm compliance activities were initiated in Quarter 1. Of these four *** have been finalised with the remainder in progress. Mapping is provided below.
29T28T27T26T24T23T22T20T18T17T16T15T14T13T12T11T10T8T7T6T5T4T3T2T1T0TFour mill inspections that assessed compliance against the beneficial use agreement for mill by products were undertaken in Q1 (Invicta, Pioneer, Victoria, Macknade).
Data Capture and Management 29T28T27T26T24T23T22T20T18T17T16T15T14T13T12T11T10T8T7T6T5T4T3T2T1T0TData sets relevant to the compliance program relating to land ownership and contact information that are held by the department were identified and sourced. Following this a project utilising Spatial Support Services was initiated for the development and ongoing management of a ArcGIS geodatabase to capture and manage ESR reef compliance and monitoring activities. The database is intended to incorporate owner and contact information for properties captured by chapter 4A of the EP Act, compliance effort and outcomes, follow up actions, monitoring effort and results, and to link and interact with the compliance prioritisation, and Connect when it comes on line.
29T28T27T26T24T23T22T20T18T17T16T15T14T13T12T11T10T8T7T6T5T4T3T2T1T0TCurrently the assigned GIS analyst has been provided the data sets, sourced additional data to support the database and is aligning the data sets so they can be integrated. While improving on our current situation it is expected there will still be shortcomings in our knowledge of who is undertaking agricultural ERA's where. The sourcing of reliable information to underpin our compliance program needs to be a key focus into the future.
Compliance Prioritisation 29T28T27T26T24T23T22T20T18T17T16T15T14T13T12T11T10T8T7T6T5T4T3T2T1T0TWork was undertaken to review the existing knowledge of water quality impacts and risks, particularly focussing on nutrient loss from cane, to inform the 2016/2017 compliance program and identify key data gaps. This is included as attachment 1.
29T28T27T26T24T23T22T20T18T17T16T15T14T13T12T11T10T8T7T6T5T4T3T2T1T0TFrom this review a compliance and prioritisation approach was developed to help target compliance effort. Compliance effort will be focussed based on a relative assessment of a basin's potential importance for reef water quality; considering the modelled anthropogenic DIN load, the number of sub catchments within a basin modelled as having elevated DIN export rates from sugar, and the relative DIN risk to the COTS initiation zone. Within basin effort is then focussed on those sub catchments with higher modelled DIN loss rates from sugar.
29T28T27T26T24T23T22T20T18T17T16T15T14T13T12T11T10T8T7T6T5T4T3T2T1T0TWet Tropics basins have been grouped as:
High Priority 29T28T27T26T24T23T22T20T18T17T16T15T14T13T12T11T10T8T7T6T5T4T3T2T1T0TMulgrave - Russell
17-426 File D Page 32 of 128Release
Publis
hed o
n DES D
isclos
ure Lo
g
RTI Act
2009

2015/2016 Interim Reef Compliance Program
2
29T28T27T26T24T23T22T20T18T17T16T15T14T13T12T11T10T8T7T6T5T4T3T2T1T0TJohnstone
29T28T27T26T24T23T22T20T18T17T16T15T14T13T12T11T10T8T7T6T5T4T3T2T1T0TTully
Medium Priority 29T28T27T26T24T23T22T20T18T17T16T15T14T13T12T11T10T8T7T6T5T4T3T2T1T0TDaintree
29T28T27T26T24T23T22T20T18T17T16T15T14T13T12T11T10T8T7T6T5T4T3T2T1T0TMossman
29T28T27T26T24T23T22T20T18T17T16T15T14T13T12T11T10T8T7T6T5T4T3T2T1T0THerbert
Low Priority 29T28T27T26T24T23T22T20T18T17T16T15T14T13T12T11T10T8T7T6T5T4T3T2T1T0TBarron
29T28T27T26T24T23T22T20T18T17T16T15T14T13T12T11T10T8T7T6T5T4T3T2T1T0TMurray
29T28T27T26T24T23T22T20T18T17T16T15T14T13T12T11T10T8T7T6T5T4T3T2T1T0TThe prioritisation document is included as attachment 2.
29T28T27T26T24T23T22T20T18T17T16T15T14T13T12T11T10T8T7T6T5T4T3T2T1T0TInformation is not yet available to focus sub catchment effort within the Burdekin cane area as per the Wet Tropics basins, and sources such as the draft Burdekin WQIP Spatial Prioritisation Report did not identify significant differences in pollutant load between cane areas. At this point cane in the Burdekin will be treated as a priority in the compliance planning and effort will be distributed across the cane area.
Recruitment 29T28T27T26T24T23T22T20T18T17T16T15T14T13T12T11T10T8T7T6T5T4T3T2T1T0TAn ASD has been developed and a position number created for the Senior Program Officer position. Recruitment will occur during quarter 2.
Practice Change Monitoring 29T28T27T26T24T23T22T20T18T17T16T15T14T13T12T11T10T8T7T6T5T4T3T2T1T0TIn light of the current educational approach to compliance within the industry and the need to establish a systematic methodology to targeting on farm inspection effort there is an acknowledgement that re-visitation of individual growers at short intervals will impede the total number of farms being accessed and may be counterproductive in developing trust and transparency within industry, particularly when industry is dominated by an ageing demographic and revenue is one of the primary drivers for practice change.
29T28T27T26T24T23T22T20T18T17T16T15T14T13T12T11T10T8T7T6T5T4T3T2T1T0TIn the early stages of the compliance program it is envisaged that while the detection of non-compliance in individual growers requires follow-up inspection, this inspection may not require site visitation initially and a program of contact calls with non-compliant farmers within a defined interval (4-6mths) may be an alternative solution to recording practice change while also providing an opportunity to undertake a desktop risk evaluation regarding the need to visit the site.
29T28T27T26T24T23T22T20T18T17T16T15T14T13T12T11T10T8T7T6T5T4T3T2T1T0TInformation garnered as a result of contact calls can be later verified or may be otherwise confirmed through the development of relationships with other key organisations including the Department of Agriculture Fisheries and Forestry or other extension service providers.
Water quality monitoring 29T28T27T26T24T23T22T20T18T17T16T15T14T13T12T11T10T8T7T6T5T4T3T2T1T0TMinerals and North Queensland Compliance is continuing to contribute to the Department of Science, Information Technology and Innovation (DSITI) Healthy Waterways Program. The current resource investment from MaNQC is 3 days per month.
17-426 File D Page 33 of 128
Publis
hed o
n DES D
isclos
ure Lo
g
RTI Act
2009

2015/2016 Interim Reef Compliance Program
3
29T28T27T26T24T23T22T20T18T17T16T15T14T13T12T11T10T8T7T6T5T4T3T2T1T0T
Key issues identified 29T28T27T26T24T23T22T20T18T17T16T15T14T13T12T11T10T8T7T6T5T4T3T2T1TLack of/difficulty of access to landholder information (who owns what) along with contact details is a significant impediment to the compliance program. Options to address this knowledge gap need to be a key focus to support the compliance effort.
29T28T27T26T24T23T22T20T18T17T16T15T14T13T12T11T10T8T7T6T5T4T3T2T1TData capture and management systems require improvement to allow feedback and monitoring of compliance effort and results over time.
Priority actions for quarter 2 29T28T27T26T24T23T22T20T18T17T16T15T14T13T12T11T10T8T7T6T5T4T3T2T1TContinued roll out of farm based compliance activities 29T28T27T26T24T23T22T20T18T17T16T15T14T13T12T11T10T8T7T6T5T4T3T2T1TRecruitment to regional Senior Program Officer position to replace the former strategic compliance support function and develop an enhanced 2016 / 2017 Reef Compliance Plan 29T28T27T26T24T23T22T20T18T17T16T15T14T13T12T11T10T8T7T6T5T4T3T2T1TSpatial data project to consolidate existing information, improve data capture and management, provide framework for risk based compliance targeting, identify key knowledge gaps, and support compliance planning and reporting, including practice change measuring. (initiated: Spatial Analysis Group and Senior Program Officer) 29T28T27T26T24T23T22T20T18T17T16T15T14T13T12T11T10T8T7T6T5T4T3T2T1TUndertake training of an additional 8 compliance staff.
17-426 File D Page 34 of 128
Publis
hed o
n DES D
isclos
ure Lo
g
RTI Act
2009

2015/2016 Interim Reef Compliance Program
417-426 File D Page 35 of 128
sch4p4( 6) Personal Information
Publis
hed o
n DES D
isclos
ure Lo
g
RTI Act
2009

2015/2016 Interim Reef Compliance Program
517-426 File D Page 36 of 128
sch4p4( 6) Personal Information
Publis
hed o
n DES D
isclos
ure Lo
g
RTI Act
2009

2016/2017 Interim Reef Compliance Program Quarter 2 update Minerals and North Queensland Compliance Compliance activities Twenty five proactive farm compliance activities were initiated in Quarter 2. Of these inspections twenty have been finalised with twelve of the sites compliant, eight non-compliant and the remainder under assessment. Mapping is provided below.
A total of 20% of the quarter two inspections were dedicated to revisiting farms that had previously demonstrated non-compliance.
All of the revisited sites demonstrated an improvement in practices, amending N and P application rates to align with the method, actively working to BMP accreditation, and initiating soil testing. There has been no non-compliance has been detected which has yet necessitated the escalation of enforcement from education to official warning.
The second quarter compliance effort was structured to recognise and account for the temporal industry wide investment in crop harvest and the third quarter compliance effort will demonstrate a 100% increase in inspection rate. This planning methodology is a reflection of collaborative industry engagement and the seasonal opportunities for productive compliance inspection effort.
Of note: One of the revisited farms was non-compliant. However, while not being compliant with the chapter 4A conditions at the revisit, nitrogen application rates have reduced and a range of farm practices to reduce nutrient loss have been implemented. This farm has continued to be actively engaged with compliance officers and is currently exploring the accreditation of an environmental risk management plan (ERMP) as an alternative means of achieving compliance. Environmental Services and Regulation (ESR) compliance have been liaising with Reef Water Quality staff in an endeavour to work with the farm to achieve compliance.
Engagement with cane industry Engagement with industry groups has been ongoing and focussed on keeping growers representative groups up to date with compliance activities and to continue to build rapport and relationships with industry.
Compliance program updates are being subsequently communicated to industry group members, raising awareness and maintaining profile.
Ongoing dialogue with industry groups has further served to solicit feedback on compliance related issues that have been raised by their members. To date this communication has been well received and our engagement with these groups constructive.
During the second quarter an additional 3 industry groups (Canegrowers Mossman and Mareeba, and Australian Cane Farmers Association Mossman) were engaged. These were pre-emptive meetings in advance of compliance activities starting in those areas.
TrainingReef compliance training was delivered in Cairns 25-26 October and Townsville 24-25 November. Training involved an office and field component familiarising officers with both the reef compliance work and the general operation of cane farms.
An additional 13 regional compliance officers were trained during these two sessions. An additional round of office based training has commenced in the third quarter to capture the intake of employees that commenced in the new-year.
Further training is planned for quarter three and four to build capacity with Central Region staff prior to the expansion of the Reef compliance program into the Mackay/Whitsunday regulated area in the 2017/2018 financial year.
17-426 File D Page 37 of 128Release
Publis
hed o
n DES D
isclos
ure Lo
g
RTI Act
2009

2015/2016 Interim Reef Compliance Program
2
Data Capture and Management Spatial Support Services provided the reef compliance program with a georeferenced database developed using existing department held data on agricultural ERA's (primarily data from original reef compliance program). The region subsequently developed the necessary spatial attributes to capture the compliance effort and outcomes from the current compliance program.
The new data capture practise compliments the historical information and is an effective tool to record, track and plan compliance effort.
The customised reef CaRE package being delivered through the ESR project unify team has been aligned with the existing data capture methodology to deliver better efficiency in future reef compliance activities and to ensure consistency of compliance delivery once CONNECT is released for compliance during 2017.
While the above work has significantly improved the ability to plan and record and track compliance effort, data capture and management will continue to be a significant focus in the third quarter particularly with the need to develop a prioritisation model for the Mackay/Whitsundays.
Compliance Prioritisation The compliance prioritisation approach developed in the first quarter is continuing to guide the roll out of field compliance activities.
Targets for the third quarter compliance activities have been identified and allocated to ESR Minerals and North Queensland Compliance (MaNQC) teams. These include revisitation of approximately 40% of the non-compliant sites identified to date.
Expansion of reef compliance activities into the Mackay/Whitsundays regulated areas will result in resource allocation being directed to spatially relevant compliance prioritisation and planning during the third and fourth quarters in preparation for the 2017/2018 reef compliance program.
Establishment Management Establishment attrition and career progression caused three reef funded positions to be vacant during the second quarter but subsequent recruitment strategies have resulted in the positions being filled at the commencement of the third quarter.
Irrespective of any ongoing vacancy management, the reef inspection rate has continued and is on track for KPI delivery at the end of quarter four based on total funded FTE positions.
The Senior Program Officer position was recruited to in the third quarter as a crucial position supporting the planning and compliance prioritisation associated with the program.
Continuation and expansion of the program will necessitate establishment management processes during the third quarter to create and recruit new positions and to also retain existing trained staff through contract extension.
17-426 File D Page 38 of 128
Publis
hed o
n DES D
isclos
ure Lo
g
RTI Act
2009

2015/2016 Interim Reef Compliance Program
3
Water quality monitoring Minerals and North Queensland Compliance is continuing to contribute to the Department of Science, Information Technology and Innovation (DSITI) Healthy Waterways Program. The current resource investment from MaNQC is 3 days per month.
17-426 File D Page 39 of 128
Publis
hed o
n DES D
isclos
ure Lo
g
RTI Act
2009
2015/2016 Interim Reef Compliance Program
4
Key issues identified Lack of/difficulty of access to landholder information (who owns what) along with contact details is a significant challenge to the compliance program.
Options to address this knowledge gap have been a key focus to support the compliance effort and have been augmented with the appointment of a Senior Program Officer to support planning. A second Senior Program Officer will be considered during the third and fourth quarters to support expansion of the compliance effort in the Mackay/Whitsunday region.
Data capture and management systems require further development to streamline data capture as well as allow feedback and monitoring of compliance effort and results over time.
The program is currently delivering within budget and is on track for KPI delivery.
Priority actions for quarter 3 Continued roll out of farm based compliance activities Spatial data project to consolidate existing information, improve data capture and management, provide a
framework for risk based compliance targeting, identify key knowledge gaps, and support compliance planning and reporting, including practice change.
Undertake training of new recruits. Develop materials and hold a trade stall at the Step Up conference 27-29 March in Mackay Continue to work with Project Unify team to streamline future reef compliance data capture and reporting. Undertake compliance prioritisation and planning for expansion of the program to the Mackay/Whitsunday
region. Support training, capacity building and industry engagement in Central Region.
Quarter 2 Compliance effort mapping
17-426 File D Page 40 of 128
sch4p4( 6) Personal Information
Publis
hed o
n DES D
isclos
ure Lo
g
RTI Act
2009

2015/2016 Interim Reef Compliance Program
517-426 File D Page 41 of 128
sch4p4( 6) Personal Information
Publis
hed o
n DES D
isclos
ure Lo
g
RTI Act
2009

2015/2016 Interim Reef Compliance Program
617-426 File D Page 42 of 128
sch4p4( 6) Personal Information
Publis
hed o
n DES D
isclos
ure Lo
g
RTI Act
2009

2015/2016 Interim Reef Compliance Program
717-426 File D Page 43 of 128
sch4p4( 6) Personal Information
Publis
hed o
n DES D
isclos
ure Lo
g
RTI Act
2009

2016/2017 Interim Reef Compliance Program Quarter 3 update Minerals and North Queensland Compliance Compliance activities Forty nine compliance inspections were scheduled in quarter three (Q3). Given the difficulties created by the lack of reliable client information, over the course of the quarter officers attempted to contact 57 growers in an effort to achieve the planned numbers. Of these 39 were able to be contacted and an inspection/audit was carried out during the quarter, with an additional three carry over from Q2 giving a total of 42 compliance activities for the quarter.
Of the 39 Q3 proactive farm compliance activities, 13 of the sites were compliant, 19 non-compliant and seven are still under assessment. Mapping is provided below.
Ten of the scheduled Q3 inspections were dedicated to revisiting farms that had previously demonstrated non-compliance. Of these seven were undertaken and two of these had not reached compliance which resulted in the issue of formal warnings to the growers concerned. Officers discussed the action and implications of continued non-compliance with the growers concerned and both have indicated they are going to take the necessary steps to become compliant. Of the three scheduled that weren't complete one had sold the property, one hadn't had sufficient time elapse to allow assessment of compliance and was postponed (i.e. they hadn't yet undertaken the required activities like planting), and one was unable to be scheduled during the quarter and is carrying over to Q4.
The reef inspection rate has continued and is on track for KPI delivery at the end of quarter four based on total funded FTE positions.
Engagement with cane industry Engagement with industry groups has been ongoing and focussed on continuing to build rapport and relationships with industry. Ongoing dialogue with industry has served to solicit feedback on compliance related issues that have been raised, and allow these to be addressed quickly facilitating a constructive relationship with Industry.
During the third quarter an additional 2 industry groups (Canegrowers Proserpine and Mackay) were engaged along with the Mackay Area Productivity Services and Reef Catchments NRM group in preparation of the compliance program roll out in the Mackay Whitsunday area. The planned meetings with these groups were postponed as a result of cyclone Debbie and will be rescheduled for quarter 4.
A trade stall was booked and prepared for at the Australian Cane Farmers Association Step Up conference in Mackay. This was cancelled due to Cyclone Debbie and has been rescheduled to 2018.
Engagement with the Wet Tropics Sugar Industry Partnership resulted in them briefing 25 regional staff on the farm nutrient management planning they are undertaking.
TrainingReef compliance training was delivered in Cairns 19 January and Townsville 12 January and 13 March to familiarise officers with the reef compliance work. An additional 11 regional compliance officers were trained during these three sessions.
Sugar Research Australia was engaged and delivered 6 Easy Steps training in both the Cairns and Townsville offices, to familiarise staff with the industry standard the approved method was derived from. 25 staff attended these sessions.
Further training is planned for quarter 4 to build capacity with Central Region staff prior to the expansion of the Reef compliance program into the Mackay/Whitsunday regulated area in the 2017/2018 financial year, and train temp staff engaged in the compliance and customer service group during Q3.
17-426 File D Page 44 of 128
Release
Publis
hed o
n DES D
isclos
ure Lo
g
RTI Act
2009

2015/2016 Interim Reef Compliance Program
2
Data Capture and Management The compliance data capture is ongoing and provides an effective tool to record, track and plan compliance effort. In the Burdekin and Wet Tropics areas, a historical cane farm spatial layer developed in 2010 has now been verified against land use mapping (QLUMP 2009), aerial imagery, and for planned or inspected properties, against the Queensland Valuation and Sales (QVAS) database for land ownership. This layer will continue to be updated for land owner and responsible farming entity into Q4. A mailing list is now also available for property owners in the Wet Tropics area based on QVAS information. Mailing lists for the Burdekin and Mackay-Whitsunday areas will be completed in Q4.
The customised reef CaRE package being delivered through the ESR project unify team has been aligned with the existing data capture methodology to deliver better efficiency in future reef compliance activities and to ensure consistency of compliance delivery once CONNECT is released for compliance during 2017.
Work is underway to source relevant data to inform a compliance prioritisation for the Mackay Whitsunday area and look for opportunities to refine the existing approach for the Wet Tropics and Burdekin.
While the above work has significantly improved the ability to plan and record and track compliance effort, data capture and management will continue to be a significant focus in the fourth quarter particularly with the need to develop a prioritisation model for the Mackay/Whitsundays.
Compliance Prioritisation The compliance prioritisation approach developed in the first quarter is continuing to guide the roll out of field compliance activities.
Use of remote sensing technologies to identify potential areas of higher nutrient input is currently under development. Use of a drone was investigated but presents challenges in relation to the limited area of operation. Alternative imagery and processing methodologies will be investigated further in Q4.
Targets for the fourth quarter compliance activities have been identified and allocated to ESR Minerals and North Queensland Compliance (MaNQC) teams. 25% of these are revisits of non-compliant sites.
Expansion of reef compliance activities into the Mackay/Whitsundays regulated areas will result in resources being directed to spatially relevant compliance prioritisation and planning during the fourth quarter in preparation for the 2017/2018 reef compliance program.
Establishment Management None of the reef funded positions were vacant during the third quarter.
Contract extensions were undertaken for 5 reef funded positions to take them through the 2017/2018 financial year
The Senior Program Officer position is going through a recruitment process to fill it for the 2017/2018 financial year.
With the additional workload to bring the Mackay Whitsunday area on line an extra short term temp Senior Program Officer has been appointed for Q4 to assist with the intelligence and planning.
17-426 File D Page 45 of 128
Publis
hed o
n DES D
isclos
ure Lo
g
RTI Act
2009

2015/2016 Interim Reef Compliance Program
3
Water quality monitoring Minerals and North Queensland Compliance is continuing to contribute to the Department of Science, Information Technology and Innovation (DSITI) Healthy Waterways Program. The current resource investment from MaNQC is 3 days per month.
17-426 File D Page 46 of 128
Publis
hed o
n DES D
isclos
ure Lo
g
RTI Act
2009

2015/2016 Interim Reef Compliance Program
4
Key issues identified Lack of/difficulty of access to grower information (who is undertaking the regulated activity and where are they doing it) along with contact details is a significant challenge to the compliance program.
Options to address this knowledge gap have been a key focus to support the compliance effort and have been augmented with the appointment of a Senior Program Officer to support planning. A second Senior Program Officer has been engaged for the fourth quarter to support expansion of the compliance effort in the Mackay/Whitsunday region.
As growers don't hold an EA or equivalent document that clearly sets out what's required, officers regularly encounter growers who convey they are uncertain what's expected of them. Options and opportunities to address this will be investigated and pursued during Q4.
Data capture and management systems require further development to streamline data capture as well as allow feedback and monitoring of compliance effort and results over time.
The program is currently delivering within budget and is on track for KPI delivery.
Priority actions for quarter 4 Continued roll out of farm based compliance activities Continue spatial data work to consolidate existing information, improve data capture and management, provide
a framework for risk based compliance targeting, identify key knowledge gaps, and support compliance planning and reporting, including practice change.
Undertake training of new recruits. Hold a trade stall at the Grow and Show 12 and 13 May at Mio College, Clare Continue to work with Project Unify team to streamline future reef compliance data capture and reporting. Undertake compliance prioritisation and planning for expansion of the program to the Mackay/Whitsunday
region. Undertake training, capacity building and industry engagement in Central Region.
Quarter 3 Compliance effort mapping
17-426 File D Page 47 of 128
sch4p4( 6) Personal Information
Publis
hed o
n DES D
isclos
ure Lo
g
RTI Act
2009

2015/2016 Interim Reef Compliance Program
517-426 File D Page 48 of 128
sch4p4( 6) Personal Information
Publis
hed o
n DES D
isclos
ure Lo
g
RTI Act
2009

2015/2016 Interim Reef Compliance Program
617-426 File D Page 49 of 128
sch4p4( 6) Personal Information
Publis
hed o
n DES D
isclos
ure Lo
g
RTI Act
2009

2015/2016 Interim Reef Compliance Program
717-426 File D Page 50 of 128
sch4p4( 6) Personal Information
Publis
hed o
n DES D
isclos
ure Lo
g
RTI Act
2009

2015/2016 Interim Reef Compliance Program
817-426 File D Page 51 of 128
sch4p4( 6) Personal Information
Publis
hed o
n DES D
isclos
ure Lo
g
RTI Act
2009

2016/2017 Reef Compliance Program End of financial year report Minerals and North Queensland Compliance (MaNQC)Overview The reef compliance program funds nine full time employees (FTE) to administer the regulatory provisions of Chapter 4A of the Environmental Protection Act 1994 (the Act). Based on the ratio of reef funded to base funded compliance and customer service staff, the fundamental key performance indicator (KPI) for the reef compliance program is the delivery of a pro-rata reef inspection contribution towards the annual gross regional compliance inspection total. The reef funded positions constitute approximately 17% of the regional compliance workforce.
During the 2016/2017 financial year, MaNQC completed 124 reef compliance activities. This included both physical inspections (grower meetings), and desktop audits, and for the purpose of the program are all referred to as inspections. This translates to approximately 20% of the total number of inspections conducted within the region and exceeded the KPI requirement.
Twenty-two (22) of the reef compliance inspections were revisits to sites. Only five (5) of the farms originally non-complaint were identified with on-going non-compliance upon re-inspection. Two of these matters were responded to through escalation of the compliance response to a warning notice and the response on the remaining three has been on hold while issues regarding the enforceability of Chapter 4A were resolved.
Industry engagement and staff training was a significant resource investment during the fourth Quarter of the financial year. The timing of the investment was in preparation for the commencement of compliance activities in the Mackay Whitsunday area with the inaugural compliance activities scheduled for the first Quarter of the 2017/2018 financial year.
Compliance activities and results Quarters one and two align with the greater part of the sugar cane industry harvest or crushing season. Consequently the majority of inspection investment for MaNQC has been focussed during quarter three and quarter four at a time when Authorised Officers are most likely to be able to review records and practices without impeding agricultural productivity. Figure 1 below shows the number of inspections by quarter for the program to date.
17-426 File D Page 52 of 128Release
Publis
hed o
n DES D
isclos
ure Lo
g
RTI Act
2009
2016/2017 Reef Compliance Program
2
Figure 1. Quarterly inspection numbers for each priority catchment.
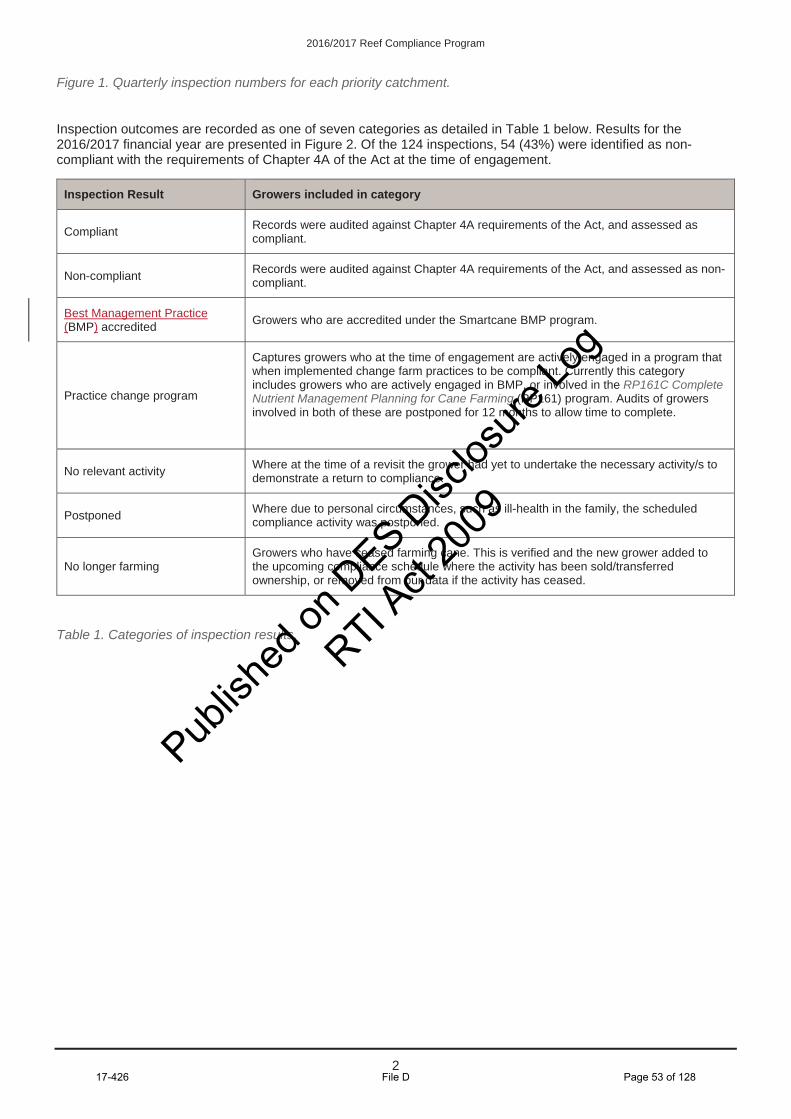
Inspection outcomes are recorded as one of seven categories as detailed in Table 1 below. Results for the 2016/2017 financial year are presented in Figure 2. Of the 124 inspections, 54 (43%) were identified as non-compliant with the requirements of Chapter 4A of the Act at the time of engagement.
Table 1. Categories of inspection results.
Inspection Result Growers included in category
Compliant Records were audited against Chapter 4A requirements of the Act, and assessed as compliant.
Non-compliant Records were audited against Chapter 4A requirements of the Act, and assessed as non-compliant.
Best Management Practice (BMP) accredited Growers who are accredited under the Smartcane BMP program.
Practice change program
Captures growers who at the time of engagement are actively engaged in a program that when implemented change farm practices to be compliant. Currently this category includes growers who are actively engaged in BMP, or involved in the RP161C Complete Nutrient Management Planning for Cane Farming (RP161) program. Audits of growers involved in both of these are postponed for 12 months to allow time to complete.
No relevant activity Where at the time of a revisit the grower had yet to undertake the necessary activity/s to demonstrate a return to compliance.
Postponed Where due to personal circumstances, such as ill-health in the family, the scheduled compliance activity was postponed.
No longer farming Growers who have ceased farming cane. This is verified and the new grower added to the upcoming compliance schedule where the activity has been sold/transferred ownership, or removed from our data if the activity has ceased.
17-426 File D Page 53 of 128
Publis
hed o
n DES D
isclos
ure Lo
g
RTI Act
2009

2016/2017 Reef Compliance Program
3
Figure 2. Inspection results (%) for the 2016-2017 financial year.
Figure 3 shows the inspection results by priority catchment. Note the small sample size means this should only be interpreted as a presentation of what was found and not representative of broader trends across the priority catchments.
17-426 File D Page 54 of 128
Publis
hed o
n DES D
isclos
ure Lo
g
RTI Act
2009

2016/2017 Reef Compliance Program
4
Figure 3. Inspection results (%) for each priority catchment for the 2016-2017 financial year.
The reasons for the assessed non-compliance against Chapter 4A requirements are presented in figure 4 for each priority catchment. Again the small sample size means this should be read as a presentation of what was encountered and not indicative of broader trends in the respective areas.
Please note the reasons for non-compliance are not mutually exclusive and one client may be non-complaint for multiple categories. These reasons are often interrelated, and the failure to keep the required records and undertake soil testing are primary drivers of non-compliance for both catchments.
Figure 4. Summary of the reason(s) for non-compliance within each priority catchment for the 2016-2017 financial year.
17-426 File D Page 55 of 128
Publis
hed o
n DES D
isclos
ure Lo
g
RTI Act
2009

2016/2017 Reef Compliance Program
5
Figure 5 shows the outcomes of 22 revisits during the financial year, to sites identified as either Non-compliant or Under Assessment in the initial inspection. Of these, five were assessed as still non-compliant. Two of those were issued formal warnings, and the response on the remaining three has been on hold while issues regarding the enforceability of Chapter 4A were resolved.
Figure 5. Summary of inspection results following revisit during the 2016-2017 financial year.
The results of this year's compliance activities have been provided to DAF for incorporation into the Paddock to Reef modelling program. This information will be used to inform the modelling of water quality benefits gained from reef funding.
Future planning and work The inspection targets for the 2017/2018 financial year will be based on an inspection number per FTE per month in line with the new approach to compliance planning in ESR. For Northern Region this will equate to 207 compliance activities for the financial year, increasing from the 124 for the 2016/2017 financial year. The Mackay office staffing will equate to 110 compliance activities for the year.
The significant investment in the identification, collation and cleansing of available data, along with staff training in open source investigation techniques, has significantly improved our ability to contact growers. Work in this space will continue and may include the use of statutory notices under the Act to access industry held data such as mill records.
Engagement with cane industry Over the course of the year, there has been engagement with all major grower representative organisations in the Wet Tropics and Burdekin, with a focus on continuing to build rapport and relationships with the industry. This ongoing dialogue has provided a forum to solicit feedback on compliance related issues that have been raised and
17-426 File D Page 56 of 128
Publis
hed o
n DES D
isclos
ure Lo
g
RTI Act
2009

2016/2017 Reef Compliance Program
6
has allowed these to be addressed quickly. This engagement has facilitated the maintenance of a constructive working relationship with industry.
A trade stall was held at the Grow and Show Burdekin Field Days to help raise the profile of the compliance program and knowledge of Chapter 4A requirements. An additional stall was planned at the planned Australian Cane Farmers Association Step Up conference in Mackay, and was cancelled due to Cyclone Debbie. This has been rescheduled for 2018.
In preparation for the commencement of compliance activities in the Mackay Whitsunday area, an initial round of industry engagement was held in late May and early June to brief key contacts and introduce the program.
Presentations on the reef compliance program were given at three Fertiliser Australia Fertcare workshops held during the year (Burdekin, Cairns and Townsville). These provided information to resellers on the requirements of the current compliance activities to assist their key service provider role for growers.
Additionally advertising was placed in 13 targeted publications to promote legislative requirements when fertilising cane crops in priority catchments.
TrainingOver the course of the financial year an additional 17 staff in Northern Region were trained in reef compliance activities related to the fertiliser application requirements to build capacity in the work group. This was supplemented through a mentoring process where experienced officers were partnered with newly trained officers on compliance activities to facilitate skills transfer.
Sugar Research Australia was engaged to deliver 6 Easy Steps training in both the Cairns and Townsville offices, to familiarise staff with the industry standard which forms the basis for the approved method. Twenty-five (25) staff attended these sessions.
Both office and on farm training was provided to 7 Mackay staff in preparation for the expansion of the reef compliance activities into the Mackay/Whitsunday priority catchment area in the 2017/2018 financial year. This was delayed following Cyclone Debbie which in turn meant the planned mentoring for the Mackay Office staff was postponed to the first Quarter of the 2017/2018 financial year.
A training package to improve officer skills in open source research was developed and delivered to 35 staff across the Mackay, Townsville and Cairns offices. This helps address some of the impediments caused by the lack of client data, and significantly improves our ability to identify who is undertaking the activity and how to contact them.
Compliance Processes Work effort was invested in developing and documenting a standardised work flow to facilitate a consistent approach across the industry from the Cairns, Townsville and Mackay offices. This includes the development of templates for pre and post inspection correspondence, standard timeframes, engagement processes, escalation processes, and initial enforcement templates. .
Data Capture and Management Compliance data capture is ongoing and provides an effective tool to record, track and plan compliance effort. In the priority catchments a historical cane farm spatial layer developed in 2010 has now been updated. The layer was verified against land use mapping (QLUMP 2009), Queensland Valuation and Sales (QVAS) and aerial imagery, then updated with the results from inspected properties. This layer will continue to be updated for land owner and responsible farming entity into the 2017/2018 financial year. A mailing list is now also available for property owners in the Wet Tropics area based on QVAS information. Mailing lists for the Burdekin and Mackay-Whitsunday areas will be completed in the first Quarter of the 2017/2018 program.
Ongoing engagement with Project Unify has been occurring and the reef CONNECT package has been reviewed and updated to ensure it aligns with and incorporates the current work processes. Once the transition to connect has occurred the data capture and reporting functions should become quicker and less labour intensive. This will also facilitate consistency of compliance delivery once CONNECT is active. Challenges will remain in the prioritisation of compliance effort as outlined in the section below.
Spatial data for the three priority reef catchments about modelled nutrient loads by sub-catchment, was supplied in June by the Paddock to Reef Modelling team (NRM). Work is also underway to build a client information database from open sources. Data collected includes the participation of clients in various programs such as the SmartCane BMP accreditation scheme. This data will be used in the 2017/18 financial year to further develop a Reef Compliance Prioritisation Model.
While the above work has significantly improved the ability to plan, track and record compliance activities, data
17-426 File D Page 57 of 128
Publis
hed o
n DES D
isclos
ure Lo
g
RTI Act
2009

2016/2017 Reef Compliance Program
7
capture and management will remain an ongoing component of the program in the 2017/18 financial year.
The potential to use s.451 notices under the Environmental Protection Act 1994 to obtain data held by sugar mills is being reviewed as a mechanism to address the information deficit created by the current legislative framework. There is potential to gain information to identify growers and their contacts, along with yield information. This data could be used to reduce the resourcing required to identity growers and find contact information, and yield information could be used in the assessment of risk to inform inspection prioritisation.
Compliance Prioritisation The compliance prioritisation approach developed in the 2016/2017 financial year is continuing to guide the roll out of field compliance activities. This approach targets high risk sub-catchments for inspection, based on outputs from the Paddock to Reef modelling program, and randomly selects farmers within each sub-catchment.
A Reef Compliance Prioritisation Model is under development, and assigns individual cadastral parcels a compliance risk, based on a range of geographical and client risk factors. This approach will continue to include the outputs of the Paddock to Reef modelling program, however will include additional risk factors such as client performance, with the aim that more compliance effort will be targeted at higher risk farms. This model will be tested and refined in the coming months, and if successful, will be rolled out later in the 2017/2018 financial year.
Use of remote sensing technologies to identify potential areas of higher nutrient input is also currently under investigation. Use of a drone was reviewed but presents challenges in relation to the limited area of operation. Alternative imagery and processing methodologies will be investigated further in the 2017/2018 financial year.
Establishment Management 9 FTE's were funded to deliver compliance activities on the fertiliser application requirements over the financial year; comprised of 7 officers in Northern Region (7 FTE), 1 Program Coordinator (1 FTE), 1 Senior Program Officer (0.6FTE).
An additional Senior Program Officer was engaged in Q4 using vacancy salary savings against a base MaNQC AO6 position to support the reef program through the sourcing and analysing industry and grower specific data to support compliance activities, and the review and development of compliance processes.
Contract extensions were undertaken for 5 reef funded positions to take them through the 2017/2018 financial year. The Senior Program Officer role has been through an open merit recruitment process to fill it for the 2017/2018 financial year.
17-426 File D Page 58 of 128
Publis
hed o
n DES D
isclos
ure Lo
g
RTI Act
2009

2016/2017 Reef Compliance Program
8
Water quality monitoring Minerals and North Queensland Compliance is continuing to contribute to the Department of Science, Information Technology and Innovation (DSITI) Healthy Waterways Program. The current resource investment from MaNQC is 3 days per month to help fill data gaps in priority catchments. Monitoring sites are shown in the map below.
17-426 File D Page 59 of 128
Publis
hed o
n DES D
isclos
ure Lo
g
RTI Act
2009

2016/2017 Reef Compliance Program
9
ChallengesThe continued roll out of the program has highlighted some key challenges in the way commercial sugar cane growing is regulated under the Act. Most notably the current regulation does not provide the department with data on who is undertaking the regulated activity and where they operate, and does not provide regulated growers with a clear set of expectations of what is required from them.
Lack of/difficulty of access to grower information along with contact details has been a significant challenge to the reef compliance program. This is not an issue in other areas of MaNQC compliance activity as most clients are holders of an environmental authority (EA) under the Act, providing client identification and contact information. An alternative mechanism such as a farm business registration/suitable operator registration may provide a solution and will be investigated further in the 2017/2018 financial year.
Due to the lack of an EA or equivalent document that clearly sets out what is required, officers regularly encounter growers who convey they are uncertain of what is expected of them. Options and opportunities to address this will be investigated and pursued during the 2017/2018 financial year.
During the financial year it was identified that the department copy of the prescribed map referred to in s.75(3)(a) was marked draft. This map is integral to the definition of agricultural ERAs and consequently the enforceability of Chapter 4A Great Barrier Reef Protection Measures. Some compliance actions have been delayed as a result until this matter was resolved. Further legal advice has now been received which provides guidance on this issue and the matter should be resolved in the coming month.
Priority actions for the 2017/2018 financial year The delivery of 207 compliance activities in the Wet Tropics and Burdekin priority catchments and 110
compliance activities for the Mackay Whitsunday priority catchment. Resolution of prescribed map issue. Amendment of legislation to provide a regulatory framework to support efficient and effective compliance, with a
particular focus on obtaining information on who is undertaking the regulated activity and where they operate, and providing regulated growers with a clear set of expectations of what is required from them.
Assess the potential to use s.451 notices under the Environmental Protection Act 1994 to obtain data held by sugar mills as a mechanism to address the information deficit created by the current legislative framework.
Continue spatial data work to consolidate existing information, improve data capture and management, provide a framework for risk based compliance targeting, identify key knowledge gaps, and support compliance planning and reporting, including practice change.
Investigate imagery and processing methodologies to inform risk assessment for prioritisation. Continue to work with Project Unify team to streamline future reef compliance data capture and reporting. Continue training, capacity building and industry engagement in Northern and Central Regions.
2016/2017 Compliance effort mapping Results of the 2016/2017 compliance activities are shown by each surface water drainage basin (as mapped by the department of Natural Resources and Mines) in each of the following maps.
17-426 File D Page 60 of 128
Publis
hed o
n DES D
isclos
ure Lo
g
RTI Act
2009

2016/2017 Reef Compliance Program
10 17-426 File D Page 61 of 128
sch4p4( 6) Personal Information
Publis
hed o
n DES D
isclos
ure Lo
g
RTI Act
2009

2016/2017 Reef Compliance Program
11 17-426 File D Page 62 of 128
sch4p4( 6) Personal Information
Publis
hed o
n DES D
isclos
ure Lo
g
RTI Act
2009

2016/2017 Reef Compliance Program
12 17-426 File D Page 63 of 128
sch4p4( 6) Personal Information
Publis
hed o
n DES D
isclos
ure Lo
g
RTI Act
2009

2016/2017 Reef Compliance Program
13 17-426 File D Page 64 of 128
sch4p4( 6) Personal Information
Publis
hed o
n DES D
isclos
ure Lo
g
RTI Act
2009

2017-2018 Reef Compliance Program End of Financial Year and Quarter Four Report
Minerals and North Queensland Compliance and Coal and Central Queensland Compliance, Environmental Services and Regulation.
Overview
The reef compliance program funds thirteen full time employees (FTE) to administer the regulatory provisions of Chapter 4A of the Environmental Protection Act 1994 (the Act). The program is coordinated by two staff in Minerals and North Queensland Compliance (MaNQC), with compliance activities (CAs) undertaken by eleven compliance officers in the MaNQC and Coal and Central Queensland Compliance (CaCQC) business units. Compliance officers are based in three offices in Cairns, Townsville and Mackay, covering the three priority areas of the Wet Tropics, Burdekin Dry Tropics and the Mackay-Whitsunday catchments.
The 2017-2018 reef compliance program deliverable of 317 proactive CAs was exceeded, with 334 CAs delivered across the three target areas. The program has prioritised CAs to initial grower engagement this financial year to educate growers about the reef protection requirements, and revisit inspections have been limited.
Compliance activities
A total of 334 CAs were completed by MaNQC and CaCQC in the 2017-2018 financial year (17-18 FY), with a quarter four (Q4) total of 98 CAs. A breakdown of CA numbers for each quarter is outlined in Appendix 1. Compliance activities are undertaken as either a physical inspection (grower meeting), or a desktop audit of a grower’s active engagement in a practice change program or accreditation under the Smartcane Best Management Practice (BMP) program.
Revisits to sites identified as non-compliant in the initial engagement were limited in the 17-18 FY, with 14 revisit inspections undertaken. A program of revisit inspections is planned for Q1 in the 2018-2019 financial year (18-19 FY). The 334 CAs completed equates to an average pro-rata inspection rate for each of the 11 compliance officers of approximately 2.8 CA/officer/month over 11 months, exceeding the 2017/2018 project plan target rate of 2.5 CA/officer/month. Compliance activities are delivered at a variable rate across the year, with lower inspection numbers in Q1 and Q2, to coincide with the peak period for on-farm activities. Consequently, the majority of CAs are focussed during Q3 and Q4 at a time when compliance officers are most likely to be able to review records and practices without impeding on-farm operations.
Compliance activities commenced in the Mackay-Whitsunday catchment in Q1. Due to the impacts of Tropical Cyclone Debbie in this region, inspections were focussed in the least impacted areas close to Mackay throughout Q1 and Q2.
CAs in Q3 were cancelled in parts of the Wet Tropics catchment, including the Herbert, Tully-Murray and lower part of the Johnstone basins, due to the impact of severe wet season flooding in early 2018. This resulted in widespread damage and the declaration a disaster area in the Herbert basin. Areas of the Herbert close to the river and in the lower delta continue to be impacted, and CAs are currently focussed outside these areas. This will be reviewed during Q2 of the 18-19 FY.
Results for CAs to the end of the financial year are presented in Appendix 1, with maps of the compliance effort by basin in Appendix 2.
Engagement with cane industry
A constructive working relationship with the cane industry continues at both the program coordination and officer level. The Smartcane BMP facilitators engage regularly with program staff and are an important source of feedback on the operation of the compliance program. Facilitators report a positive impact of the reef compliance program on increasing the level of engagement with the Smartcane BMP program.
17-426 File D Page 65 of 128
Release
Publis
hed o
n DES D
isclos
ure Lo
g
RTI Act
2009

2017-2018 Reef Compliance Program
2
Program staff attended a trade stall at the Australian Cane Farmers Association's Case IH Step Up conference in Mackay in March 2018. This provided opportunities for informal discussions with the industry representatives present, and the presence of the trade stall assists in embedding the Department of Environment and Science’s (the department) reef compliance program as part of the industry. Key industry engagement at the conference included: Australian Cane Farmers Association, Farmacist, and Smartcane BMP. The stall was well attended by both growers and industry representatives.
Program staff also held a trade stall again this year at the Burdekin Grow N Show Field Day in April 2018. This was useful in maintaining a departmental presence in the community. Direct grower engagement at this event proved difficult with lower levels of engagement than at the Step Up conference, and at last year’s event.
A new Community Engagement (CE) team has been established as part of the ESR division's engagement with stakeholders and the community. The CE team has been engaging with fertiliser sellers in the Burdekin area. This work has highlighted a good level of understanding of the reef regulation requirements. Program staff in the Mackay office also continue to build relationships with industry representatives at the local level.
Training
In preparation for the expansion of the RP161 program to the Mackay Whitsunday area, Farmacist provided training to compliance staff at the Mackay office in March 2018.
Training of all compliance officers in Cairns, Townsville and Mackay offices has now been completed, with training now delivered to new staff as required. An additional two new staff were trained in Townsville in Q3.
Staff have also been provided with briefings and supporting information on the proposed new reef regulations in preparation for possible questions during CAs.
Other program deliverables
ESR is continuing to contribute to water quality monitoring in the Wet Tropics through the DES Healthy Waterways Program. The current resource investment is 3 days per month.
Additional program tools developed to support compliance officers include a SharePoint page with links to support materials and templates, and preparation of a draft reef procedural guide for sugarcane farm inspections. A Connect guide was drafted for Connect testing in Q1 and will be finalised with further roll-out of the Connect program (see Data capture and management section).
ESR staff have been working with Office of the Great Barrier Reef staff during Q2-Q4 on the progression of the proposed reef regulations through a dedicated working group. The review of various drafts of proposed new regulations and subordinate practice standards has been a priority for program coordination staff and the division has applied additional (non-reef funded) resource from Regulation Support to assist in this review. This has resulted in the reprioritisation or delay of other program deliverables this financial year.
The compliance prioritisation approach developed in the 2016-2017 financial year is continuing to guide the roll out of field compliance activities. This approach targets high risk sub-catchments for inspection, based on outputs from the Paddock to Reef modelling program, and randomly selects farmers within each sub-catchment. A trial of client prioritisation using remote sensing of biomass was completed in Q2. The initial work did not correlate with inspection results and further investigation and refinement of this technique is required. Further development and testing of a reef compliance prioritisation model, including the remote sensing trial, was placed on hold in Q2 due to competing work demands. This work will be recommenced in the 18-19 FY.
The potential to use s.451 notices under the Environmental Protection Act 1994 to obtain data held by sugar mills has not been progressed. While there is potential to gain information to identify growers and their contact details, along with yield information, this approach is likely to result in significant grower concerns about data privacy. Additionally the lack of a prescribed map as discussed in key issues below, impacts the use of this section for this purpose. The program does not intend to revisit this until the s.75 map issue is resolved.
Exception reporting on deliverables
The addition of the review work for the enhanced reef regulations has impacted on the ability of program staff to deliver on planned program tasks in the latter part of this reporting period. This was compounded by the vacancy in the Senior Program Officer position over the December to March period. The exception to deliverables is:
• Verification testing of a reef compliance prioritisation model was placed on hold.
17-426 File D Page 66 of 128
Publis
hed o
n DES D
isclos
ure Lo
g
RTI Act
2009

2017-2018 Reef Compliance Program
3
Data capture and management
Compliance data capture is ongoing and as outlined above, remains a key issue for program delivery. An updated extract of the Queensland Valuation and Sales (QVAS) data of property owners and contacts was requested during Q4 and supplied in July 2018. This property ownership data will be used for the 18-19 FY.
The reef CONNECT package is operational and was trialled in Q1 and Q2, however the full CONNECT roll-out was placed on hold later in Q2, due to operational issues with parts of the package related to other ESR business. It is expected the reef CONNECT package will be operational in the 18-19 FY.
Data capture and management will remain an ongoing component of the program throughout the 18-19 FY.
Summary statistics of all CA results for the program to 31 March 2018 were supplied to the Department of Agriculture and Fisheries (DAF) for incorporation into the Paddock to Reef modelling program. This information will be used in quality assurance of similar data about farm practice results collated from other sources, which DAF is using to benchmark the effectiveness of measures under the Reef 2050 Water Quality Improvement Plan. Additionally the provision of full year de-identified spatial data to DAF is currently being progressed through an administrative access request.
Budget
The program budget for the financial year was $1,325,420.00, allocated to MaNQC ($922,532.00) and CaCQC ($402,888.00). The final end-of-year variance for the program was a $46,188.20 underspend, equating to approximately 3.5% of the budget. An additional $30,346.00 of unspent budget from the 2016-17 financial year was journaled over during the financial year and is included in the final underspend. A breakdown of the budget expenditure for the financial year is included at Appendix 3.
Establishment management
Thirteen full time employees (FTE) are funded to deliver the Reef Compliance Program under the Reef Water Quality program; comprised of 7 compliance officers (PO3/PO2), 1 Program Coordinator (AO7), 1 Senior Program Officer (AO6), and 4 compliance officers (PO4/PO3) in Central Region.
Both the Program Coordinator and Senior Program Officer roles were vacant over the December to January and December to March periods respectively, due to temporary acting arrangements by both incumbents, to maintain ESR service delivery capacity. Both positions were filled on a temporary acting basis throughout Q3 and Q4 due to continued higher duties by the incumbents, which will continue into Q1 18-19 FY.
Multiple reef funded positions including the AO7, AO6 and PO3s have reached the end of their temporary appointments and are required to go through recruitment. This recruitment is currently on hold awaiting approval through the establishment management process. Subject to approval a recruitment process for the MaNQC reef-funded AO7, AO6, and PO3 positions will be undertaken for the 18-19 FY.
Key issues
The significant investment in the identification, collation and cleansing of available data has improved the ability of ESR to contact growers; however this continues to require significant resourcing for CA planning and delivery. The difficulties in contacting growers and the time taken for growers to respond, continues to impact the timely delivery of compliance activities, with 93 of the scheduled inspections for 17-18 FY, not completed in the same quarter for this reason. A further 39 inspections required replacement during the same period, due to the properties either no longer farming sugarcane or in the process of sale. A legislative mechanism to identify who is undertaking the regulated activity and where they operate, such as grower registration, would have significant benefits for the delivery of compliance activities. Additionally this would provide the department with the ability to communicate a clear set of expectations to persons undertaking the activity, supporting voluntary compliance, and clearly identifying who is undertaking the activity for compliance purposes.
As reported in the Q1-Q3 quarterly report, it was identified late last financial year that the copy of the map held by the department under s.75 of the Act was marked "Draft". The map forms part of the definition of an agricultural environmentally relevant activity, which is a key element for the enforceability of requirements under Chapter 4A of the Act. Resolving the questions regarding enforceability created by the absence of a labelled final version of the prescribed map under s.75 is a key element for supporting formal compliance engagement under Chapter 4A. The Deputy Director General of ESR has been briefed on this issue in collaboration with the Executive Director of the Office of the GBR.
17-426 File D Page 67 of 128
Publis
hed o
n DES D
isclos
ure Lo
g
RTI Act
2009
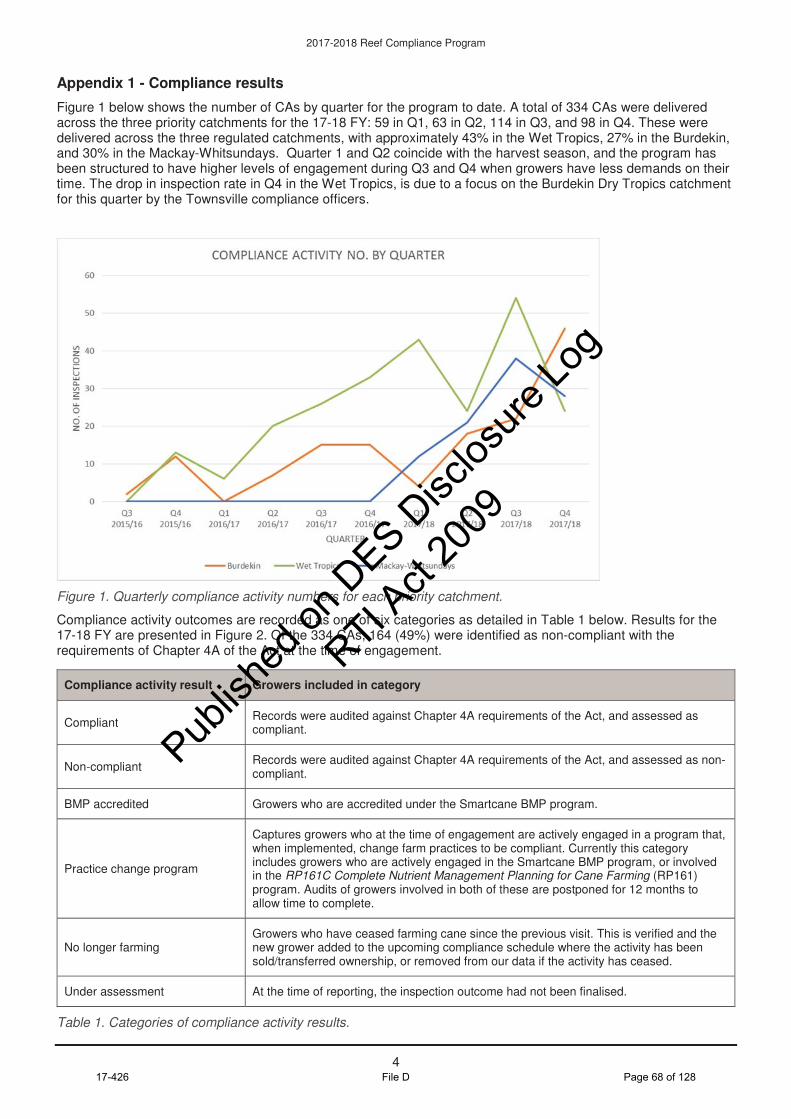
2017-2018 Reef Compliance Program
4
Appendix 1 - Compliance results
Figure 1 below shows the number of CAs by quarter for the program to date. A total of 334 CAs were delivered across the three priority catchments for the 17-18 FY: 59 in Q1, 63 in Q2, 114 in Q3, and 98 in Q4. These were delivered across the three regulated catchments, with approximately 43% in the Wet Tropics, 27% in the Burdekin, and 30% in the Mackay-Whitsundays. Quarter 1 and Q2 coincide with the harvest season, and the program has been structured to have higher levels of engagement during Q3 and Q4 when growers have less demands on their time. The drop in inspection rate in Q4 in the Wet Tropics, is due to a focus on the Burdekin Dry Tropics catchment for this quarter by the Townsville compliance officers.
Figure 1. Quarterly compliance activity numbers for each priority catchment.
Compliance activity outcomes are recorded as one of six categories as detailed in Table 1 below. Results for the 17-18 FY are presented in Figure 2. Of the 334 CAs, 164 (49%) were identified as non-compliant with the requirements of Chapter 4A of the Act at the time of engagement.
Table 1. Categories of compliance activity results.
Compliance activity result Growers included in category
Compliant Records were audited against Chapter 4A requirements of the Act, and assessed as compliant.
Non-compliant Records were audited against Chapter 4A requirements of the Act, and assessed as non-compliant.
BMP accredited Growers who are accredited under the Smartcane BMP program.
Practice change program
Captures growers who at the time of engagement are actively engaged in a program that, when implemented, change farm practices to be compliant. Currently this category includes growers who are actively engaged in the Smartcane BMP program, or involved in the RP161C Complete Nutrient Management Planning for Cane Farming (RP161) program. Audits of growers involved in both of these are postponed for 12 months to allow time to complete.
No longer farming Growers who have ceased farming cane since the previous visit. This is verified and the new grower added to the upcoming compliance schedule where the activity has been sold/transferred ownership, or removed from our data if the activity has ceased.
Under assessment At the time of reporting, the inspection outcome had not been finalised.
17-426 File D Page 68 of 128
Publis
hed o
n DES D
isclos
ure Lo
g
RTI Act
2009

2017-2018 Reef Compliance Program
5
Figure 2. Aggregated compliance activity results (%) for the Wet Tropics, Burdekin and Mackay-Whitsundays priority areas, for the 2017-2018 financial year.
Figure 3 shows the compliance activity results for 17-18 FY by priority catchment. Note the small sample size means this should only be interpreted as a presentation of what was found and not representative of broader trends across the priority catchments. There are differences in non-compliance by priority area, with the Mackay-Whitsundays area recording the highest levels of non-compliance (approximately 67%), and the Wet Tropics the lowest (approximately 38%). The Mackay-Whitsundays also had the lowest levels of engagement in or accreditation under the Smartcane BMP program. For comparison, the non-compliance recorded during initial stages of the Reef Compliance Program in those areas (2016/17 financial year) was approximately 40% in the Wet Tropics, and approximately 54% in the Burdekin.
17-426 File D Page 69 of 128
Publis
hed o
n DES D
isclos
ure Lo
g
RTI Act
2009

2017-2018 Reef Compliance Program
6
Figure 3. 2017-2018 financial year compliance activity results (%) for each of the three priority areas: Wet Tropics, Burdekin and Mackay-Whitsundays.
Comparative results by river basin are shown in Figure 4, and detailed in Table 2. The highest levels of non-compliance (where there are sufficient inspection records) are recorded in the Herbert, O'Connell, Pioneer, Proserpine, and Plane basins at between approximately 64-71%. The levels of accreditation under or actively engagement in the Smartcane BMP program continue to be higher in the Wet Tropics area, with the highest in the Johnstone (73%) followed by the Tully (71%) basins. Levels of engagement in the RP161 program are higher in the Burdekin than in the Haughton basins.
17-426 File D Page 70 of 128
Publis
hed o
n DES D
isclos
ure Lo
g
RTI Act
2009

2017-2018 Reef Compliance Program
7
Figure 4. 2017-2018 financial year compliance activity results for each river basin. See Table 2 for detailed results. Note: Where growers own farms in more than one catchment e.g. the Tully-Murray and Mossman-Daintree basins, these results are presented as amalgamated basins.
17-426 File D Page 71 of 128
Publis
hed o
n DES D
isclos
ure Lo
g
RTI Act
2009

2017-2018 Reef Compliance Program
8
Table 2. 2017-2018 financial year compliance activity results for each river basin showing the number of sites in each category, with the percentage of each category result/basin. See Figure 4 for depiction. Note: Where growers own farms in more than one catchment e.g. the Tully-Murray and Mossman-Daintree basins, these results are presented as amalgamated basins.
The reasons for the assessed non-compliance against Chapter 4A requirements are presented in Figure 4 for each priority catchment. Again the small sample size means this should be read as a presentation of what was encountered and not indicative of broader trends in the respective areas. A comparison across the three priority areas, shows different results by area. Failure to soil test is higher in the Burdekin (72%) and lowest in the Wet Tropics (65%). Non-compliance with record keeping requirements is similar in the Burdekin and the Mackay-Whitsundays areas (84%) and lowest in the Wet Tropics (61%). Non-compliance with Nitrogen application rates is similar in all areas; however Phosphorous application non-compliance is higher in the Wet Tropics (82%) than the other two areas (74%).
Please note the reasons for non-compliance are not mutually exclusive and one client may be non-complaint for multiple categories. These reasons are often interrelated, and the failure to keep the required records and undertake soil testing are primary drivers of non-compliance for all priority areas.
Figure 5. Summary of the reason(s) for non-compliance within each priority catchment for the 2017-2018 financial year. Non-compliance reason results shown as the percentage of each reason of the overall basin non-compliance result – note reasons are not exclusive and overlap.
Figure 5 shows the outcomes of 14 revisits during the financial year to date. Of these, six were assessed as still non-compliant. An enforcement response for three of those is on hold while issues related to the enforceability of Chapter 4A are resolved. The remaining three clients made progress towards compliance including having changed farm practices. A further follow-up inspection will be scheduled with these clients.
A comparison with results from last financial year, indicates a higher level of non-compliance on revisit (23% last year). Approximately the same level of active engagement in or accreditation under the BMP program (approximately a third of revisits) was recorded; however more clients are now accredited (9% last year). Due to the very small sample size, these results should not be interpreted as an indication of broader trends.
17-426 File D Page 72 of 128
Publis
hed o
n DES D
isclos
ure Lo
g
RTI Act
2009

2017-2018 Reef Compliance Program
9
Figure 6. Summary of results following revisit during the 2017-2018 financial year.
17-426 File D Page 73 of 128
Publis
hed o
n DES D
isclos
ure Lo
g
RTI Act
2009

2017-2018 Reef Compliance Program
10
Appendix 2 – Compliance effort mapping for the 2017-2018 financial year
Results of the 17-18 FY compliance activities are shown by each surface water drainage basin (as mapped by the department of Natural Resources and Mines) in each of the following maps.
17-426 File D Page 74 of 128
Publis
hed o
n DES D
isclos
ure Lo
g
RTI Act
2009

2017-2018 Reef Compliance Program
11 17-426 File D Page 75 of 128
sch4p4( 6) Personal Information
Publis
hed o
n DES D
isclos
ure Lo
g
RTI Act
2009
12 17-426 File D Page 76 of 128
sch4p4( 6) Personal Information
Publis
hed o
n DES D
isclos
ure Lo
g
RTI Act
2009

2017-2018 Reef Compliance Program
13 17-426 File D Page 77 of 128
sch4p4( 6) Personal Information
Publis
hed o
n DES D
isclos
ure Lo
g
RTI Act
2009

2017-2018 Reef Compliance Program
14 17-426 File D Page 78 of 128
sch4p4( 6) Personal Information
Publis
hed o
n DES D
isclos
ure Lo
g
RTI Act
2009

2017-2018 Reef Compliance Program
15 17-426 File D Page 79 of 128
sch4p4( 6) Personal Information
Publis
hed o
n DES D
isclos
ure Lo
g
RTI Act
2009

2017-2018 Reef Compliance Program
16 17-426 File D Page 80 of 128
sch4p4( 6) Personal Information
Publis
hed o
n DES D
isclos
ure Lo
g
RTI Act
2009

2017-2018 Reef Compliance Program
17 17-426 File D Page 81 of 128
sch4p4( 6) Personal Information
Publis
hed o
n DES D
isclos
ure Lo
g
RTI Act
2009

2017-2018 Reef Compliance Program
18 17-426 File D Page 82 of 128
sch4p4( 6) Personal Information
Publis
hed o
n DES D
isclos
ure Lo
g
RTI Act
2009
2017-2018 Reef Compliance Program
19 17-426 File D Page 83 of 128
sch4p4( 6) Personal Information
Publis
hed o
n DES D
isclos
ure Lo
g
RTI Act
2009

2017-2018 Reef Compliance Program
20
Appendix 3 – Reef compliance program expenditure for the 2017-2018 financial year
Minerals and North Queensland Compliance expenditure – cost centre 1000912
ACCOUNT DESCRIPTION YTD BUDGET YTD ACTUAL TOTAL BUDGET TOTAL VARIANCE
Accommodation & Related 1,500 750 1,500 750
Consumables 5,401 2,768 5,401 2,633
Employee Related Expenses 809,328 795,621 809,328 13,707
Grants & Subsidies 0 0 0 0
Low Value Assets 0 234 0 -234
Motor Vehicles 30,000 21,233 30,000 8,767
Network & Computer 14,088 12,413 14,088 1,675
Other Expenses 27,400 9,173 27,400 18,227
Telephone & Fax 4,815 3,077 4,815 1,738
Training & Development 5,000 0 5,000 5,000
Travel 25,000 16,554 25,000 8,446
Grand Total 922,532 861,823 922,532 60,709
Coal and Central Queensland Compliance expenditure - cost centre 1000913
ACCOUNT DESCRIPTION YTD BUDGET YTD ACTUAL TOTAL BUDGET TOTAL VARIANCE
Accommodation & Related 0 0 0 0
Consumables 5,102 0, 5,102 5,102
Employee Related Expenses 362,573 410,848.24 362,573 -48,275.24
Grants & Subsidies 0 0 0 0
Low Value Assets 0 0 0 0
Motor Vehicles 0 0 0 0
Network & Computer 6,432 5,644.24 6,432 787.76
Other Expenses 5,101 3.26 5,101 5,097.74
Telephone & Fax 1,680 0 1,680 1,680
Training & Development 0 0 0 0
Travel 22,000 913.06 22,000 21,086.94
Grand Total 402,888 417,408.80 402,888 -14,520.80
17-426 File D Page 84 of 128
Publis
hed o
n DES D
isclos
ure Lo
g
RTI Act
2009

1
2017/2018 Reef Compliance Program Quarterly reports - Quarters One, Two and Three
Minerals and North Queensland Compliance and Coal and Central Queensland Compliance, Environmental Services and Regulation.
Compliance activities
During the first three quarters (Q1 - Q3) of the 2017/2018 financial year, Minerals and North Queensland Compliance and Coal and Central Queensland Compliance in Environmental Services and Regulation (ESR), completed 235 reef compliance activities (CA) with a further 110 activities planned for quarter four. This included both physical inspections and desktop audits. This translates to approximately 74% of the annual CA target and is therefore on track to deliver the annual deliverable of 317. A breakdown of CA numbers for each quarter is given in Appendix 1.
Late last financial year, it was identified that the copy of the map held by the department under s.75 of the Act was marked "Draft". The map forms part of the definition of an agricultural environmentally relevant activity, which is a key element for the enforceability of requirements under Chapter 4A of the Act. In this context the program has prioritised initial grower engagement to educate growers about the reef protection requirements. Revisits to sites identified as non-compliant in the initial inspection have been limited this financial year, with 12 revisit inspections undertaken to the end of Q3.
Compliance activities commenced in the Mackay Whitsunday area in Q1. Due to the impacts of Tropical Cyclone Debbie, inspections were focussed in those areas least impacted by this event during Q1 and Q2. Inspections in Q3 were also cancelled in parts of the Wet Tropics including the Herbert, Tully-Murray and lower part of the Johnstone basins, due to the impact of severe wet season flooding in early 2018. This resulted in widespread damage and the declaration a disaster area in the Herbert basin. Areas of the Herbert along the river and in the lower delta continue to be impacted, and CAs remain focussed outside these areas in Q4.
Results for CAs to the end of March 2018 are presented in Appendix 1, with maps of the compliance effort by basin in Appendix 2.
Engagement with cane industry
A constructive working relationship with the cane industry continues at both the program coordination and officer level. The Smartcane BMP facilitators engage regularly with program staff and are an important source of feedback on the operation of the compliance program. Facilitators report a positive impact of the reef compliance program on increasing the level of engagement with the Smartcane BMP program.
Program staff attended a trade stall at the Australian Cane Farmers Association's Case IH Step Up conference in Mackay in March 2018. This provided opportunities for informal discussions with the industry representatives present, and the presence of the trade stall assists in embedding the department's compliance program as part of the industry. Key industry engagement at the conference included: Australian Cane Farmers Association, Farmacist, and Smartcane BMP. The stall was well attended by both growers and industry representatives.
A trade stall was again held at the Burdekin Grow N Show Field Day in April 2018. This was useful in maintaining the department's presence in the community. Direct grower engagement at this event proved difficult with lower levels of engagement than at the Step Up conference.
A new Community Engagement (CE) team has been established as part of the Environmental Services and Regulation (ESR) division's engagement with stakeholders and the community. The CE team has been engaging with fertiliser sellers in the Burdekin area. This work has highlighted a good level of understanding of the reef regulation requirements. Program staff in the Mackay office also continue to build relationships with industry representatives at the local level.
17-426 File D Page 85 of 128Release
Publis
hed o
n DES D
isclos
ure Lo
g
RTI Act
2009

2017/2018 Reef Compliance Program: Quarterly Report Q1 – Q3
2
Training
In preparation for the expansion of the RP161 program to the Mackay Whitsunday area, Farmacist provided training to compliance staff at the Mackay office in March 2018.
Training of all compliance centre staff in Cairns, Townsville and Mackay offices has now been completed, with training now delivered to new staff as required. An additional two new staff were trained in Townsville in Q3.
Staff have also been provided with briefings and supporting information on the proposed new reef regulations in preparation for possible questions during CAs.
Other program deliverables
ESR is continuing to contribute to water quality monitoring in the Wet Tropics through the DES Healthy Waterways Program. The current resource investment is 3 days per month.
Additional program tools developed to support compliance officers include a SharePoint page with links to support materials and templates, and preparation of a draft reef procedural guide for sugarcane farm inspections. A Connect guide was drafted for Connect testing in Q1 and will be finalised with further roll-out of the Connect program (see Data capture and management section).
ESR staff have been working with Office of the Great Barrier Reef staff during Q2 and Q3 on the progression of the proposed reef regulations through a dedicated working group. The review of various drafts of proposed new regulations and subordinate practice standards has been a priority for program coordination staff. This has resulted in the reprioritisation or delay of other program deliverables this financial year.
The compliance prioritisation approach developed in the 2016/2017 financial year is continuing to guide the roll out of field compliance activities. This approach targets high risk sub-catchments for inspection, based on outputs from the Paddock to Reef modelling program, and randomly selects farmers within each sub-catchment. A trial of client prioritisation using remote sensing of biomass was completed in Q2. The initial work did not correlate with inspection results and further investigation and refinement of this technique is required. Further development and testing of a reef compliance prioritisation model, including the remote sensing trial, was placed on hold in Q2 and Q3 due to competing work demands.
Planning of the inspection targets for the first quarter of the 2018/2019 financial year has been finalised and overall numbers continue to be based on an inspection number per full time employee per month, in-line with ESR's compliance planning framework.
The potential to use s.451 notices under the Environmental Protection Act 1994 to obtain data held by sugar mills has not been progressed. While there is potential to gain information to identify growers and their contact details, along with yield information, this approach is likely to result in significant grower concerns about data privacy. Additionally the lack of a prescribed map as referenced above, impacts the use of this section for this purpose. The program does not intend to revisit this until the s.75 map issue is resolved.
Exception reporting on deliverables
The addition of the review work for the enhanced reef regulations has impacted on the ability of program staff to deliver on planned program tasks in the latter part of this reporting period. This was compounded by the vacancy in the Senior Program Officer position over the December to March period. The exception to deliverables are:
• Quarterly reports for the first two quarters were not finalised and delivered - now rectified and included in this Q3 report.
• Verification testing of a reef compliance prioritisation model has been placed on hold.
Data capture and management
Compliance data capture is ongoing and as outlined above, remains a key issue for program delivery. It has been identified that an updated extract of the Queensland Valuation and Sales (QVAS) data of property owners and contacts is required due to the high number of property sales encountered in Q3. This data update has been requested and will be delivered in July 2018.
The reef CONNECT package is operational and was trialled in Q1 and Q2, however the full CONNECT roll-out was placed on hold later in Q2 and in Q3, due to operational issues with parts of the package related to other ESR business.
While the above work has significantly improved the ability to plan, track and record compliance activities, data capture and management will remain an ongoing component of the program throughout the 2018/19 financial year.
17-426 File D Page 86 of 128
Publis
hed o
n DES D
isclos
ure Lo
g
RTI Act
2009

2017/2018 Reef Compliance Program: Quarterly Report Q1 – Q3
3
Establishment management
Thirteen full time employees (FTE) are funded to deliver the Reef Compliance Program under the Reef Water Quality program; comprised of 7 environmental officers in Northern Region, 1 Program Coordinator, 1 Senior Program Officer, and 4 environmental officers in Central Region.
Both the Program Coordinator and Senior Program Officer roles were vacant over the December to January and December to March periods respectively, due to temporary acting arrangements for both incumbents to maintain ESR service delivery capacity. Temporary arrangements have continued throughout Q3.
Key issues
The significant investment in the identification, collation and cleansing of available data has improved the ability of ESR to contact growers; however this continues to require significant resourcing for CA planning and delivery. The difficulties in contacting growers and the time taken for growers to respond, continues to impact the timely delivery of compliance activities, with 53 of the scheduled inspections for Q1 to Q3, not completed in the same quarter for this reason. A further 30 inspections required replacement during the same period, due to the properties either no longer farming sugarcane or in the process of sale. A legislative mechanism to identify who is undertaking the regulated activity and where they operate, such as grower registration, would have significant benefits for the delivery of compliance activities. Additionally this would provide the department with the ability to communicate a clear set of expectations to persons undertaking the activity, supporting voluntary compliance, and clearly identifying who is undertaking the activity for compliance purposes.
Resolving the questions regarding enforceability created by the absence of a labelled final version of the prescribed map under s.75 is a key element for supporting formal compliance engagement under Chapter 4A. The Deputy Director General of ESR has been briefed on this issue in collaboration with the Executive Director of the Office of the GBR.
The program is currently delivering under budget and is on track for the delivery of the annual compliance activity target.
17-426 File D Page 87 of 128
Publis
hed o
n DES D
isclos
ure Lo
g
RTI Act
2009
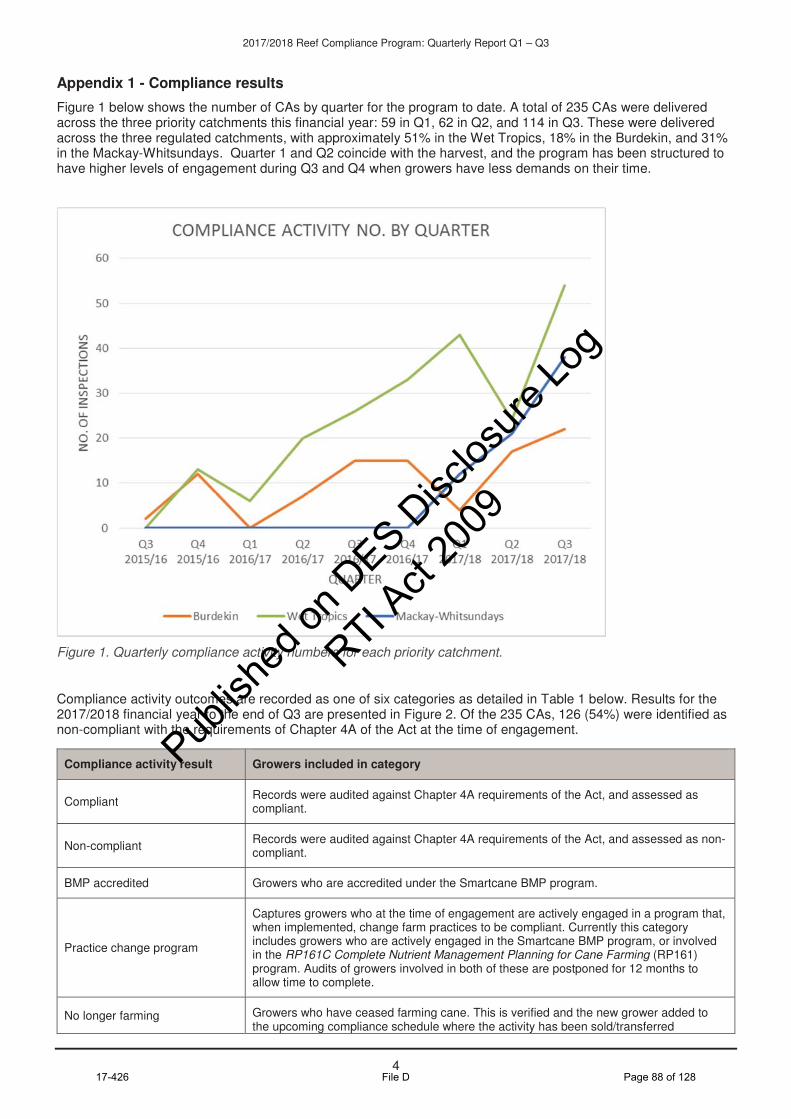
2017/2018 Reef Compliance Program: Quarterly Report Q1 – Q3
4
Appendix 1 - Compliance results
Figure 1 below shows the number of CAs by quarter for the program to date. A total of 235 CAs were delivered across the three priority catchments this financial year: 59 in Q1, 62 in Q2, and 114 in Q3. These were delivered across the three regulated catchments, with approximately 51% in the Wet Tropics, 18% in the Burdekin, and 31% in the Mackay-Whitsundays. Quarter 1 and Q2 coincide with the harvest, and the program has been structured to have higher levels of engagement during Q3 and Q4 when growers have less demands on their time.
Figure 1. Quarterly compliance activity numbers for each priority catchment.
Compliance activity outcomes are recorded as one of six categories as detailed in Table 1 below. Results for the 2017/2018 financial year to the end of Q3 are presented in Figure 2. Of the 235 CAs, 126 (54%) were identified as non-compliant with the requirements of Chapter 4A of the Act at the time of engagement.
Compliance activity result Growers included in category
Compliant Records were audited against Chapter 4A requirements of the Act, and assessed as compliant.
Non-compliant Records were audited against Chapter 4A requirements of the Act, and assessed as non-compliant.
BMP accredited Growers who are accredited under the Smartcane BMP program.
Practice change program
Captures growers who at the time of engagement are actively engaged in a program that, when implemented, change farm practices to be compliant. Currently this category includes growers who are actively engaged in the Smartcane BMP program, or involved in the RP161C Complete Nutrient Management Planning for Cane Farming (RP161) program. Audits of growers involved in both of these are postponed for 12 months to allow time to complete.
No longer farming Growers who have ceased farming cane. This is verified and the new grower added to the upcoming compliance schedule where the activity has been sold/transferred
17-426 File D Page 88 of 128
Publis
hed o
n DES D
isclos
ure Lo
g
RTI Act
2009

2017/2018 Reef Compliance Program: Quarterly Report Q1 – Q3
5
Table 1. Categories of compliance activity results.
Figure 2. Aggregated compliance activity results (%) for the Wet Tropics, Burdekin and Mackay-Whitsundays priority areas, for the 2017-2018 financial year to the 31 March 2018.
Figure 3 shows the compliance activity results by priority catchment. Note the small sample size means this should only be interpreted as a presentation of what was found and not representative of broader trends across the priority catchments. There are differences in non-compliance by priority area, with the Mackay-Whitsundays area recording the highest levels of non-compliance (approximately 75%), and the Wet Tropics the lowest (approximately 41%). The Mackay-Whitsundays also had the lowest levels of engagement in or accreditation under the Smartcane BMP program. For comparison, the non-compliance recorded during initial stages of the Reef Compliance Program in those areas (2016/17 financial year) was approximately 40% in the Wet Tropics, and approximately 54% in the Burdekin.
ownership, or removed from our data if the activity has ceased.
Under assessment At the time of reporting, the inspection outcome had not been finalised.
17-426 File D Page 89 of 128
Publis
hed o
n DES D
isclos
ure Lo
g
RTI Act
2009

2017/2018 Reef Compliance Program: Quarterly Report Q1 – Q3
6
Figure 3. 2017-2018 financial year compliance activity results (%) for each of the three priority areas to the 31 March 2018: Wet Tropics, Burdekin and Mackay-Whitsundays.
Comparative results by river basin are shown in Figure 4, and detailed in Table 2. The highest levels of non-compliance (where there are sufficient inspection records) are recorded in the O'Connell, Pioneer, Proserpine, Herbert, and Plane basins at between approximately 70-78%. The levels of accreditation under or actively engagement in the Smartcane BMP program continue to be higher in the Wet Tropics area, with the highest in the Tully (80%) followed by Johnstone (70%) basins. Levels of engagement in the RP161 program are higher in the Burdekin than in the Haughton basins.
17-426 File D Page 90 of 128
Publis
hed o
n DES D
isclos
ure Lo
g
RTI Act
2009

2017/2018 Reef Compliance Program: Quarterly Report Q1 – Q3
7
Figure 4. 2017-2018 financial year compliance activity results for each river basin to the 31 March 2018. See Table 2 for detailed results. Note: Where growers own farms in more than one catchment e.g. the Tully-Murray and Mossman-Daintree basins, these results are presented as amalgamated basins.
Row Labels BMP Accredited Compliant No longer
farming Non-compliant
Practice Change Program
Under assessment Grand Total
Barron 1 (50%) 1 (50%) 2
Burdekin 1 (6.3%) 1 (6.3%) 1 (6.3%) 6 (37.5%) 7 (43.8%) 16
Daintree 2 (100%) 2
Haughton 1 (3.7%) 1 (3.7%) 1 (3.7%) 17 (63%) 6 (22.2%) 1 (3.7%) 27
Herbert 6 (19.4%) 22 (71%) 3 (9.7%) 31
Johnstone 5 (16.1%) 3 (9.7%) 2 (6.5%) 4 (12.9%) 17 (54.8%) 31
Mossman 2 (50%) 2 (50%) 4
Mossman-Daintree 3 (60%) 2 (40%) 5
Mulgrave-Russell 5 (16.7%) 5 (16.7%) 2 (6.7%) 14 (46.7%) 4 (13.3%) 30
17-426 File D Page 91 of 128
Publis
hed o
n DES D
isclos
ure Lo
g
RTI Act
2009

2017/2018 Reef Compliance Program: Quarterly Report Q1 – Q3
8
Row Labels BMP Accredited Compliant No longer
farming Non-compliant
Practice Change Program
Under assessment Grand Total
Murray 2 (50%) 2 (50%) 4
O'Connell 15 (83.3%) 2 (11.1%) 1 (5.6%) 18
Pioneer 2 (25%) 6 (75%) 8
Plane 5 (15.2%) 23 (69.7%) 5 (15.2%) 33
Proserpine 1 (8.3%) 1 (8.3%) 9 (75%) 1 (8.3%) 12
Tully 3 (30%) 1 (10%) 1 (10%) 5 (50%) 10
Tully-Murray 2 (100%) 2
Grand Total 23 17 8 126 58 3 235
Table 2. 2017-2018 financial year compliance activity results for each river basin to the 31 March 2018 showing the number of sites in each category, with the percentage of each category result/basin. See Figure 4 for depiction. Note: Where growers own farms in more than one catchment e.g. the Tully-Murray and Mossman-Daintree basins, these results are presented as amalgamated basins.
The reasons for the assessed non-compliance against Chapter 4A requirements are presented in Figure 4 for each priority catchment. Again the small sample size means this should be read as a presentation of what was encountered and not indicative of broader trends in the respective areas. A comparison across the three priority areas, shows different results by area. While failure to soil test is similar across all three priority areas, record keeping requirements in the Mackay-Whitsundays area has a lower level of non-compliance than in the other two areas.
Please note the reasons for non-compliance are not mutually exclusive and one client may be non-complaint for multiple categories. These reasons are often interrelated, and the failure to keep the required records and undertake soil testing are primary drivers of non-compliance for all priority areas.
Figure 5. Summary of the reason(s) for non-compliance within each priority catchment for the 2017-2018 financial year to 31 March 2018. Non-compliance reason results shown as the percentage of each reason of the overall
17-426 File D Page 92 of 128
Publis
hed o
n DES D
isclos
ure Lo
g
RTI Act
2009
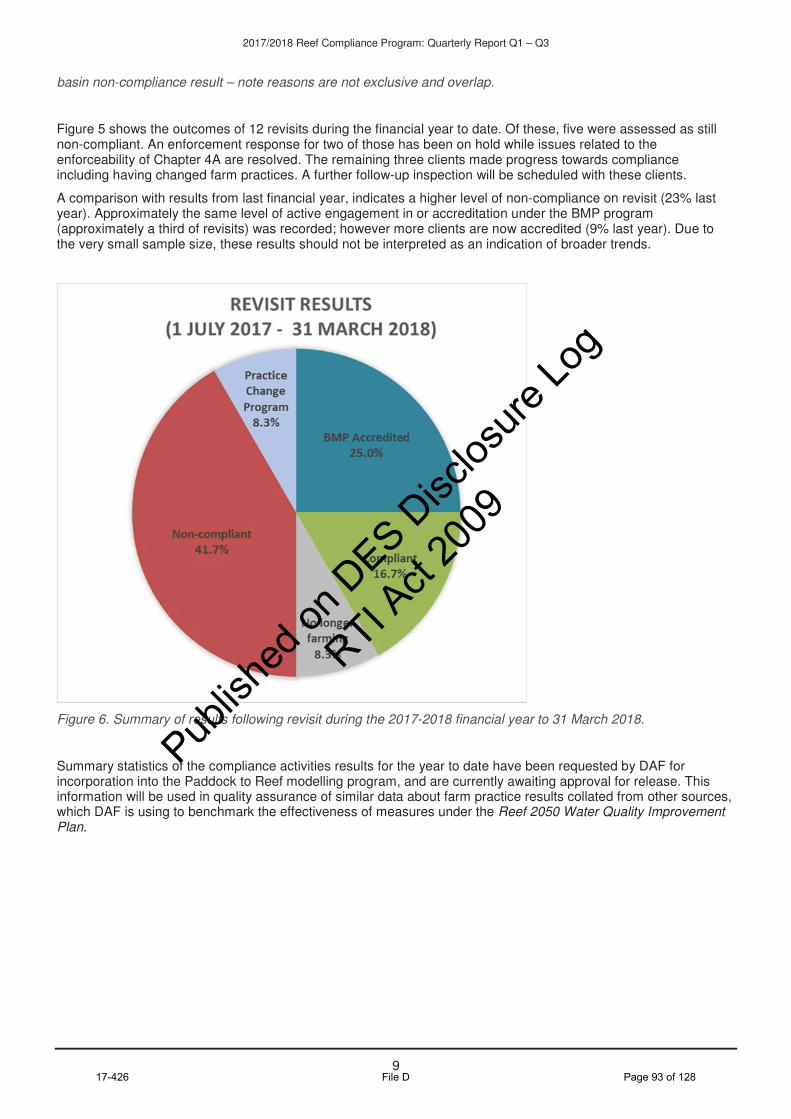
2017/2018 Reef Compliance Program: Quarterly Report Q1 – Q3
9
basin non-compliance result – note reasons are not exclusive and overlap.
Figure 5 shows the outcomes of 12 revisits during the financial year to date. Of these, five were assessed as still non-compliant. An enforcement response for two of those has been on hold while issues related to the enforceability of Chapter 4A are resolved. The remaining three clients made progress towards compliance including having changed farm practices. A further follow-up inspection will be scheduled with these clients.
A comparison with results from last financial year, indicates a higher level of non-compliance on revisit (23% last year). Approximately the same level of active engagement in or accreditation under the BMP program (approximately a third of revisits) was recorded; however more clients are now accredited (9% last year). Due to the very small sample size, these results should not be interpreted as an indication of broader trends.
Figure 6. Summary of results following revisit during the 2017-2018 financial year to 31 March 2018.
Summary statistics of the compliance activities results for the year to date have been requested by DAF for incorporation into the Paddock to Reef modelling program, and are currently awaiting approval for release. This information will be used in quality assurance of similar data about farm practice results collated from other sources, which DAF is using to benchmark the effectiveness of measures under the Reef 2050 Water Quality Improvement Plan.
17-426 File D Page 93 of 128
Publis
hed o
n DES D
isclos
ure Lo
g
RTI Act
2009

2017/2018 Reef Compliance Program: Quarterly Report Q1 – Q3
10
Appendix 2 - Quarters 1- 3 Compliance effort mapping
Results of the quarterly compliance activities for Q1 - 3 are shown by each surface water drainage basin (as mapped by the department of Natural Resources and Mines) in each of the following maps.
17-426 File D Page 94 of 128
Publis
hed o
n DES D
isclos
ure Lo
g
RTI Act
2009

2017/2018 Reef Compliance Program: Quarterly Report Q1 – Q3
17-426 File D Page 95 of 128
sch4p4( 6) Personal Information
Publis
hed o
n DES D
isclos
ure Lo
g
RTI Act
2009

12 17-426 File D Page 96 of 128
sch4p4( 6) Personal Information
Publis
hed o
n DES D
isclos
ure Lo
g
RTI Act
2009

2017/2018 Reef Compliance Program: Quarterly Report Q1 – Q3
13
17-426 File D Page 97 of 128
sch4p4( 6) Personal Information
Publis
hed o
n DES D
isclos
ure Lo
g
RTI Act
2009

2017/2018 Reef Compliance Program: Quarterly Report Q1 – Q3
14 17-426 File D Page 98 of 128
sch4p4( 6) Personal Information
Publis
hed o
n DES D
isclos
ure Lo
g
RTI Act
2009

2017/2018 Reef Compliance Program: Quarterly Report Q1 – Q3
15
17-426 File D Page 99 of 128
sch4p4( 6) Personal Information
Publis
hed o
n DES D
isclos
ure Lo
g
RTI Act
2009

2017/2018 Reef Compliance Program: Quarterly Report Q1 – Q3
16
17-426 File D Page 100 of 128
sch4p4( 6) Personal Information
Publis
hed o
n DES D
isclos
ure Lo
g
RTI Act
2009

2017/2018 Reef Compliance Program: Quarterly Report Q1 – Q3
17
17-426 File D Page 101 of 128
sch4p4( 6) Personal Information
Publis
hed o
n DES D
isclos
ure Lo
g
RTI Act
2009

2017/2018 Reef Compliance Program: Quarterly Report Q1 – Q3
18 17-426 File D Page 102 of 128
sch4p4( 6) Personal Information
Publis
hed o
n DES D
isclos
ure Lo
g
RTI Act
2009

Page 1 of 9
Project name:
Project plan template V.1.0 – Aug 2016
Queensland Reef Water Quality Program
Project definition
Project background and description
The Australian and Queensland Governments have set ambitious water quality targets under the Reef 2050 Long Term Sustainability Plan (the Reef 2050 Plan) to reduce nitrogen runoff by up to 80% and total suspended sediment runoff by up to 50% in key catchments such as Wet Tropics and the Burdekin by 2025.
It is acknowledged that progress has been made over the last ten years to improve water quality particularly through changed/improved land management practices. Many landholders have made significant changes and are committed to improving their sustainability to not only ensure their businesses can prosper into the future, but also to protect the reef. Millions of dollars have been spent on upgrading infrastructure that impact water quality, such as sewage treatment plants, along the coast.
However, these changes have not been rapid or widespread enough. Despite significant investment and goodwill from all parties, not enough has been achieved and accelerated uptake of improved practices is urgently needed to achieve the water quality targets.
To assist in the delivery or reef water quality outcomes and accelerate progress towards water quality targets, Environmental Services and Regulation (ESR) has been tasked with delivering a targeted compliance project to promote compliance with the reef protection measures in the EP Act.
The initial focus of the ESR compliance activities is to increase adoption of the fertilising and record keeping provisions under chapter 4A of the Environmental Protection Act 1994 (the Act) for sugarcane growers in the Wet Tropics and Burdekin catchments.
Scope In scope:
Conducting a targeted compliance program focussed on the nutrient requirements in Chapter 4A of the Act for cane growers in the Wet Tropics and Burdekin catchments.
Related projects and activities
Related projects
RP161 – complete nutrient management planning for cane farming. DAF MOU with EHP to support reef protection. Smartcane BMP
Related activities
ESR compliance activities that deliver water quality outcomes in reef catchments
Project name: 2016-2017 Reef Compliance Program
Aligned to Taskforce recommendation: 5. Regulations
Case manager: Anthony Morrison – Program Coordinator, Compliance and Customer Service
Component manager:
N/A
Start date: 1 July 2016
End date: 30 June 2017
17-426 File D Page 103 of 128
Publis
hed o
n DES D
isclos
ure Lo
g
RTI Act
2009

Page 2 of 9
Project name:
Project plan template V.1.0 – Aug 2016
e.g. aquaculture, STP’s, sugar mills, extraction sites.
Objectives To drive increased compliance with the Chapter 4A nutrient requirements amongst canegrowers in the Wet Tropics and Burdekin Catchments.
Benefits, descriptions and management plan (outcomes)
The on ground compliance presence and engagement with the industry provides a strong signal of the government’s commitment to achieving reef water quality outcomes.
The compliance engagement with the industry provides an incentive for growers to comply with the Chapter 4A requirements and to actively engage in a range of programs or initiatives (such as BMP or RP161) that support reef water quality outcomes.
Deliverables 16% of MaNQC proactive compliance activities will be directed towards improvement of on farm management practices for reef protection. 25% of farms not fully compliant with chapter 4A nutrient requirements will demonstrate an improvement in practices within 12 months of the initial inspection. 90% of complaints regarding poor farm management practices are responded to within 5 business days. 80% of farms visited receive post inspection correspondence within 15 business days of inspection (in line with other ESR compliance KPI’s).
Project organisation structure and governance
Project Sponsor Elisa Nichols – Executive Director, Office of the Great Barrier Reef
Rob Lawrence - Executive Director, Minerals and North Queensland Compliance.
Project Director (optional)
Scott Sullivan – Program Manager Compliance, Compliance and Customer Service.
Case Manager Anthony Morrison – Program Coordinator, Compliance and Customer Service.
Project Support Reef Water Quality Programs
Governance groups
Existing MaNQC reporting structure
Project implementation
Implementation approach and milestones
Development of spatial data capture and management system to support the monitoring management and planning of compliance effort. Quarters 1 and 2.
Review of current reef water quality knowledge to inform the planning and prioritisation of compliance effort. Quarters 1 and 2.
Conduct training of at least 8 additional staff for reef compliance. Quarter 2.
Undertake compliance activities focussed on nutrient requirements for cane growing in the Wet Tropics and Burdekin catchments. Engagement will be targeted at the communication and education end of the compliance spectrum, with ongoing non-compliance addressed in line with the department’s enforcement guidelines. Quarters 1 through 4. Farm based compliance effort will occur throughout the year, but the greatest proportion will occur during the post-harvest period (Quarters 3 and 4) recognising the work demands on growers during harvest.
Commented [EN1]: As discussed with Rob and following on from discussions with the Minister, we should be following the compliance guidelines re moving to warnings/PINs etc where non-compliance continues. Communication and education is still a focus but this does not mean that stronger compliance tools are to be avoided.
Commented [EN2]: Discussed with Rob. We share the concerned that the opportunity is not being taken to inform people during this period as they plant/fertilise immediately after harvest, so we will miss an opportunity to change behaviour this year. Harvest is continuous – they take turns having blocks down. Visits could be planned around this so harvest isn’t impacted.
17-426 File D Page 104 of 128
Publis
hed o
n DES D
isclos
ure Lo
g
RTI Act
2009
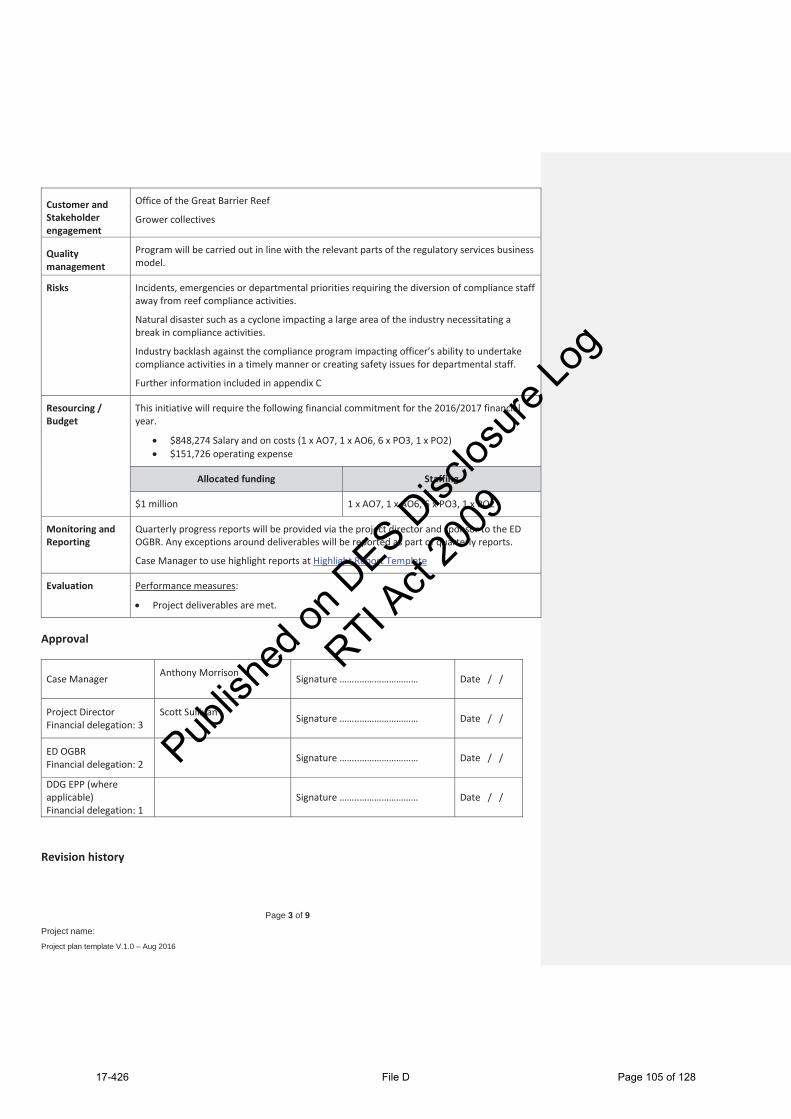
Page 3 of 9
Project name:
Project plan template V.1.0 – Aug 2016
Customer and Stakeholder engagement
Office of the Great Barrier Reef
Grower collectives
Quality management
Program will be carried out in line with the relevant parts of the regulatory services business model.
Risks Incidents, emergencies or departmental priorities requiring the diversion of compliance staff away from reef compliance activities.
Natural disaster such as a cyclone impacting a large area of the industry necessitating a break in compliance activities.
Industry backlash against the compliance program impacting officer’s ability to undertake compliance activities in a timely manner or creating safety issues for departmental staff.
Further information included in appendix C
Resourcing / Budget
This initiative will require the following financial commitment for the 2016/2017 financial year.
$848,274 Salary and on costs (1 x AO7, 1 x AO6, 6 x PO3, 1 x PO2) $151,726 operating expense
Allocated funding Staffing
$1 million 1 x AO7, 1 x AO6, 6 x PO3, 1 x PO2
Monitoring and Reporting
Quarterly progress reports will be provided via the project director and sponsor to the ED OGBR. Any exceptions around deliverables will be reported as part of quarterly reports.
Case Manager to use highlight reports at Highlight Report Template
Evaluation Performance measures:
Project deliverables are met.
Approval
Case Manager Anthony Morrison
Signature ……..……………………
Date / /
Project Director Financial delegation: 3
Scott Sullivan
Signature ……..……………………
Date / /
ED OGBR Financial delegation: 2 Signature ……..……………………
Date / /
DDG EPP (where applicable) Financial delegation: 1
Signature ……..…………………… Date / /
Revision history
17-426 File D Page 105 of 128
Publis
hed o
n DES D
isclos
ure Lo
g
RTI Act
2009

Page 4 of 9
Project name:
Project plan template V.1.0 – Aug 2016
Revision date Version No. Author Description of changes
17-426 File D Page 106 of 128
Publis
hed o
n DES D
isclos
ure Lo
g
RTI Act
2009

Page 5 of 9
Project name:
Project plan template V.1.0 – Aug 2016
Appendix A – Project activities schedule
Project stage Key activity
(in chronological order, and responsibility if activities are undertaken by several parties)
Expected start date
Expected completion date
Milestone/Date Dependency to other project activities –
both within this project and other Taskforce
implementation projects
Development of spatial data capture and management system to support the monitoring, management and planning of compliance effort. Quarters 1 and 2.
Work with spatial analysis team to collate existing data and set up systems for the spatial capture of reef compliance data.
10/7/2016 24/12/2016
Review of current reef water quality knowledge to inform the planning and prioritisation of compliance effort. Quarters 1 and 2.
Knowledge review and drafting of summary document. 1/08/2016 2/09/2016
Editing and finalisation of compliance planning and prioritisation for 2016/2017. 5/09/2016 30/09/2016
Conduct training of at least 8 additional staff for reef compliance. Quarter 2.
Review of existing training material and development of updated reef compliance training package. 1/08/2016 14/10/2016
Deliver reef compliance training to at least 8 staff. 24/10/2016 28/10/2016
17-426 File D Page 107 of 128
Publis
hed o
n DES D
isclos
ure Lo
g
RTI Act
2009

Page 6 of 9
Project name:
Project plan template V.1.0 – Aug 2016
Undertake compliance activities focussed on nutrient requirements for cane growing in the Wet Tropics and Burdekin catchments.
Compliance will be planned on a quarterly basis, quarters 1 through 4. Farm based compliance effort will occur throughout the year, but the greatest proportion will occur during the post-harvest period (quarters 3 and 4) recognising the work demands on growers during harvest.
1/07/2016 30/06/2017 Meeting project deliverables at end of financial year.
17-426 File D Page 108 of 128
Publis
hed o
n DES D
isclos
ure Lo
g
RTI Act
2009

Page 7 of 9
Project name:
Project plan template V. 1.0 – Aug 2016
Appendix B - Communication and consultation plan
Communication /
consultation objectives
Customer / Stakeholder Interest/Impact Information
required Frequency Method/Delivery Responsibility
Evaluation
Establish and maintain productive working relationships with industry.
Grower collectives Compliance program directly engages with their members.
Keep up to date with compliance program focus and activities.
As needs. Initial meetings in person with follow up communication either phone, email or meeting as appropriate.
Program Coordinator
Productive stakeholder relationships maintained
Report on project progress and outcomes.
OGBR Funding the program and overseeing reef water quality activities.
Program reporting on deliverables.
Quarterly Written report Program Coordinator
Project reporting requirements met.
17-426 File D Page 109 of 128
Publis
hed o
n DES D
isclos
ure Lo
g
RTI Act
2009

Page 8 of 9
Project name:
Project plan template V. 1.0 – Aug 2016
Appendix C – Risk Assessment
Risk description Risk Category Risk Owner Likelihood Consequence Risk level Triggers Risk Treatment
Incidents, emergencies or other departmental priorities requiring the diversion of compliance staff away from reef compliance activities.
ESR Possible Moderate Medium (13) Ensure reef compliance activities are prioritised if regional capacity is impacted by incidents, emergencies or other departmental priorities.
Natural disaster such as a cyclone impacting a large area of the industry necessitating a break in compliance activities.
ESR Unlikely Major Medium (14) Refocus compliance effort away from impacted areas.
Industry backlash against the compliance program impacting officer’s ability to undertake compliance activities in a timely manner or creating safety issues for departmental staff.
ESR Unlikely Major Medium (14) Maintain communication with industry, particularly regional grower representative groups, to keep growers informed of the program. Tailor our engagement approach to the industry and individuals where possible.
LIKELIHOOD CONSEQUENCE
17-426 File D Page 110 of 128
Publis
hed o
n DES D
isclos
ure Lo
g
RTI Act
2009

Page 9 of 9
Project name:
Project plan template V. 1.0 – Aug 2016
Insignificant Minor Moderate Major Critical Almost Certain Medium
(11) Medium (16)
High (20) Extreme (23)
Extreme (25)
Likely Low (7) Medium (12)
High (17) High (21) Extreme (24)
Possible Low (4) Medium (8)
Medium (13)
High (18) High (22)
Unlikely Low (2) Low (5) Medium (9) Medium (14)
High (19)
Rare Low (1) Low (3) Low (6) Medium (10)
Medium (15)
Risk level Risk
scale Action required
EXTREME 23-25 Requires immediate action and involvement at executive management level to manage the risk. HIGH 17-22 Requires senior management attention and involvement to manage the risk. MEDIUM 8-16 Risk can be managed at the business level by specific monitoring or response procedures. LOW 1-7 Risk can be managed at the business level by routine procedures or established controls.
17-426 File D Page 111 of 128
Publis
hed o
n DES D
isclos
ure Lo
g
RTI Act
2009

Mth ActualMth Budget Mth Var YTD ActualYTD Budget YTD Var Total Budget
Account Summary for JUNE for Cost Centre : 1000652 Reef Compliance
Total Var Commit.
Org Unit: CEA
Fund Class: SWP
Min & Nth QLD Compliance Env Services & RegulationED METALS HUB
SAVING THE GREAT BARRIER RE
Activity: EWCM1 REEF COMPLIANCE Pro Mon Compl Com Ac EnvStew-Compl
Limited Life Allocation
Environmental Protection Serv
EXPENSES
Salaries & Wages119,868.1652,050.00 -67,818.16 597,813.40602,786.00 4,972.60 602,786.00 4,972.60510000 1%-130% 0.00Salary Higher Duties3,087.435,658.00 2,570.57 45,123.8367,852.00 22,728.17 67,852.00 22,728.17510013 33%45% 0.00Overtime347.280.00 -347.28 457.170.00 -457.17 0.00 -457.17513000 0.00Locality Allowance656.28629.00 -27.28 6,140.917,465.00 1,324.09 7,465.00 1,324.09514003 18%-4% 0.00Other Allowances80.360.00 -80.36 3,115.190.00 -3,115.19 0.00 -3,115.19514020 0.00Recreation Leave Expense4,384.846,092.00 1,707.16 75,293.2069,215.00 -6,078.20 69,215.00 -6,078.20515000 -9%28% 0.00Leave Loading Expense932.710.00 -932.71 9,177.200.00 -9,177.20 0.00 -9,177.20515001 0.00Annual Leave On-cost Expense-269.980.00 269.98 -8,931.960.00 8,931.96 0.00 8,931.96515003 0.00LSL Levy Expense1,619.611,242.00 -377.61 14,270.3114,111.00 -159.31 14,111.00 -159.31516000 -1%-30% 0.00Long Service Leave Claims On-cost0.000.00 0.00 -192.960.00 192.96 0.00 192.96516002 0.00Q Super Employer Contr Defined Benefit1,009.361,748.00 738.64 11,979.1619,867.00 7,887.84 19,867.00 7,887.84517000 40%42% 0.00Q Super Employer Contr Accum Plan8,291.485,692.00 -2,599.48 65,996.2164,672.00 -1,324.21 64,672.00 -1,324.21517001 -2%-46% 0.00Staff Transfer Expenses - No FBT5,242.530.00 -5,242.53 5,242.530.00 -5,242.53 0.00 -5,242.53518513 0.00Workers Compensation Premiums326.78225.00 -101.78 2,798.842,554.00 -244.84 2,554.00 -244.84520500 -10%-45% 0.00
145,576.8473,336.00 -72,240.84 828,283.03848,522.00 20,238.97 848,522.00 20,238.97Employee Related Expenses 2%-99% 0.0051
Contractors - Other630.000.00 -630.00 630.000.00 -630.00 0.00 -630.00523013 0.00Contractors Non Prof Services2,090.130.00 -2,090.13 2,090.130.00 -2,090.13 0.00 -2,090.13523021 0.00
2,720.130.00 -2,720.13 2,720.130.00 -2,720.13 0.00 -2,720.13Consultants & Contractors 0.0052
Motor Vehicle - Taxi Fares454.8098.00 -356.80 454.801,176.00 721.20 1,176.00 721.20525012 61%-364% 0.00Travel Allowances (No Payroll Tax)252.752,242.00 1,989.25 8,635.9526,970.00 18,334.05 26,970.00 18,334.05526001 68%89% 0.00Travel Expenses - Staff Development56.360.00 -56.36 56.360.00 -56.36 0.00 -56.36526002 0.00Travel Expense Other1,008.022,067.00 1,058.98 6,804.4424,782.00 17,977.56 24,782.00 17,977.56526009 73%51% 0.00Travel Airfares2,409.151,082.00 -1,327.15 9,474.5512,929.00 3,454.45 12,929.00 3,454.45526020 27%-123% 0.00Travel OS Expense - Other0.000.00 0.00 34.000.00 -34.00 0.00 -34.00527002 0.00
4,181.085,489.00 1,307.92 25,460.1065,857.00 40,396.90 65,857.00 40,396.90Travel 61%24% 0.0053
Staff Training & Devt External Costs2,343.600.00 -2,343.60 2,343.605,760.00 3,416.40 5,760.00 3,416.40520504 59% 0.00Conference Workshop Costs498.280.00 -498.28 498.280.00 -498.28 0.00 -498.28530005 0.00Training & Related Services445.460.00 -445.46 7,007.000.00 -7,007.00 0.00 -7,007.00530240 0.00
3,287.340.00 -3,287.34 9,848.885,760.00 -4,088.88 5,760.00 -4,088.88Training & Development -71% 0.0054
Motor Vehicles Fuel Oil1,061.8463.00 -998.84 2,167.90756.00 -1,411.90 756.00 -1,411.90525000 -187%-1585% 0.00Motor Vehicles Hire External0.001,500.00 1,500.00 0.0018,000.00 18,000.00 18,000.00 18,000.00525001 100%100% 0.00Motor Vehicles Hire Q Fleet12,474.23491.00 -11,983.23 31,679.725,892.00 -25,787.72 5,892.00 -25,787.72525002 -438%-2441% 0.00Motor Vehicles Repairs & Maintenance937.980.00 -937.98 2,088.890.00 -2,088.89 0.00 -2,088.89525006 0.00
12 000 to ZZZ 00000 to ZZZZZPeriod : Fund Class : Activity : CONTLSegment :
27/07/201721/05/2018Run On : Extract Date : 1/3Page No :Report Ref : FR_DET_050
Org Units : 000 to ZZZ Accounts : 400000 to 999999 Grp: 41 to 5E
Cost Centre : 1000652 to 1000652 Internal Order : Excluded17-426 File D Page 112 of 128
Publis
hed o
n DES D
isclos
ure Lo
g
RTI Act
2009

Mth ActualMth Budget Mth Var YTD ActualYTD Budget YTD Var Total Budget
Account Summary for JUNE for Cost Centre : 1000652 Reef Compliance
Total Var Commit.
Org Unit: CEA
Fund Class: SWP
Min & Nth QLD Compliance Env Services & RegulationED METALS HUB
SAVING THE GREAT BARRIER RE
Activity: EWCM1 REEF COMPLIANCE Pro Mon Compl Com Ac EnvStew-Compl
Limited Life Allocation
Environmental Protection Serv
Motor Vehicle Accessories1,266.030.00 -1,266.03 3,927.950.00 -3,927.95 0.00 -3,927.95525025 0.0015,740.082,054.00 -13,686.08 39,864.4624,648.00 -15,216.46 24,648.00 -15,216.46Motor Vehicles -62%-666% 0.0055
Telephone & Fax - Office2,534.152,292.00 -242.15 4,985.9610,295.00 5,309.04 10,295.00 5,309.04529003 52%-11% 0.00Telephone & Fax - FBT0.00200.00 200.00 0.001,400.00 1,400.00 1,400.00 1,400.00529004 100%100% 0.00
2,534.152,492.00 -42.15 4,985.9611,695.00 6,709.04 11,695.00 6,709.04Telephone & Fax 57%-2% 0.0056
Computer Facilities Management4,025.101,206.00 -2,819.10 16,100.4014,472.00 -1,628.40 14,472.00 -1,628.40528002 -11%-234% 0.00Computer Processing Other0.000.00 0.00 350.000.00 -350.00 0.00 -350.00528004 0.00ITP Discretionary Service Charges22.650.00 -22.65 45.300.00 -45.30 0.00 -45.30530383 0.00
4,047.751,206.00 -2,841.75 16,495.7014,472.00 -2,023.70 14,472.00 -2,023.70Network & Computer -14%-236% 0.0057
Property Security - DPW0.000.00 0.00 15.000.00 -15.00 0.00 -15.00524015 0.00Property Storage Charges726.200.00 -726.20 726.200.00 -726.20 0.00 -726.20524016 0.00Property Waste Disposal0.000.00 0.00 399.000.00 -399.00 0.00 -399.00524017 0.00Property Repairs & Maintenance130.880.00 -130.88 130.880.00 -130.88 0.00 -130.88524025 0.00
857.080.00 -857.08 1,271.080.00 -1,271.08 0.00 -1,271.08Accommodation & Related 0.0058
Stores & Stationery1,796.4860.00 -1,736.48 1,807.39720.00 -1,087.39 720.00 -1,087.39530035 -151%-2894% 0.00Paper Plain & Coloured Card Supplies29.540.00 -29.54 29.540.00 -29.54 0.00 -29.54530036 0.00Printing Other1,919.320.00 -1,919.32 2,956.960.00 -2,956.96 0.00 -2,956.96530109 0.00Materials0.00167.00 167.00 0.002,004.00 2,004.00 2,004.00 2,004.00530168 100%100% 0.00
3,745.34227.00 -3,518.34 4,793.892,724.00 -2,069.89 2,724.00 -2,069.89Consumables -76%-1550% 0.0059
Staff Corporate Wardrobe778.84453.00 -325.84 778.845,480.00 4,701.16 5,480.00 4,701.16520502 86%-72% 0.00Staff Uniforms527.710.00 -527.71 799.710.00 -799.71 0.00 -799.71520506 0.00Repairs & Maintenance - Other Transport57.000.00 -57.00 57.000.00 -57.00 0.00 -57.00525019 0.00Refreshments & Light Meals0.000.00 0.00 256.540.00 -256.54 0.00 -256.54530011 0.00Equipment Rental Operating Lease0.000.00 0.00 63.620.00 -63.62 0.00 -63.62530012 0.00Freight & Cartage (incl.Railway Charges)527.070.00 -527.07 536.160.00 -536.16 0.00 -536.16530013 0.00Postage851.6170.00 -781.61 863.43840.00 -23.43 840.00 -23.43530026 -3%-1117% 0.00PR Campaign Advertising Media Space0.000.00 0.00 7,969.790.00 -7,969.79 0.00 -7,969.79530028 0.00PR Displays Promotions0.000.00 0.00 1,000.000.00 -1,000.00 0.00 -1,000.00530030 0.00Subscriptions Publications0.000.00 0.00 272.730.00 -272.73 0.00 -272.73530038 0.00Plant & Equipment Maintenance1,078.630.00 -1,078.63 1,078.630.00 -1,078.63 0.00 -1,078.63530122 0.00Analytical & Data Collection Services0.000.00 0.00 242.0020,000.00 19,758.00 20,000.00 19,758.00530123 99% 0.00Books & Publications0.000.00 0.00 1,475.010.00 -1,475.01 0.00 -1,475.01530146 0.00Refreshments - Operational0.000.00 0.00 439.270.00 -439.27 0.00 -439.27530377 0.00Advertising - Other0.000.00 0.00 90.910.00 -90.91 0.00 -90.91537005 0.00
12 000 to ZZZ 00000 to ZZZZZPeriod : Fund Class : Activity : CONTLSegment :
27/07/201721/05/2018Run On : Extract Date : 2/3Page No :Report Ref : FR_DET_050
Org Units : 000 to ZZZ Accounts : 400000 to 999999 Grp: 41 to 5E
Cost Centre : 1000652 to 1000652 Internal Order : Excluded17-426 File D Page 113 of 128
Publis
hed o
n DES D
isclos
ure Lo
g
RTI Act
2009

Mth ActualMth Budget Mth Var YTD ActualYTD Budget YTD Var Total Budget
Account Summary for JUNE for Cost Centre : 1000652 Reef Compliance
Total Var Commit.
Org Unit: CEA
Fund Class: SWP
Min & Nth QLD Compliance Env Services & RegulationED METALS HUB
SAVING THE GREAT BARRIER RE
Activity: EWCM1 REEF COMPLIANCE Pro Mon Compl Com Ac EnvStew-Compl
Limited Life Allocation
Environmental Protection Serv
Internal Print Recovery-Expenses13.820.00 -13.82 52.250.00 -52.25 0.00 -52.25810045 0.003,834.68523.00 -3,311.68 15,975.8926,320.00 10,344.11 26,320.00 10,344.11Other Expenses 39%-633% 0.005D
Portable & Attractive Equipment -Deprecia7,960.000.00 -7,960.00 13,908.000.00 -13,908.00 0.00 -13,908.00530136 0.00Plant and Equipment <$50004,071.770.00 -4,071.77 6,044.440.00 -6,044.44 0.00 -6,044.44530304 0.00
12,031.770.00 -12,031.77 19,952.440.00 -19,952.44 0.00 -19,952.44Low Value Assets 0.005E
198,556.2485,327.00 -113,229.24 969,651.56999,998.00 30,346.44 999,998.00 30,346.44EXPENSES 3%-133% 0.00
198,556.2485,327.00 -113,229.24 969,651.56999,998.00 30,346.44 999,998.00 30,346.44CTR : 1000652 Reef Compliance 3%-133% 0.00
198,556.2485,327.00 -113,229.24 969,651.56999,998.00 30,346.44 999,998.00 30,346.44Report Total 3%-133% 0.00
12 000 to ZZZ 00000 to ZZZZZPeriod : Fund Class : Activity : CONTLSegment :
27/07/201721/05/2018Run On : Extract Date : 3/3Page No :Report Ref : FR_DET_050
Org Units : 000 to ZZZ Accounts : 400000 to 999999 Grp: 41 to 5E
Cost Centre : 1000652 to 1000652 Internal Order : Excluded17-426 File D Page 114 of 128
Publis
hed o
n DES D
isclos
ure Lo
g
RTI Act
2009

Page 1 of 11
Project name: 2017-2018 Reef Compliance Program
Project plan template V.1.0 – Aug 2016
Queensland Reef Water Quality Program
Project definition
Projectbackground anddescription
The Australian and Queensland Governments have set ambitious water quality targetsunder the Reef 2050 Long Term Sustainability Plan (the Reef 2050 Plan) to reduce nitrogenrunoff by up to 80% and total suspended sediment runoff by up to 50% in key catchmentssuch as the Wet Tropics, Burdekin, and Mackay Whitsunday by 2025.
It is acknowledged that progress has been made over the last ten years to improve waterquality particularly through changed/improved land management practices. Manylandholders have made significant changes and are committed to improving theirsustainability, to not only ensure their businesses can prosper into the future, but also toprotect the reef. Millions of dollars have been spent on upgrading infrastructure that impactwater quality, such as sewage treatment plants, along the coast.
However these changes have not been rapid or widespread enough. Despite significantinvestment and goodwill from all parties, not enough has been achieved and accelerateduptake of improved practices is urgently needed to achieve the water quality targets.
To assist in the delivery or reef water quality outcomes and accelerate progress towardswater quality targets, Environmental Services and Regulation (ESR) has been tasked withdelivering a compliance project to promote compliance with the fertiliser applicationrequirements of the reef protection measures in the Environmental Protection Act 1994 (theAct). The project commenced in 2016 and has inspected 211 growers to the end ofSeptember 2017.
The current focus of the ESR compliance activities is to increase adoption of the fertilisingand record keeping provisions under chapter 4A of the Act for sugarcane growers in the WetTropics, Burdekin and Mackay Whitsunday priority catchments.
Scope In scope:
Conducting a compliance program focussed on the fertiliser application requirements inChapter 4A of the Act for cane growers in the Wet Tropics, Burdekin and MackayWhitsunday priority catchments.
Related projectsand activities
Related projects
RP161 – complete nutrient management planning for cane farming.DAF MOU with EHP to support reef protection.Smartcane Best Management Practice program (Smartcane BMP)
Related activities
Project name: 2017 2018 Reef Compliance Program
Aligned to Taskforce recommendation: 5. Regulations
Case manager: Anthony Morrison – Program Coordinator, Minerals and North Queensland Compliance
Componentmanager:
N/A
Start date:1 July 2017
End date:30 June 2018
17-426 File D Page 115 of 128
Publis
hed o
n DES D
isclos
ure Lo
g
RTI Act
2009

Page 2 of 11
Project name: 2017-2018 Reef Compliance Program
Project plan template V.1.0 – Aug 2016
ESR compliance activities that deliver water quality outcomes in reef catchmentse.g. aquaculture, STP’s, sugar mills, extraction sites.
Objectives To drive increased compliance with the Chapter 4A fertiliser application requirementsamongst canegrowers in the Wet Tropics, Burdekin and Mackay Whitsunday prioritycatchments.
Benefits,descriptions andmanagementplan (outcomes)
The on ground compliance presence and engagement with the industry provides a strongsignal of the government’s commitment to achieving reef water quality outcomes.
The compliance engagement with the industry provides an additional incentive for growersto comply with the Chapter 4A requirements, and to actively engage in a range of programsor initiatives (such as Smartcane BMP or RP161) that support reef water quality outcomes.
Deliverables 317 proactive compliance activities are directed towards improvement of on farmnutrient management practices in the Wet Tropics, Burdekin and MackayWhitsunday priority catchments.
Project organisation structure and governance
Project Sponsor Elisa Nichols – Executive Director, Office of the Great Barrier Reef
Ingrid Fomiatti Minnesma – A/Executive Director, Minerals and North QueenslandCompliance.
Project Director(optional)
Scott Sullivan – Program Manager Compliance, Compliance and Customer Service.
Case Manager Anthony Morrison – Program Coordinator, Compliance and Customer Service.
Project Support Reef Water Quality Programs
Governancegroups
Existing MaNQC reporting structure
Project implementation
Implementationapproach andmilestones
Development and verification testing of a compliance prioritisation model for thetargeting of reef compliance effort.Investigate the use of remote sensing technologies to identify areas of higher risk towater quality for further informing risk assessment and compliance prioritisation.Development of program support material.Conduct training of additional staff for reef compliance across the Cairns, Townsvilleand Mackay offices as required.Engage with industry stakeholders to communicate fertiliser applicationrequirements and compliance activity.Undertake compliance activities focussed on the fertiliser application requirementsfor cane growing in the Wet Tropics, Burdekin and Mackay Whitsunday prioritycatchments. Initial engagement will be targeted at the communication andeducation end of the compliance spectrum, with ongoing non compliance addressedin line with the department’s enforcement guidelines.
17-426 File D Page 116 of 128
Publis
hed o
n DES D
isclos
ure Lo
g
RTI Act
2009

Page 3 of 11
Project name: 2017-2018 Reef Compliance Program
Project plan template V.1.0 – Aug 2016
Customer andStakeholderengagement
Office of the Great Barrier Reef
Grower collectives
Local productivity services and key extension staff
Qualitymanagement
Program will be carried out in line with the relevant parts of the regulatory services businessmodel.
Risks Incidents, emergencies or departmental priorities requiring the diversion of compliance staffaway from reef compliance activities.
Natural disaster such as a cyclone impacting a large area of the industry necessitating abreak in compliance activities.
Connect implementation adversely impacting on the time required to undertake compliancecases.
Industry backlash against the compliance program impacting officer’s ability to undertakecompliance activities in a timely manner or creating safety issues for departmental staff.
Further information included in appendix C
Resourcing /Budget
This initiative will require the following financial commitment for the 2017/2018 financialyear.
$1,171,901employee related expenses split between Northern (1 x AO7, 1 x AO6, 6 xPO3, 1 x PO2) and Central Regions (1 x PO4, 3 x PO3)$153,339 operating expense
Allocated funding Staffing
$1,325,240 1 x AO7, 1 x AO6, 1 x PO4, 9 x PO3, 1 x PO2
Monitoring andReporting
Quarterly progress reports will be provided via the project director and sponsor to the EDOGBR. Any exceptions around deliverables will be reported as part of quarterly reports.
Evaluation Performance measures:
Project deliverables are met.
Approval
17-426 File D Page 117 of 128
Publis
hed o
n DES D
isclos
ure Lo
g
RTI Act
2009

Page 4 of 11
Project name: 2017-2018 Reef Compliance Program
Project plan template V.1.0 – Aug 2016
Case Manager Anthony Morrison Signature ……..…………………… Date / /
Project DirectorFinancial delegation: 3
Rob Little Signature ……..…………………… Date / /
ED OGBRFinancial delegation: 2 Signature ……..…………………… Date / /
DDG EPP (whereapplicable)Financial delegation: 1
Signature ……..…………………… Date / /
Revision history
Revisiondate Version No. Author Description of changes
30/11/2017 1.0 Anthony Morrison Initial draft
17-426 File D Page 118 of 128
Publis
hed o
n DES D
isclos
ure Lo
g
RTI Act
2009

Page 5 of 11
Project name: 2017-2018 Reef Compliance Program
Project plan template V.1.0 – Aug 2016
Appendix A – Project activities schedule
Project stage Key activity
(in chronological order, and responsibility if activities areundertaken by several parties)
Expected startdate
Expectedcompletion date
Milestone/Date Dependency toother project
activities – both withinthis project and other
Taskforceimplementation projects
Development andverification testingof a complianceprioritisation model(CPM) for thetargeting of reefcompliance effort.
Draft CPM created.1/07/2017 31/10/2017
Draft CPM outputs undergo verification testing indelivery of compliance program. 3/01/2018 30/06/2018
Investigate the useof remote sensingtechnologies toidentify areas ofhigher risk to waterquality for furtherinforming riskassessment andcomplianceprioritisation.
Knowledge review and development of trial approach.1/07/2017 30/09/2017
Initial analysis undertaken and verification testing ofthe outputs. 1/10/2017 31/03/2018
Preparation of a Reef Procedural Guide for sugarcanefarm inspections. 1/07/2017 30/09/2017
17-426 File D Page 119 of 128
Publis
hed o
n DES D
isclos
ure Lo
g
RTI Act
2009

Page 6 of 11
Project name: 2017-2018 Reef Compliance Program
Project plan template V.1.0 – Aug 2016
Project stage Key activity
(in chronological order, and responsibility if activities areundertaken by several parties)
Expected startdate
Expectedcompletion date
Milestone/Date Dependency toother project
activities – both withinthis project and other
Taskforceimplementation projects
Development ofprogram supportmaterials for staff
Preparation of guidance material for use of Connect inrelation to reef compliance activities. 30/09/2017 01/03/2017
Development of a reef compliance program internalSharePoint page with links to support materials andtemplates (Senior Program Officer).
1/07/2017 30/09/2017
Conduct training ofadditional staff forreef complianceacross the Cairns,Townsville andMackay offices asrequired.
Review of existing training material and developmentof updated reef compliance training package (ProgramCoordinator and Senior Program Officer).
1/07/2017 30/06/2018
Deliver reef compliance training as required (ProgramCoordinator and Senior Program Officer). 1/07/2017 30/06/2018
Engage with industrystakeholders tocommunicatefertiliser applicationrequirements andcompliance activity.
Stakeholder engagement on an as needs basis(Program Coordinator and Senior Program Officer). 1/07/2017 30/06/2018
Undertakecompliance activities
Compliance will be planned on a quarterly basis,quarters 1 through 4. Farm based compliance effortwill occur throughout the year, but the greatest
1/07/2017 30/06/2018Meeting projectdeliverables at endof financial year.
17-426 File D Page 120 of 128
Publis
hed o
n DES D
isclos
ure Lo
g
RTI Act
2009

Page 7 of 11
Project name: 2017-2018 Reef Compliance Program
Project plan template V.1.0 – Aug 2016
Project stage Key activity
(in chronological order, and responsibility if activities areundertaken by several parties)
Expected startdate
Expectedcompletion date
Milestone/Date Dependency toother project
activities – both withinthis project and other
Taskforceimplementation projects
focussed on thefertiliser applicationrequirements forcane growing in theWet Tropics,Burdekin andMackay Whitsundaycatchments.
proportion will occur during the post harvest period(quarters 3 and 4) recognising the work demands ongrowers during harvest.
17-426 File D Page 121 of 128
Publis
hed o
n DES D
isclos
ure Lo
g
RTI Act
2009

Page 8 of 11
Project name: 2017-2018 Reef Compliance Program
Project plan template V. 1.0 – Aug 2016
Appendix B Communication and consultation plan
Communication /consultation
objectives
Customer /Stakeholder Interest/Impact Information
required Frequency Method/Delivery Responsibility Evaluation
Establish andmaintainproductive workingrelationships withindustry.
Grower collectives,local productivityservices and keyextensionpersonnel.
Complianceprogram directlyengages with theirmembers.
Keep up to datewith complianceprogram focus andactivities.
As needs. Initial meetingsin person withfollow upcommunicationeither phone,email or meetingas appropriate.
ProgramCoordinator
Productivestakeholderrelationshipsmaintained
Report on projectprogress andoutcomes.
OGBR Funding theprogram andoverseeing reefwater qualityactivities.
Program reportingon deliverables.
6 monthly Written report ProgramCoordinator
Project reportingrequirementsmet.
17-426 File D Page 122 of 128
Publis
hed o
n DES D
isclos
ure Lo
g
RTI Act
2009

Page 9 of 11
Project name: 2017-2018 Reef Compliance Program
Project plan template V. 1.0 – Aug 2016
Appendix C – Risk Assessment
Risk description Risk Category Risk Owner Likelihood Consequence Risk level Triggers Risk Treatment
Incidents, emergenciesor other departmentalpriorities requiring thediversion of compliancestaff away from reefcompliance activities.
ESR Possible Moderate Medium (13) Ensure reef complianceactivities are prioritised ifregional capacity is impactedby incidents, emergencies orother departmental priorities.Post treatment risk Medium(8).
Natural disaster such asa cyclone impacting alarge area of theindustry necessitating abreak in complianceactivities.
ESR Unlikely Major Medium (14) Refocus compliance effortaway from impacted areas.Post treatment risk Medium(9).
Potential enforceabilityissues arising from theprescribed map arerealised impacting thedepartment’s ability toprogress beyond thecommunication andeducation end of thecompliance spectrum.
EHP Possible Major High (18) Ensuring prescribed map isaddressed through the firstavailable regulatoryamendment opportunity andtarget compliance effort toinitial visits if the issues arerealised. Post treatment riskMedium (13).
Connectimplementationadversely impacting onthe time required to
ESR Likely Moderate High (17) Early and ongoing engagementwith project unify and Connectimplementation to identifyand address issues as quicklyas possible. Monitor progress
17-426 File D Page 123 of 128
Publis
hed o
n DES D
isclos
ure Lo
g
RTI Act
2009

Page 10 of 11
Project name: 2017-2018 Reef Compliance Program
Project plan template V. 1.0 – Aug 2016
undertake compliancecases.
to identify if further treatmentmeasures are required. Posttreatment risk Medium (13).
Industry backlashagainst the complianceprogram impactingofficer’s ability toundertake complianceactivities in a timelymanner or creatingsafety issues fordepartmental staff.
ESR Unlikely Major Medium (14) Maintain communication withindustry, particularly regionalgrower representative groups,to keep growers informed ofthe program. Tailor ourengagement approach to theindustry and individuals wherepossible. Post treatment riskMedium (9).
LIKELIHOOD CONSEQUENCEInsignificant Minor Moderate Major Critical
Almost Certain Medium(11)
Medium(16)
High (20) Extreme(23)
Extreme(25)
Likely Low (7) Medium(12)
High (17) High (21) Extreme(24)
Possible Low (4) Medium(8)
Medium(13)
High (18) High (22)
Unlikely Low (2) Low (5) Medium (9) Medium(14)
High (19)
Rare Low (1) Low (3) Low (6) Medium(10)
Medium(15)
Risk level Riskscale
Action required
17-426 File D Page 124 of 128
Publis
hed o
n DES D
isclos
ure Lo
g
RTI Act
2009
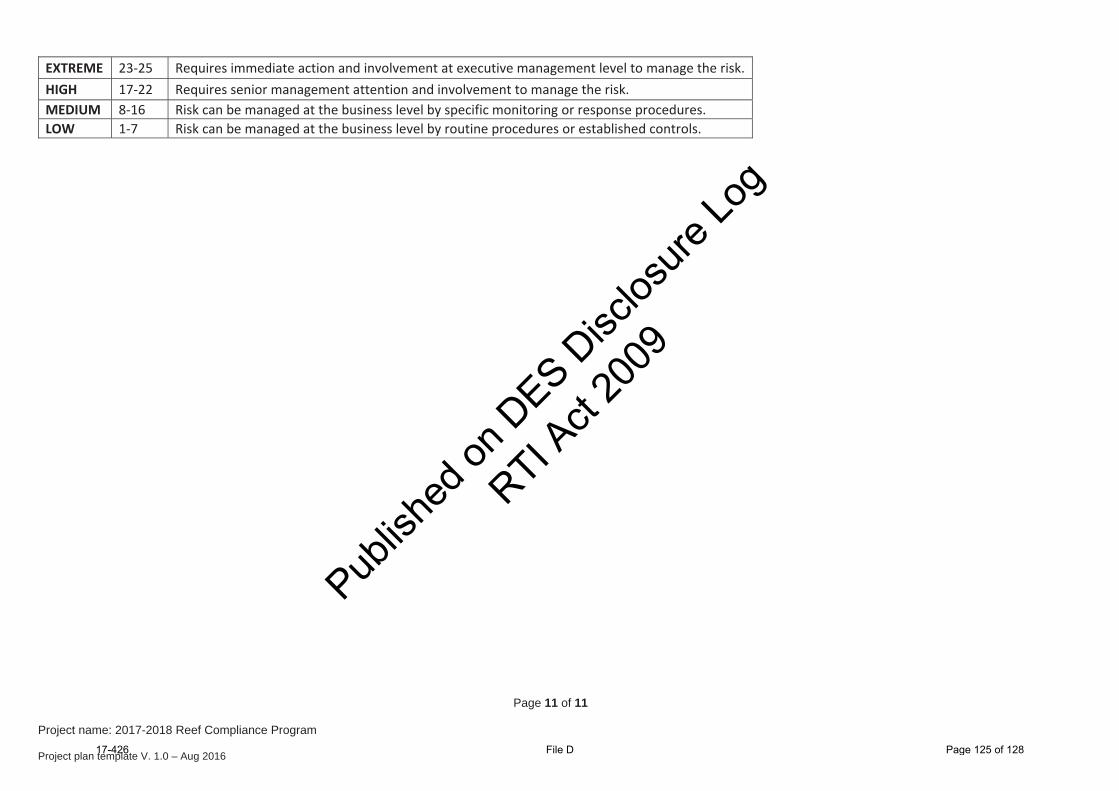
Page 11 of 11
Project name: 2017-2018 Reef Compliance Program
Project plan template V. 1.0 – Aug 2016
EXTREME 23 25 Requires immediate action and involvement at executive management level to manage the risk.HIGH 17 22 Requires senior management attention and involvement to manage the risk.MEDIUM 8 16 Risk can be managed at the business level by specific monitoring or response procedures.LOW 1 7 Risk can be managed at the business level by routine procedures or established controls.
17-426 File D Page 125 of 128
Publis
hed o
n DES D
isclos
ure Lo
g
RTI Act
2009

Mth ActualMth Budget Mth Var YTD ActualYTD Budget YTD Var Total Budget
Account Summary for APRIL for Cost Centre : 1000912 Reef Compliance Cairns
Total Var Commit.
Org Unit: CEA
Fund Class: SRL
Min & Nth QLD Compliance Env Services & RegulationED METALS HUB
QLD REEF WATER QUALITY 2017-
Activity: EBHAA REEF COMPLIANCE Compliance Improving GBR water quality
Limited Life Allocation
Env Stewardship
EXPENSES
Salaries & Wages43,623.8451,465.00 7,841.16 451,424.16513,576.00 62,151.84 623,634.00 172,209.84510000 12%15% 0.00Salary Higher Duties1,278.01255.00 -1,023.01 20,222.792,550.00 -17,672.79 3,056.00 -17,166.79510013 -693%-401% 0.00Overtime92.900.00 -92.90 211.150.00 -211.15 0.00 -211.15513000 0.00Locality Allowance526.52733.00 206.48 4,375.567,456.00 3,080.44 8,992.00 4,616.44514003 41%28% 0.00Other Allowances857.630.00 -857.63 2,987.520.00 -2,987.52 0.00 -2,987.52514020 0.00Recreation Leave Expense5,070.365,718.00 647.64 64,410.2857,064.00 -7,346.28 69,293.00 4,882.72515000 -13%11% 0.00Leave Loading Expense687.640.00 -687.64 7,052.530.00 -7,052.53 0.00 -7,052.53515001 0.00Annual Leave On-cost Expense-816.200.00 816.20 -8,563.090.00 8,563.09 0.00 8,563.09515003 0.00LSL Levy Expense1,093.001,201.00 108.00 10,366.2511,983.00 1,616.75 14,551.00 4,184.75516000 13%9% 0.00Q Super Employer Contr Defined Benefit0.001,655.00 1,655.00 7,681.3016,511.00 8,829.70 20,049.00 12,367.70517000 53%100% 0.00Q Super Employer Contr Accum Plan6,224.355,539.00 -685.35 51,814.7355,277.00 3,462.27 67,123.00 15,308.27517001 6%-12% 0.00Workers Compensation Premiums217.63217.00 -0.63 2,054.212,166.00 111.79 2,630.00 575.79520500 5%0% 0.00Staff Examinations / Medical Fees0.000.00 0.00 75.000.00 -75.00 0.00 -75.00520503 0.00
58,855.6866,783.00 7,927.32 614,112.39666,583.00 52,470.61 809,328.00 195,215.61Employee Related Expenses 8%12% 0.0051
Motor Vehicle - Taxi Fares21.000.00 -21.00 116.330.00 -116.33 0.00 -116.33525012 0.00Travel Allowances (No Payroll Tax)298.350.00 -298.35 3,869.450.00 -3,869.45 0.00 -3,869.45526001 0.00Travel Expense Other-8.500.00 8.50 3,908.260.00 -3,908.26 0.00 -3,908.26526009 0.00Travel Airfares-409.562,083.00 2,492.56 5,569.1720,830.00 15,260.83 25,000.00 19,430.83526020 73%120% 0.00
-98.712,083.00 2,181.71 13,463.2120,830.00 7,366.79 25,000.00 11,536.79Travel 35%105% 0.0053
Staff Training & Devt External Costs0.00417.00 417.00 0.004,170.00 4,170.00 5,000.00 5,000.00520504 100%100% 0.000.00417.00 417.00 0.004,170.00 4,170.00 5,000.00 5,000.00Training & Development 100%100% 0.0054
Motor Vehicles Fuel Oil248.95232.00 -16.95 1,139.892,320.00 1,180.11 2,784.00 1,644.11525000 51%-7% 0.00Motor Vehicles Hire Q Fleet2,307.131,850.00 -457.13 11,898.1218,500.00 6,601.88 22,200.00 10,301.88525002 36%-25% 0.00Motor Vehicles Repairs & Maintenance401.270.00 -401.27 2,028.330.00 -2,028.33 0.00 -2,028.33525006 0.00Motor Vehicles Insurance Fees0.00125.00 125.00 0.001,250.00 1,250.00 1,500.00 1,500.00525008 100%100% 0.00Motor Vehicle Accessories99.50293.00 193.50 766.502,930.00 2,163.50 3,516.00 2,749.50525025 74%66% 0.00
3,056.852,500.00 -556.85 15,832.8425,000.00 9,167.16 30,000.00 14,167.16Motor Vehicles 37%-22% 0.0055
Telephone & Fax - Office238.60401.00 162.40 2,694.194,010.00 1,315.81 4,815.00 2,120.81529003 33%40% 0.00238.60401.00 162.40 2,694.194,010.00 1,315.81 4,815.00 2,120.81Telephone & Fax 33%40% 0.0056
Computer Facilities Management939.191,206.00 266.81 9,928.5811,658.00 1,729.42 14,070.00 4,141.42528002 15%22% 0.00Computer Software Expensed0.000.00 0.00 45.400.00 -45.40 0.00 -45.40528016 0.00ITP Discretionary Service Charges0.002.00 2.00 272.0020.00 -252.00 18.00 -254.00530383 -1260%100% 0.00
10 000 to ZZZ 00000 to ZZZZZPeriod : Fund Class : Activity : CONTLSegment :
19/05/201821/05/2018Run On : Extract Date : 1/3Page No :Report Ref : FR_DET_050
Org Units : 000 to ZZZ Accounts : 400000 to 999999 Grp: 41 to 5E
Cost Centre : 1000912 to 1000912 Internal Order : Excluded17-426 File D Page 126 of 128
Publis
hed o
n DES D
isclos
ure Lo
g
RTI Act
2009

Mth ActualMth Budget Mth Var YTD ActualYTD Budget YTD Var Total Budget
Account Summary for APRIL for Cost Centre : 1000912 Reef Compliance Cairns
Total Var Commit.
Org Unit: CEA
Fund Class: SRL
Min & Nth QLD Compliance Env Services & RegulationED METALS HUB
QLD REEF WATER QUALITY 2017-
Activity: EBHAA REEF COMPLIANCE Compliance Improving GBR water quality
Limited Life Allocation
Env Stewardship
939.191,208.00 268.81 10,245.9811,678.00 1,432.02 14,088.00 3,842.02Network & Computer 12%22% 0.0057
Property Security - DPW0.000.00 0.00 165.000.00 -165.00 0.00 -165.00524015 0.00Property Storage Charges0.00125.00 125.00 585.001,250.00 665.00 1,500.00 915.00524016 53%100% 0.00
0.00125.00 125.00 750.001,250.00 500.00 1,500.00 750.00Accommodation & Related 40%100% 0.0058
Stores & Stationery0.00200.00 200.00 1,200.002,000.00 800.00 2,401.00 1,201.00530035 40%100% 0.00Printing Other0.00250.00 250.00 1,000.002,500.00 1,500.00 3,000.00 2,000.00530109 60%100% 0.00Materials0.000.00 0.00 568.280.00 -568.28 0.00 -568.28530168 0.00
0.00450.00 450.00 2,768.284,500.00 1,731.72 5,401.00 2,632.72Consumables 38%100% 0.0059
Grants - Non Capital0.000.00 0.00 0.000.00 0.00 0.00 0.00540009 0.000.000.00 0.00 0.000.00 0.00 0.00 0.00Grants & Subsidies 0.005C
Staff Corporate Wardrobe0.0042.00 42.00 -3,000.00420.00 3,420.00 500.00 3,500.00520502 814%100% 0.00Staff Uniforms0.000.00 0.00 2,946.680.00 -2,946.68 0.00 -2,946.68520506 0.00Maintenance Plant & Equipment0.000.00 0.00 0.000.00 0.00 0.00 0.00524027 0.00Repairs & Maintenance - Other Transport0.000.00 0.00 381.360.00 -381.36 0.00 -381.36525019 0.00Refreshments & Light Meals0.0050.00 50.00 0.00500.00 500.00 600.00 600.00530011 100%100% 0.00Freight & Cartage (incl.Railway Charges)0.0042.00 42.00 0.00420.00 420.00 500.00 500.00530013 100%100% 0.00Postage0.0067.00 67.00 0.00670.00 670.00 800.00 800.00530026 100%100% 0.00PR Campaign Advertising Media Space0.000.00 0.00 0.006,000.00 6,000.00 9,000.00 9,000.00530028 100% 0.00PR Displays Promotions90.910.00 -90.91 901.2210,000.00 9,098.78 15,000.00 14,098.78530030 91% 0.00Plant & Equipment Maintenance0.0083.00 83.00 2,500.00830.00 -1,670.00 1,000.00 -1,500.00530122 -201%100% 0.00Laboratory Consumables and Services0.000.00 0.00 3,440.000.00 -3,440.00 0.00 -3,440.00530157 0.00Medical Consumables0.000.00 0.00 3.890.00 -3.89 0.00 -3.89530373 0.00Accommodation Fitout costs0.000.00 0.00 2,000.000.00 -2,000.00 0.00 -2,000.00530378 0.00
90.91284.00 193.09 9,173.1518,840.00 9,666.85 27,400.00 18,226.85Other Expenses 51%68% 0.005D
Plant and Equipment <$50000.000.00 0.00 233.690.00 -233.69 0.00 -233.69530304 0.000.000.00 0.00 233.690.00 -233.69 0.00 -233.69Low Value Assets 0.005E
63,082.5274,251.00 11,168.48 669,273.73756,861.00 87,587.27 922,532.00 253,258.27EXPENSES 12%15% 0.00
63,082.5274,251.00 11,168.48 669,273.73756,861.00 87,587.27 922,532.00 253,258.27CTR : 1000912 Reef Compliance Cairns 12%15% 0.00
10 000 to ZZZ 00000 to ZZZZZPeriod : Fund Class : Activity : CONTLSegment :
19/05/201821/05/2018Run On : Extract Date : 2/3Page No :Report Ref : FR_DET_050
Org Units : 000 to ZZZ Accounts : 400000 to 999999 Grp: 41 to 5E
Cost Centre : 1000912 to 1000912 Internal Order : Excluded17-426 File D Page 127 of 128
Publis
hed o
n DES D
isclos
ure Lo
g
RTI Act
2009

Mth ActualMth Budget Mth Var YTD ActualYTD Budget YTD Var Total Budget
Account Summary for APRIL for Cost Centre : 1000912 Reef Compliance Cairns
Total Var Commit.
Org Unit: CEA
Fund Class: SRL
Min & Nth QLD Compliance Env Services & RegulationED METALS HUB
QLD REEF WATER QUALITY 2017-
Activity: EBHAA REEF COMPLIANCE Compliance Improving GBR water quality
Limited Life Allocation
Env Stewardship
63,082.5274,251.00 11,168.48 669,273.73756,861.00 87,587.27 922,532.00 253,258.27Report Total 12%15% 0.00
10 000 to ZZZ 00000 to ZZZZZPeriod : Fund Class : Activity : CONTLSegment :
19/05/201821/05/2018Run On : Extract Date : 3/3Page No :Report Ref : FR_DET_050
Org Units : 000 to ZZZ Accounts : 400000 to 999999 Grp: 41 to 5E
Cost Centre : 1000912 to 1000912 Internal Order : Excluded17-426 File D Page 128 of 128
Publis
hed o
n DES D
isclos
ure Lo
g
RTI Act
2009

![Stoic Logic: The Dialectic from Zeno to Chrysippus · )urp 1rupdq .uhw]pdqq 6hpdqwlfv +lvwru\ ri lq (qf\forshgld ri 3klorvrsk\ 6hfrqg hglwlrq (glwhg e\ %rufkhuw 'rqdog 0 1hz](https://img.dokumen.tips/doc/110x75/5b4605547f8b9a501f8bf816/stoic-logic-the-dialectic-from-zeno-to-chrysippus-urp-1rupdq-uhwpdqq-6hpdqwlfv.jpg)


![,FMTFZ - $PPLkaylamccullough.com/.../portfolio/MusicEdResume.pdf · 7kh 8qlyhuvlw\ ri 2nodkrpd _ 1rupdq 2. 0dmru 0xvlf (gxfdwlrq ,qvwuxphqwdo ([shfwhg *udgxdwlrq 0d\ +lghdzd\ 3l]]d](https://img.dokumen.tips/doc/110x75/6015557c5ee843259a05318f/fmtfz-7kh-8qlyhuvlw-ri-2nodkrpd-1rupdq-2-0dmru-0xvlf-gxfdwlrq-qvwuxphqwdo.jpg)


![Daniel Brown 2019 Disaster Summit Final...+DUYH\ %LOOLRQ,UPD %LOOLRQ 0DULD %LOOLRQ h v ] ^ & & ] P µ D } Z v ¨ î ò ñ ] o o ] } v ] v u P ^ À o Z µ v ] v ] v ] Z D ] Á Z } v](https://img.dokumen.tips/doc/110x75/60338b6b80a360208e2bc4f6/daniel-brown-2019-disaster-summit-final-duyh-loolrqupd-loolrq-0duld-loolrq.jpg)
