Embed Size (px)
Citation preview
LOCAW‐ 265155 – FP7 ENV.2010 – WP3– Deliverable 3.2: PART 1: DOCUMENTS AND INTERVIEWS ANALYSIS
1
D3.2 Report on the external conditions influencing sustainable practices and behaviours WP3. Structural and organizational factors influencing sustainability-related everyday practices in the workplace Part 1: Documents and interviews analysis Low Carbon at Work: Modelling Agents and Organisations to achieve Transition to a Low Carbon Europe LOCAW - Grant Agreement number 265155 Workpackage 3 – Deliverable 3.2
2012
WP3 Coordinator: West University of Timisoara, Department of Psychology, Romania
30/12/2012
LOCAW‐ 265155 – FP7 ENV.2010 – WP3– Deliverable 3.2: PART 1: DOCUMENTS AND INTERVIEWS ANALYSIS
2
DELIVERABLE 3.2
Report on the external conditions influencing sustainable practices and behaviours
Part 1: Documents and interviews analysis
University of Corunna (Spain), Aquatim (Romania), Municipality of Groningen (the Netherlands) and Enel Green Power (Italy)
&
Volvo AB (Sweden) and Shell (UK)
Report Authors:
From University of Corunna, Spain Authors: Adina Dumitru, Amelia Fraga, Miguel Muñoz Cantero;
Supervision: Ricardo García Mira, Pedro Vega Marcote
From West University of Timisoara, Romania Coordonator: Corina Ilin
Authors: Alexandra Docea, Adina Dumitru, Ildiko Erdei, Daniela Moza, Florin Lobonț, Lăcrămioara Radu
Supervision: Zoltan Bogathy, Alin Gavreliuc, Florin Alin Sava
From University of Groningen, the Netherlands
Authors: Anne‐Kathrin Helbig, Linda Steg, Jan Willem Bolderdijk, Kees Keizer
From CIRPA – Sapienza University of Rome, Italy
From Surrey University & Umea University,
UK & Sweden
Authors: Giuseppe Carrus, Eugenio de Gregorio, Fridanna Maricchiolo
Supervision: Mirilia Bonnes, Marino Bonaiuto
Authors: Aina Tollefsen, Nora Räthzel, David Uzzell and Tommy Jensen
LOCAW‐ 265155 – FP7 ENV.2010 – WP3– Deliverable 3.2: PART 1: DOCUMENTS AND INTERVIEWS ANALYSIS
3
CONTENTS
Chapter 1: General introduction...............................................................................................4
1.1 Aims of WP3…………………………………………………………………………………………………………4
1.2 Methods and analyses of WP3………………………………………………………………………………4
Chapter 2: National Reports…………………………………………………………………………………………………8
2.1 Spain…………………………………………………………………………………………………………………….8
2.2 Romania………………………………………………………………………………………………………………23
2.3 The Netherlands………………………………………………………………………………………………….47
2.4 Italy……………………………………………………………………………………………………………………..54
Chapter 3: General Concluding Remarks for four study cases………………………………………….66
Chapter 4: Report on the external conditions influencing sustainable practices and behaviours ‐ Volvo AB (Sweden) and Shell UK ………………………………………………………………….73
References…………………………………………………………………………………………………………………………87
LOCAW‐ 265155 – FP7 ENV.2010 – WP3– Deliverable 3.2: PART 1: DOCUMENTS AND INTERVIEWS ANALYSIS
4
1. GENERAL INTRODUCTION 1. 1. Aims of WP3
This work package aims to provide a comprehensive analysis of the macro‐factors influencing everyday practices and behaviors in the workplace, in four different organizations. Organizations are nested within a political, economic and social context which creates either barriers or drivers for implementing sustainable working practices. The external context acts as sets of boundary conditions on the organizations, generating specific opportunities and obstacles for change. A comprehensive analysis of these macro‐factors in four case studies will provide relevant information on how to promote policies that enhance opportunities and minimize the influence of obstacles in transitioning to a sustainable low carbon Europe.
On the one hand, these macro‐factors will be analyzed as reflected in organizational documents, and on the other, we will look at how people understand and perceive the influence of these macro factors on their everyday behaviors at work. The data obtained in this work package will be complemented with the data obtained in WP5, on management and trade unions influence on organizational sustainability practices, thus reaching a comprehensive analysis of structural and organizational conditions influencing sustainable practices at work. Furthermore, in WP 5, data on the structural conditions of the two remaining case studies (heavy industries – United Kingdom and Sweden) will also be collected. The results of these two work packages, combined with results in WP 2 and WP 4 will be integrated in WP 6, thus permitting a final synthesis, cross‐country comparisons and policy solutions for reaching a low carbon Europe.
WP3 includes:
a) An analysis of EU, national and regional sustainability regulations relevant for each organization;
b) An analysis of political, economic and social conditions (market characteristics, political environment, social aspects pertinent to the organization’s profile) in which the organization operates and of demands and pressures of relevant stakeholder groups;
c) An analysis of the ways in which the regulations and conditions described under a) and b) are understood and implemented in the organization (in the mission, strategic plans and everyday operations of the organization);
d) An analysis of existing organizational norms and their potential to act as barriers or drivers to the implementation and success of policies designed to reduce greenhouse gas emissions.
1. 2. Methods and analyses of WP3
Data will be gathered via document analysis and interviews with workers situated at different levels of decision‐making within the organization. Four organizations will be analyzed in this work‐package: 1. University of Corunna (Spain); 2. The Municipality of Groningen (The Netherlands); 3. S. C. Aquatim S. A. (Romania); 4. Enel Green Power (Italy).
This WP will also include two scenario development workshops. In a back‐casting exercise, members from each organization will start from a desirable endpoint for the organization within a sustainable, low‐carbon Europe and will then construct several narrative paths to that outcome and imagine ways in which the organization could fail to adapt successfully. The first workshop, lasting one day, will be
LOCAW‐ 265155 – FP7 ENV.2010 – WP3– Deliverable 3.2: PART 1: DOCUMENTS AND INTERVIEWS ANALYSIS
5
used to develop these scenarios, and a second workshop will be used for feedback and possible modifications of the scenarios, after the agent‐based models are built. We employed in WP3 qualitative data analysis and the following sections illustrate the main tools that have been used for the document analyses and interviews. Tools for documents analysis In WP2 we have planned the use of materials and documents of the companies involved in the LOCAW project. In WP3 we continued with this procedure, but having a different target. We analysed documents witch refer to the macro‐factors influencing everyday practices and behaviours in the workplace. Tools for interviews with managers situated at different levels of decision‐making within the organization The interview has been developed in a non‐directive manner. The active role of the researcher was decisive. The interview has been audio recorded, because speech is much better than any written forms (which limit the speech). In order to create a general image of the perception of people about the current situation of organizations in the issues of GHG emissions we suggested using the following steps in the management of comprehensive interviews. Below are described the steps for interviews with managers for structural and organizational factors influencing sustainability‐related everyday practices in the workplace.
Interview and discussion track for the interviews with managers for structural and organizational factors influencing sustainability‐related everyday practices in the workplace.
General topic: Structural and organizational factors influencing sustainability‐related everyday practices in the workplace The comprehensive interview has been developed for the current project in two progressive stages:
a. Around referential criteria (7‐8) ‐ preponderantly semi‐directive; We propose, such us, referential criteria, the following themes (which will be transforming in
questions in an appropriate way in each language and organizational context): 1. The organization's strategies and practices to reduce carbon emissions 2. Specifics of organizational communication networks 3. Commitment of different levels of management to sustainable company development 4. Corporative commitment to sustainable company development 5. Discourses generated inside the organization for sustainable development 6. Perception of the main formal regulations (laws, procedures) aimed at sustainable
development and impact of these perceptions on everyday practices in the organization 7. How sustainable development principles could be integrated in the organization 8. Opportunities and threats for introducing the organizational sustainable practices in
companies’ everyday life and work process. b. Around specific themes (10‐20), selected through theoretical framework relevant for the
subject ‐ preponderantly directive (punctual, targeted questions). Of course, the role of the researcher is crucial. The following list is orientating one, and each researcher team can choose the specific questions in according with the study case and organizational culture.
LOCAW‐ 265155 – FP7 ENV.2010 – WP3– Deliverable 3.2: PART 1: DOCUMENTS AND INTERVIEWS ANALYSIS
6
9. Through which methods do you promote the values environmental protection in your organization? 10. Has your organization taken any measures for the reduction of GHG emissions through the minimization of the use of resources? What were this measures and how efficient would you say they were? Are they part of your daily practices?
11. Have you taken any measures concerning mobility? Which were the interventions directed at the reduction of the GHG emissions caused by the use of vehicles etc.?
We can use the study done by Graham‐Rowe et al. (2011) for the clarification of the different aspects. These authors have indicated the main structural and organizational factors, essential to this issue, as being:
a. the relocation of employees to reduce the distance to be covered by the commute from home to work and back;
b. placing the employees on construction which are closest to their home;
c. staff discounts for public transportation;
d. higher price for parking space at work;
e. promotion of bicycle use and parking spaces for bicycles inside the building;
f. transportation by bus offered by the company for all employees, advice and journey plans for new employees;
g. encouraging employees to car pool;
What are the main reasons that have made you take the current measures? In addition, to add a layer of nuance: the factors which have motivated you, the factors which had the potential to pressure you to take the concrete measures you have implemented for the reduction of GHG. For example: governmental regulations, public pressure from non‐profit organizations, stakeholder pressure, energy prices, and technological changes.
12. What are the main obstacles that prevent your organization from taking action for the reduction of GHG? (For example: the lack of a strong environmental policy framework, uncertainty concerning governmental actions and stance, uncertainty about the market.)
13. Which of the governmental environmental regulations have weight more: the ones promoting the development of proactive actions or the ones imposed, involving sanctions for non‐compliance?
14. Is there any way in which your organization offers its employees the possibility to learn about the issue of climate change, sustainability respectively? (For example, are there any training sessions available, workshops, access to social networks which discuss the topic of environmental sustainability, virtual communities, virtual platforms for the monitoring of carbon emissions.)
15. Have you implemented in your organization environmental management systems? (For example: do they have ISO 14001 certification? Studies show that having a certification doesn't always mean daily practices which observe the standards. Moreover, we can check if the top leadership supports environment activities, if there is a specialist in environmental
LOCAW‐ 265155 – FP7 ENV.2010 – WP3– Deliverable 3.2: PART 1: DOCUMENTS AND INTERVIEWS ANALYSIS
7
issues, programmers for raising employee awareness, teamwork and reward systems for employees (characteristic for environmental management systems).
16. Have the managers in your organization used innovative strategies or compensation approaches like buying emission credits?
17. How was the proactive management reflected in the financial performance of your company, in the last years?
18. Has the reduction of greenhouse gas emissions contributed to the increase or maintenance of the public image and reputation of your organization?
19. Is the low level of emissions perceived as an advantage over your competitors?
20. Have the sustainable practices in your organization been influenced by the consumers of your products/services?
21. Did your feel the actions of clients, stakeholders, the community or the pro‐environment organizations as a pressure to reduce greenhouse gas emissions?
22. Which was the role of technologies and changes in the reduction of emissions?
LOCAW‐ 265155 – FP7 ENV.2010 – WP3– Deliverable 3.2: PART 1: DOCUMENTS AND INTERVIEWS ANALYSIS
8
2. NATIONAL REPORTS
2. 1. SPAIN
University of Corunna, Spain Authors: Adina Dumitru, Amelia Fraga, Miguel Muñoz Cantero
Supervision: Ricardo García Mira, Pedro Vega Marcote
1. Introduction
1.1 Objective of the report
This report describes the results of the study carried out at the University of Corunna (Spain) in WP 3, and provides an assessment of the structural and organizational factors affecting environmentally‐relevant practices and behaviors in the workplace. In order to fulfill the objectives of LOCAW, we have studied the practices with an impact on the level of CO2 emissions, focusing on three main categories of organizational practices:
- Consumption of materials and energy - Waste generation and management - Organization‐related mobility.
This analysis provides an overview of political, social and economic factors affecting everyday practices in the workplace, both external and internal to the organization. It provides a comprehensive analysis of the macro‐factors influencing everyday practices and behaviors in the workplace, in a public higher education organization such as the University of Corunna. These macro‐factors were analyzed as they are reflected in organizational documents, on the one hand, and, on the other, we looked at the way people in positions of leadership understand and perceive the influence of these macro factors on the workers´ everyday behaviors at the University. Thus, the results presented here are part of Workpackage 3, and the data obtained will be used to orient the next stages of the research and to fine tune the research instruments for the following work packages.
1.2 Short profile of the University of Corunna
The University of Corunna is a public, and relatively new, university. It was founded in 1989 and it has two campuses: A Coruña (with six different spatial locations: Maestranza, Riazor, Elviña, Zapateira, Bastiagueiro and Oza) and Ferrol (with two spatial locations: Esteiro and Serantes). Its staff today consists of 1,513 faculty and 760 administrative and service personnel. It has 24,554 students divided between the two campuses. The University users, both staff and students, with their patterns of energy and materials consumption, waste generation and organization‐related mobility, have a considerable impact on the environment in terms of GHG emissions. Furthermore, the University plays a key role in the education of citizens in general, and thus has the potential to be an important contributor to a low‐carbon Europe. Its direct and indirect impact on society is considerable, as it can form citizens who are knowledgeable of environmental problems and solutions in our society today and who also know how to act in sustainable ways both in their homes and in the workplace – and are motivated to do so.

LOCAW‐ 265155 – FP7 ENV.2010 – WP3– Deliverable 3.2: PART 1: DOCUMENTS AND INTERVIEWS ANALYSIS
9
Since its foundation, UDC has developed research on issues related to sustainable development and the environment, through research groups working in Environmental Economy, Environmental Law, Environmental Chemistry and Biology, Environmental Education and Environmental Psychology. In order to integrate environmental knowledge from all these fields, in 1997 the University´s Environmental Institute was created. This institute generated several initiatives that were managed by the Vice‐Rectorate for the Environment and Infrastructure, and later became the Office for the Environment. All these institutional structures, together with the work of several research groups (including the People‐Environment Research Unit as one of the most active) support multidisciplinary research on environmental behavior and on the development of strategies to connect research with public policy within the Network of Municipalities for Sustainability.
2. Documents analysis
2.1 Method
In order to identify the structural and organizational factors that have a relevant influence on organizational behaviors and practices, we have chosen several documents to analyze. Among them, we included documents produced by the Conference of Rectors of Spanish Universities, a body that establishes quality criteria for universities, which are then adapted by the University of Corunna or at least taken into account in its strategic plans. Organizational documents were also selected, with a special emphasis on strategic plans, the declaration of the mission, vision and values of the University of Corunna, documents presenting strategic objectives over several years and operative plans. Finally, our team also analyzed documents produced by the Social Council of the University, a body which represents social and political stakeholders of the University of Corunna and whose function is to represent these stakeholders and establish a relationship of cooperation between the university and external agents, such as government, civil society groups and private corporations, with the aim of ensuring an adequate flow of information and communication among these.
The documents were analyzed following the structure already presented in Deliverable 3.1. Guidelines for document analysis and interviews, with the aim of identifying structural and organizational factors which influence everyday practices in the workplace. Thus, the following list of indicators was used to orient the document analysis:
a) EU, national and regional sustainability regulations relevant for each organization ‐ Indirect and accidental consequences of environmental regulations
b) Political, economic and social conditions in which the organization operates and of demands and pressures of relevant stakeholder groups: Market characteristics / Political environment / Social aspects pertinent to the organization‘s profile;
c) Ways in which the regulations and conditions described under a) and b) are understood and implemented in the organization (in the mission, strategic plans and everyday operations of the organization): Organizational climate and culture / Organizational vision, mission, values / Decision‐making processes and strategic planning;
d) Organizational norms and their potential to act as barriers or drivers to the implementation and success of policies designed to reduce greenhouse gas emissions: Motivational factors, driver and barriers for implementing sustainable practices in the organizations. All documents were analyzed using the version 6.2 of Atlas.ti.
LOCAW‐ 265155 – FP7 ENV.2010 – WP3– Deliverable 3.2: PART 1: DOCUMENTS AND INTERVIEWS ANALYSIS
10
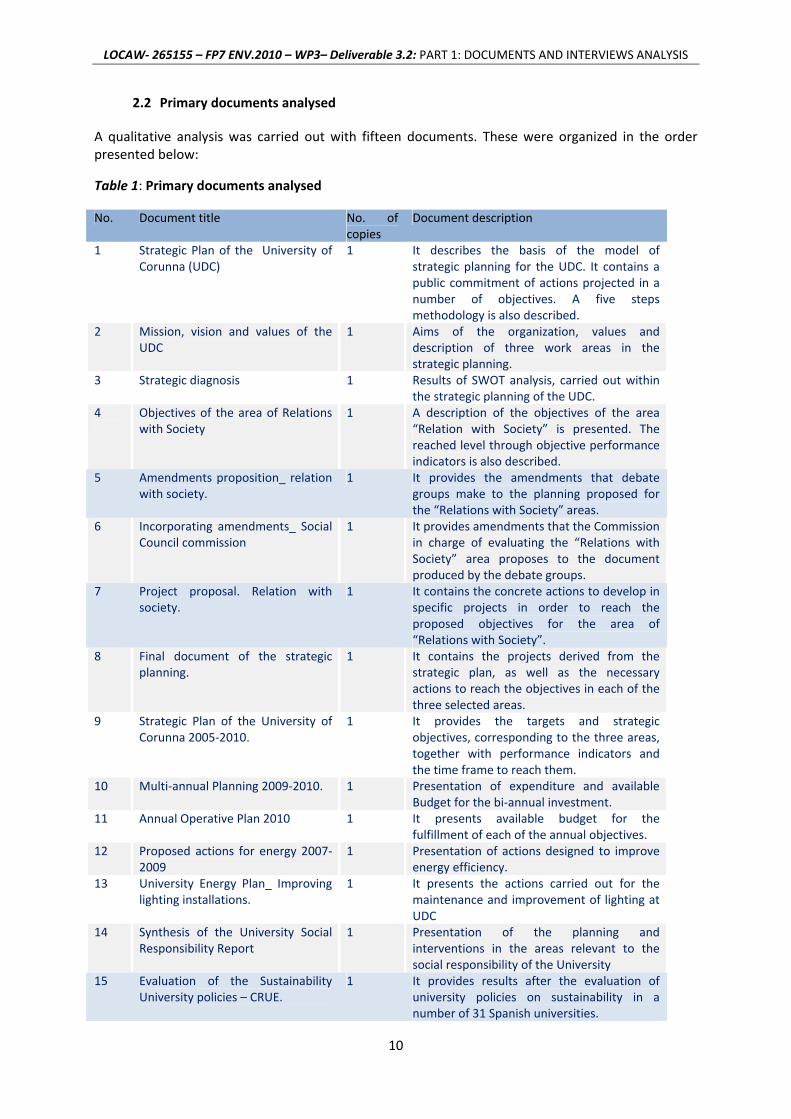
2.2 Primary documents analysed
A qualitative analysis was carried out with fifteen documents. These were organized in the order presented below:
Table 1: Primary documents analysed
No. Document title No. of copies
Document description
1 Strategic Plan of the University of Corunna (UDC)
1 It describes the basis of the model of strategic planning for the UDC. It contains a public commitment of actions projected in a number of objectives. A five steps methodology is also described.
2 Mission, vision and values of the UDC
1 Aims of the organization, values and description of three work areas in the strategic planning.
3 Strategic diagnosis 1 Results of SWOT analysis, carried out within the strategic planning of the UDC.
4
Objectives of the area of Relations with Society
1 A description of the objectives of the area “Relation with Society” is presented. The reached level through objective performance indicators is also described.
5 Amendments proposition_ relation with society.
1 It provides the amendments that debate groups make to the planning proposed for the “Relations with Society” areas.
6 Incorporating amendments_ Social Council commission
1 It provides amendments that the Commission in charge of evaluating the “Relations with Society” area proposes to the document produced by the debate groups.
7 Project proposal. Relation with society.
1 It contains the concrete actions to develop in specific projects in order to reach the proposed objectives for the area of “Relations with Society”.
8 Final document of the strategic planning.
1 It contains the projects derived from the strategic plan, as well as the necessary actions to reach the objectives in each of the three selected areas.
9 Strategic Plan of the University of Corunna 2005‐2010.
1 It provides the targets and strategic objectives, corresponding to the three areas, together with performance indicators and the time frame to reach them.
10 Multi‐annual Planning 2009‐2010. 1 Presentation of expenditure and available Budget for the bi‐annual investment.
11 Annual Operative Plan 2010 1 It presents available budget for the fulfillment of each of the annual objectives.
12 Proposed actions for energy 2007‐2009
1 Presentation of actions designed to improve energy efficiency.
13 University Energy Plan_ Improving lighting installations.
1 It presents the actions carried out for the maintenance and improvement of lighting at UDC
14 Synthesis of the University Social Responsibility Report
1 Presentation of the planning and interventions in the areas relevant to the social responsibility of the University
15 Evaluation of the Sustainability University policies – CRUE.
1 It provides results after the evaluation of university policies on sustainability in a number of 31 Spanish universities.
LOCAW‐ 265155 – FP7 ENV.2010 – WP3– Deliverable 3.2: PART 1: DOCUMENTS AND INTERVIEWS ANALYSIS
11
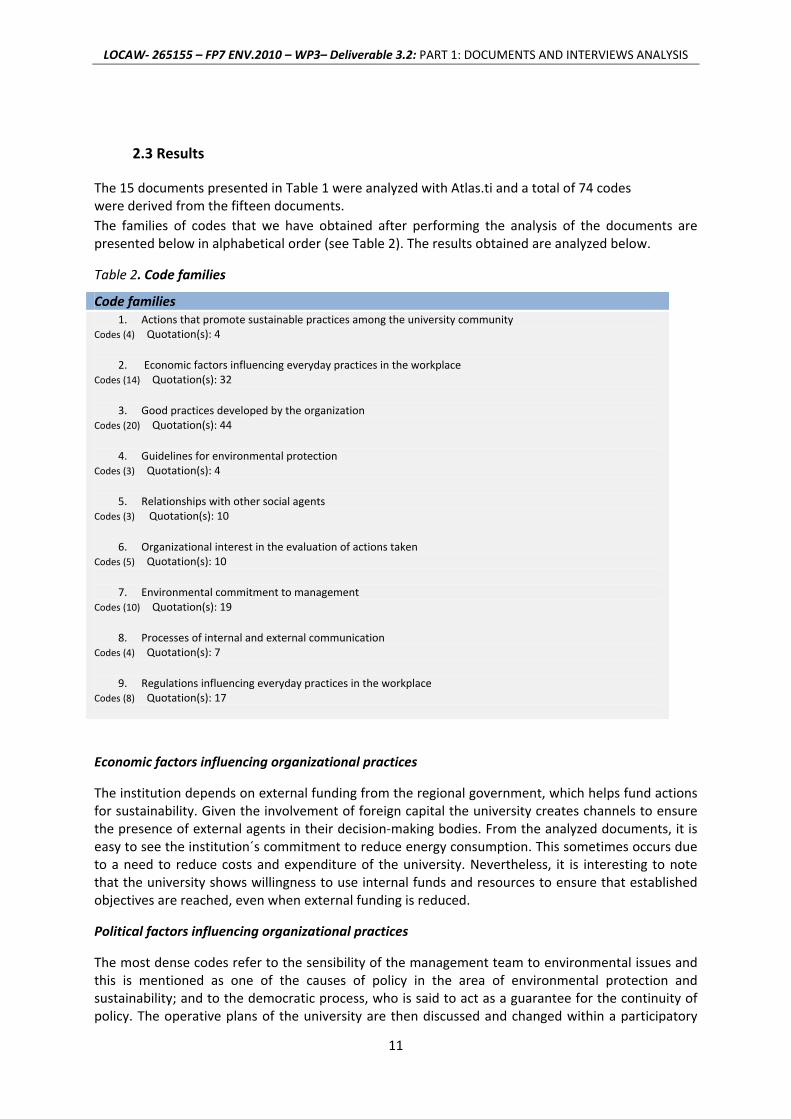
2.3 Results
The 15 documents presented in Table 1 were analyzed with Atlas.ti and a total of 74 codes were derived from the fifteen documents. The families of codes that we have obtained after performing the analysis of the documents are presented below in alphabetical order (see Table 2). The results obtained are analyzed below.
Table 2. Code families
Code families 1. Actions that promote sustainable practices among the university community
Codes (4) Quotation(s): 4
2. Economic factors influencing everyday practices in the workplace Codes (14) Quotation(s): 32
3. Good practices developed by the organization Codes (20) Quotation(s): 44
4. Guidelines for environmental protection Codes (3) Quotation(s): 4
5. Relationships with other social agents Codes (3) Quotation(s): 10
6. Organizational interest in the evaluation of actions taken Codes (5) Quotation(s): 10
7. Environmental commitment to management Codes (10) Quotation(s): 19
8. Processes of internal and external communication Codes (4) Quotation(s): 7
9. Regulations influencing everyday practices in the workplace Codes (8) Quotation(s): 17
Economic factors influencing organizational practices
The institution depends on external funding from the regional government, which helps fund actions for sustainability. Given the involvement of foreign capital the university creates channels to ensure the presence of external agents in their decision‐making bodies. From the analyzed documents, it is easy to see the institution´s commitment to reduce energy consumption. This sometimes occurs due to a need to reduce costs and expenditure of the university. Nevertheless, it is interesting to note that the university shows willingness to use internal funds and resources to ensure that established objectives are reached, even when external funding is reduced.
Political factors influencing organizational practices
The most dense codes refer to the sensibility of the management team to environmental issues and this is mentioned as one of the causes of policy in the area of environmental protection and sustainability; and to the democratic process, who is said to act as a guarantee for the continuity of policy. The operative plans of the university are then discussed and changed within a participatory

LOCAW‐ 265155 – FP7 ENV.2010 – WP3– Deliverable 3.2: PART 1: DOCUMENTS AND INTERVIEWS ANALYSIS
12
process in which members of all relevant university groups are represented. This ensures that corrections of policies are introduced to the plans proposed by the government team and this is assumed to ensure continuity of policy and a reasonable and representative process of decision‐making. Nevertheless, commitment does not translate into sufficient staff for environmental management.
The commitment of the university is also a consequence of a general declared commitment of Spanish universities with the environment, but this does not translate into a comprehensive action plan. Each university implements policies in an individual and autonomous manner.
Social factors influencing organizational practices
The interest in environmental issues is presented within a context of the universities values and mission, which reflect social engagement and the value of contributing to social welfare.
Regulatory framework
The environmental regulatory framework for the university is mainly its energy plan, which establishes the technical criteria to be respected in areas such as construction of new buildings and lighting systems. The energy plan has been developed in line with national and European regulations, showing that these are very important in promoting low‐carbon policies.
Another important influence is exercised by the process of convergence with the European Higher Education Plan, which establishes certain criteria to be respected as well as generating a pressure to compete within a larger system.
Good practices at the University
The institution reports its commitment to sustainability by initiating certain actions related to: improvement of old installations; installations of clean energy (solar energy), facilitation of the accessibility of the campus to encourage bicycle use, or support of planting new green areas.
More concrete actions are aimed at paper recycling programs and energy saving. It should be noted that all the implemented actions are isolated from each other, except for those actions related to improving lighting facilities, protected by a specific plan. This is something that is designated as a negative, since the absence of an overall energy plan makes it difficult to actually implement and maintain the various proposed actions. In addition, certain variables, such as control of water consumption, were not considered.
Policy proposals
Most policy proposals refer to promoting dissemination and awareness‐raising campaigns for environmental protection. However, the recommendations of the Spanish Conference of Rectors (CRUE) insist more on the need to define integrated energy plans that can contribute to a streamlining of actions otherwise taken in isolation.
Result measurement
There is interest in assessing the results of planned actions. The institution demonstrates its commitment to quality and evaluation, elements attached to the establishment of indicators. By establishing clear objectives and defining ways to measure them, the university facilitates the final environmental impact assessment.
LOCAW‐ 265155 – FP7 ENV.2010 – WP3– Deliverable 3.2: PART 1: DOCUMENTS AND INTERVIEWS ANALYSIS
13
Communication processes in the University
The communication process is based in two parts. On the one hand, external communication with the city council is not very successful, which impacts on received resources. On the other hand, it seems that dissemination activities are not very well organized at a societal level, which impacts on the university´s mandate to become a model for the society in which it is inserted.
Learning opportunities on environmental issues at the University
Learning opportunities at the university are mainly targeting students and include student practices for sustainability, the inclusion of environmental education across the curricula and specific environmental education programs, as well as scholarships within the Office of the Environment promoting activism for environmental conservation and education actions within the university. Nevertheless, external reports have considered these programs to be insufficient.
__________
The analysis of documents shows that the University of Corunna has an explicit commitment to sustainability and the reduction of energy consumption, which is also reflected in the willingness to use internal resources to reach established environmental objectives even when external resources coming from public government bodies are reduced or suspended. Both the declaration of values and the mission show dedication to, and engagement with, environmental objectives, defined as part of a larger social responsibility strategy.
Among political factors influencing practices at the university we have identified the expressed sensibility of management with environmental issues and objectives as well as the participation of the larger university community within a democratic process to decision‐making, which ensures the continuity of environmental policy, as well as corrections to fluctuations due to changes in government. Nevertheless, external reports show the need to integrate actions within comprehensive plans that could also be coordinated at inter‐university level. While the University of Corunna identifies a further need for dissemination of environmental actions and awareness‐raising campaigns, while the CRUE insists on the need to coordinate action across universities.
Although the UDC has developed a strategic planning as a formal document and provided with financial, material and human, and have integrated it actions to sustainability and environmental protection makes two fundamental errors linked together. On the one hand, it does not advertise well its own activities and does not engage the university community, at a large scale. The university staff does not know many of the actions carried out and therefore do not take them into account, and the same happens with students. On the other hand, planning includes goals related to sustainability across the board but, when developing specific energy plans and specific actions, only actions to reduce energy consumption and efficient lighting systems are present.
3. In‐depth interviews
In order to get a better grasp of the structural and organizational factors influencing everyday practices at work, we conducted nine in‐depth interviews with people at different levels of decision‐making and persons occupying key positions of decision‐making in environmental issues. In addition, we also interviewed one person in charge of health and safety. This was done because of the close relationship between risk prevention and environmental protection, especially in the area of waste generation and management, and also because of the high potential for intervention in the intersecting field between these two domains of activity. People are especially sensitive to health and risk prevention issues, and this can be a key selling point for low‐carbon policies and behaviours

LOCAW‐ 265155 – FP7 ENV.2010 – WP3– Deliverable 3.2: PART 1: DOCUMENTS AND INTERVIEWS ANALYSIS
14
in the future. We ensured representation of two different levels of management, at university and department level, representatives of both academic and administrative staff, and persons from the two main campuses.
The interviews were conducted using the discussion track proposed in D3.1, following two progressive phases: a) In a first phase, a free discussion of some general aspects related to the issue of emission reduction policies in the company was conducted; b) In a second phase, more specific questions were made, focused on specific and concrete aspects related to the structural and organizational factors affecting everyday practices of workers and users of the University of Corunna. Interviews were stored in audio format ad analyzed using version 6.2. of Atlas.ti.
3.1 Sample
In the following table, we present the organizational positions and roles of the people interviewed.
Table 3. List of interviewed people with their organizational roles
No People interviewed 1. Vicerector for Economic Planning and Infrastructure 2. Head of Administration 3. Deputy Director for Infrastructure and External Relations of the Politechnic Superior
School (Ferrol Campus) 4. Vicedean of Infrastructure of the Faculty of Educational Sciences (Elviña Campus) 5. Head of the Risk Prevention Unit 6. Director of the Environmental Office 7. Head of the Maintenance Service of UDC, Urbanism and Arquitectural Service 8. Head of the Structural Analysis Unit of the Research Support Service 9. President of the Social Council of UDC
3.2 Results
Codes were then organized in the following families:
1. Beliefs regarding environmentally relevant organizational practices 2. Values present in the discourse of leaders 3. Cultural factors affecting everyday practices in the workplace 4. Economic factors affecting everyday practices in the workplace 5. Political factors affecting everyday practices in the workplace 6. Social factors affecting everyday practices in the workplace 7. Technological factors affecting everyday practices in the workplace 8. Structural factors affecting everyday practices in the workplace 9. Regulatory framework of environmental practices 10. Organizational factors affecting everyday practices in the workplace 11. Organizational culture affecting everyday practices in the workplace 12. Communication processes influencing everyday practices in the organization 13. Learning opportunities on environmental issues in the organization 14. Evaluation of results in the organization 15. Policy proposals in the three environmentally relevant areas 16. Motivation 17. Good practices in the organization
LOCAW‐ 265155 – FP7 ENV.2010 – WP3– Deliverable 3.2: PART 1: DOCUMENTS AND INTERVIEWS ANALYSIS
15
Beliefs regarding environmentally relevant organizational practices
During the interviews, references were made that fit the category of beliefs regarding factors that would promote environmental practices and behaviours. The dominant beliefs are that environmental behaviour is promoted by awareness‐raising campaigns combined with real behaviour alternatives and that workers need a context that supports environmental decisions and thus limit individual choice.
Nevertheless, and in contradiction with the latter, there is also a belief that technological devices for energy saving is not the solution and also that people that already have environmentally‐friendly habits do not need any services provided by the university (for example, when it comes to providing bicycles for internal mobility. There is an assumption that spill‐over is a consequence of appropriate habits outside of work and thus a perspective that context is less important in guiding decisions.
This is supported by a belief that awareness raising campaigns are the most important interventions of behaviour change, which is in line with policies already undertaken at a larger societal level. This is a problematic tendency, considering that these ideas are pervasive both among the management staff of the university and among personnel in charge of environmental decision‐making and interventions. Thus, there tends to be an overemphasis on awareness‐raising and less attention is given to other behaviour change options. Finally, there is a belief that pro‐environmental measures generate awareness by themselves, but it is rather clear that in order for this to happen, there is a need for adequate communication of measures and the objectives guiding them to university users, which, as we will see, is rather flawed.
Values present in the discourse of leaders
The value declarations of the people interviewed can be grouped around two fundamental themes. On the one hand, the university is seen as a model and thus it is considered that environmental objectives need to be seen as value‐laden objectives and thus assumed, due to the public nature of the university. There is also a subjacent belief that environmental measures and criteria are not compatible with economic criteria and thus need to be assumed based on value‐beliefs. The consequence of this thinking is that, when funds are limited, environmentally‐relevant decisions are postponed or are limited, especially when requiring higher initial investments. On the other hand, and especially when it comes to the Social Council of the university, there is an effort to make environmental thinking compatible with economic criteria, and integrate environmental action into the economic thinking of the university leadership.
Cultural factors affecting everyday practices in the workplace
When it comes to cultural factors influencing everyday practices at the university, we see that there is a very widespread perception that the larger normative societal context does not promote environmental norms and behaviour in Spain. What is implied in this perception is, on the one hand, that people do not have the adequate beliefs, values and attitudes, and, on the other, that there is no external pressure on the university to actually implement policies that would constrain behaviour or, more generally speaking, promote pro‐environmental behaviour.Furthermore, at the organizational level, there is a normative administrative context of no pressure for compliance to authority, which, combined with a lack of awareness of the “ownership” of public good, creates a situation where neither economic considerations nor hierarchical directives can become a driver for pro‐environmental behaviour. Among cultural factors, there was also a mention to the fact that car ownership is positively seen among students, which constitutes a barrier to low‐carbon mobility behaviours.
LOCAW‐ 265155 – FP7 ENV.2010 – WP3– Deliverable 3.2: PART 1: DOCUMENTS AND INTERVIEWS ANALYSIS
16
Economic factors affecting everyday practices in the workplace
When trying to explain the limitations in environmental policies at the University, the economic factors are among the most mentioned. We can again detect a subjacent belief that environmental policies are very costly and can only be undertaken when budgets are considerable. Environmental policies are mostly associated with infrastructure adaptation and technological change, and it is considered that these kinds of system changes tend to have high costs. This is thus specified as a barrier in promoting environmentally‐friendly practices in the workplace.
This contradicts the belief we have seen is present at the university, at least among environmental management staff but also among administrative and economic management, that awareness raising campaigns are the most effective solutions. In line with this, almost every interviewee mentions the economic crisis Spain is going through as a barrier to promoting environmental policies, and mentions that this situation has stalled all pro‐active policies, as budgets tend to only be granted for maintenance.
It is rather interesting to note that environmental management staff tends to focus on the high costs of infrastructure and technological change, while administrative management tends to focus on the economic crisis as the main deterrent of environmental policies. When referring to the times before the economic crisis, it is mentioned that the centralized and fragmented structure of the university´s budget has sometimes constituted a barrier to environmental policy and actions, as these need to be transversal and also take into account the different characteristics of buildings and campuses and thus should be undertaken by intermediate level managers. Also notable is the fact that staff in charge of environmental issues sees the crisis and the previously raising prices of energy as incentives for energy efficiency and for investments in renewable energies, and this is not the case with the centralized and administrative management, which tends to think about these issues in opposite terms: the economic aspects come first and the environmental policies and actions come after. This is also supported by a perception that the economic cost‐benefit analysis does not favour environmental actions and policies, unless they are conceptualized as investment and measured in the long term.
In spite of these perceptions, we can see that environmental budgets will be maintained; at least during the following term of office (the University of Corunna has recently elected a new government). This has been approved due to a legislative bill at national level stipulating that budgets will be maintained for universities at the level of the previous year. This is also the due to social pressure exercised by the Social Council of the University, which has started to really push social responsibility on the agenda, as well as to the objective of the University of Corunna to obtain a Campus of Excellency Distinction, which has an important economic benefit for the university. In order to obtain this recognition, the university needs to demonstrate that environmental principles are really taken into account in university activities.
Political factors affecting everyday practices in the workplace
When it comes to political factors influencing everyday practices in the workplace, the relative lack of competency of the university over space use, public transport and waste management are considered a main barrier in promoting environmental policies and practices among workers. A recent conflict between the university and the local government over space use, which resulted in the resignation of the Vice rector for Infrastructure and the Environment has made this more patent and present in the discourse of university management staff.
In the case of public transport, the competency resides within the local government, which has been responsive to demands of the university for buses connecting the city with one of the main campuses of Corunna, but not with the surrounding towns, and which has been willing to help establish a train
LOCAW‐ 265155 – FP7 ENV.2010 – WP3– Deliverable 3.2: PART 1: DOCUMENTS AND INTERVIEWS ANALYSIS
17
stop on campus, but this latter policy has not proven effective. Waste management is undertaken by the local government with no cost for the university, so the university cannot decide over how this is done, but can only act on the side of waste generation, by implementing policies to reduce it. This is connected with a perception that there is a lack of collaboration between university and public bodies in environmental issues, although this opinion is not shared by the administrative management of the university.
Another important reference is made to the democratic election system of the university as both a driver and a barrier to environmental action and policies. It is considered a driver due to the fact that it stimulates good practices and adequate responses to worker demands, but it is also a barrier because it sometimes means that policy does not have adequate continuity and, most importantly, that there is a tendency not to undertake expensive systemic changes, because their results are often only seen and can be considered profitable if measured over an extended period of time.
Several external actors are mentioned as either relevant or not for the environmental policy of the university. Among the positive influences, the Energetic Institute of Galicia, a government organization in charge of defining energy policy is mentioned, as well as the growing awareness and integration by private companies of environmental impact assessment systems. Unions are mentioned as actors that do not play a relevant role in promoting environmental policy at the university.
It is also interesting to observe that the environmental staff sees the recent prioritizing of climate change at a political level as a factors affecting policy in the university, while administrative management personnel considers that there is little political interest in environmental regulations at a larger level. This could be due to a double political message which, on the one hand, appears to put value on environmental objectives and has agreed to ambitious targets of emissions reductions stipulated in international agreements while, on the other, it does little in terms of more radical systemic change.
When asked about improvements of old installations before the economic crisis, one justification offered was that the previous stage was an expansion stage and improving old installations was not a priority, but rather attention was given to new infrastructure. The new infrastructure has included environmental criteria into the design, yet they still pose important efficiency problems.
Social factors affecting everyday practices in the workplace
A dominant perception is that at the University is low bottom‐up demand and pressure for environmental policies and action. There is no perceived environmental demand from staff or from students, which contributes to making environmental policy something which the organization does as extra. Furthermore, there tends to be a perception that if environmental policy affects comfort and commodity, then it will be politically punished.
Not having any environmental demand in a democratic election system of management as the university has, makes environmental policy almost entirely dependent on the good will of managers, budgets and political pressure from other state organizations. Even when there has been demand for more environmentally friendly policies at the university, they have tended to be isolated and corresponding to a minority (for example, one request has been made for ecological and fair trade products in the university’s cafeterias.
In spite of the fact that there is a higher perceived social sensibility with the issues of sustainability and climate change, car use behaviours, high energy use and the perception that taking part in environmental actions is not profitable is still the norm. Nevertheless, societal concern with environmental performance is perceived and thus the Social Council of the University has assumed the function of representing the demand for social responsibility and the promotion of actions
LOCAW‐ 265155 – FP7 ENV.2010 – WP3– Deliverable 3.2: PART 1: DOCUMENTS AND INTERVIEWS ANALYSIS
18
related to it. Its representative perceived environmental performance as being part of the social responsibility of institutions, although it does recognize that the economic crisis has led to a reduction of environmental concern from both public and private actors.
Technological factors affecting everyday practices in the workplace
Relatively few technological factors are mentioned, that are considered to have an influence over practices in the three areas of study. Among them, the existence of energy efficient systems on the market is mentioned as a driver, while recognizing, at the same time, that the adaptation of energy systems in the university is necessary. Even in one of the areas of which the university is most proud of, which is the reduction it has achieved in paper use, it is still considered that further reductions can be aimed at by utilizing technology such as the introduction of the electronic signature. The impossibility of the reuse of electronic waste is mentioned as a barrier, given that the university is a high user of computers.
Structural factors affecting everyday practices in the workplace
The concept of structural factors is used here to define existing facilities and infrastructure and the way in which these can become either drivers or barriers for environmental behaviour and practices. With the exception of one code (all new buildings have been built with environmental efficiency criteria in mind), all codes refer to barriers. When referring to buildings, the interviewees perceive that infrastructure has been built with aesthetical criteria in mind, rather than environmental performance criteria. In most buildings there has been no consideration of consumption or concern for reducing it. They are also designed as individual blocks and are not connected among them, which duplicates services and thus leads to more consumption.
Another important structural barrier is the lack of a well‐organized public transport system, which, together with the lack of a student residence make for high CO2 emissions resulting from mobility. We have seen in WP2 that almost 50 % of all university emissions come from mobility. Finally, another barrier, although not as important as the other ones, is the lack of adequate storing systems for some of the waste generated and of the human resources to manage it.
Regulatory framework of environmental practices
There are several interesting trends that we can spot, when analysing Regulatory framework of environmental practices. On the one hand, we can see that the legislative framework for energy efficiency in buildings and waste management certification are perceived as adequate and as a driver for environmental practices at the university. The CADEP is a national‐level commission in charge of defining sustainability criteria for universities, in line with the national legislative framework and with other objectives that the Spanish Conference of Rectors defines (CRUE). In the university under study, the criteria are applied in new buildings in construction, lighting systems and the use of alternative energy sources.
In the same direction, the most important influence in establishing and applying environmental criteria in university energy, mobility and waste management decisions comes from the Conference of Rectors, which is perceived as a driver and as a positive influence. Nevertheless, the criteria defined by CRUE are non‐binding, which leads to a situation where there is a lack of standardized procedures to guide decisions that have an impact on university emissions. In these conditions, it is very complicated to establish routine practices and decision‐making habits which would transform the university in a low‐carbon organization. Finally, the European technical criteria for grading buildings are considered a driver, although it is recognized that they have not been implemented in Spain so far.
LOCAW‐ 265155 – FP7 ENV.2010 – WP3– Deliverable 3.2: PART 1: DOCUMENTS AND INTERVIEWS ANALYSIS
19
Organizational factors affecting everyday practices in the workplace
Several factors belonging to the organization are seen as barriers. Interviewees signal an important lack of human resources in environmental management and action, which limits the things that can be done to transform the university in a sustainable direction. The Office of the Environment has a Director, but has no staff of its own, and can only rely on the work of students on scholarships, which limits their possibilities of action.
Another important code refers to the deficiencies in task assignment and role descriptions which hinder efficient policy‐making. This code is related to the previous one and refers to the fact that environmental decisions and policies do not correspond to specific staff roles. This has as a result a situation in which deputy deans end up taking care of maintenance and spending their time in tasks that could perfectly be performed by specialized maintenance personnel.
Finally, another important code refers to the need for coordination and integration of systems. There is a perception that policy‐making is undertaken in separate departments which are insulated and thus information and action do not flow in a coordinated way to ensure transversal application of environmental criteria in all university actions.
Organizational culture affecting everyday practices in the workplace
The elements of the organizational culture that influence everyday practices at the university are organizational factors as well, but we decided to treat them separately, because of their potentially high influence on university policy. The university is perceived as a “society of equals”, and thus with no functional or efficient hierarchies. This creates a situation, in which any kind of monitoring is perceived as punitive, except when it comes to health reasons, thus making it very difficult to implement adequate monitoring and tailored feedback to improve environmental performance.
Besides this, there is a preference for centralized decision‐making to avoid corruption accusations. This is the case especially in expensive infrastructure decisions which are taken at a centralized level, but not limited to them.
Communication processes influencing everyday practices in the organization
The fact that environmental information is not communicated through adequate channels constitutes an important barrier. This information is centralized by the Office of the Environment and many times it is communicated in reports, presentations at specific events and the webpage of the Office. Many times, managers at different levels of decision‐making perceive that this information does not reach them in an adequate way, or it is not followed by tailored recommendations.
Together with the lack of human resources mentioned above, this leads to a situation in which decisions are not made with environmental criteria in mind. Related to this, it is mentioned that feedback about energy use, even when it is produced, it is slow and does not reach staff in a usable way for both environmental policy and practices to be integrated into daily working life.
As a consequence, several interviewees have suggested the need for the promotion of meetings among intermediate level managers to discuss issues of common interest, learn about good practices from their colleagues, and find common and creative solutions to experienced environmental dilemmas. No meetings of this kind have been promoted by the corresponding Vicerectorate.
Learning opportunities on environmental issues in the organization
Regarding learning opportunities on environmental issues, we can see that most learning opportunities are available to students through the curricula, through specialized courses and volunteering actions. These opportunities are rather limited for staff and they refer to awareness‐
LOCAW‐ 265155 – FP7 ENV.2010 – WP3– Deliverable 3.2: PART 1: DOCUMENTS AND INTERVIEWS ANALYSIS
20
raising campaigns and the actual changes in policy. The latter can only be a learning opportunity if changes are visible or are well‐communicated by the Office of the Environment.
Evaluation of results in the organization
Measuring environmental performance at the university also poses several problems. The most important one refers to the lack of measurements over time, of consumption of energy, waste management indicators or mobility. This means that the evaluation of policies in terms of emissions reduction is practically impossible. Nevertheless, these measurement systems have started to be implemented in the last few years and are still being developed. For example, one of the codes refers to the system of indicators regarding CO2 levels that the risk prevention unit is creating for certain research laboratories, and another refers to the measurement and control of energy consumption in buildings being done by the Maintenance Unit and the Office of the Environment in every Unit, which has allowed for the calculation of the ecological footprint of the university.
As a barrier, it is also mentioned that some existing indicators for measuring environmental performance in universities are not implemented and also that management should have adequate and periodic monitoring systems in order to ensure that environmental performance reaches the standards established by the university in its strategic plans.
Policy proposals in the three environmentally relevant areas
Policy proposals mentioned by the interviewees include the limiting of private car use and the improvement of public transport. It is not surprising that this is the most important code, considering mobility is responsible for a high percentage of emissions. The also include mentions to green contracting, infrastructure adaptation and the need to incorporate environmental criteria in new installations and buildings, among others.
Motivation
Among the main motivating factors for environmental policies and actions at the university, interviewees mention the participation in CRUE as one of the main causes of implemented measures. The context for comparison which the CRUE provides acted as a driver. Also, the personal values and sensibility of managers was considered a main motivator, as well as costs. The latter had the highest number of quotations showing that there is a common perception that costs are fundamental in promoting environmental policy, which leads to the necessity to provide users with information on costs of their practices.
Good practices in the organization
Among the good practices mentioned, we find: changes in sources of energy towards cleaner energy, energy efficiency measures and implementation of a system of measurement in every building, the processing of radioactive waste, periodic collection and storage of electronic waste and some advances in green contracting. Nevertheless, interviewees also mention that diesel is still dominant, that waste management practices are defficient when low cost and externalized, limitations to the efficiency of transport y train and that spill‐over of good behavior from home to work does not seem to occur.
LOCAW‐ 265155 – FP7 ENV.2010 – WP3– Deliverable 3.2: PART 1: DOCUMENTS AND INTERVIEWS ANALYSIS
21
4. Conclusions
This report described the results of the analysis carried out at the UDC, which corresponds to the Spanish organization of Higher Education referred in Work‐package 3. Some structural and organizational factors affecting environmental behavior in the field of energy consumption, waste management and University‐related mobility, were described.
Fifteen organizational and policy documents were analyzed taking into account the following criteria: a) EU, national and regional regulations on sustainability and environmental issues; b) Political, economic and social conditions of the organization, as well as demands from relevant groups from the world of the political environmental, society or market in general; c) ways in which these regulations and conditions are implemented in the organization; and d) Norms acting as barriers or drivers for implementing environmental policies.
The result of these analyses showed that organizational commitment with sustainability exists and is explicitly declared, as well as sensibility with environmental issues from staff. Nevertheless, these do not translate in sufficient specific actions related to sustainability at the level of the university, and the ones that exist are not adequately communicated to staff and students. It also showed that university staff tends to insist on awareness‐raising campaigns as ways to promote pro‐environmental behavior, and that external bodies insist on the need to go beyond this and integrate actions and design coordinated plans at inter‐university level. Furthermore, limited budgets constitute a barrier and a constraint to environmental actions and sometimes do not allow an effective implementation of low carbon practices.
The interviews also confirmed the existence of values supporting low‐carbon practices and behaviors such as the value of the university as a model to society. However, environmental objectives are seen as value‐laden objectives that should be set and aimed at on the basis of value considerations, while considering them incompatible with economic objectives, except for the ones referring to reductions in consumption of energy. This implies that when funds are limited, environmental objectives are often reduced or discarded. They also tend to be associated predominantly with infrastructure and technological change and considered to have high costs, especially at the beginning. An important policy track in the future should focus on changing the way environmental objectives are seen.
The analysis of the interviews also allowed us to see that several cultural, political, economic and social factors act as either barriers or drivers to environmental policies and practices. The larger cultural context is perceived as unsupportive to environmental policies and norms and the closer administrative context in society at large is perceived as characterized by a lack of ownership of the public good and also by a rejection of any sort of pressure for compliance. Furthermore, evaluating and monitoring results of environmental policies at the university is complicated by the fact that any form of monitoring is perceived as potentially punitive.
The economic crisis as a recent event is considered a barrier to environmental policy, especially when conceptualized as infrastructure adaptation and radical technological change. Before this particular stage, the structure of the university’s budget, as centralized and non‐autonomous is seen as a barrier. There is a significant difference here between the opinions of administrative and environmental management staffs, as the first tend to see the crisis as a barrier, while the latter see it as a possibility to implement environmentally‐relevant policies with an economic justification.
The lack of competency over certain areas and the problems of collaboration between the university and the local government bodies also constitute barriers to environmental policies. The democratic
LOCAW‐ 265155 – FP7 ENV.2010 – WP3– Deliverable 3.2: PART 1: DOCUMENTS AND INTERVIEWS ANALYSIS
22
university system is seen as both a barrier and a driver, both when considering elections of the government body and when referring to larger participation processes. The documents reflect a positive image of the democratic participation process as a driver for environmental policies, while the interviews reflect a perception of mixed blessings. Furthermore, while the environmental management perceives that the wider, state political prioritizing of environmental objectives have acted as a driver, the administrative management of the university perceives little interest in the environment at a wider political level. This reflects a mixed situation in which the environment is present on the political agenda at almost all levels, but it still remains a sort of declaration of good intentions, while political action does not seen to confirm interest in environmental policies on a larger scale.
A situation of low bottom‐up demand is also a barrier to designing and implementing environmental policies at the university. This makes it dependent on the sensibility and good will of the managers and their top‐down decisions, which is politically less motivating.
In terms of internal organizational factors influencing practices, we were able to detect structural barriers, such as the construction of buildings with aesthetic criteria in mind, which now make infrastructure adaptation more costly and more difficult to justify in times of economic crisis, and the lack of standardized procedures, which are a consequence of the non‐binding nature of agreements and criteria established at the European and national levels. A need for the streamlining and coordination of internal processes is signaled and for improvements of the communication systems within and outside of the university.

LOCAW‐ 265155 – FP7 ENV.2010 – WP3– Deliverable 3.2: PART 1: DOCUMENTS AND INTERVIEWS ANALYSIS
23
2. 2. National Report – Aquatim, Romania
West University of Timisoara, Romania
Coordonator: Corina Ilin
Authors: Alexandra Docea, Adina Dumitru, Ildiko Erdei, Daniela Moza, Florin Lobonț, Lăcrămioara Radu
Supervision: Zoltan Bogathy, Alin Gavreliuc, Florin Alin Sava
1. INTRODUCTION
In Romania, organizations are subjected to the national laws which, in their turn, are in principle designed in accordance with the European Union’s policies and laws. Consequently, the EU regulations regarding the environment can only indirectly influence the organisations’ activities in Romania that are placed under the immediate impact of the national laws. Nevertheless, many national laws, including laws concerning the environment, refer directly to the European norms, and enforce their application. When organisations sign non‐refundable financing—from European funds—agreements, they commit themselves to observing the EU regulations: in such cases, they subject themselves directly to the European legislation.
Up to the present Romania has adopted a number of policies and laws regarding climate change; they concern the reductions of greenhouse emissions amount and the adaptation to the effects of environmental changes, according to the UN Framework Convention on Climate Change, the Kyoto Protocol, and the European Union policy.
Within the framework of the National Reform Programme adopted by the Romanian Government in April 2011, a National Strategy for Climate Change 2011‐2020 was included; this document was correlated with the provisions for actions from the law package called „Energy—climatic change”, and the „Transition guide, until 2050, to a low carbon emission economy” as well as with the European legislation concerning adaptation to the effects of climate change. With respect to the issue of GHG (greenhouse gases) emissions, Romania committed itself, under the provisions of the Kyoto protocol, to reducing the country’s GHG emissions by 8% until 2012, compared to 1989. Between 1989 and 2009, the overall GHG emissions decreased by 54.17%, and the net emissions by 62.81%. Consequently, Romania has polluted less than it anticipated when it subscribed to the Kyoto Protocol. Thus no legal pressures aiming to impose, on various organizations, the reducing of GHG emissions, were necessary.
Short profile of Aquatim
As a private organisation that provides public utility services, Aquatim S.A. Timişoara is subordinated to the Local Councils (Timişoara, Jimbolia and Deta) and Timiş District Council. The regulating authority is the National Regulatory Authority for Community and Public Utilities Services – A.N.R.S.C., and the law that regulates the public utilities and community services is Law no. 51/2006. The water supply and sewerage services law (Law no. 241 from 22/06/2006) includes, among its stipulations, the following: ensuring the service quality in line with the EU regulations; improving the environmental quality by employing rationally the natural water resources and by adequate wastewater cleaning, according to the environmental law provisions and the EU directives; diminishing the water loss and the energy consumption for water use in the water supply and sewerage systems.
LOCAW‐ 265155 – FP7 ENV.2010 – WP3– Deliverable 3.2: PART 1: DOCUMENTS AND INTERVIEWS ANALYSIS
24
The Political Context
The local public administration authorities have, in relation to the operators, the right and the obligation to monitor and control, among others, the service’s impact on the environment and public health. The ascertaining of breaches of the water supply and sewerage services law and the enforcement of penalties fall within the prerogatives of people enabled to make such decisions by the Minister of Environment and Water Management; the Minister of Administration and Interior; the president of A.N.R.S.C.; presidents of district councils; mayors or their representatives. As a consequence, it is important to take into account the analysis of the possible political influences upon the Aquatim activity, bearing in mind that the company is subordinated to authorities whose leadership and members (affiliated politically) can be politically biased and, besides, can be replaced every 4 years.
Characteristics of the market
With respect to the production and distribution technology, the organisations that provide public utility services are considered natural monopolies, for the capital costs of such enterprises are high and the existence of competing or parallel systems would be excessively expensive and wasteful. The monopoly over the services domain is a market situation characteristic to some public utilities services which, within a certain territory, can only be provided by a unique operator.
Consequently, Aquatim SA is not subjected to the pressures of a competitive market but is subjected to legal constraints regarding its relation with its customers. Even if the customers are dissatisfied with the quality of the services provided, or with their relation with the company, they cannot sanction it by acquiring services from a competing company; yet, they can complain to the competent authorities who are entitled to investigate and penalize the regulations breaches found.
The tariffs for the services provided by Aquatim are always first approved by the National Regulatory Authority for Community and Public Utilities Services – A.N.R.S.C, and next by the local public administration authority. Finally, the unique tariffing system is subjected to the approval through the decision of the General Assembly of the Associates of the Intercommunity Development Association.1
The financing of Aquatim activity is made both from its own resources and by obtaining non‐refundable funds. The financing sources of the big investment projects are mainly non‐refundable funds obtained from the EU, state budget, and local and commune budgets, together with the sums allocated by the company to investments. For example, Aquatim currently runs the second big investment project of €118.87 million non‐refundable funds, designed to expanding and modernising the water supply and sewerage infrastructure of the Timiş district. The local authorities’ contribution is 1.73%; Aquatim’s – 13.04%; state budget’s – 11.30%; whereas the European Union covers—from the Cohesion Fund—73.93%. This money will be used for the expansion and rehabilitation of 200km of sewerage and 100km water networks, and to the building of 7 wastewater cleaning stations and 3 drinking water treatment stations in 12 localities of the district.2
Social aspects
According to Law no. 51/2006, the general interest of local communities has priority in the organising, functioning and development of public utilities services. This law’s provisions aim to satisfy as much as possible the requirements of users, the protection of their interests, the
1 This information can be found on the Aquatim site (http://www.aquatim.ro/ro/97/tarife-si-servicii.htm) 2 This information can be found in the AquaŞtiri newsletter, published in January 2012
LOCAW‐ 265155 – FP7 ENV.2010 – WP3– Deliverable 3.2: PART 1: DOCUMENTS AND INTERVIEWS ANALYSIS
25
strengthening of the social‐economic cohesion of local communities, as well as the sustainable development of the territorial‐administrative units.
As operator of water supply and sewerage services, Aquatim assumes two major responsibilities: consumer’s health and comfort, and environmental safety and water resources protection. Given that Aquatim SA provides water and sewerage services in throughout the Timiş district—both in rural and urban localities—it is important to highlight the differences between the needs and requirements of the rural and urban customers.
The customers from urban localities need the Aquatim services and know their rights, given by the law, and consequently their pressure could be significant if they are not satisfied with the company’s services and their relation with it. Besides complaints, which they can submit to the competent authorities, the customers from rural areas have the local press on their side, which resulted in the company decision to make its relation with the customers one of its priorities. The company’s interface with its customers is characterised by transparency and seriousness. There are multiple means of communication with the customers, which work very well. The activity of Aquatim communication and PR department is highly visible. Besides the constant updating of its website with information of interests for its customers, Aquatim has a monthly newsletter and annual public reports designed to permanently inform the customers and other interested people about the company’s activities. Moreover, Aquatim organizes various events for the public and consumers, such as those celebrating the world water, or environment day, or open gates day at the water treatment station, etc.
Yet the customers from rural areas are very different from those from urban areas. On the one hand, they don’t have access to all means of information, and are not interested or convinced that they need the Aquatim services, on the other. An important social factor involved in the expanding of the water and sewerage networks in the rural areas is the general outlook of their inhabitants, who don’t see the building of such networks necessary, since they have (and always had) wheels and composting toilets within their households. Yet this factor would not be that influential if the local authorities, namely mayors and local council’s members, had different outlooks. They authorize any Aquatim projects within the territory under their administration and, consequently, influence the rhythm and level of the company’s activity in the district.
These factors can be relevant to the objectives of our study, for they highlight the need for various strategies the company has to adopt. If with respect to the urban areas its image is paramount to the decision makers, in the rural areas the most important factor is the relation with the local authorities.
Within the analysis of the way in which the regulations and conditions described at points a) and b) are understood and implemented in Aquatim we need to take into account the fact that the public utilities services belong to the services of general interest domain, and have the following specific features: a) are economic and social in nature; b) meet the requirements and needs of public utility and interest; c) are technical‐edilitary in nature; d) are permanent and function continuously; e) their function status can have monopolistic features; f) presuppose the existence of an adequate technical‐edilitary infrastructure; g) they cover a local area, namely rural, urban, and district; h) are set up, organized and coordinated by the local public administration authorities; i) are organized according to economical and efficiency principles; j) can be provided by operators that are organized and function either according to public law norms, or according to private law norms; k) are provided on the basis of the customer pays principle; l) the operation and investments costs are retrieved through prices, tariffs or special taxes.
The motivational factors represent internal motives that determine the organization to follow the application of the environmental regarding the environment in belief that thus its chances to maintain its position on the market will increase. The drivers are external factors that have the
LOCAW‐ 265155 – FP7 ENV.2010 – WP3– Deliverable 3.2: PART 1: DOCUMENTS AND INTERVIEWS ANALYSIS
26
potential to compel organizations to take into account and implement changes regarding the environment which otherwise they would have disregarded. The organizational norms are implicit rules of conduct that define the appropriate or the inappropriate actions of the persons within the organization in contexts that are not strictly regulated.
2. DOCUMENT ANALYSIS
2. 1. Method
To identify structural and organizational factors influencing sustainability‐related everyday practices within Aquatim, we made an analysis of relevant documents which contain references to environmental regulations, political, economic and social conditions, strategic plans and everyday operations of the organizations. They were introduced as Hermeneutic Units in the program ATLAS.ti.
The documents analyzed are the next ones:
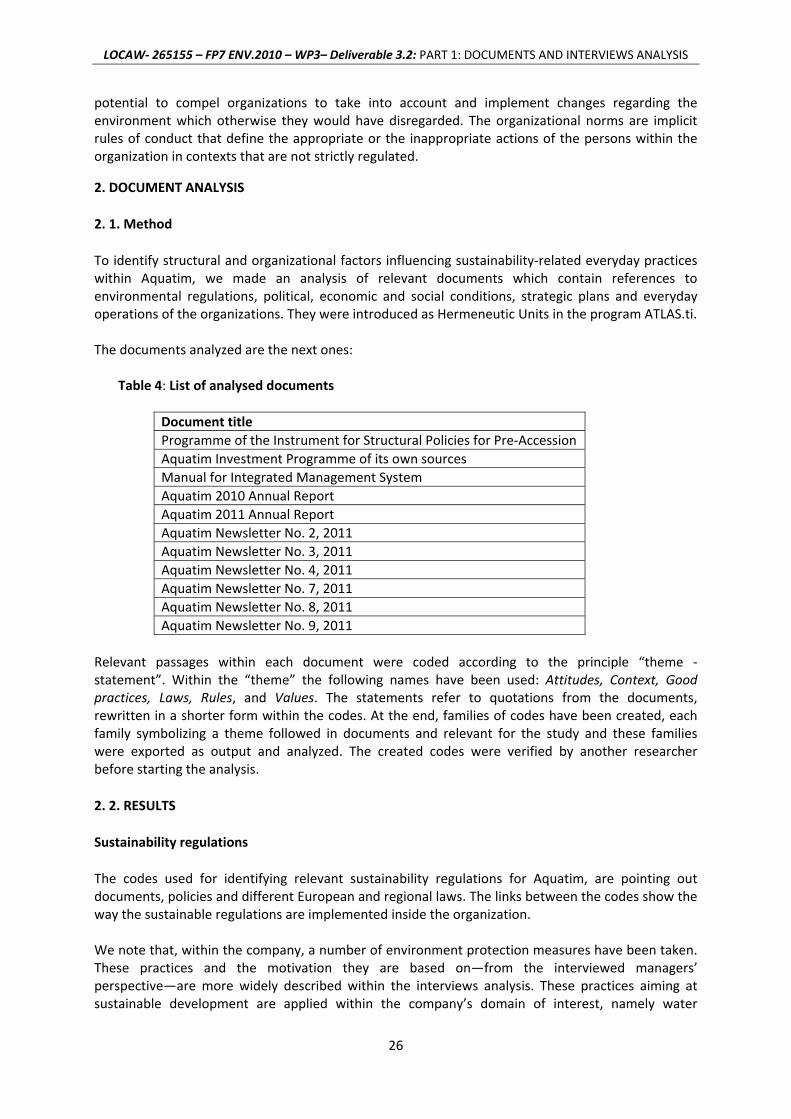
Table 4: List of analysed documents
Document title Programme of the Instrument for Structural Policies for Pre‐Accession Aquatim Investment Programme of its own sources Manual for Integrated Management System Aquatim 2010 Annual Report Aquatim 2011 Annual Report Aquatim Newsletter No. 2, 2011 Aquatim Newsletter No. 3, 2011 Aquatim Newsletter No. 4, 2011 Aquatim Newsletter No. 7, 2011 Aquatim Newsletter No. 8, 2011 Aquatim Newsletter No. 9, 2011
Relevant passages within each document were coded according to the principle “theme ‐ statement”. Within the “theme” the following names have been used: Attitudes, Context, Good practices, Laws, Rules, and Values. The statements refer to quotations from the documents, rewritten in a shorter form within the codes. At the end, families of codes have been created, each family symbolizing a theme followed in documents and relevant for the study and these families were exported as output and analyzed. The created codes were verified by another researcher before starting the analysis.
2. 2. RESULTS
Sustainability regulations
The codes used for identifying relevant sustainability regulations for Aquatim, are pointing out documents, policies and different European and regional laws. The links between the codes show the way the sustainable regulations are implemented inside the organization. We note that, within the company, a number of environment protection measures have been taken. These practices and the motivation they are based on—from the interviewed managers’ perspective—are more widely described within the interviews analysis. These practices aiming at sustainable development are applied within the company’s domain of interest, namely water
LOCAW‐ 265155 – FP7 ENV.2010 – WP3– Deliverable 3.2: PART 1: DOCUMENTS AND INTERVIEWS ANALYSIS
27
management, whereas the GHG is not considered a priority. However, at middle management level, the sustainable development is seen as an organizational value that led to visible results (for example, the 6th place awarded to Aquatim in the Green Business Index). The rules that result from documents are linked to the policy derived from the Integrated Management System (IMS). We note that this policy is implemented at all organizational levels: all employees are trained to comply with this policy which has been outlined by the top management. By analysing the manual for IMS we revealed most important documents and laws for IMS: European Standard ISO 9001:2008, European Standard ISO 14001:2005, Occupational Health and Safety Advisory Services (OHSAS) 18001:2008. Also, IMS is based on Romanian Environmental protection and OHS laws. We have analysed a document regarding the implication of the Instrument for Structural Policies for Pre‐Accession (ISPA) in Timisoara and the organization Aquatim. The objectives of ISPA for Timisoara are improving waste water collection system, sludge treatment, and treatment of waste water. Political, economic and social conditions
The political, economic and social conditions are described in document’s analysis in terms of technological development of the organization, awards won by company, founds investments, laws and rules. Aquatim has made much effort in expanding and improving the water system and environmental infrastructure, due to funds received from the European Union. The code with most connections states that “in 2010 were made a number of investment works to upgrade water system”, and his connections explain the domains in which the investments were made: rehabilitation of water pipeline, rehabilitation of sewer connections, removal and recovery system for wash water to water treatment station Bega. If we look at the awards won by the organization, we extracted from the company’s newsletter, information about Aquatim ranking top 6 in Green Business Index. The related code has connections which offer more details about this award: Aquatim has a great score for environmental impact, for green acquisitions, for waste management and for ensuring sustainable development and reducing environmental impact. In this area we found rehabilitations relevant for the company’s environmental practices, coded as “laws” or “rules”. Much rehabilitation occurred due to ISPA Programme, and the company had to improve processes like the treatment of waste water, the waste water collection system and sludge treatment. Also we can see that the savings made inside the ISPA project made possible auctions for new projects for improving the sewerage in Timisoara. The ways in which the regulations and conditions described under a) and b) are understood and implemented in the organization
As we analyzed the documents, we have created codes representing information about the influence of sustainability regulations and political, economic and social conditions on everyday practices at work. We saw that the codes can be grouped in three major themes: the company’s Integrated management system, in terms of rules, attitudes and values, Organization‘s vision, mission, and values, in terms of practices and values, and Funds investments. About the Integrated management system, we see that the values of this management are to improve environmental protection, to give importance to environmental activities and services, to improve the effectiveness of processes, and to improve the competitiveness of services. We can see that all staff is involved in implementing the IMS and the Occupational Quality, Environment, Health and Safety policy, and for establishment of rules for this policy are taken into account the policy adopted by the organization, the law and other requirements, the results of environmental analysis, the results of hazard identification, risk assessment and control of OHS, points of views of
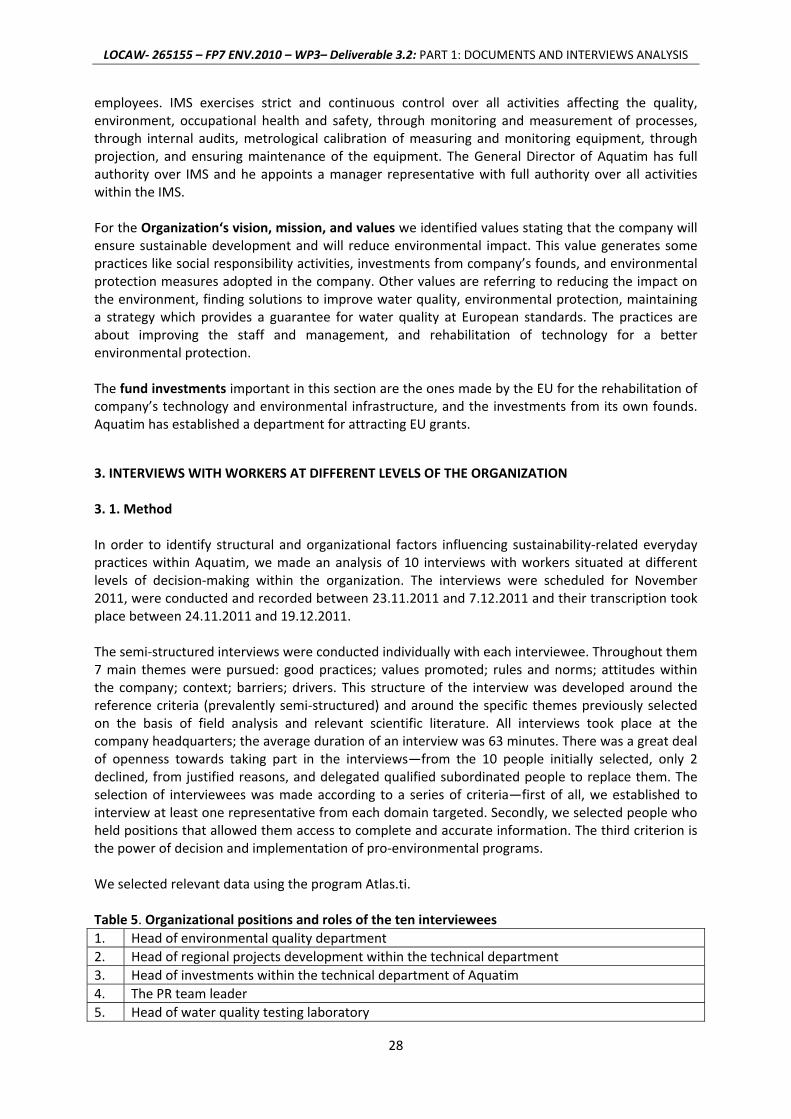
LOCAW‐ 265155 – FP7 ENV.2010 – WP3– Deliverable 3.2: PART 1: DOCUMENTS AND INTERVIEWS ANALYSIS
28
employees. IMS exercises strict and continuous control over all activities affecting the quality, environment, occupational health and safety, through monitoring and measurement of processes, through internal audits, metrological calibration of measuring and monitoring equipment, through projection, and ensuring maintenance of the equipment. The General Director of Aquatim has full authority over IMS and he appoints a manager representative with full authority over all activities within the IMS. For the Organization‘s vision, mission, and values we identified values stating that the company will ensure sustainable development and will reduce environmental impact. This value generates some practices like social responsibility activities, investments from company’s founds, and environmental protection measures adopted in the company. Other values are referring to reducing the impact on the environment, finding solutions to improve water quality, environmental protection, maintaining a strategy which provides a guarantee for water quality at European standards. The practices are about improving the staff and management, and rehabilitation of technology for a better environmental protection. The fund investments important in this section are the ones made by the EU for the rehabilitation of company’s technology and environmental infrastructure, and the investments from its own founds. Aquatim has established a department for attracting EU grants.
3. INTERVIEWS WITH WORKERS AT DIFFERENT LEVELS OF THE ORGANIZATION 3. 1. Method In order to identify structural and organizational factors influencing sustainability‐related everyday practices within Aquatim, we made an analysis of 10 interviews with workers situated at different levels of decision‐making within the organization. The interviews were scheduled for November 2011, were conducted and recorded between 23.11.2011 and 7.12.2011 and their transcription took place between 24.11.2011 and 19.12.2011. The semi‐structured interviews were conducted individually with each interviewee. Throughout them 7 main themes were pursued: good practices; values promoted; rules and norms; attitudes within the company; context; barriers; drivers. This structure of the interview was developed around the reference criteria (prevalently semi‐structured) and around the specific themes previously selected on the basis of field analysis and relevant scientific literature. All interviews took place at the company headquarters; the average duration of an interview was 63 minutes. There was a great deal of openness towards taking part in the interviews—from the 10 people initially selected, only 2 declined, from justified reasons, and delegated qualified subordinated people to replace them. The selection of interviewees was made according to a series of criteria—first of all, we established to interview at least one representative from each domain targeted. Secondly, we selected people who held positions that allowed them access to complete and accurate information. The third criterion is the power of decision and implementation of pro‐environmental programs. We selected relevant data using the program Atlas.ti. Table 5. Organizational positions and roles of the ten interviewees 1. Head of environmental quality department 2. Head of regional projects development within the technical department 3. Head of investments within the technical department of Aquatim 4. The PR team leader 5. Head of water quality testing laboratory
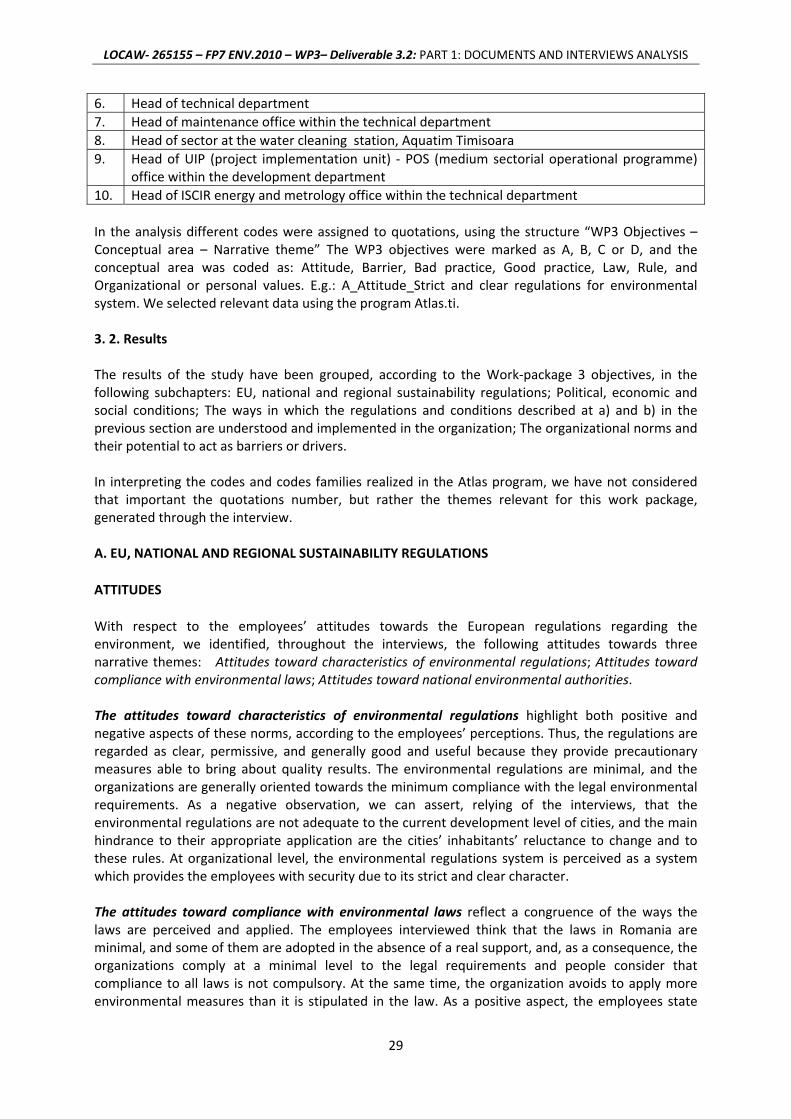
LOCAW‐ 265155 – FP7 ENV.2010 – WP3– Deliverable 3.2: PART 1: DOCUMENTS AND INTERVIEWS ANALYSIS
29
6. Head of technical department 7. Head of maintenance office within the technical department 8. Head of sector at the water cleaning station, Aquatim Timisoara 9. Head of UIP (project implementation unit) ‐ POS (medium sectorial operational programme)
office within the development department 10. Head of ISCIR energy and metrology office within the technical department In the analysis different codes were assigned to quotations, using the structure “WP3 Objectives – Conceptual area – Narrative theme” The WP3 objectives were marked as A, B, C or D, and the conceptual area was coded as: Attitude, Barrier, Bad practice, Good practice, Law, Rule, and Organizational or personal values. E.g.: A_Attitude_Strict and clear regulations for environmental system. We selected relevant data using the program Atlas.ti. 3. 2. Results The results of the study have been grouped, according to the Work‐package 3 objectives, in the following subchapters: EU, national and regional sustainability regulations; Political, economic and social conditions; The ways in which the regulations and conditions described at a) and b) in the previous section are understood and implemented in the organization; The organizational norms and their potential to act as barriers or drivers. In interpreting the codes and codes families realized in the Atlas program, we have not considered that important the quotations number, but rather the themes relevant for this work package, generated through the interview. A. EU, NATIONAL AND REGIONAL SUSTAINABILITY REGULATIONS
ATTITUDES
With respect to the employees’ attitudes towards the European regulations regarding the environment, we identified, throughout the interviews, the following attitudes towards three narrative themes: Attitudes toward characteristics of environmental regulations; Attitudes toward compliance with environmental laws; Attitudes toward national environmental authorities. The attitudes toward characteristics of environmental regulations highlight both positive and negative aspects of these norms, according to the employees’ perceptions. Thus, the regulations are regarded as clear, permissive, and generally good and useful because they provide precautionary measures able to bring about quality results. The environmental regulations are minimal, and the organizations are generally oriented towards the minimum compliance with the legal environmental requirements. As a negative observation, we can assert, relying of the interviews, that the environmental regulations are not adequate to the current development level of cities, and the main hindrance to their appropriate application are the cities’ inhabitants’ reluctance to change and to these rules. At organizational level, the environmental regulations system is perceived as a system which provides the employees with security due to its strict and clear character. The attitudes toward compliance with environmental laws reflect a congruence of the ways the laws are perceived and applied. The employees interviewed think that the laws in Romania are minimal, and some of them are adopted in the absence of a real support, and, as a consequence, the organizations comply at a minimal level to the legal requirements and people consider that compliance to all laws is not compulsory. At the same time, the organization avoids to apply more environmental measures than it is stipulated in the law. As a positive aspect, the employees state
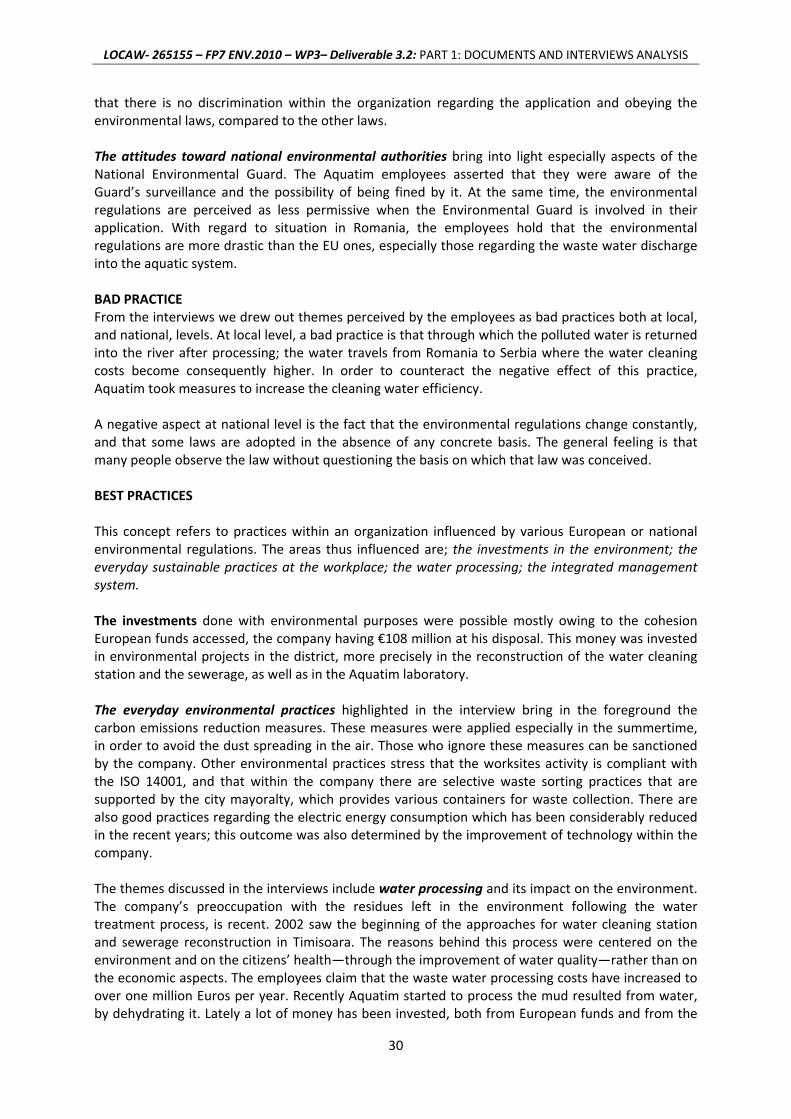
LOCAW‐ 265155 – FP7 ENV.2010 – WP3– Deliverable 3.2: PART 1: DOCUMENTS AND INTERVIEWS ANALYSIS
30
that there is no discrimination within the organization regarding the application and obeying the environmental laws, compared to the other laws. The attitudes toward national environmental authorities bring into light especially aspects of the National Environmental Guard. The Aquatim employees asserted that they were aware of the Guard’s surveillance and the possibility of being fined by it. At the same time, the environmental regulations are perceived as less permissive when the Environmental Guard is involved in their application. With regard to situation in Romania, the employees hold that the environmental regulations are more drastic than the EU ones, especially those regarding the waste water discharge into the aquatic system. BAD PRACTICE From the interviews we drew out themes perceived by the employees as bad practices both at local, and national, levels. At local level, a bad practice is that through which the polluted water is returned into the river after processing; the water travels from Romania to Serbia where the water cleaning costs become consequently higher. In order to counteract the negative effect of this practice, Aquatim took measures to increase the cleaning water efficiency. A negative aspect at national level is the fact that the environmental regulations change constantly, and that some laws are adopted in the absence of any concrete basis. The general feeling is that many people observe the law without questioning the basis on which that law was conceived. BEST PRACTICES This concept refers to practices within an organization influenced by various European or national environmental regulations. The areas thus influenced are; the investments in the environment; the everyday sustainable practices at the workplace; the water processing; the integrated management system. The investments done with environmental purposes were possible mostly owing to the cohesion European funds accessed, the company having €108 million at his disposal. This money was invested in environmental projects in the district, more precisely in the reconstruction of the water cleaning station and the sewerage, as well as in the Aquatim laboratory. The everyday environmental practices highlighted in the interview bring in the foreground the carbon emissions reduction measures. These measures were applied especially in the summertime, in order to avoid the dust spreading in the air. Those who ignore these measures can be sanctioned by the company. Other environmental practices stress that the worksites activity is compliant with the ISO 14001, and that within the company there are selective waste sorting practices that are supported by the city mayoralty, which provides various containers for waste collection. There are also good practices regarding the electric energy consumption which has been considerably reduced in the recent years; this outcome was also determined by the improvement of technology within the company. The themes discussed in the interviews include water processing and its impact on the environment. The company’s preoccupation with the residues left in the environment following the water treatment process, is recent. 2002 saw the beginning of the approaches for water cleaning station and sewerage reconstruction in Timisoara. The reasons behind this process were centered on the environment and on the citizens’ health—through the improvement of water quality—rather than on the economic aspects. The employees claim that the waste water processing costs have increased to over one million Euros per year. Recently Aquatim started to process the mud resulted from water, by dehydrating it. Lately a lot of money has been invested, both from European funds and from the
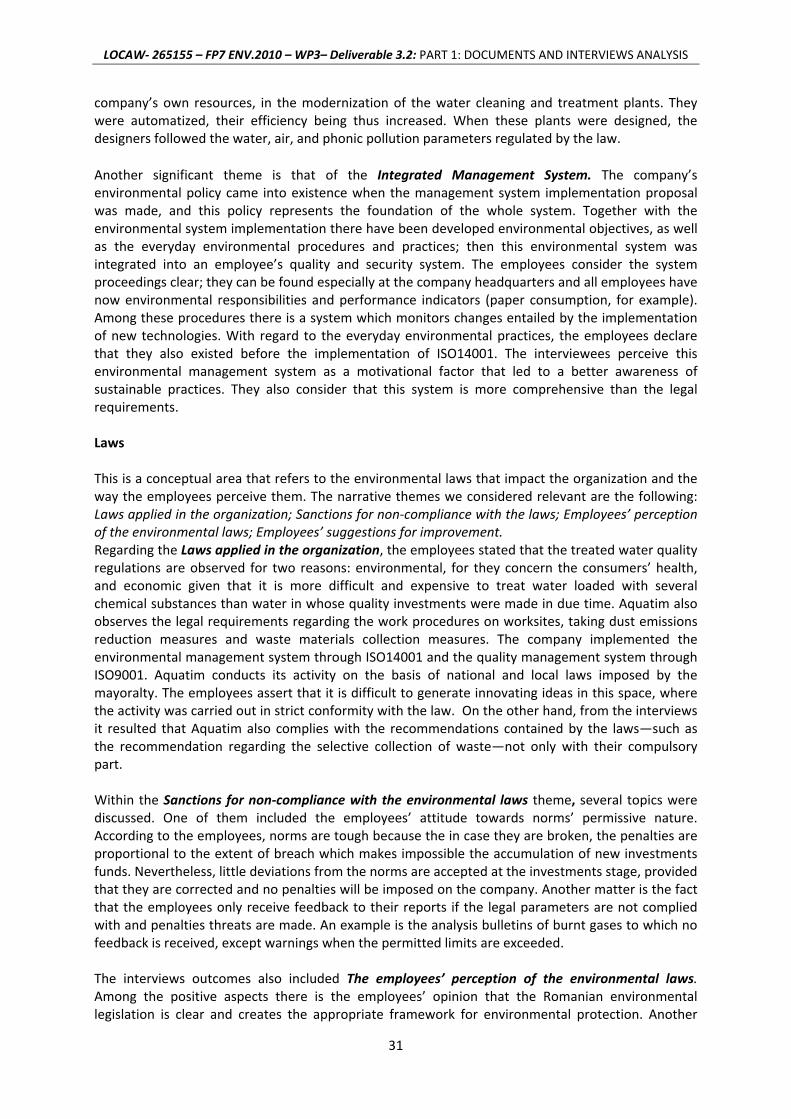
LOCAW‐ 265155 – FP7 ENV.2010 – WP3– Deliverable 3.2: PART 1: DOCUMENTS AND INTERVIEWS ANALYSIS
31
company’s own resources, in the modernization of the water cleaning and treatment plants. They were automatized, their efficiency being thus increased. When these plants were designed, the designers followed the water, air, and phonic pollution parameters regulated by the law.
Another significant theme is that of the Integrated Management System. The company’s environmental policy came into existence when the management system implementation proposal was made, and this policy represents the foundation of the whole system. Together with the environmental system implementation there have been developed environmental objectives, as well as the everyday environmental procedures and practices; then this environmental system was integrated into an employee’s quality and security system. The employees consider the system proceedings clear; they can be found especially at the company headquarters and all employees have now environmental responsibilities and performance indicators (paper consumption, for example). Among these procedures there is a system which monitors changes entailed by the implementation of new technologies. With regard to the everyday environmental practices, the employees declare that they also existed before the implementation of ISO14001. The interviewees perceive this environmental management system as a motivational factor that led to a better awareness of sustainable practices. They also consider that this system is more comprehensive than the legal requirements. Laws This is a conceptual area that refers to the environmental laws that impact the organization and the way the employees perceive them. The narrative themes we considered relevant are the following: Laws applied in the organization; Sanctions for non‐compliance with the laws; Employees’ perception of the environmental laws; Employees’ suggestions for improvement. Regarding the Laws applied in the organization, the employees stated that the treated water quality regulations are observed for two reasons: environmental, for they concern the consumers’ health, and economic given that it is more difficult and expensive to treat water loaded with several chemical substances than water in whose quality investments were made in due time. Aquatim also observes the legal requirements regarding the work procedures on worksites, taking dust emissions reduction measures and waste materials collection measures. The company implemented the environmental management system through ISO14001 and the quality management system through ISO9001. Aquatim conducts its activity on the basis of national and local laws imposed by the mayoralty. The employees assert that it is difficult to generate innovating ideas in this space, where the activity was carried out in strict conformity with the law. On the other hand, from the interviews it resulted that Aquatim also complies with the recommendations contained by the laws—such as the recommendation regarding the selective collection of waste—not only with their compulsory part. Within the Sanctions for non‐compliance with the environmental laws theme, several topics were discussed. One of them included the employees’ attitude towards norms’ permissive nature. According to the employees, norms are tough because the in case they are broken, the penalties are proportional to the extent of breach which makes impossible the accumulation of new investments funds. Nevertheless, little deviations from the norms are accepted at the investments stage, provided that they are corrected and no penalties will be imposed on the company. Another matter is the fact that the employees only receive feedback to their reports if the legal parameters are not complied with and penalties threats are made. An example is the analysis bulletins of burnt gases to which no feedback is received, except warnings when the permitted limits are exceeded. The interviews outcomes also included The employees’ perception of the environmental laws. Among the positive aspects there is the employees’ opinion that the Romanian environmental legislation is clear and creates the appropriate framework for environmental protection. Another
LOCAW‐ 265155 – FP7 ENV.2010 – WP3– Deliverable 3.2: PART 1: DOCUMENTS AND INTERVIEWS ANALYSIS
32
positive thing is that the interviewees saw the reaching of the ISO 14001 standard as a natural consequence of the evolution of the company. On the other hand, many employees share the opinion that the ISO 14001 was imposed and that significant efforts were made to implement it whereas the employees were not particularly open for change. Also on the negative side, the employees held that there are differences between the Romanian and the EU legislations, and that the new requirements entail economic difficulties because the old technology has to be replaced or kept within the legal parameters. The employees also offered a few of Suggestions for improvement of the environmental laws. They include the harmonization between the European and the Romanian laws. The employees’ feeling is that of then the law is not observed because of the confusion created by the compulsory and optional legal requirements; if such a distinction would disappear, they think people would obey the law to a greater extent. Rules This conceptual area refers to the Aquatim rules regarding the environmental practices determined by the relation with the local and national authorities. The interviewees mentioned as relevant authorities the Environmental Guard, the city mayoralty, and the economic agents. Thus, we were told that there are annual meetings with the economic agents having as themes pollution prevention and the discharge of pollutants above permitted limits, into the sewerage system. The Environmental Guard checks the environmental targets of the company twice a year and its visits to Aquatim are unannounced. At the same time, the Guard checks the company’s authorization terms and conditions. An environmental authorization is valid for 10 years. The employees consider that the Aquatim policy harmonizes with the national and local policies. Values From this conceptual area we refer to the organizational and personal values that developed following the implementation of the environmental regulations in the organization. As far as the organizational rules are concerned, we noticed that this implementation facilitated communication on environmental subjects within the organization; for instance, the Environmental Quality department transmits via intranet various communiqués concerning the environment. Moreover, every team leader has in their team a person in charge with environmental matters, who informs the other members about the environmental issues. In the employees’ opinion, the company’s environmental policy has a stronger impact on their everyday work practices than the authorities. As regards the personal values, they are open to discussing the environmental issues and find no difficulty in coming up with improvement ideas about the environmental practices. A negative aspect is the older employees’ reluctance to the organizational changes entailed by environmental regulations, compared to the younger people. B. THE POLITICAL, ECONOMICAL AND SOCIAL CONTEXT Market characteristics
Aquatim is the only regional operator of water supply and sewerage services and at present provides these services in the city of Timisoara and other 64 localities of the district—8 towns, 23 communes and 33 villages. In the interviews the employees asserted that if the plans of regional administrative division of Romania are put into practice, Aquatim might have to compete with similar companies from Arad and Hunedoara. In such an event the threat is felt as coming from the local authorities who can choose other suppliers if Aquatim is not efficient. Yet, the competition is also perceived as a stimulating factor for the company’s services quality. The general public is informed through the media about the good or less so practices at Aquatim. At times the press highlighted inefficient
LOCAW‐ 265155 – FP7 ENV.2010 – WP3– Deliverable 3.2: PART 1: DOCUMENTS AND INTERVIEWS ANALYSIS
33
aspects, such as the lack, in some areas, of waste water treatment stations. The interviewees declare that through their practices they learned that the technological development is the main contributor to the GHGs reduction. This can be a warning sign for other companies that still use old technologies.
European, national and regional laws with impact on the organization The main narrative themes identified within this conceptual area are the following: Attitudes towards the European and national legislation; The relationship with the local authorities; Attitudes towards the application of the laws in the organization. Attitudes towards the European and national legislation The employees interviewed perceive the national legislative framework as restrictive, due to the lack of harmony between laws belonging to different domains. For example, the civil engineering laws are not harmonized with the environmental laws, which make the implementation of some projects difficult.3 This lack of harmonization also makes the meeting of EU environmental legislation difficult. The employees think that congruence between the organization and the authorities is also necessary. The interviews also discuss Law 544 concerning the public interest information. The way in which this law is implemented suggests that there is a good communication between the company and its customers. We learned that the PR department makes annual reports about the general activity of the company. The report is made public and contains the main indicators specific to Aquatim. Members of general public can request public interest information from the company; this information is centralized and reported to the prefecture. Relationship with local authorities The city mayoralty has a permanent impact on the company’s activity through the decision it takes. For example, it decided that the beneficiary of a civil engineering project, not the building company, will be fined if waste materials are left on the building site. The employees do not agree with all decisions made by the mayoralty but the company’s relations with this institution are generally good. The organization also receives support from the district council. Attitudes towards the application of the laws in the organization The interviewees assert that at present the organization limits itself to legal procedures and hardly takes initiatives which are not stipulated in the law. This attitude has an economic reason, for the environmental investments are thus limited to the legal requirements, as well as a behavioral reason, for most employees are not open to innovative initiatives. In their opinion, the organization and the authorities should share a common view, and consequently they resort to the legal requirements as reference point. This means there is a certain rigidity of perspective, which generally confines itself to the law in force. Yet, the company’s policy presupposes the development of objectives that don’t confine themselves to the legal provisions.
3 More precisely, at some stage the realization of a project requires a feasibility study. This study includes technical questions about the effective realization details (for example, “What is the technical solution for processing the mud?”) which pertain to the technical domain, but the environmental specialists do not know the civil engineering legislation. The technical project is a stage consequent to the feasibility study, but its details are necessary for the realization of the latter. The employees offer, as solutions, the exclusion of technical questions from the feasibility study or the utilization of a technical project in order to obtain financing.
LOCAW‐ 265155 – FP7 ENV.2010 – WP3– Deliverable 3.2: PART 1: DOCUMENTS AND INTERVIEWS ANALYSIS
34
Social aspects The main narrative themes identified within this conceptual area are the following: The employees’ behavior; the relations between the company and the public; The Romanians and the environmental practices. The employees’ behavior Another element worth taking into account is the interviewees’ opinion about the employees’ need for environmental rules when it comes to environmental actions, for only when it is imposed an action can be adopted in the employees’ behaviour, being subsequently repeated voluntarily. The rules designed with an environmental purpose (e.g. the selective collection of waste) are perceived as minimal and easy to understand by all. Nevertheless, there is a difference in compliance with the environmental regulations according to the employees’ age, the older ones being more conservative and reluctant, whereas the younger ones have already had assimilated these rules into their education. The easy way in which the young people adapt to the new environmental rules can also be explained by the fact that the new employees are more obedient to organizational rules. The employees also say that in general it is difficult for people to obey the laws partly because they are not harmonized and because some law leave room for interpretation as they are accompanied by recommendations, not by compulsory provisions. The relationship between the company and the public There are two approaches of this conceptual theme: the interviewees’ perception of the general public’s attitude towards the company, and the employees’ perception of the company’s attitude towards the public. As for the latter, they find it difficult to identify the company’s environmental practices, which are relatively little mentioned in the press, which focuses mainly on the negative aspects of the company. The relation with the public is peaceful, for the public seldom reacts to mistakes, and the complaints pressures regarding the environmental practices are rare. When they happen, they come from people who spend most of their time at home. They notice and report to the mayoralty breaches of environmental rules on building sites. As far as the company is concerned, the employees assert that the the information is also transmitted to the inhabitants of small towns and rural areas, but the communication of environmental practices is slow and difficult; consequently, more efforts to increase people’s awareness of these practices (e.g. the discharge of waste water) have to be made. In order to improve communication, efforts have been made to improve the communication skills of Aquatim representatives in the rural areas. The Romanians and the environmental practices With regard to waste management, the employees’ opinion is that Romanians respond positively to the waste selective collection initiatives, and the move to this type of collection was not difficult in companies. But these practices don’t only take place at work, but at home as well. The adaptation to their ways of conduct is more difficult in the rural areas where no fully functional waste management system is in place. With regard to the general public’s degree of awareness, there is a widespread opinion that most Romanians are focused on obtaining short‐term benefits from their activities; consequently, more effort has also to be invested in the increase of the awareness regarding the long‐term effects of practices harmful to the environment. The interviews show that the younger generations are more open towards these practices than the older ones. Furthermore, the employees proved to engage more often in pro‐environmental activities if the benefits of these activities have been previously explained to them and the activities were not imposed. The people living in the rural areas manifest a low degree of awareness of the environmental impact of various day‐to‐day activities. These difficulties become particularly evident when it comes to the waste water management. In general, companies in Romania do not have strong environmental practices or policies aiming at raising awareness of sustainable practices. Moreover, within companies the strictly economical motivation
LOCAW‐ 265155 – FP7 ENV.2010 – WP3– Deliverable 3.2: PART 1: DOCUMENTS AND INTERVIEWS ANALYSIS
35
has priority when investments concerning the environment are made, whereas the environmental motivation per se is at best of secondary importance. Relationship between the organization and other institutions The main themes identified within this conceptual area are Attitudes regarding other institutions and Practices involving other institutions. Attitudes regarding other institutions On the positive side, the company receives support from the mayoralty and the local council. The employees deem that the organization is stronger as long as it collaborates with the mayoralty and more eligible for funding on the market. Yet the relationship with the rural areas mayoralties is better than that with the mayoralty of Timisoara. There are also collaborative relationships with institutions from abroad, such as Munich mayoralty, through the Aquademica Foundation. As a negative aspect the interviewees referred to the waste collecting company’s ignorance, which does not select the collected materials, even if its customers sort them properly. Practices involving other institutions The practices based on the collaboration with other institutions (RETIM, AirClean) concern the waste management (RETIM, AirClean), waste water management (the mayoralty of Timisoara) whereas with regard to the water cleaning and testing practices the company collaborates with Apele Române (Romanian Waters), The Environment Agency, and The Environmental Guard. When there is a need for an analysis of the air polluting substances, the company requests assistance from the Environmental Protection Agency, which has an air analysis laboratory. The company’s activity is monitored by the Romanian Accreditation Association (RENAIR) and the Ministry of Health.
C. THE WAYS IN WHICH THE REGULATIONS AND CONDITIONS DESCRIBED UNDER A) AND B) ARE UNDERSTOOD AND IMPLEMENTED IN THE ORGANIZATION
In the interviews analysis we started from those thematic contents which referred to elements of Aquatim’s organizational culture, because this represents the filter through which all of the organizational inputs pass.
Regarding the culture of the organization we studied, during the interviews, the following narrative themes were identified, themes which may be conceptually circumscribed by the attitudinal area: Attitudes reflecting the organization’s commitment towards a sustainable environment; Attitudes reflecting norms, beliefs and values of the organization; Attitudes regarding the organization’s future environmental performance; Attitudes regarding the factors contributing towards low GHG emissions; Attitudes on market characteristics; Attitudes reflecting the organization’s lack of concern for environmental issues.
Attitudes reflecting the organization’s commitment towards a sustainable environment
According to some respondents, the main step that Aquatim took in relation to the environment, represents the acceptance and the understanding that the environment matters and must be taken into consideration. The introduction and implementation of the environmental management system emerged as a mandatory condition for Aquatim to remain on the market. The benefits following the implementation of the system, such as the obtaining of European funds and the purchase of lesser polluting new technologies, being perceived favourably by customers, motivated the employees to adopt a positive attitude towards the environment and respond favourably through environmental practices at work.

LOCAW‐ 265155 – FP7 ENV.2010 – WP3– Deliverable 3.2: PART 1: DOCUMENTS AND INTERVIEWS ANALYSIS
36
Attitudes reflecting norms, beliefs and values of the organization
The results of the analysis show that, although within Aquatim it is believed that the human resource cannot have a significant contribution on lowering GHG emissions, at the level of the organization’s core assumptions, beliefs, values and norms, the relation employee – environment is well enough defined. Thus, the basic premise of the employee – environment relation is that there are two categories of humans and employees, namely those who voluntarily follow environment regulations because they desire to protect the environment and those who need to be motivated or constrained by the organization to do the same. The defining element for the first category of employees seems to be the level of awareness of the importance of own contribution to the environmental sustainability. The interviewees share different opinions on the ways in which employees from the second depicted category understand and contribute to the implementation inside the organization of environment related regulations. Some consider constraints to be the most efficient method to determine the employees to become aware of the importance of environment and to respect environment regulations. Others think that employees need support from the organization in order to develop attitudes favourable to environment issues, if the organizations desire to facilitate implementation of pro‐environmental practices. Following interviews analysis, the ways through which the organization can support the employees in this direction were identified at two levels:
‐ Strategic management: offering information on how employees can actively contribute to environment protection; ensuring the necessary framework and organization for achieving the pro‐environmental practices; explaining and motivating the new regulations; giving periodic explanations on environmental practices; openness towards employees, offering support and encouragement to them;
‐ At group level: debating environmental issues in small groups; ensuring, inside every informal group, a majority who follows the regulations and act responsible in relation to the environment so that other members of the group comply to the norms; supporting the young employees who tend to be more sensitive to environmental issues and increasing their level of awareness that the elder ones will comply due to the fact that there are less chances of changing the attitudes of the former ones.
One of the core assumptions of Aquatim’s organizational culture, revealed by the interviews analysis, is that that if the manager has the initiative of some programs such as environmental ones, their implementation will most certainly be successful.
Another revealed core assumption refers to investment prioritizing and program hierarchy according to the importance attributed by the management. The interviewees consider that every issue, including the ones referring to the environment, can be solved through an acquisition. Yet the acquisitions are made on economic premises.
Attitudes regarding the organization’s future environmental performance
The interviews analysis revealed two main directions which interviewees consider necessary for the organization’s future efforts on environment sustainability and reduction of GHG emissions. A prime direction looks for improvement of the environment‐related practices in the organization’s operating activities. The necessity for the replacement of old technologies in order to reduce power consumption and GHG emissions was underlined. The second direction aims at setting specific environmental goals by the organization’s top management as well as designing and implementing training programs and activities for the employees in order to support their active role during the process of achieving the specified goals.
LOCAW‐ 265155 – FP7 ENV.2010 – WP3– Deliverable 3.2: PART 1: DOCUMENTS AND INTERVIEWS ANALYSIS
37
Attitudes regarding the factors contributing to lower GHG emissions
The results of the interviews analysis showed the following motivational factors contributing to Aquatim’s reduction of GHG emissions:
‐ Economic and financial: where potential economic benefits resulting from implementing certain environmental regulations could be identified, the management promoted or imposed those regulations; the interviewees think that environmental issues come second or even third best when planning an investment;
‐ Compliance with legislation governing the organization’s field of activity;
‐ The image and market survival: the quality and environmental integrated management system has been adopted and implemented voluntarily by Aquatim, but there was an indirect pressure from the stakeholders (i.e. The County/District Council) and from the shareholders, respectively.
Attitudes on market characteristics
The interviewees showed feelings of affiliation with pride and identification with the organization which they consider to be higher placed on the national market of the specific field. They consider that Aquatim does not pollute much the environment, and that, until present time, it took all possible measures to reduce the GHG emissions and that it has a market and partners cooperation strategy which takes into consideration all environmental regulations. Due to the specificity of its activity, as provider of public utility services, Aquatim holds a natural monopoly, but its management considers the possibility of the occurrence of a competition state from the neighboring counties in case of administrative regionalization. That is why it largely follows the environmental outlines and regulations valid for the competitive market.
Attitudes reflecting the organization’s unconcern for environmental issues
The interviewees underlined the poor level of environment related information held by the employees, the lack of attention focus on environmental issues and the absence of some specific goals targeting the solving of environmental issues, respectively.
Best practices
The analysis of interviews with key people from middle management revealed a series of good practices that provide information about "how things are done in Aquatim", reflecting the specific culture of this organization. The narrative themes identified in the discourses of the respondents concern: Good practices at implementation level; Good practices at communicational level; Good practices at decision making level; Good practices at strategic level; Good investment practices; Good practices related to mobility; Good resources saving practices; Good waste management practices.
Good practices at implementation level
The implementation of the environmental management system (reference standard: ISO 14001) has occurred gradually, generating a series of good practices relevant for reducing GHG emissions, such as: full implementation at headquarters, where the offices are situated; there is a responsible with the environment in every department; the department for quality, environment, health and occupational safety makes periodic inspections. Another category of relevant good practices is related to accessing grants from UE funds. The implementation of projects on which those funds were obtained has contributed significantly to reducing GHG emissions. For example, for the rehabilitation of the wastewater treatment plant new technologies have been used, technologies
LOCAW‐ 265155 – FP7 ENV.2010 – WP3– Deliverable 3.2: PART 1: DOCUMENTS AND INTERVIEWS ANALYSIS
38
that ensure the compliance with the environmental requirements, both those stipulated by the European legislation and the national one.
Good practices at communicational level
The results of the comprehensive interviews analysis allow the isolation of an important category of good practices relevant at organizational communication level, practices which include: Displaying the environmental objectives (according to ISO 14001) at the headquarters, so they could be read by any employee; Information sessions, conducted by members of the CMSSO department, aimed at facilitating the implementation of ISO 14001; The heads of the departments were informed about the objectives of ISO 14001 and were presented and explained the steps to take in order to achieve those objectives; Discussing within the middle management team about some problematical issues for implementing the environmental management system; The responsible for the environment, from each department, takes part regularly in the CMSSO department meetings and inform permanently the employees of his department about the new requirements, procedures, rules, etc; The employees were told how to do things (which are the procedures) and were not just required to obey some rules without any prior explanation; The employees discuss and sometimes they correct each other if they do not follow the rules; Superiors rebukes verbally the employees who violate the organization’s rules and regulations on environmental issues; Near the switches, there are posters displaying the message: “Turn off the light!” The accuracy of information is provided in the organization's policies; Effective communicational channels with the audience / the consumers; Requesting the public to inform the company on any matter relating to services provided by Aquatim; The disclosure to the public of the interest for the environment through celebrating The Environmental Days, Water Days, etc.
Good practices at decision making level
At decision making level, the respondents have highlighted good practices in relation to: The decision to implement ISO 14001 and the environmental management system; Decisions of rehabilitation, refurbishment, renewal (e.g. rehabilitation of the wastewater treatment plant; renovating office and laboratory space; upgrading water treatment plants); Decision of establishing environmental indicators to which the team leaders relate in the operating activities; The decision that each of the heads prepares reports to justify the non‐inclusion of indicators in the parameters set.
Good practices at strategic level
Closely related to decision‐making practices, analysis of interviews revealed some strategic decisions that have resulted in practices such as: Compliance with environmental standards of ISO 14001 in all activities of the organization (e.g. with each purchase, the conformity of new technologies, equipments, etc. to ISO14001 requirements are checked, the monitoring of consumption); Setting up a department for the implementation of international programs; The decision to make employees understand that taking in consideration the environment in all activities is the best way to do those activities; The decision to ensure the resources and the organizational processes so that pro‐environmental activities are facilitated; The decision to pursue the increase in efficiency of all activities in reference to high standards, including environmental ones; Issue prioritizing and solving them one by one; The decision to maintain interest and focus on environmental issues; Establishing annual goals containing environmental objectives, including pollution reduction; Providing personal example by superiors from all levels of management to help increase employee awareness about the environment.
LOCAW‐ 265155 – FP7 ENV.2010 – WP3– Deliverable 3.2: PART 1: DOCUMENTS AND INTERVIEWS ANALYSIS
39
Good investment practices
Following the analysis of interviews a set of good investment practices by the studied organization resulted: Major investment from European funds (wastewater treatment plant rehabilitation, expansion and modernization of water and sewerage networks); Investment of own resources in "environmentally friendly" technologies (e.g. upgrading water treatment plants) and in machineries and equipments, including new cars that consume and pollute less; Investment to reduce consumption of resources (e.g. redevelopment of offices and equipment of premises with energy saving bulbs, etc.).
Good practices related to mobility
In respect to this chapter, during the interviews, a series of good practices found also in the results of quantitative and qualitative analysis from WP2 were reiterated:
• At organizational level, Aquatim offers subscriptions for public transport means to those employees who travel a lot during working hours; Own means of transport (minibuses) for field trips; Lack of sufficient parking spaces, at the office, for employees and customers, determines many of them to use means of public transport, cycling or walking.
• At organization’s employee level, some of the interviewees consider that about 10% of employees go by bicycle to / from work; Those who live close to the job walk, others use means of public transport; Sharing one car to travel to and from work.
Good resources saving practices
In terms of resource savings, the interviews analysis results are consistent or identical to those obtained in WP2, too: Reduction of paper use (the use of e‐mail, intranet communication, two‐sided printing); Reducing energy consumption (process automation, introducing frequency converters and motion sensors for light extinction in some areas of the headquarters).
Good waste management practices
In regard to waste management practices, as resulted in WP2 too, the following aspects were mentioned in during the interviews: Specifically arranged places, at employees’ reach, for selective collection in order to facilitate their compliance waste management regulations (special bins for plastic, paper and glass; a place to collect scrap metal; container for oils); Contracts with specialized companies that gather the full containers from Aquatim’s locations.
Bad practices
The comprehensive interviews were also analyzed in terms of bad practices within the organization, regarding the GHG emissions. Using a large number of machines and equipments for work activities, but also for employees traveling to and from work is considered the major source of emissions produced by Aquatim.
Organizationale Values
The organizational values that have been identified in the speeches of the interviewees, middle managers of Aquatim, are: Environmental responsibility; High quality of customer service; Prevention of negative impacts of business activity; Team communication; Fairness and transparency in the relationships.
LOCAW‐ 265155 – FP7 ENV.2010 – WP3– Deliverable 3.2: PART 1: DOCUMENTS AND INTERVIEWS ANALYSIS
40
Internal rules and environmental policies
Another reference theme within the interviews has concerned the main internal rules and environmental policies. About this the following points were indicated: The general policy of the company is saving; Environmental policy applies to each new project; Internal audits on legislation.
Decision‐making processes
From the interviews analysis have resulted a series of attitudes regarding the decision‐making processes within Aquatim: It is necessary to improve the maintenance services of machinery, in order to pollute less; Long‐term investment strategy of the company is based on prevention rather than repair; The economical component is considered to be an obstacle for implementing environmental projects; The political reasons are taken into account in the activity of Aquatim; All the decisions of the top‐management have an environmental component, because the water, as an element within the environment, is the object of Aquatim’s activity; The environmental projects must be very well sustained and explained in order to be approved by the top‐management; It is preferable to acquire new technologies to maintain optimal activity, than to pay fines for noncompliance.
The good practices that could have been indentified regarding the decision‐making processes are the following: The environmental programs which are already in place are continually monitored, analyzed and possible changes and revisions are suggested, if applicable; The environmental issues are monitored for each activity, according to its specific and it aims permanently that those issues fall within the law; It also takes into account the recommendations of the environmental authorities, not only the laws binding; Decisions are taken based on the company market strategy and on the management contract which the company lead had concluded with the municipality and which includes a series of performance indicators that Aquatim need to respect; Many employees have decided to practice selective waste collection at home also, after having done this at work.
D. AN ANALYSIS OF EXISTING ORGANIZATIONAL NORMS AND THEIR POTENTIAL TO ACT AS BARRIERS OR DRIVERS TO THE IMPLEMENTATION AND SUCCESS OF POLICIES DESIGNED TO REDUCE GREENHOUSE GAS EMISSIONS
D. 1. Rules having driver potential
The analysis of interviews has revealed several categories of rules that have the potential to determine the organization to consider and implement changes relating to the environment, changes that otherwise would be unlikely to take place. The categories created according to the reference themes found in the speeches of the interviewees are the following: Organizational rules regarding the employees’ behavior; Rules regarding the hierarchical relationships within the organization; Organizational rules regarding the relation with local authorities; Organizational rules at decision‐making level; Organizational rules related to the reasons that could lead to the adoption of pro‐environmental behavior by employees; Organizational rules concerning mandatory actions versus voluntary ones.
Organizational norms regarding the employees behavior
The interviewees emphasized that the employees must work according to the decisions taken at different management levels and that, in general, they follow the rules imposed by the organization and are subject to internal rules of behavior at work. The standardization of environmentally responsible behavior at work was highlighted by two main ideas: 1) since there is an organized framework for waste management and all employees collect selectively, it would be a lack of common sense from someone not do the same; 2) if at work the employees collect waste selectively, it would be natural to do the same at home, since they realize that this is a good practice.

LOCAW‐ 265155 – FP7 ENV.2010 – WP3– Deliverable 3.2: PART 1: DOCUMENTS AND INTERVIEWS ANALYSIS
41
The organizational rules for management, which have been indicated within the interview, refer to the following aspects: motivating employees to achieve pro‐environmental behaviours through investment programs of European funds, considering that if within those contracts the importance of the environment is explicitly emphasized, then the employees will be more motivated; explaining the new rules to the employees determine them to be more aware of their utility and of the importance of their compliance; if half of employees has pro‐environmental behaviors, the others will comply with standards; it is hard to determine the older employees to be aware of these aspects and to be responsible regarding the environmental sustainability, but young people are very open and therefore they must be “made loyal” to the environment.
Norms regarding the hierarchical relationships within the organization
The norms regarding the hierarchical relationships are complementary to the two categories of attitudes that emerged from the analysis of organizational culture, namely attitudes favoring the environmental practices mandatory for the employees against attitudes favoring voluntary practice of environmentally responsible behaviors by the employees.
The interviewees, according to whom the first category of attitudes is prevalent in Aquatim, have mentioned norms specific for the hierarchical culture of relations and reporting to employees in environmental issues: Heads must submit the rules to subordinates and ensure their implementation; All work activities must be consistent with the superiors’ decisions; The coordinator matters the most in implementing environmental programs and policies; It is the duty of the environment department and of the environmental officials from each department to deal with issues related to the environment; People who implement environmental policies must organize several meetings and training sessions with employees in order to teach them the desired practices; The employees must comply with environmental rules, they should not come up with innovative ideas; Superiors rebuke employees who do not follow the rules; The management should insure the proper organizational frame so that the employees can fully respect the rules.
The other category of managers interviewed ‐ from the middle management level ‐ uses other norms in relation with their subordinates: An open relationship with the management; Support from superiors in achieving pro‐environmental practices; Enabling employees to realize the importance of respecting the environment and to reach an environmentally responsible behavior on their own initiative; The employees should be encouraged to adopt pro‐environmental behaviors; Team communication is very important; Awareness of the employees through the superior’s personal example.
Organizational norms regarding the relation with local authorities
The results of interviews analysis emphasizes the potential to act as a driver of the following organizational norms covering relations with local authorities: Public service providers that are not effective can be replaced by local authorities; The authorities must provide to the organization the means which are needed; We need to lobby local and county authorities for any environmental project.
Organizational norms at decision‐making level
The interviews analysis has revealed certain norms at the decision‐making level on environmental issues: Close monitoring of consumption; Periodic checks on construction sites, made by members of the CMSSO department; Pursuit of achieving environmental objectives across all activities; Prioritizing and solving all the problems; Transmission and implementation of the rules;Early prevention of negative impact of organizational activities on the environment; Maintaining in the future the current practices that turned out to be good.
LOCAW‐ 265155 – FP7 ENV.2010 – WP3– Deliverable 3.2: PART 1: DOCUMENTS AND INTERVIEWS ANALYSIS
42
Organizational norms related to the reasons that could lead to the adoption of pro‐environmental behavior by employees
The respondents have reported a number of actions which, in Aquatim, have had the potential to motivate the employees to adopt pro‐environmental behaviours: Initiative of the management, the establishment, the transfer and the implementation of the rules regarding the environment; The company management would approve programs to reduce GHG emissions, if the projects were well elaborated and motivated; The management should provide all the means to the employees and should organize the framework for the environmental practices; One should mostly follow the displayed rules, thus, implicitly, the displayed environmental goals; Providing periodically explanations regarding the environmental practices; Team work and communication; Superiors must offer themselves as examples and teams coordinators have the biggest role in implementing the environmental policies; If more than half of the colleagues do their duty, the others comply; Support from colleagues from other departments; Car sharing by several people to go to / from work contributes to reducing costs and to organizing the teamwork.
Organizational norms concerning mandatory actions versus voluntary ones
Regarding the most effective methods for persuading the employees to behave responsibly towards the environment, the interviews analysis has revealed two directions:
• Norms emphasizing the necessity to adopt binding methods: Constraint is effective; Employees must do what their superiors decide and communicate to them; Before taking some voluntary action, people need rules; They must obey to the environmental regulations, not to come up with initiatives; The employees who do not follow the rules can be sanctioned; The employees work has to be supervised and periodical inspections are needed, because in this way they will be determined to follow the rules; People follow the rules because they are afraid of sanctions.
• Norms supporting the own initiative: The management should encourage the employees towards the environmental practices; People should not be required, but be advised of why they have to do a certain thing; The imposition by force does not work; The employees must be given the opportunity of understanding the importance of the environment and of achieving environmentally responsible behaviours on their own initiative; The employees follow the environmental regulations because they want to protect the environment.
D. 2. Organizational norms that have the potential to act as barriers for the implementation and the success of policies designed to reduce emissions of greenhouse gases:
• All the environmental actions of the organization have been based on economic reasons; • Reducing GHG emissions is not a priority for Aquatim, therefore they have not focused on
this aspect; • The environmental issues are taking into account in third place when planning an
investment; • Very little information about the environment, to justify certain environmental practices; • It is not essential to know a lot or to know which are the environmental goals of the
company, it is important to do what you are told; • Postponement of investment projects concerning the environment, for financial reasons; • There is no reporting relating to the GHG emissions; • There are no sanctioning procedures for the employees who does not achieve environmental
practices (selective collection of waste, saving resources).
LOCAW‐ 265155 – FP7 ENV.2010 – WP3– Deliverable 3.2: PART 1: DOCUMENTS AND INTERVIEWS ANALYSIS
43
4. DISCUTIONS AND CONCLUSIONS
The organization’s vision, mission and values
The results of the comprehensive interviews analysis revealed a commitment of the organization to environmental sustainability. However, this is not a staunch pledge, assumed directly with regard to the relation with the environment, but a form of commitment resulted from an understanding of the business world realities, that cannot carry on ignoring, without negative consequences, the environmental problems. The organization’s interest in achieving real environmental performances had two main aims. First, it was the image benefits following from demonstrating to the interested parties, a “green” organization type of management of environmental issues adequate to its object of activity, namely WATER, which is itself an element of the natural environment. The second important aim was to attract ethical investments. Within the market context in which Aquatim run its business, the only big projects financing possibility was to obtain non‐refundable funds from the EU or from the state budget. The funds granting conditions require the company’s strict compliance with the environmental standards. The obtaining of the ISO 14001 certification and the implementation of the environmental management system clearly demonstrate the organization’s commitment to controlling the activities with impact on the environment and its complying with the legislation in force. The implementation of this system has also generated most practices relevant to the GHGe reduction. The successive implementation of the projects that attracted EU non‐refundable funds has also significantly contributed to the reduction of these emissions. Aquatim organizational culture The organizational culture of Aquatim incorporates two fundamental presuppositions relevant to the objective of our study. The first is that Aquatim does only pollute the environment to a very small extent; the second is that technology has the main role in diminishing the (already low) GHG emissions of the company. Our basic premise is that, as far as the employees – environment is concerned, there are two categories of people, and implicitly, of employees: those who observe voluntarily the environmental regulations because they want to protect the environment, and those who need to be motivated within the organization or compelled to do this. The increase of employees’ awareness of the environment’s importance was highlighted as the best way in which people can come to voluntarily behave responsibly towards the environment. As for the latter category of employees, the establishment and explanation of clear rules is paramount. Moreover, there are motivational levers at strategic‐managerial and group levels. The characteristic of the Aquatim organizational culture on which the investigated aspects depend is the type of transactions that define the work relations within the organization. The results of the analysis indicate the presence of a hierarchical type of culture based on observing the procedures and rules in a climate of stability and control. Within this organization the authority resides in rules and the power is exercised by specialists. The decisions are based on detailed analyses and the leaders tend to be conservative and cautious. In Aquatim there is an environmental department and every department has a person responsible with environmental matters. The other employees consider that the environmental problems only concern them to the extent in which they are asked to act by the persons institutionally “responsible” for such matters.
LOCAW‐ 265155 – FP7 ENV.2010 – WP3– Deliverable 3.2: PART 1: DOCUMENTS AND INTERVIEWS ANALYSIS
44
The comprehensive interviews analysis has indicated a high degree of employees’ identification (at least at management level, among whom the interviews were conducted) with the organization. This identification feeling can be considered an important driver in attaining the environmental objectives within such a hierarchical type of culture. Decision‐making processes and strategic planning at Aquatim The analysis results highlighted the top‐management’s important role in reducing the GHG emissions. At this management level, it is decided when and whether it is time to concentrate on certain aspects related to the environment, and the establishment of distinct objectives along these lines can be requested. Until then, all actions and practices regarding the environment are subordinated to other objectives of the organization. The main aspects relevant to the GHSe issue considered in strategic planning of Aquatim are the following: economic efficiency; compliance with the legislation; image benefits. From the results obtained it can be deduced the lack of a real and constant interest in the environmental issues within the organization, arising from a precarious level of information about the environment among the employees, and from the absence of focalization on certain environmental problems, as well as the lack of specific objectives aiming to resolve a such issues. As for the GHGs reduction objective per se, this theme is virtually inexistent at Aquatim decisional‐strategic level. The everyday activities at Aquatim During the organization’s daily activity the environmental management system principles are taken into account. As a result of their application, we identified a series of good waste management and resources savings practices. The organizational norms emphasized by the results of the comprehensive interviews analysis are specific to a hierarchical culture: the management makes the rules and bear responsibility for meeting the objectives, and the employees subscribe to these rules and comply to them even if they don’t understand them. The Aquatim employees consider that it is the environmental department’s duty as well as that of the persons responsible with environmental issues in every department to deal with the problems pertaining to the environment and, consequently, their own responsibility consists solely in complying with the rules and requirements imposed by them. Within the interviews there have been stated a number of open organizational relationships norms which we consider applicable only to certain sub‐structures within the organization, namely at certain teams or team levels, depending on the leaders’ qualities and determination. An important observation is that we have to take into account the fact that a part of the people interviewed could have simply offered desirable answers, telling the interviewers how they would like things to be or how things should be instead of describing how they actually are. Based on the interviews material, we highlighted, attitudes of the interviewed managers regarding these regulations, their perception of good practices and worse practices determined by regulations, environmental laws important to the organization, organizational rules following from environmental regulations, and values shaped on their basis.

LOCAW‐ 265155 – FP7 ENV.2010 – WP3– Deliverable 3.2: PART 1: DOCUMENTS AND INTERVIEWS ANALYSIS
45
There is a generally positive attitude regarding the environmental regulations, but their implementation within the organization was difficult, as it wasn’t a natural step in the evolution of the company but an obligation that had to be fulfilled in order for the company to survive on the market. There were also reluctances among the employees, according to what the interviewed persons said regarding the implementation of the integrated management system (quality‐environment‐occupational security). With respect to the development of low environmental impact technologies, its motivation was mainly economical, followed by an interest in citizens’ health and only thirdly by an environmental concern. The interviewed people’s feeling was that the Romanian environmental laws are minimal, and their observance at organizational level is also minimal—just to ensure that the law is not broken. On the other hand, there are opinions that the Romanian laws are more drastic that the EU ones, especially with regard to the company’s domain of interest (e.g. the discharge of waste water into the aquatic environment). A negative aspect at national level is the fact that the environmental regulations are changing constantly, and some laws are adopted in the absence of a concrete basis. The feeling is that many people obey the law without questioning the basis on which that law has been conceived. The regulations concerning the environment stimulated the investments made by Aquatim with the help of the European cohesion funds accessed by the company. At the same time, the company management promoted the development of sustainable organizational practices. Thus, a management system based on ISO 14001 was developed, but its practices do not aim at the reduction of GHG emissions but at the improvement of drinking water quality. The agents interviewed perceive this management system as a motivational factor that led to a better awareness of sustainable practices. They also assert that the environment system stretches beyond the legal requirements. Aquatim conducts its activities according to national and local laws. According to the interviews, there are no openings within the company towards implementing ideas except those imposed by the law. However, the positive aspect is the fact that the environmental laws—not only the obligations, but also a part of their recommendations—are obeyed. The employees consider the norms tough, because, if disobeyed, the penalties are proportionate to the gravity of the breach and have as a consequence the impossibility of accumulating funds for new investments. It seems that there is no positive feedback, from the company, about the correct implementation of environmental laws. Usually the feedback is given only when the activity does not comply with the legal parameters and the employees are threatened with fines. In the interviewees’ opinion, in Romania there is no harmony between the laws that regulate various domains of activity. The same thing is believed with respect to the correspondence between the Romanian and EU laws. With regard to the organizational values we noticed that the implementation of the environmental system triggered communication regarding environmental subjects within the company and that the employees consider that the company’s environmental policy has a more powerful impact on sustainable practices than the environmental laws. The national laws are not in concordance with the European law. This makes the meeting of the EU environmental legal requirements difficult. At local level there is a good relation between the Timisoara Mayoralty and the City Council; the employees believe that the local authority and the organization should share the same view on sustainable practices. The interviewed persons also emphasized the employees’ need for environmental rules when it comes to environmental actions, for only when it is imposed, an action can be adopted in the employees’ behavior, being subsequently repeated voluntarily.
LOCAW‐ 265155 – FP7 ENV.2010 – WP3– Deliverable 3.2: PART 1: DOCUMENTS AND INTERVIEWS ANALYSIS
46
There is also a difference in compliance with the environmental regulations according to the employees’ age, the older ones being more conservative and reluctant, whereas the younger ones have already had assimilated these rules into their education. As for the company’s relation with the general public, the latter can hardly identify the environmental practices of the former; these practices are little reflected in the media, which focuses mostly on the negative aspects of the company. According to the employees, the information is also transmitted to the inhabitants of small towns and rural areas, but communication of environmental practices is slow and difficult; consequently, more efforts to increase people’s awareness of these practices have to be made. Concerning the general public’s degree of awareness, there is a widespread opinion that most Romanians are focused on obtaining short‐term benefits from their activities; consequently, more effort has also to be invested in the increase of the awareness regarding the long‐term effects of practices harmful to the environment. In general, companies in Romania do not have strong environmental practices or policies aiming at raising awareness of sustainable practices. Moreover, within companies the strictly economical motivation has priority when investments concerning the environment are made, whereas the environmental motivation per se is at best of secondary importance. Aquatim understands that the compliance with, and implementation of, European, national and regional environmental regulations is crucial to the integrity of its image and to its success in attracting non‐refundable funds for large scale investments. The obtaining of ISO 14001 certification and the implementation of the environmental management system reflects the organization’s commitment to managing the significant environmental aspects associated to its activities. The specifics of its object of activity compels the company to give special priority to its dealing with environmental issues, as its place on the market and business success depend on its image among the consumers, its compliance with the contracts with local authorities and its eligibility for EU non‐refundable funding. Aquatim is not a big GhGe polluter compared to companies from other industrial sectors and hence they consider their environmental performance very high, due to the company’s focusing on other environmental aspects even if it pays no significant attention to GHG emissions. The image resulted from the comprehensive interviews analysis shows that the organizational norms concerning the Aquatim employees’ behavior converge as far as the observance of regulations, rules and explicit decisions of the company are concerned. Consequently, both drivers and barriers are to be found at the organizational level.
LOCAW‐ 265155 – FP7 ENV.2010 – WP3– Deliverable 3.2: PART 1: DOCUMENTS AND INTERVIEWS ANALYSIS
47
2. 3. National Report – Netherlands
University of Groningen, Groningen
Authors: Anne‐Kathrin Helbig, Linda Steg, Jan Willem Bolderdijk, Kees Keizer
1. The aim of this report
This report will give an insight in the ambitions concerning sustainability of the municipality of Groningen. It will have a look at EU and national sustainability regulations, which the municipality has to fulfil, and indicate what they want to achieve above and beyond this. Furthermore, this report analyses how the municipality wants to realize these ambitions and which barriers and drivers they face in doing so. These barriers and drivers can be on EU and national level or can be related to the political, social, and economic context in which the municipality operates. The report will describe how these barriers and drivers influence the sustainability ambitions of the municipality.
2. Municipality of Groningen
The municipality of Groningen aimed to be CO2 neutral by 2025 (Master Plan Groningen Energy neutral, 2010). This goal proved to be rather challenging. Therefore, recently, the municipality extended it to 2035.
To realize this goal the municipality aims to function as a good example to the citizens and companies of Groningen by transforming the municipality to a sustainable organization. Among others, they have started reconstructing their own buildings to increase the energy‐efficiency of these buildings. Additionally, they introduced a wide range of policies related to energy use, transport, waste generation and purchase to decrease CO2 emissions and increase sustainability (Master Plan Groningen Energy neutral, 2010; Helbig et al., 2011).
The municipality of Groningen is an organization that has to operate on EU and national sustainability laws and regulations and in a social and economic context. Most of their policies are built on EU and national sustainability regulations. However, the municipality also introduced policies that go beyond these regulations. For example, the municipality defined and introduced additional sustainability guidelines in the domain of travel, energy use, waste generation and purchase. But are these guidelines effective? And which circumstances are working as barriers and drivers to fulfil these guidelines? The current report aims to answer these questions.
3. Method
We analysed sustainability regulations on EU, national and organizational level and conducted in‐depth interviews with key persons within the municipality to investigate the extent to which the political, social and economic context inhibits or facilitates the fulfilment of these regulations.
To investigate sustainable regulation of the municipality of Groningen, we relied on document analyses whenever possible, giving us an accurate and reliable picture of the formal state of affairs. Further, we used interviews with relevant key persons. We analysed sustainability regulations for transport, energy use, waste generation and purchase on the EU, national and organizational level.
First, we analysed EU and national sustainability regulations regarding transport, energy use, waste generation and purchases to understand which requirements the municipality has to fulfil (Knowledge Center Europa Local, 2011; National waste generation plan 2009‐2021, 2011). Furthermore, we analysed the annual reports of the Municipality Groningen of 2009 and 2010
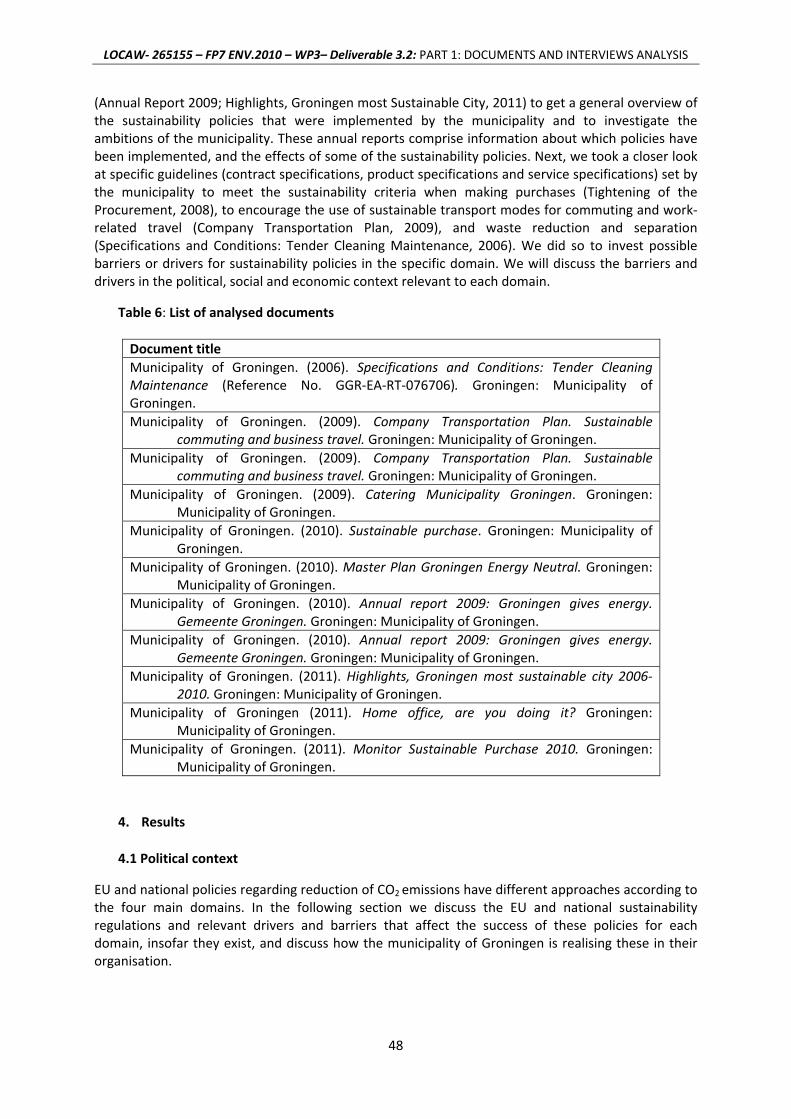
LOCAW‐ 265155 – FP7 ENV.2010 – WP3– Deliverable 3.2: PART 1: DOCUMENTS AND INTERVIEWS ANALYSIS
48
(Annual Report 2009; Highlights, Groningen most Sustainable City, 2011) to get a general overview of the sustainability policies that were implemented by the municipality and to investigate the ambitions of the municipality. These annual reports comprise information about which policies have been implemented, and the effects of some of the sustainability policies. Next, we took a closer look at specific guidelines (contract specifications, product specifications and service specifications) set by the municipality to meet the sustainability criteria when making purchases (Tightening of the Procurement, 2008), to encourage the use of sustainable transport modes for commuting and work‐related travel (Company Transportation Plan, 2009), and waste reduction and separation (Specifications and Conditions: Tender Cleaning Maintenance, 2006). We did so to invest possible barriers or drivers for sustainability policies in the specific domain. We will discuss the barriers and drivers in the political, social and economic context relevant to each domain.
Table 6: List of analysed documents Document title Municipality of Groningen. (2006). Specifications and Conditions: Tender Cleaning Maintenance (Reference No. GGR‐EA‐RT‐076706). Groningen: Municipality of Groningen. Municipality of Groningen. (2009). Company Transportation Plan. Sustainable
commuting and business travel. Groningen: Municipality of Groningen. Municipality of Groningen. (2009). Company Transportation Plan. Sustainable
commuting and business travel. Groningen: Municipality of Groningen. Municipality of Groningen. (2009). Catering Municipality Groningen. Groningen:
Municipality of Groningen. Municipality of Groningen. (2010). Sustainable purchase. Groningen: Municipality of
Groningen. Municipality of Groningen. (2010). Master Plan Groningen Energy Neutral. Groningen:
Municipality of Groningen. Municipality of Groningen. (2010). Annual report 2009: Groningen gives energy.
Gemeente Groningen. Groningen: Municipality of Groningen. Municipality of Groningen. (2010). Annual report 2009: Groningen gives energy.
Gemeente Groningen. Groningen: Municipality of Groningen. Municipality of Groningen. (2011). Highlights, Groningen most sustainable city 2006‐
2010. Groningen: Municipality of Groningen. Municipality of Groningen (2011). Home office, are you doing it? Groningen:
Municipality of Groningen. Municipality of Groningen. (2011). Monitor Sustainable Purchase 2010. Groningen:
Municipality of Groningen.
4. Results
4.1 Political context
EU and national policies regarding reduction of CO2 emissions have different approaches according to the four main domains. In the following section we discuss the EU and national sustainability regulations and relevant drivers and barriers that affect the success of these policies for each domain, insofar they exist, and discuss how the municipality of Groningen is realising these in their organisation.
LOCAW‐ 265155 – FP7 ENV.2010 – WP3– Deliverable 3.2: PART 1: DOCUMENTS AND INTERVIEWS ANALYSIS
49
4.1.1 Travel‐related practices
No EU and national sustainability regulations for travel‐related practices have been formulated that are directly relevant to the municipality of Groningen. However, different political circumstances are affecting the car use of employees.
National and provincial governments have introduced policies aimed at increasing the attractiveness of alternative transport modes. The municipality of Groningen introduced several policies to decrease the car use of the employees, including a bicycle plan, facilitating the possibility to work at home, improvement of the infrastructure to simplify the use of alternative transport modes and paid parking schemes. These policies are characterised through financial rewarding employees who are using alternative transport modes rather than their car and imposing financial costs on for those who using the car (With own Strength, 2008). The bicycle plan is a nation‐wide scheme introduced in an attempt to encourage employees using bicycles rather than cars to get to work. This scheme allows employees to buy a new bicycle at a discount (Company Transportation Plan, 2009). Specifically, this scheme allows employees to purchase a new bicycle from their pre‐tax salary, at which point employees can save up to 40% on the actual price of the bicycle. The goal is to encourage the employees to use the bicycle to travel to work. In essence, employees receive a 40% discount on their bicycle.
Another policy implemented to reduce car use is improving the infrastructure for more sustainable modes of transport. National and local governments (including the municipality) are working on a better infrastructure so that citizens can reach their work easier with public transport. Putting this idea to practice, almost all municipality buildings are easily reachable by train and bus, allowing employees to use more sustainable transport modes for commuting. Furthermore, home offices are also supported by national policies. The municipality is offering employees the possibility to work up to 40% (2 days when fulltime employed) of their work hours at home (Company Transportation Plan, 2009; Home office, are you doing it?, 2011). The municipality arranges that employees are getting telecommunication systems installed at their home office so they do not need to travel to work five days a week. In addition to these policies, most municipality buildings are located in the payment parking area of the city and does not offer free parking places for employees (with a few exceptions e.g.: handicapped employees). The municipality does not reimburse parking fees. Employees thus can save money on parking fees by working at home and avoiding to parking close to the office (Company Transportation Plan, 2009).
In spite of the relatively good infrastructure for public transport and cycling in the Netherlands, which should work as clear driver to use alternative transport modes, interviews with employees of the municipality revealed that they feel that the infrastructure needs to be improved further. They identified current infrastructure as barrier against the use of more sustainable transport modes, as many destinations are difficult to reach by bike or public transport, or far away. According to the employees is it easy to use the bicycle to reach destinations within near the city centre. In fact, most of the times it is even faster or it cost the same amount on time compared to driving. However, if a location is further out of the city centre, employees indicated they need almost twice as much time to reach destinations, which is very time consuming but also perceived as highly inconvenient. Additionally, for employees who live and work in the city, it is easy to reach work with public transports or the bicycle. However, employees living outside the city, in small villages with no regular public transport services (as in the city) and travel distances inhibiting the use of the bicycle, prefer using the car. This is especially true when their office buildings are not in the paid parking area. Furthermore, the public transport services can be poor, resulting in much longer travel times (double or three times as much time to go to work) compared to when one would travel with alternative transport modes than with the car.
LOCAW‐ 265155 – FP7 ENV.2010 – WP3– Deliverable 3.2: PART 1: DOCUMENTS AND INTERVIEWS ANALYSIS
50
4.1.2 Energy use
The EU has clear guidelines regarding the energy use of national and local governments, to reduce organisational energy use and achieve increases in the use of sustainable energy sources. The EU demands that the municipality in 2010 derived on average 12% of their total energy use and 21% of their electricity use from sustainable resources. Moreover, EU guidelines propose that in the course of 9 years (2008 ‐ 2017), total energy demand should reduce by 9% (Knowledge Center Europe Local, 2011). Also the EU requires energy performance certificates for governmental buildings to fulfil the guideline as specified in the document “Energy efficiency: energy performance of buildings” (EPBD 2002/91/EC). This guideline asks for transparency regarding the energy efficiency of buildings. Furthermore, the EU requires minimum energy performance standards for new buildings and for renovated buildings. These requirements are also included in the national sustainable regulations and fulfilled by the municipality of Groningen (Knowledge Center Europe Local, 2011). Due to these regulations the municipality is encouraged to analyse the energy efficiency of their current and future buildings and to develop strategies to improve the energy efficiency and thus total energy use.
Due to the requirements of an energy performance certificate, the municipality has analysed the energy use of all main municipality office buildings, public service buildings and all other public buildings with a surface area above 1,000 m2. This includes for example sport facilities or schools for which the municipality is responsible. Based on this analysis, so‐called energy labels ‐ which indicate the individual energy performance of the relevant building ‐ were assigned to each building (Annual Report, 2009). The energy label is an energy certificate used in the Netherlands to meet the above mentioned requirements of the European guideline: “Energy efficiency: energy performance of buildings” (EPBD 2002/91/EC). To get more insight into the energy use of the office buildings and facilities, the municipality installed an energy‐information system called ‘E‐sight’ (Annual Report, 2009). This system further facilitates the design of additional energy saving policies.
To meet the EU requirement to use more sustainable (green) energy sources, the municipality uses 100% green energy (thus more than required by the EU). To decrease total energy demand, the municipality aims to consider the energy efficiency of every purchase made, including building material and office installations, and they explicitly consider ways to reduce energy consumption in building renovation plans and new buildings (Sustainable purchase, 2010).
Even though the EU introduced clear guidelines to guide the municipality towards an energy efficient organization, the municipality faces some barriers in realising this due to national and provincial governmental policies regarding the adoption of green energy sources. Even though the municipality already exclusively uses 100% green energy, they also have the ambition to produce green energy (mainly through wind turbines or solar installations). Interviews with key persons suggest this undertaking is hindered by national and provincial governments. Due to provincial agreements it is not possible for the municipality to build wind turbines close to the city, as the municipality intended. Furthermore, if the municipality would produce too much energy through solar installations (that is, much more than they need themselves), they will be qualified as an energy producer and thus taxed as an energy producer. This is another barrier preventing the municipality from investing in green energy production.
4.1.3 Waste generation
There seem to be no EU or national sustainability regulations that directly influence the handling and reduction of waste by the municipality. However, the EU and national regulations demand separation of waste (National waste generation plan 2009‐2021, 2011). They demand that organic waste is collected separately as well as paper and carton. Furthermore, they require recycling of electronic appliances and the appropriate disposal of substances that can damage human health and environmental quality (e.g, toners in printers).
LOCAW‐ 265155 – FP7 ENV.2010 – WP3– Deliverable 3.2: PART 1: DOCUMENTS AND INTERVIEWS ANALYSIS
51
These regulations encourage the municipality to think about the handling and disposal of waste. The municipality encourages employees to separate waste by providing facilities to do so. For example, separate waste boxes have been successfully introduced in offices for paper and other waste (although not in common rooms like the cantinas). However, there are no facilities for separating organic waste. Batteries, accumulators and electrical machines are returned to the producer who is obliged to dispose of it in the required way.
4.1.4 Purchases
In the summer of 2006, the Dutch national government decided that in 2010 environmental criteria have to be considered in all purchases and investments made by municipalities. Furthermore, it was decided that the municipalities have to consider environmental criteria in 50% of their purchase budget. This is a national regulation and has to be followed by the national government and municipalities (Knowledge centre Europe local, 2011). To ensure sustainable purchases and to offer a guideline of what is considered as sustainable, the Dutch government introduced an agency that established minimum environmental and social criteria, which have to be fulfilled to consider a product to be sustainable.
A driver that promotes sustainable purchases is the developing of sustainable criteria for products. This facilitates and simplifies the search for sustainable products for the municipality. However, these criteria have only been developed for 52 product groups, which are by large not covering all product groups that a municipality may consider purchasing. As a consequence, the search for sustainable criteria in other product groups is not so intense as for the listed 52 product groups. The lack of a more extensive list of criteria is thus likely to inhibit the success of this policy.
4.2 Social context
The social context of the municipality affects the management of sustainability issues in the four domains. The municipality has the goal to be CO2 neutral by 2035 for which it has to operate as good example for her citizens (Master Plan Groningen Energy neutral, 2010). In the following section we will discuss how the desire to function as a role model leads the municipality to go above and beyond the political demands mentioned in the section above.
4.2.1 Travel‐related practices
The municipality considers national transport policies as insufficient for achieving the goal to be CO2 neutral by 2035. Because of this, the municipality introduced a couple of additional policies on the organisational level to encourage employees to use public transport and to function as good example for the citizens of Groningen. These policies include: refunding of public transport costs, flexible working hours and the refusal of renting parking spots for employees. Conversely, the municipality does reimburse public transport cost of employees (Company Transportation Plan, 2009). The municipality is not required to do this, but believes that this is needed and effective to increase the use of public transport. A second regulation to reduce the use of commuting by car is offering the possibility of flexible working hours. To encourage employees to make use of public transports and the refund regulation, the municipality decided to introduce flexible working hours so that working hours can be easily adapted to the timetables of public transport. To further support the refund and flexible working hour regulation, the municipality refuses to buy or lease company parking spots. Often an organization has parking spots available for her employees or is leasing them, however, the municipality decided not to do so in order to reduce commuting car use. The employees still have the possibility to commute by car. However, if they choose to do so they have to pay the parking fee themselves which are pretty high in the city centre of Groningen were most of the municipality buildings are located (Company Transportation Plan, 2009). For business related travel, the municipality introduced a policy that specifies which transport mode should be used for different
LOCAW‐ 265155 – FP7 ENV.2010 – WP3– Deliverable 3.2: PART 1: DOCUMENTS AND INTERVIEWS ANALYSIS
52
types of business trips in order to get the travel expenses reimbursed. According to these guidelines, travel costs are only refunded when the requirements are fulfilled completely (Company Transportation Plan, 2009). This means, for example, that if an employee uses the car for a trip that could easily be done by train, he or she would not get a refund for the travel costs. These guidelines have been developed to promote the use of sustainable transport mode and to discourage the use of the car for business trips.
4.2.2 Energy use
Due to the same reason mentioned by the travel related practices, namely being a good example to the citizens of Groningen, the municipality is keen to show its concern with energy use and energy savings. For this reason, they presented the energy labels of their own buildings, and actively try to increase the energy efficiency of their buildings by reconstructing and improving their most energy inefficient buildings (Annual report 2009, 2010).
However, a lot of the municipality buildings are monuments, which inhibit some reconstructions aimed to improve energy efficiency. As a consequence, not all reconstructions works can be realised or cannot be realised in the way the municipality would prefer, as the historical value of buildings is prioritised above its energy efficiency.
4.2.3 Waste generation
Although there are no political drivers to reduce waste production, the aim to function as a role model promotes sustainable practices in this domain as well. The production of (rest‐) waste is associated with energy usage and CO2‐emissions when burned. For this reason, the municipality tries to produce as little waste as possible, which includes for example the decrease of paper use among the employees and the use of porcelain plates and glasses in the canteen (Catering Municipality Groningen, 2009). Furthermore, the municipality placed separate waste bins in public buildings to demonstrate their concern with waste separation and to encourage citizens to separate their waste as well.
4.2.4 Purchases
Related to sustainable purchases, the municipality also aimed to go beyond the national requirements. All municipalities already decided in 2007 (Climate accord municipalities and government 2007‐2011, 2007) to increase the percentage of sustainable purchase from 50% to 75% by the year of 2010 and agreed on the goal to purchase 100% sustainably by 2015. However, due to its goals of being CO2, neutral, the municipality of Groningen aimed to make 100% sustainably purchases already in 2010. They nearly achieved this goal; they reported to have realised 98% sustainable purchases in 2010 (Monitor Sustainable Purchase 2010, 2011).
4.3 Economic context
In this section we will discuss the economical drivers and barriers of the municipality to increase the sustainability of the organisation.
The municipality has the possibility to loan money from the bank of Dutch municipalities at a low rent. This offers the municipality the opportunity to loan money to realise sustainable investments.
However, our interviews with key persons revealed that this is the only financial support the municipality is receiving from the Dutch government. The municipality does not get any subsidies from the national government to reconstruct their buildings or to invest in sustainable products.
LOCAW‐ 265155 – FP7 ENV.2010 – WP3– Deliverable 3.2: PART 1: DOCUMENTS AND INTERVIEWS ANALYSIS
53
They have to finance reconstructions themselves and if it is too expensive, such investments will not be made or postponed. Additionally, cutbacks in funding force the municipality to use the savings gained through the reconstruction work to finance other municipality duties rather than in further improving energy efficiency and realising further energy savings. This makes it difficult for the municipality to save money for further reconstruction. The same applies for sustainable purchases. Sustainable products are often more expensive than non‐sustainable products, and the municipality has to pay for these additional expenses themselves. Generally no EU or national subsidies or discounts are provided for the purchase of sustainable products, although the EU and national governments did commission the aforementioned sustainable purchase requirements. As a result, the municipality searches the market for suppliers who offer low prices for products that abide by the sustainability criteria. However, if the sustainable product implies a 5% or more increase in costs compared to an unsustainable product, they may decide not to contract the supplier who provides the more expensive sustainable product (Tightening of the Procurement, 2008).
Our interviews with key persons also revealed that a new power plant will be built in the Eemskanaal, which produces conventional (fossil‐based) energy. This means that the costs of conventional energy are likely to decrease, relative to the price of green energy. This makes the purchase of green energy in proportion even more expensive than before, thereby being a barrier to exclusively use green energy sources.
4. Conclusion
The municipality of Groningen has many ambitions regarding sustainability and implemented sustainability policies that go further than mandated by EU or national regulations. However, the municipality receives hardly any financial support from the national government to realise their ambitions, which can work as a barrier for consistent sustainability choices. The EU and national government did put forward regulations for energy use, purchases and waste separation that stimulate sustainable practices. However, regulations for travel‐related behaviour or for the reduction of waste have been lacking, meaning that the municipality can decide for itself on how sustainable they want to behave in these domains. Generally, we conclude that the political and social context is working in a positive way, stimulating the introduction of sustainable practices within the municipality. However, in particular the lack of financial support from the national government inhibits the municipality to realise its goals with respect to sustainability.
LOCAW‐ 265155 – FP7 ENV.2010 – WP3– Deliverable 3.2: PART 1: DOCUMENTS AND INTERVIEWS ANALYSIS
54
2. 4. NATIONAL REPORT ITALY CIRPA – Sapienza University of Rome
Authors: Giuseppe Carrus, Eugenio de Gregorio, Fridanna Maricchiolo Supervision: Mirilia Bonnes, Marino Bonaiuto
1. Short profile of the Enel Green Power company The company focused by the CIRPA team as Italian case study to conduct the research activities in the LOCAW project is Enel Green Power (EGP). Here below we report some basic information concerning the company. Enel Green Power (EGP), founded in December 2008, is the company of the Enel Group dedicated to developing and managing energy generation from renewable sources at an international level, with a presence in Europe and the American continent. Enel is the main energy provider in Italy, and one of the main in Europe. In Europe, EGP operates in Italy (where it is the leader in three out of the four technologies on renewable energies: geothermal, hydroelectric and solar), Spain, France and Greece. Italy is the fourth largest user of renewable energy in Europe. Alternative sources account for 15% of energy generated, and this percentage should significantly increase over the next few years. Major projects are also under way in a number of countries in Eastern Europe. In addition, EGP operates in the United States and Canada, primarily in the form of hydroelectric plants and wind farms, and in Central and South America, primarily in the form of hydroelectric plants. The mission of EGP is therefore very congruent with the objectives of the Locaw project, and in particular for this Work Package, that aims at investigating the organizational macro‐factors influencing everyday practices and behaviours in the workplace aimed at reducing carbon emissions by large scale organizations in Europe. EGP is world leader in this sector, with almost 21 TW/h produced every year, covering the energy consumption of about 8 million families, avoiding 16 million tons of CO2 emissions every year. The main mission of EGP is therefore intrinsically committed to contributing to sustainable development. In future years, EGP aims at increasing its installed capacity and boosting development along the value chain, also via strategic partnerships with world‐class technological benchmarks. EGP generates power from all renewable resources, with a vast, balanced portfolio of plants using wind, hydroelectric, geothermal, solar and biomass power. Each of these aspects are described below with more detail. Solar energy The gradual rise in global temperatures and the instability of fossil fuel markets are driving the development of solar power throughout the world, particularly in the area of photovoltaic technologies. In the solar sector, EGP can count upon Italian competence thanks to the Enel.si franchising model, a research centre based in Catania. Italy is currently one of the fastest growing photovoltaic markets, thanks to the high natural levels of sunlight and high public incentives to development of this technology. EGP also operates the Serre Persano plant (near Salerno), one of the world's largest photovoltaic facilities. In the area of advanced technologies, the Archimede Project by EGP has begun testing the solar thermal generation at the Priolo Gargallo plant (near Syracuse). This is the world's first example of a combined‐cycle gas plant integrated with a solar plant, based on a highly innovative technology developed by Enea, the Italian state energy agency.
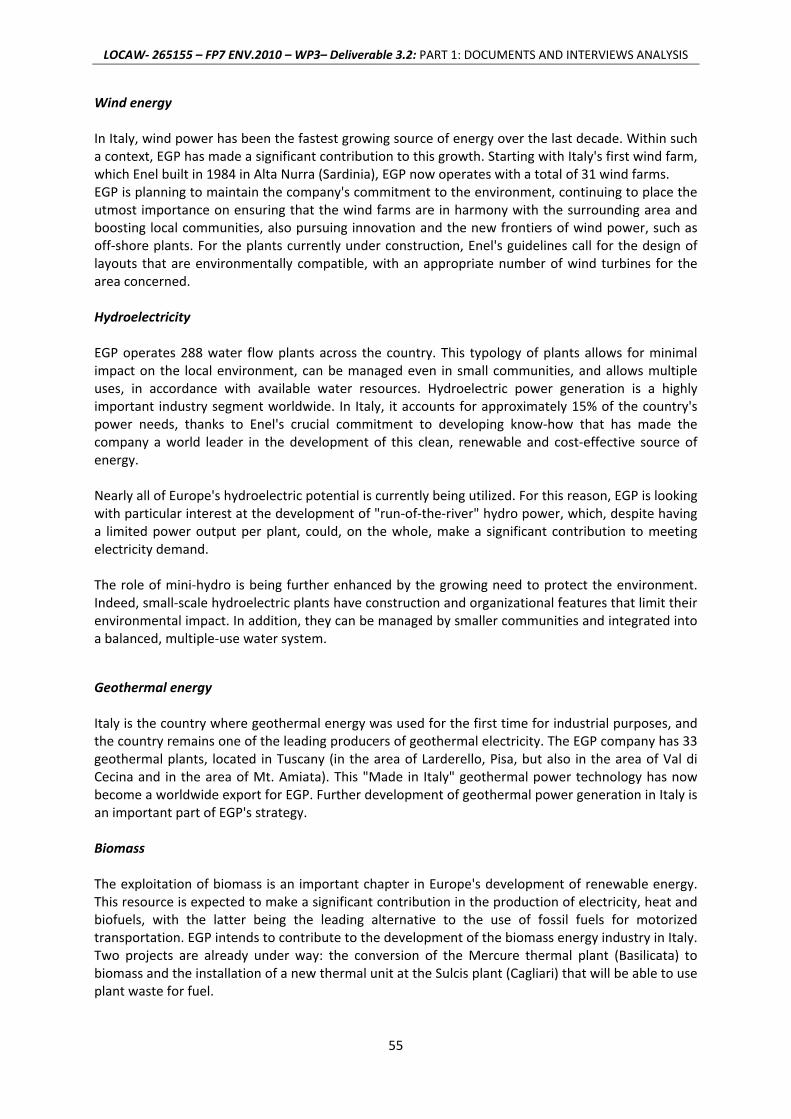
LOCAW‐ 265155 – FP7 ENV.2010 – WP3– Deliverable 3.2: PART 1: DOCUMENTS AND INTERVIEWS ANALYSIS
55
Wind energy In Italy, wind power has been the fastest growing source of energy over the last decade. Within such a context, EGP has made a significant contribution to this growth. Starting with Italy's first wind farm, which Enel built in 1984 in Alta Nurra (Sardinia), EGP now operates with a total of 31 wind farms. EGP is planning to maintain the company's commitment to the environment, continuing to place the utmost importance on ensuring that the wind farms are in harmony with the surrounding area and boosting local communities, also pursuing innovation and the new frontiers of wind power, such as off‐shore plants. For the plants currently under construction, Enel's guidelines call for the design of layouts that are environmentally compatible, with an appropriate number of wind turbines for the area concerned. Hydroelectricity EGP operates 288 water flow plants across the country. This typology of plants allows for minimal impact on the local environment, can be managed even in small communities, and allows multiple uses, in accordance with available water resources. Hydroelectric power generation is a highly important industry segment worldwide. In Italy, it accounts for approximately 15% of the country's power needs, thanks to Enel's crucial commitment to developing know‐how that has made the company a world leader in the development of this clean, renewable and cost‐effective source of energy. Nearly all of Europe's hydroelectric potential is currently being utilized. For this reason, EGP is looking with particular interest at the development of "run‐of‐the‐river" hydro power, which, despite having a limited power output per plant, could, on the whole, make a significant contribution to meeting electricity demand. The role of mini‐hydro is being further enhanced by the growing need to protect the environment. Indeed, small‐scale hydroelectric plants have construction and organizational features that limit their environmental impact. In addition, they can be managed by smaller communities and integrated into a balanced, multiple‐use water system.
Geothermal energy Italy is the country where geothermal energy was used for the first time for industrial purposes, and the country remains one of the leading producers of geothermal electricity. The EGP company has 33 geothermal plants, located in Tuscany (in the area of Larderello, Pisa, but also in the area of Val di Cecina and in the area of Mt. Amiata). This "Made in Italy" geothermal power technology has now become a worldwide export for EGP. Further development of geothermal power generation in Italy is an important part of EGP's strategy. Biomass The exploitation of biomass is an important chapter in Europe's development of renewable energy. This resource is expected to make a significant contribution in the production of electricity, heat and biofuels, with the latter being the leading alternative to the use of fossil fuels for motorized transportation. EGP intends to contribute to the development of the biomass energy industry in Italy. Two projects are already under way: the conversion of the Mercure thermal plant (Basilicata) to biomass and the installation of a new thermal unit at the Sulcis plant (Cagliari) that will be able to use plant waste for fuel.
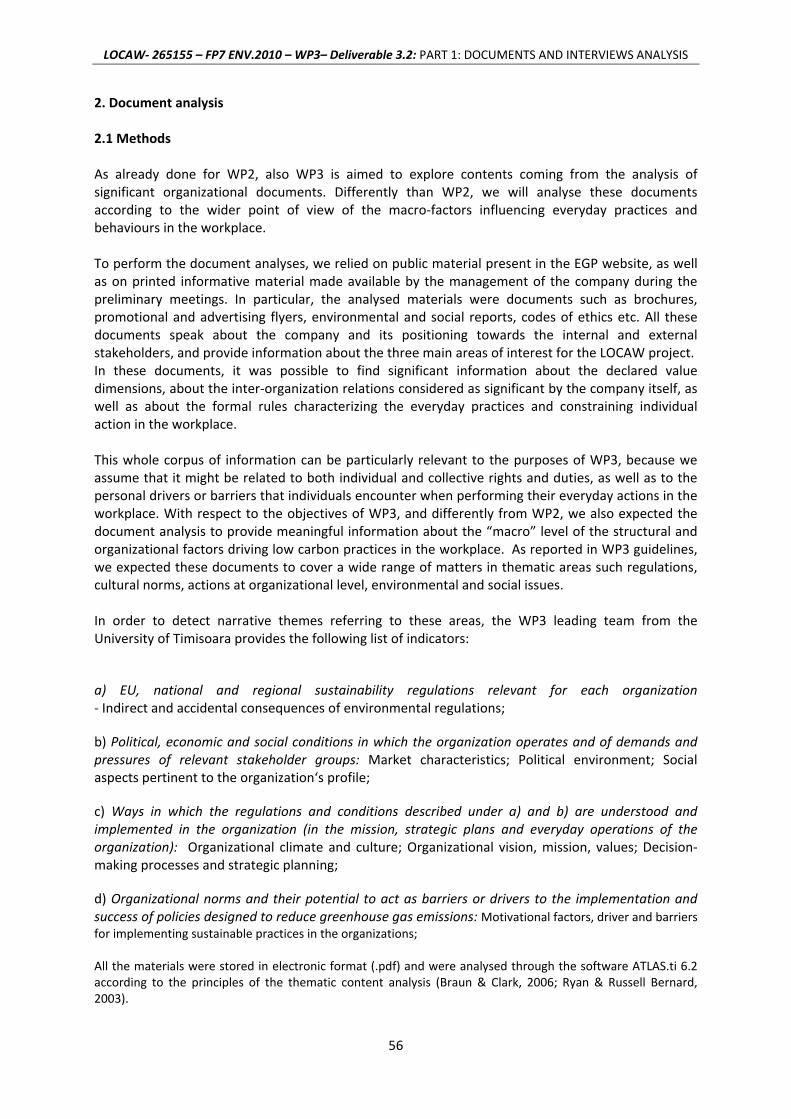
LOCAW‐ 265155 – FP7 ENV.2010 – WP3– Deliverable 3.2: PART 1: DOCUMENTS AND INTERVIEWS ANALYSIS
56
2. Document analysis 2.1 Methods As already done for WP2, also WP3 is aimed to explore contents coming from the analysis of significant organizational documents. Differently than WP2, we will analyse these documents according to the wider point of view of the macro‐factors influencing everyday practices and behaviours in the workplace. To perform the document analyses, we relied on public material present in the EGP website, as well as on printed informative material made available by the management of the company during the preliminary meetings. In particular, the analysed materials were documents such as brochures, promotional and advertising flyers, environmental and social reports, codes of ethics etc. All these documents speak about the company and its positioning towards the internal and external stakeholders, and provide information about the three main areas of interest for the LOCAW project. In these documents, it was possible to find significant information about the declared value dimensions, about the inter‐organization relations considered as significant by the company itself, as well as about the formal rules characterizing the everyday practices and constraining individual action in the workplace. This whole corpus of information can be particularly relevant to the purposes of WP3, because we assume that it might be related to both individual and collective rights and duties, as well as to the personal drivers or barriers that individuals encounter when performing their everyday actions in the workplace. With respect to the objectives of WP3, and differently from WP2, we also expected the document analysis to provide meaningful information about the “macro” level of the structural and organizational factors driving low carbon practices in the workplace. As reported in WP3 guidelines, we expected these documents to cover a wide range of matters in thematic areas such regulations, cultural norms, actions at organizational level, environmental and social issues. In order to detect narrative themes referring to these areas, the WP3 leading team from the University of Timisoara provides the following list of indicators:
a) EU, national and regional sustainability regulations relevant for each organization ‐ Indirect and accidental consequences of environmental regulations;
b) Political, economic and social conditions in which the organization operates and of demands and pressures of relevant stakeholder groups: Market characteristics; Political environment; Social aspects pertinent to the organization‘s profile;
c) Ways in which the regulations and conditions described under a) and b) are understood and implemented in the organization (in the mission, strategic plans and everyday operations of the organization): Organizational climate and culture; Organizational vision, mission, values; Decision‐making processes and strategic planning;
d) Organizational norms and their potential to act as barriers or drivers to the implementation and success of policies designed to reduce greenhouse gas emissions: Motivational factors, driver and barriers for implementing sustainable practices in the organizations; All the materials were stored in electronic format (.pdf) and were analysed through the software ATLAS.ti 6.2 according to the principles of the thematic content analysis (Braun & Clark, 2006; Ryan & Russell Bernard, 2003).

LOCAW‐ 265155 – FP7 ENV.2010 – WP3– Deliverable 3.2: PART 1: DOCUMENTS AND INTERVIEWS ANALYSIS
57
Table 7 shows the list of the documents considered coming from Enel Green Power. Table 7: List of analysed documents
Document title
Code of ethics
Sustainability balance 2010
Zero Emission Project 2011
A guide about energy efficiency and Municipalities
A guide about energy saving at home
Dossier about energy saving and Municipalities
2.2 Results
A total of 32 codes emerged from the documentary thematic analysis. All of them can be included into general indicators identified by the leading team. The codes detected refer in particular to the indicators previously described at points a) [EU, national and regional regulations], b) [Political, economic and social conditions and relevant stakeholders], and c) [Ways in which the regulations and conditions are implemented]. No codes were detected for the point d) [Organizational norms].
For what it concerns the main drivers and barriers, the analysed documents seem to highlight a more important emphasis at the individual rather than the organizational level.
From a more in depth exploration of point a) [EU,national, regional regulations], it emerged a considerable number of themes, summarized in figure 1. Black background nodes indicate the area of consequences coming from European or international regulations, and those coming from national laws, respectively.
As can be seen, some of these codes are well connected to the main issues and contents already emerged in the previous analyses conducted for WP2, such as Attitudes (e.g., the cognitive aspect of chemical combustion), Values (sense of competitiveness to research new form of renewable energy) and Good practices (Diffusion and spread of projects adherent to EU regulations).
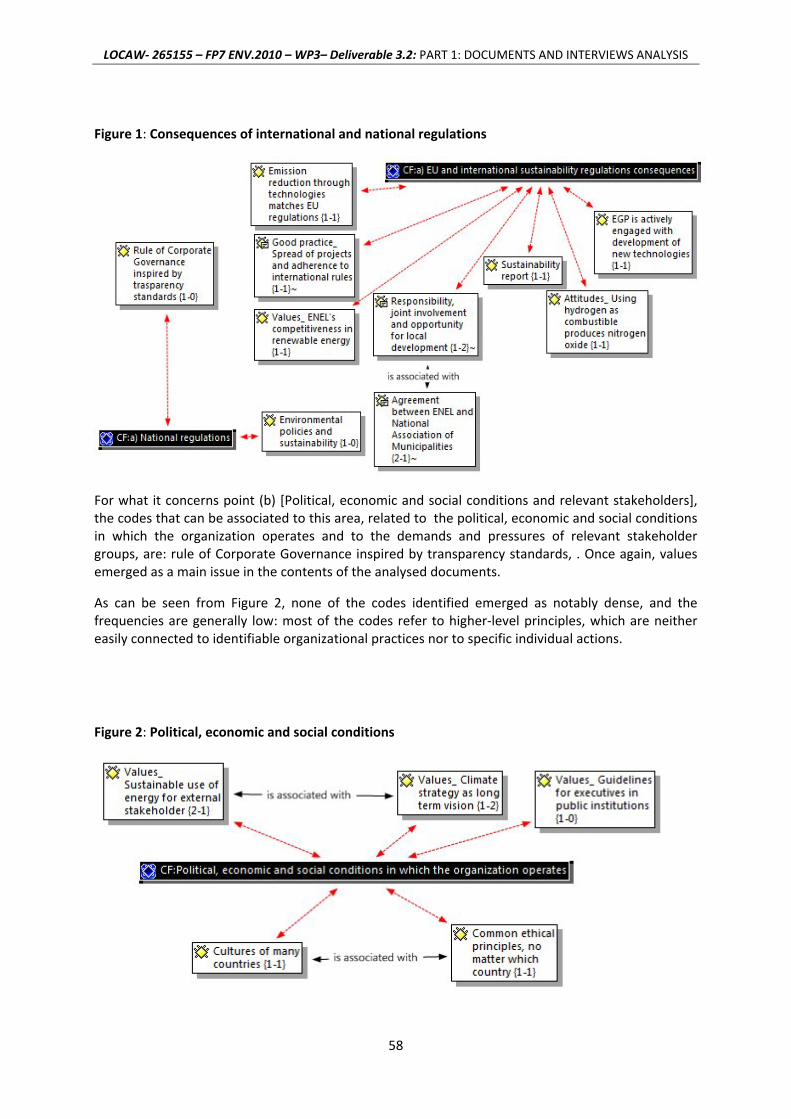
LOCAW‐ 265155 – FP7 ENV.2010 – WP3– Deliverable 3.2: PART 1: DOCUMENTS AND INTERVIEWS ANALYSIS
58
Figure 1: Consequences of international and national regulations
For what it concerns point (b) [Political, economic and social conditions and relevant stakeholders], the codes that can be associated to this area, related to the political, economic and social conditions in which the organization operates and to the demands and pressures of relevant stakeholder groups, are: rule of Corporate Governance inspired by transparency standards, . Once again, values emerged as a main issue in the contents of the analysed documents.
As can be seen from Figure 2, none of the codes identified emerged as notably dense, and the frequencies are generally low: most of the codes refer to higher‐level principles, which are neither easily connected to identifiable organizational practices nor to specific individual actions.
Figure 2: Political, economic and social conditions
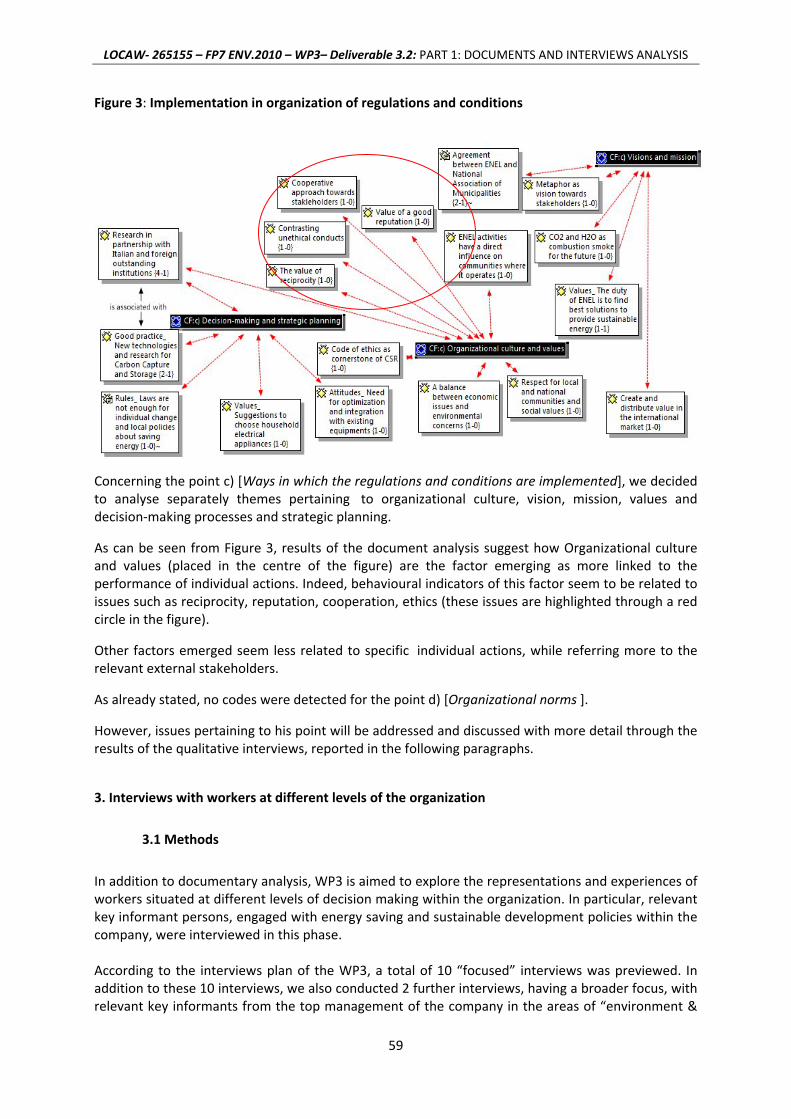
LOCAW‐ 265155 – FP7 ENV.2010 – WP3– Deliverable 3.2: PART 1: DOCUMENTS AND INTERVIEWS ANALYSIS
59
Figure 3: Implementation in organization of regulations and conditions
Concerning the point c) [Ways in which the regulations and conditions are implemented], we decided to analyse separately themes pertaining to organizational culture, vision, mission, values and decision‐making processes and strategic planning.
As can be seen from Figure 3, results of the document analysis suggest how Organizational culture and values (placed in the centre of the figure) are the factor emerging as more linked to the performance of individual actions. Indeed, behavioural indicators of this factor seem to be related to issues such as reciprocity, reputation, cooperation, ethics (these issues are highlighted through a red circle in the figure).
Other factors emerged seem less related to specific individual actions, while referring more to the relevant external stakeholders.
As already stated, no codes were detected for the point d) [Organizational norms ].
However, issues pertaining to his point will be addressed and discussed with more detail through the results of the qualitative interviews, reported in the following paragraphs.
3. Interviews with workers at different levels of the organization
3.1 Methods
In addition to documentary analysis, WP3 is aimed to explore the representations and experiences of workers situated at different levels of decision making within the organization. In particular, relevant key informant persons, engaged with energy saving and sustainable development policies within the company, were interviewed in this phase. According to the interviews plan of the WP3, a total of 10 “focused” interviews was previewed. In addition to these 10 interviews, we also conducted 2 further interviews, having a broader focus, with relevant key informants from the top management of the company in the areas of “environment &
LOCAW‐ 265155 – FP7 ENV.2010 – WP3– Deliverable 3.2: PART 1: DOCUMENTS AND INTERVIEWS ANALYSIS
60
safety” and “investor relations”, respectively. The decision to conduct these additional interviews was taken after some briefing talks with the contact persons from the company. These two interviews were mainly aimed at better understanding the general sustainable policies of the company. In their answers, these precious informants expressed the particular attention and the high sensitivity of EGP to environmental and sustainability issues, in particular for what it concerns the commitment for CO2 emission reduction. On the one hand, the investor relations manager underlined the importance of presenting the EGP company to their investors as a low‐carbon organization, with the aim of attracting investments in the stock market, in particular by ethic founds. The second interviewee, manager of the environment and safety sector of EGP, described their activity for lowering the environmental impact of EGP installations of energy production in Italian and foreign territories. An important task for the environment sector of EGP consists in mediating between the increased territorial demands for renewable energy supply and the territorial needs of different stakeholders at the community level, such as workers (e.g., fishermen, farmers, etc.), citizens, occupants as well as environmentalists, no‐profit associations and so on. Another important task for the environment sector of EGP is finding innovative systems to reuse the CO2 produced by the installations, even selling it to other business sectors where it is needed in the industrial production process (e.g. sparkling mineral water production). The interviews with these informers were therefore very useful, as they clearly showed how the concern for environmental sustainability, with particular reference to emission reduction, is central for EGP at both the level of the production process and management systems. The selection of the participants to be recruited for the 10 focused interviews was made in accordance with the management of EGP company, after one operative meeting that occurred between the CIRPA research staff and EGP Human resources management staff, also in accordance to the preliminary meetings, held in the earlier phases of the Locaw project, with the CSR top management of the entire ENEL group. A particular attention was used in order to ensure an adequate differentiation also in the role and responsibilities, within the organization, of the interviewed persons. These were all medium‐high management figures, coming from different professional and educational backgrounds. The 10 interviewees were all men, balanced for their age: under 35 = 2; 40‐45 = 5; 45‐50 = 2; over 55 = 1. Table 8 briefly reports the main roles and responsibilities of the ten interviewees. Table 8: Organizational positions and roles of the ten interviewees
1. EGP Manager for Union relationships 2. EGP Administration, finance and control 3. EGP Safety 4. EGP Manager for Planning, organization, and development 5. EGP Energy Management 6. EGP Operation and maintenance 7. EGP Operation and maintenance 8. ENEL C Sales Manager 9. ENEL ICT 10. EGP Engineering Manager
LOCAW‐ 265155 – FP7 ENV.2010 – WP3– Deliverable 3.2: PART 1: DOCUMENTS AND INTERVIEWS ANALYSIS
61
The interviews were conducted using the discussion track proposed by the WP3 leader, translated in Italian. The interviews were conducted following two progressive phases: a) In a first phase, a free discussion of some general aspects related to the issue of emission reduction policies in the company was conducted; b) In a second phase, more specific questions were made, focused on specific and concrete aspects related to the promotion and implementation of daily practices towards sustainability, among the employees of EGP.
After presenting the general objectives of LOCAW research, the respondent were asked to do a unique general discourse around some important and relatively general themes (first step), treating the 6 themes of the first interview phase. After this extensive discussion, where all the general themes were treated, the interviewer proceeded to the second phase of the interview. Here, 13 specific questions were administered and discussed, taking also into account the specific knowledge and competences of the respondents, as well as their roles, tasks, and responsibilities in the company. In many cases, the exact sequence previewed in the interview track was not followed strictu sensu, since the interviewer where more concerned in following the spontaneous flow of the themes emerged during the interview, without interrupting the logic of the discourse reported by the participants. Each interview lasted around 30‐45 minutes and it was audio‐recorded (after obtaining the informed consent from the interviewees) and transcribed in MS Word. Participants’ answers were subject to qualitative content analysis. The methodology for analysing the data gathered through these interviews is the same used for the documentary analysis, with a particular focus on the macro‐factors influencing everyday practices and behaviours in the workplace.
3.2 Results
From an initial overall qualitative analysis of the answers to the interviews, in general, it seems evident a substantial commitment and attention to CO2 emission reduction, mainly perceived as the core business of the EGP (i.e., producing clean energy from renewable sources). Such company's mission appears to influence the employees in their personal relationship with pro‐environmental behaviours in the workplace practices, so that it is likely to encounter an individual predisposition to perform more sustainable behaviours if they are suggested by the company. It seems that there are not many specific organizational formal rules or regulations, but many guidelines and some stimuli for good practices in the everyday life of the working routines, such as limiting the paper consumption (recycled paper and print b/w and double‐sided), inviting to not print emails or documents if it not necessary, taking care of switching off lights at the evening, placing containers for separate waste collection, promoting video‐conferences rather than work travels, providing staff shuttles from the airport to the office for the employees. The company periodically proposes contests for employees for innovative ideas and projects in terms of energy saving and efficiency. Information and knowledge about environmental issues and sustainability, as well as the contests for innovative projects, are frequently disseminated by organizational communication tools such as intranet or internal (local) journal. The interviewees have also brought out that some behaviours that should be implemented to reduce CO2 emissions at the personal level might be hindered by some structural barriers, such as the inefficiency of public transports in the city of Rome, the lack of a solid and shared formal regulation system, as well as the high costs to limit emissions that are seen as real organizational barriers. Among these last, it is worth to mention factors such as providing employees and managers with electric cars, renovate the office buildings to enhance its efficiency in terms of energy consumption and dispersion (for example through thermal insulation, advanced lighting, etc).
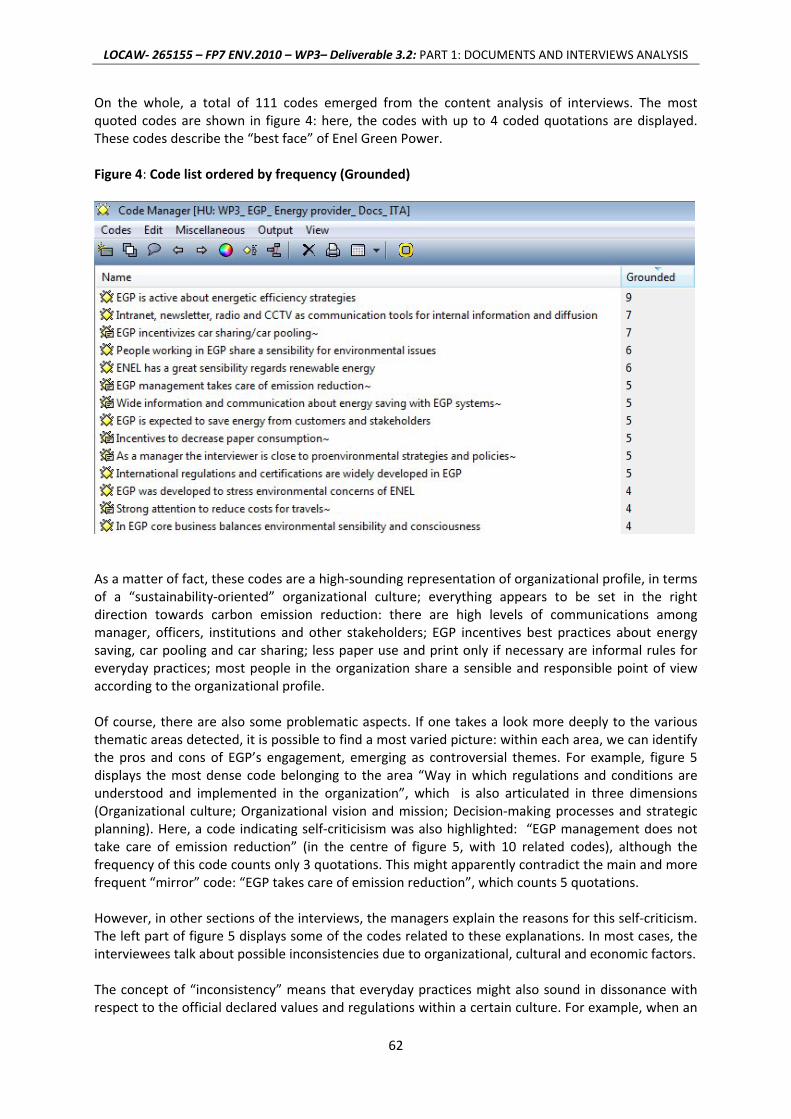
LOCAW‐ 265155 – FP7 ENV.2010 – WP3– Deliverable 3.2: PART 1: DOCUMENTS AND INTERVIEWS ANALYSIS
62
On the whole, a total of 111 codes emerged from the content analysis of interviews. The most quoted codes are shown in figure 4: here, the codes with up to 4 coded quotations are displayed. These codes describe the “best face” of Enel Green Power. Figure 4: Code list ordered by frequency (Grounded)
As a matter of fact, these codes are a high‐sounding representation of organizational profile, in terms of a “sustainability‐oriented” organizational culture; everything appears to be set in the right direction towards carbon emission reduction: there are high levels of communications among manager, officers, institutions and other stakeholders; EGP incentives best practices about energy saving, car pooling and car sharing; less paper use and print only if necessary are informal rules for everyday practices; most people in the organization share a sensible and responsible point of view according to the organizational profile. Of course, there are also some problematic aspects. If one takes a look more deeply to the various thematic areas detected, it is possible to find a most varied picture: within each area, we can identify the pros and cons of EGP’s engagement, emerging as controversial themes. For example, figure 5 displays the most dense code belonging to the area “Way in which regulations and conditions are understood and implemented in the organization”, which is also articulated in three dimensions (Organizational culture; Organizational vision and mission; Decision‐making processes and strategic planning). Here, a code indicating self‐criticisism was also highlighted: “EGP management does not take care of emission reduction” (in the centre of figure 5, with 10 related codes), although the frequency of this code counts only 3 quotations. This might apparently contradict the main and more frequent “mirror” code: “EGP takes care of emission reduction”, which counts 5 quotations. However, in other sections of the interviews, the managers explain the reasons for this self‐criticism. The left part of figure 5 displays some of the codes related to these explanations. In most cases, the interviewees talk about possible inconsistencies due to organizational, cultural and economic factors. The concept of “inconsistency” means that everyday practices might also sound in dissonance with respect to the official declared values and regulations within a certain culture. For example, when an
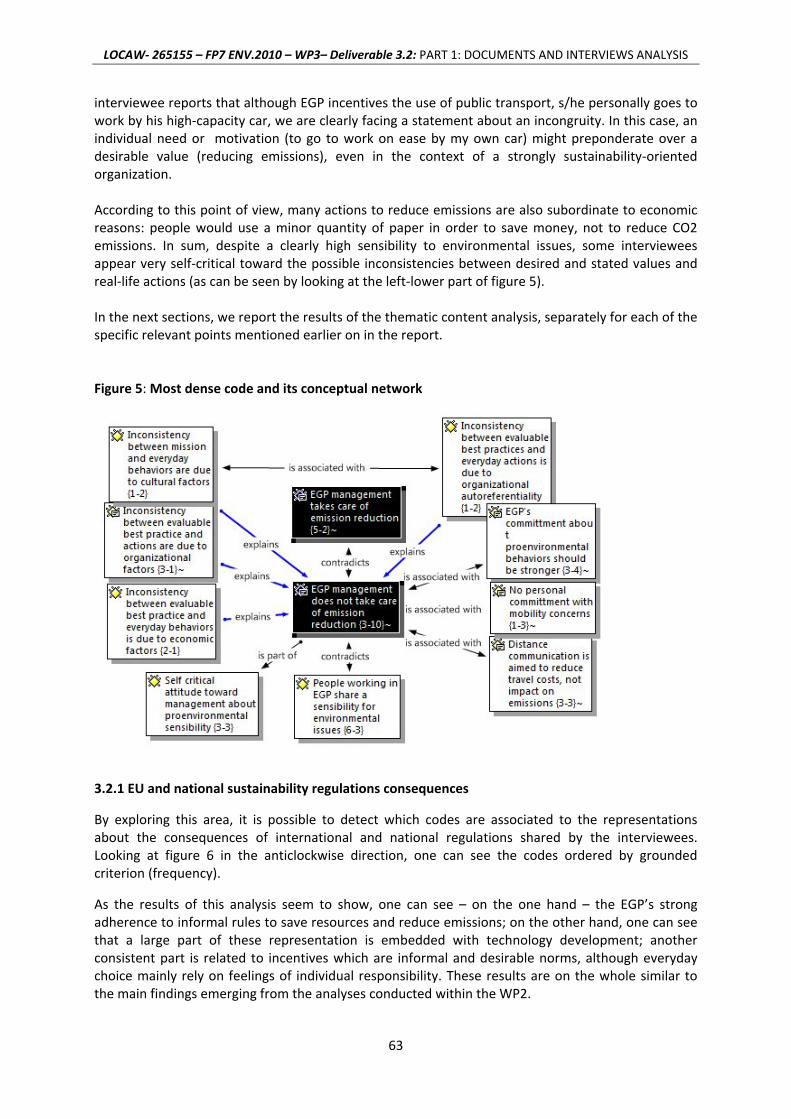
LOCAW‐ 265155 – FP7 ENV.2010 – WP3– Deliverable 3.2: PART 1: DOCUMENTS AND INTERVIEWS ANALYSIS
63
interviewee reports that although EGP incentives the use of public transport, s/he personally goes to work by his high‐capacity car, we are clearly facing a statement about an incongruity. In this case, an individual need or motivation (to go to work on ease by my own car) might preponderate over a desirable value (reducing emissions), even in the context of a strongly sustainability‐oriented organization. According to this point of view, many actions to reduce emissions are also subordinate to economic reasons: people would use a minor quantity of paper in order to save money, not to reduce CO2 emissions. In sum, despite a clearly high sensibility to environmental issues, some interviewees appear very self‐critical toward the possible inconsistencies between desired and stated values and real‐life actions (as can be seen by looking at the left‐lower part of figure 5). In the next sections, we report the results of the thematic content analysis, separately for each of the specific relevant points mentioned earlier on in the report. Figure 5: Most dense code and its conceptual network
3.2.1 EU and national sustainability regulations consequences
By exploring this area, it is possible to detect which codes are associated to the representations about the consequences of international and national regulations shared by the interviewees. Looking at figure 6 in the anticlockwise direction, one can see the codes ordered by grounded criterion (frequency).
As the results of this analysis seem to show, one can see – on the one hand – the EGP’s strong adherence to informal rules to save resources and reduce emissions; on the other hand, one can see that a large part of these representation is embedded with technology development; another consistent part is related to incentives which are informal and desirable norms, although everyday choice mainly rely on feelings of individual responsibility. These results are on the whole similar to the main findings emerging from the analyses conducted within the WP2.
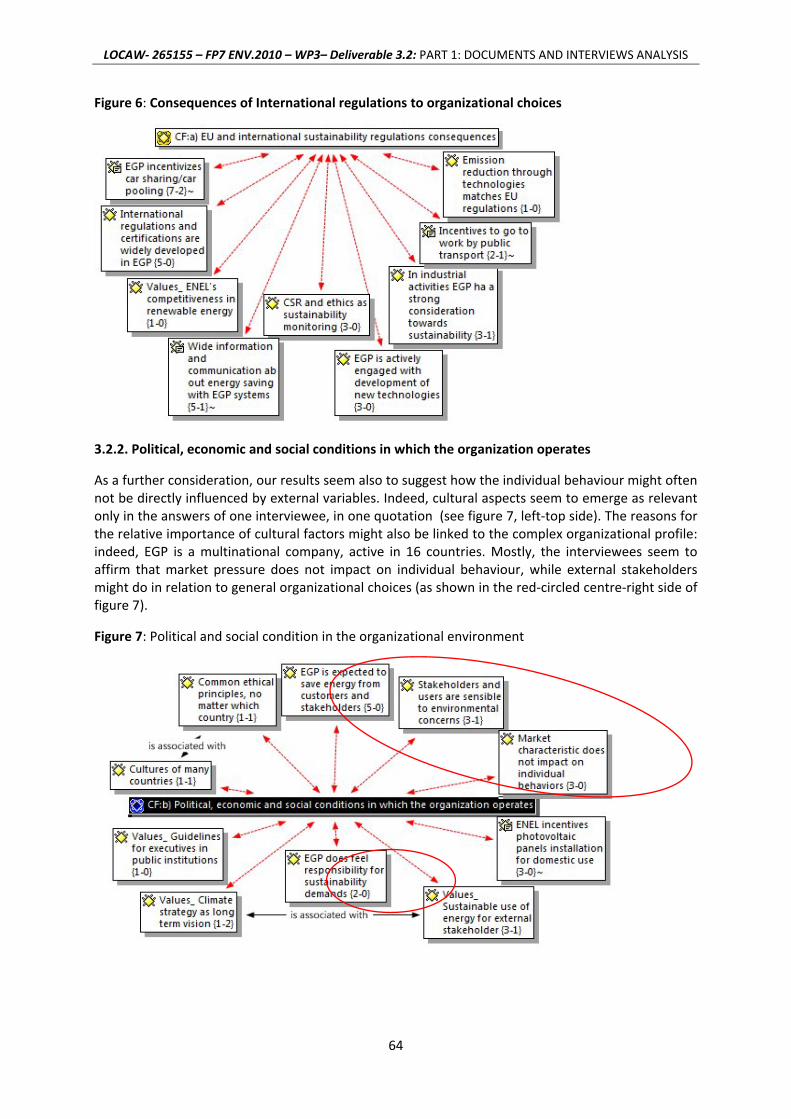
LOCAW‐ 265155 – FP7 ENV.2010 – WP3– Deliverable 3.2: PART 1: DOCUMENTS AND INTERVIEWS ANALYSIS
64
Figure 6: Consequences of International regulations to organizational choices
3.2.2. Political, economic and social conditions in which the organization operates
As a further consideration, our results seem also to suggest how the individual behaviour might often not be directly influenced by external variables. Indeed, cultural aspects seem to emerge as relevant only in the answers of one interviewee, in one quotation (see figure 7, left‐top side). The reasons for the relative importance of cultural factors might also be linked to the complex organizational profile: indeed, EGP is a multinational company, active in 16 countries. Mostly, the interviewees seem to affirm that market pressure does not impact on individual behaviour, while external stakeholders might do in relation to general organizational choices (as shown in the red‐circled centre‐right side of figure 7).
Figure 7: Political and social condition in the organizational environment
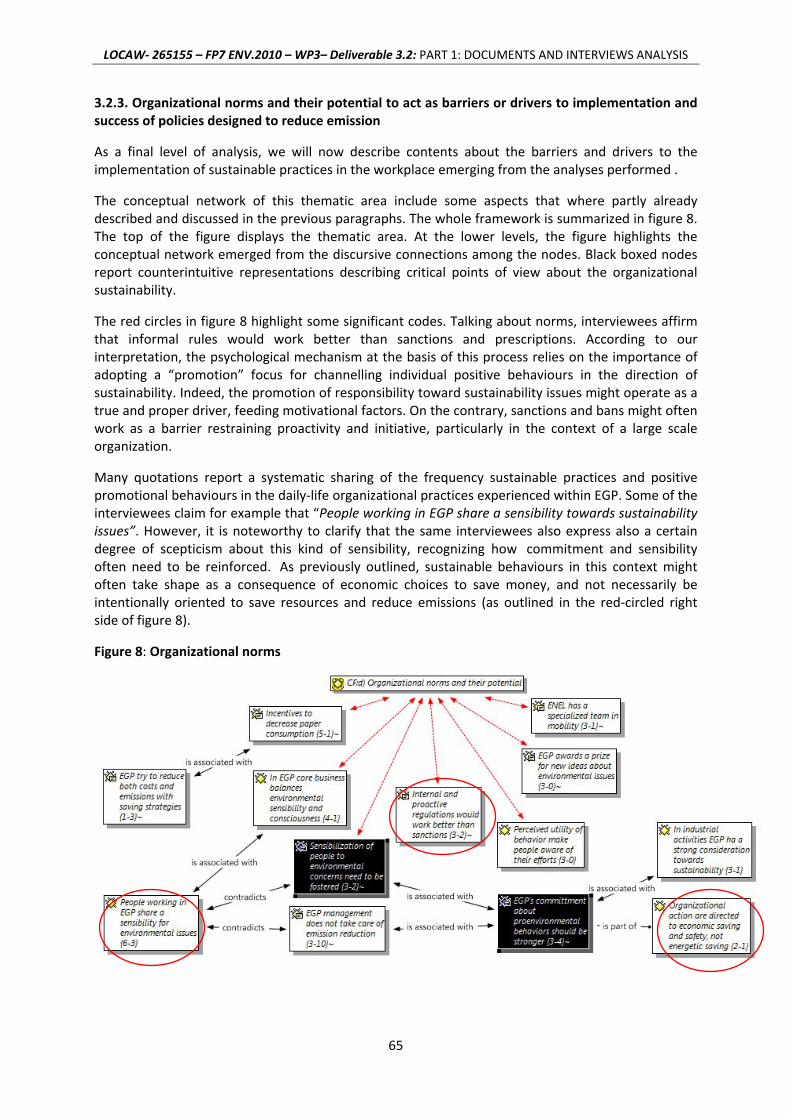
LOCAW‐ 265155 – FP7 ENV.2010 – WP3– Deliverable 3.2: PART 1: DOCUMENTS AND INTERVIEWS ANALYSIS
65
3.2.3. Organizational norms and their potential to act as barriers or drivers to implementation and success of policies designed to reduce emission
As a final level of analysis, we will now describe contents about the barriers and drivers to the implementation of sustainable practices in the workplace emerging from the analyses performed .
The conceptual network of this thematic area include some aspects that where partly already described and discussed in the previous paragraphs. The whole framework is summarized in figure 8. The top of the figure displays the thematic area. At the lower levels, the figure highlights the conceptual network emerged from the discursive connections among the nodes. Black boxed nodes report counterintuitive representations describing critical points of view about the organizational sustainability.
The red circles in figure 8 highlight some significant codes. Talking about norms, interviewees affirm that informal rules would work better than sanctions and prescriptions. According to our interpretation, the psychological mechanism at the basis of this process relies on the importance of adopting a “promotion” focus for channelling individual positive behaviours in the direction of sustainability. Indeed, the promotion of responsibility toward sustainability issues might operate as a true and proper driver, feeding motivational factors. On the contrary, sanctions and bans might often work as a barrier restraining proactivity and initiative, particularly in the context of a large scale organization.
Many quotations report a systematic sharing of the frequency sustainable practices and positive promotional behaviours in the daily‐life organizational practices experienced within EGP. Some of the interviewees claim for example that “People working in EGP share a sensibility towards sustainability issues”. However, it is noteworthy to clarify that the same interviewees also express also a certain degree of scepticism about this kind of sensibility, recognizing how commitment and sensibility often need to be reinforced. As previously outlined, sustainable behaviours in this context might often take shape as a consequence of economic choices to save money, and not necessarily be intentionally oriented to save resources and reduce emissions (as outlined in the red‐circled right side of figure 8).
Figure 8: Organizational norms

LOCAW‐ 265155 – FP7 ENV.2010 – WP3– Deliverable 3.2: PART 1: DOCUMENTS AND INTERVIEWS ANALYSIS
66
4. Conclusions
Taken together, the results of both the document analysis and focused interviews seem to confirm a pattern of which was in part already emerged from the analyses conducted in the WP2. In fact, the peculiar characteristic of the company chosen as case study, which is intrinsically connected to aims of carbon emission reduction and sustainability, because of the main industrial mission of the company (that is, producing energy from renewable sources) highlight a company organizational culture which is formally strongly oriented towards the environment, both in the official documents that the company displays to the public, and in the shared perceptions, knowledge and values of its top and medium management. On the one hand, this can be seen as an ideal situation for promoting the performance of individual daily practices of emission reduction in large sectors of the company employment. In fact, it is easy and frequent for almost any member of the organization to be exposed or have access to relevant information supporting the importance and the desirability of carbon emission reduction. However, as it emerges clearly from the interviews conducted, even in this apparently ideal situation, individual choices need to be adequately supported and reinforced from the organizational side, if one wants pro‐sustainability options to become part of habitual routines in the workplace, and possibly to spill over even outside the strict organizational environment.
An important issue which seem also to merge rather clearly from the analyses conducted is related to the possible congruence between environmental and economic aims in the contexts of advanced industrial production and high‐technology business sectors. Contrary to a widespread belief shared among the general public environmental and business aims might not necessarily collide. Although this interdependency is one of the pillars of the sustainable development concept as defined by the scientific, political and management communities at the international levels, ideological views are often used to advocate its counter arguments. The importance of eliciting the preference of the so‐called “ethic” investment funds in periods of strong financial in the stock markets worldwide is just an example of many possible situations where, either intentionally or not, economic and environmental motives might march side by side and mutually sustain each other in the paths towards more sustainable lifestyles.
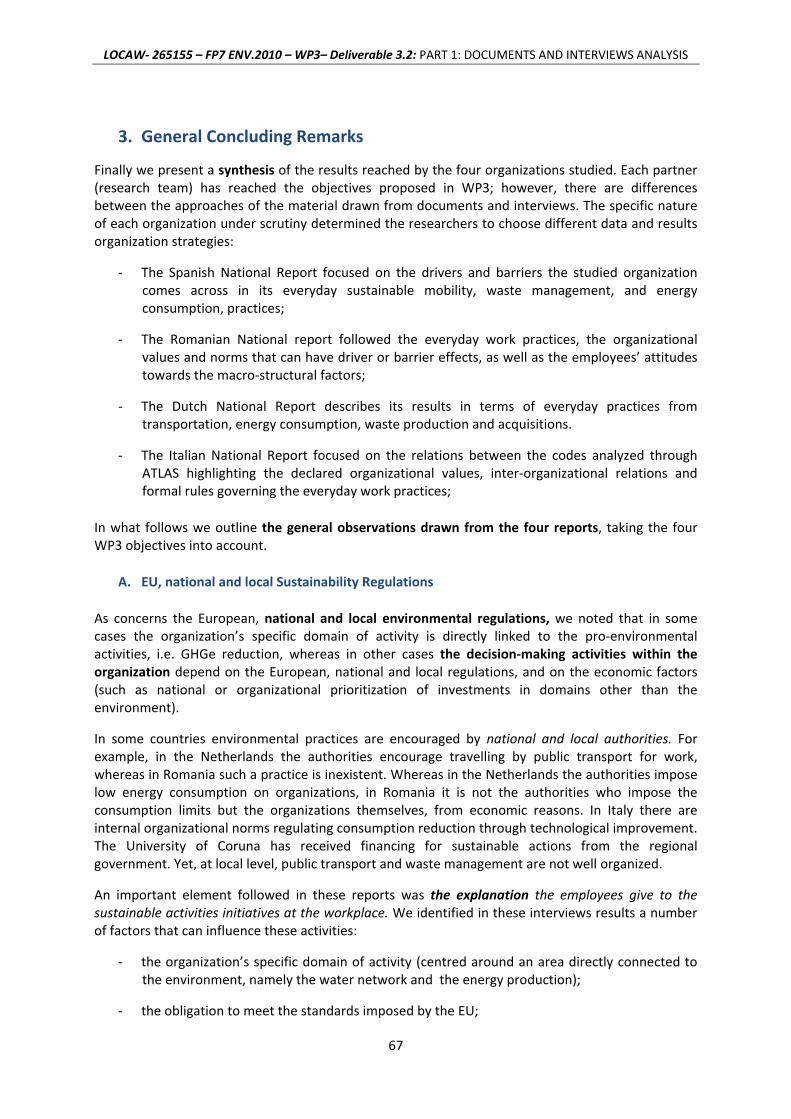
LOCAW‐ 265155 – FP7 ENV.2010 – WP3– Deliverable 3.2: PART 1: DOCUMENTS AND INTERVIEWS ANALYSIS
67
3. General Concluding Remarks
Finally we present a synthesis of the results reached by the four organizations studied. Each partner (research team) has reached the objectives proposed in WP3; however, there are differences between the approaches of the material drawn from documents and interviews. The specific nature of each organization under scrutiny determined the researchers to choose different data and results organization strategies:
‐ The Spanish National Report focused on the drivers and barriers the studied organization comes across in its everyday sustainable mobility, waste management, and energy consumption, practices;
‐ The Romanian National report followed the everyday work practices, the organizational values and norms that can have driver or barrier effects, as well as the employees’ attitudes towards the macro‐structural factors;
‐ The Dutch National Report describes its results in terms of everyday practices from transportation, energy consumption, waste production and acquisitions.
‐ The Italian National Report focused on the relations between the codes analyzed through ATLAS highlighting the declared organizational values, inter‐organizational relations and formal rules governing the everyday work practices;
In what follows we outline the general observations drawn from the four reports, taking the four WP3 objectives into account.
A. EU, national and local Sustainability Regulations
As concerns the European, national and local environmental regulations, we noted that in some cases the organization’s specific domain of activity is directly linked to the pro‐environmental activities, i.e. GHGe reduction, whereas in other cases the decision‐making activities within the organization depend on the European, national and local regulations, and on the economic factors (such as national or organizational prioritization of investments in domains other than the environment).
In some countries environmental practices are encouraged by national and local authorities. For example, in the Netherlands the authorities encourage travelling by public transport for work, whereas in Romania such a practice is inexistent. Whereas in the Netherlands the authorities impose low energy consumption on organizations, in Romania it is not the authorities who impose the consumption limits but the organizations themselves, from economic reasons. In Italy there are internal organizational norms regulating consumption reduction through technological improvement. The University of Coruna has received financing for sustainable actions from the regional government. Yet, at local level, public transport and waste management are not well organized.
An important element followed in these reports was the explanation the employees give to the sustainable activities initiatives at the workplace. We identified in these interviews results a number of factors that can influence these activities:
‐ the organization’s specific domain of activity (centred around an area directly connected to the environment, namely the water network and the energy production);
‐ the obligation to meet the standards imposed by the EU;
LOCAW‐ 265155 – FP7 ENV.2010 – WP3– Deliverable 3.2: PART 1: DOCUMENTS AND INTERVIEWS ANALYSIS
68
‐ the eligibility for accessing European funds;
‐ national standard of living (based on the premise that a rich country can afford to invest in the environment, regardless of the specific character of the company);
‐ general level of awareness in the society in general and among the employees in particular, about environmental issues (the failure to promote environmental norms and behaviours);
‐ the need to possess an exemplary image in front of the general public (National Institutions, such as the Mayoralty, or the University);
‐ The organization offers its employees a number of sustainable behaviour alternatives.
In the report regarding the company Enel Green Power the economic and the environmental reasons appear as congruent, the interviewees deeming them interdependent, and as contributing together to the development of a sustainable lifestyle. Yet this development can only be achieved in the industrial production and advanced technology sectors.
The Social Council of the University of Coruna makes efforts to render the environmental thinking and the economic criterion compatible, and to integrate the environmental actions into the top managers’ economic thinking. In general, the opinion of the interviewed employees is that the environmental regulations are clear and that they are implemented into organizations. They stressed their wish to implement more sustainable practices at local level and formulated expectations from the local authorities, whereas at the European level they wish a harmonization between the EU laws and the national laws along two dimensions: vertical, for each domain, and horizontal, as harmonization of inter‐domain laws.
Another theme of the interviews is that concerning the employees/public awareness towards environmental practices. The environmental regulations have a strong impact here as well, for the environmental standard ISO14001 implemented in the organizations is perceived by some employees as a model for sustainable practices. The power of the top management‘s example, as well as that of local authorities are also considered essential to the increase of awareness. The report about the University of Coruna suggests that the most important factors that contribute to the improvement of sustainable behaviour are the environmental awareness campaigns and the environmental policies adopted by institutions with powerful social impact.
B. Political, economic, and social conditions in which the organization operates and of demands and pressures of relevant stakeholder groups
The reports don’t refer directly to the political context in which organizations carry out their activity. We can offer a number of possible explanations to this finding: the organization’s top managers’ wish to maintain a positive image of their relationship with the authorities; the lack of information about the political decisions with impact on the organization; the confusion generated by the WP3 interview guide.
The characteristics of the market are defining: the organizations that hold the monopoly do not feel under other institutions’, or media, pressure over environmental decisions (see Aquatim) whereas those operating within a competitive environment feel under the stakeholders’ or customers’ pressure (see Enel Green Power). But the market does not have an impact on the individual behaviour.
LOCAW‐ 265155 – FP7 ENV.2010 – WP3– Deliverable 3.2: PART 1: DOCUMENTS AND INTERVIEWS ANALYSIS
69
The dominant opinion is that GHG reduction can be realized especially through advanced technologies. The investigation of the environmental side of the companies’ activity shows that the economic motivation has priority, whereas the environmental motivation is at best of secondary importance. At the same time, most interviewees share the idea that many environmental practices are also based on economic reasons (e.g. the use of paper—in the Italian report, or the use of bicycles and public transport—in the Dutch report).
With respect to the social context, the reports refer to the multicultural idea (e.g. Enel—multinational organization) and to differences between environmental behaviours specific to urban and rural populations, younger and older, respectively. What is also interesting is the attitude among the Aquatim employees towards the legislative system: even though they perceive it as restrictive—with some laws still not harmonized—they express a need for rules when it comes to environmental actions. As for the relationships with other institutions, the findings show that these can support or block the organizations’ pro‐environmental actions. The Aquatim employees stressed the importance of the company’s relationship with the City of Timisoara mayoralty which plays a significant role in increasing the company’s eligibility for EU funding. Similarly, the implementation of sustainable actions at the University of Coruna depends on governmental bodies’, and stakeholders’ co‐participation in the decisional process. In case of Aquatim, our finding was that good relationships with the authorities represent an important but not sufficient condition for implementing environmental projects: each project needs special lobbying. In case of Groningen mayoralty, we note a constant interest of the municipal authority in supporting sustainability actions.
C. The ways in which regulations and external conditions are understood and implemented in the organization
At the organizational level, the environmental regulations materialized in environmental management systems and specialized departments. For example, at Aquatim the environmental department is responsible for initiating sustainable actions. At the same company the integrated management system represents a model that needs to be followed by employees in order to increase their environmental awareness.
The sustainable organizational practices are not known by the general public unless the organization adopts among its objectives the increase of public awareness towards sustainable practices (for example, the mayoralty of Groningen seeks to make more transparent the waste transportation and management practices in order to “spread” them among the inhabitants of the city). The University of Coruna is considered an exemplary public institution by the city inhabitants, but its sustainable practices are not visible due to a wanting communication system.
With regard to Enel, the organizational values determine the diffusion of sustainable practices. The Enel employees give priority to values such as reciprocity, reputation, co‐operation, and ethics. The company’s mission—provided that it is pro‐environmental—has an important role in making the employees more receptive to sustainable behavior. In such a context, the top‐management is more open to the employees’ suggestions for sustainable projects and practices (for example, at Aquatim).
We also noted that both in case of the Mayoralty of Groningen and Aquatim there were leadership initiatives that initially increased the employees discomfort but further on led to positive results from environmental point of view. For example, the mayoralty’s employees are not refunded for car parking, and the institution has no private parking spaces; the delegates’ transport by car is only refunded if there was no other way of travelling. Unfortunately, in Timisoara the alternative transport modes are not encouraged, whereas in Groningen travelling costs by public transport are refunded and there are parking facilities for bicycles. In Coruna, where the University does not
LOCAW‐ 265155 – FP7 ENV.2010 – WP3– Deliverable 3.2: PART 1: DOCUMENTS AND INTERVIEWS ANALYSIS
70
encourage the use of public transport, the use of private cars increases (in Timisoara it decreases due to the lack of parking spaces).
In conclusion, a powerful extrinsic motivation is needed in order to increase the sustainable practices frequency among the employees.
D. Organizational norms and their potential to act as barriers or drivers towards the implementation and success of policies designed to reduce GHG emissions
The results under this heading are drawn only from interviews analyses, and reports about Enel Green Power, Italy, and Aquatim, Romania. In general, the employees observe the rules imposed by the organization and comply with the internal behavioural norms at workplace. The employees of the organizations analyzed are highly receptive to environmental problems (this can be a result of the organizational culture, but can also be a feature the interviewees already had when they joined the organization). The Italian report highlights the role and action power of the implicit pro‐active norms stressing that in case of pro‐environmental behaviour they are more effective than the sanctions.
There are various practices within the organizations (under focus) that promote pro‐environmental behaviour: actions, campaigns, awards.
*** In conclusions, the factors that can influence sustainable activities initiatives at the workplace are:
the organization’s specific domain of activity; the obligation to meet the standards imposed by the EU; the eligibility for accessing European funds; national standard of living; general level of awareness in the society in general and among the employees in
particular, about environmental issues; the need to possess an exemplary image in front of the general public (National
Institutions, such as the Municipality or the University); the organization offers its employees a number of sustainable behavior alternatives.
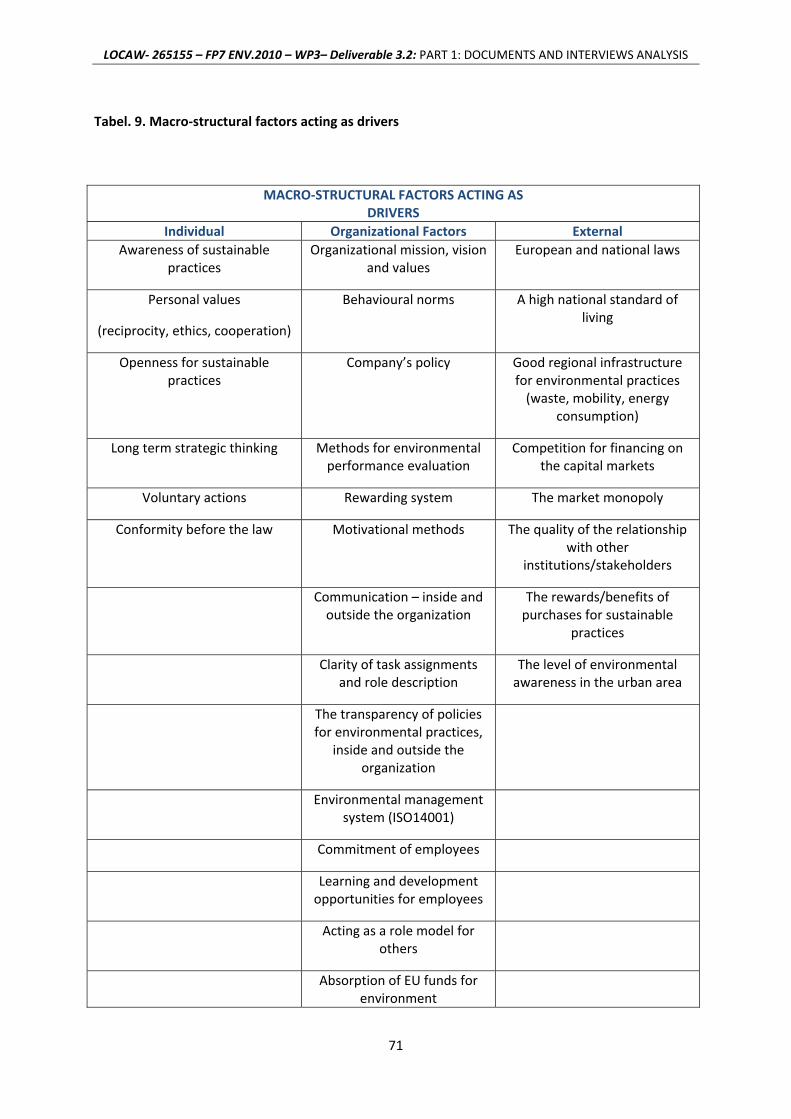
LOCAW‐ 265155 – FP7 ENV.2010 – WP3– Deliverable 3.2: PART 1: DOCUMENTS AND INTERVIEWS ANALYSIS
71
Tabel. 9. Macro‐structural factors acting as drivers
MACRO‐STRUCTURAL FACTORS ACTING AS DRIVERS
Individual Organizational Factors External Awareness of sustainable
practices Organizational mission, vision
and values European and national laws
Personal values
(reciprocity, ethics, cooperation)
Behavioural norms A high national standard of living
Openness for sustainable practices
Company’s policy
Good regional infrastructure for environmental practices (waste, mobility, energy
consumption)
Long term strategic thinking Methods for environmental performance evaluation
Competition for financing on the capital markets
Voluntary actions Rewarding system The market monopoly
Conformity before the law Motivational methods The quality of the relationship with other
institutions/stakeholders
Communication – inside and outside the organization
The rewards/benefits of purchases for sustainable
practices
Clarity of task assignments and role description
The level of environmental awareness in the urban area
The transparency of policies for environmental practices,
inside and outside the organization
Environmental management system (ISO14001)
Commitment of employees
Learning and development opportunities for employees
Acting as a role model for others
Absorption of EU funds for environment
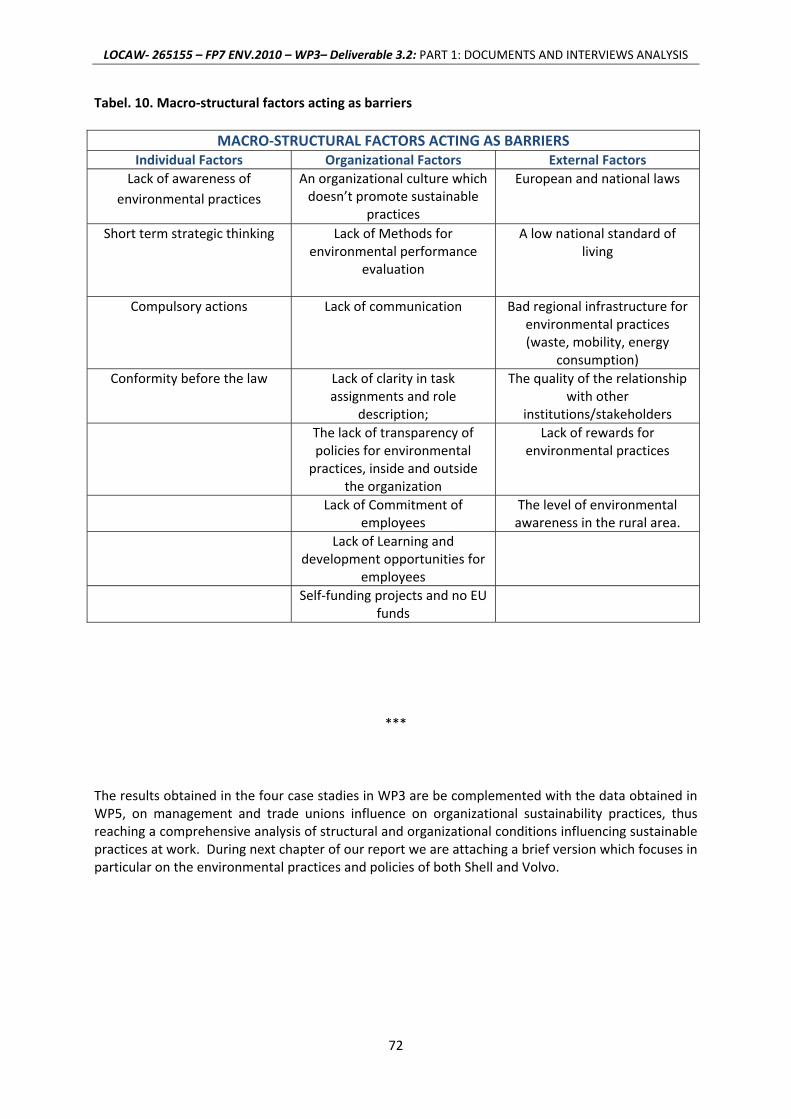
LOCAW‐ 265155 – FP7 ENV.2010 – WP3– Deliverable 3.2: PART 1: DOCUMENTS AND INTERVIEWS ANALYSIS
72
Tabel. 10. Macro‐structural factors acting as barriers
MACRO‐STRUCTURAL FACTORS ACTING AS BARRIERS Individual Factors Organizational Factors External Factors
Lack of awareness of environmental practices
An organizational culture which doesn’t promote sustainable
practices
European and national laws
Short term strategic thinking Lack of Methods for
environmental performance evaluation
A low national standard of living
Compulsory actions Lack of communication Bad regional infrastructure for
environmental practices (waste, mobility, energy
consumption) Conformity before the law Lack of clarity in task
assignments and role description;
The quality of the relationship with other
institutions/stakeholders The lack of transparency of
policies for environmental practices, inside and outside
the organization
Lack of rewards for environmental practices
Lack of Commitment of employees
The level of environmental awareness in the rural area.
Lack of Learning and development opportunities for
employees
Self‐funding projects and no EU funds
***
The results obtained in the four case stadies in WP3 are be complemented with the data obtained in WP5, on management and trade unions influence on organizational sustainability practices, thus reaching a comprehensive analysis of structural and organizational conditions influencing sustainable practices at work. During next chapter of our report we are attaching a brief version which focuses in particular on the environmental practices and policies of both Shell and Volvo.
LOCAW‐ 265155 – FP7 ENV.2010 – WP3– Deliverable 3.2: PART 1: DOCUMENTS AND INTERVIEWS ANALYSIS
73
Chapter 4: Report on the external conditions influencing sustainable practices and behaviours ‐ Volvo AB (Sweden) and Shell UK
Aina Tollefsen, Nora Räthzel, David Uzzell and Tommy Jensen
1. Introduction Work Package 5 produced two reports on the development and structure of the two companies which are the focus of their empirical research – Volvo AB and Royal Dutch Shell. Prior to conducting detailed interviews with employees it was decided to undertake an historical and document analysis of the origins of these massive TNCs, how production is organised and how this impacts on the companies’ climate change and sustainability policies and practices, opportunities and constraints. In the case of Volvo AB, the context included a discussion of the transformations from craft production to mass production and finally to lean production in the automotive industry. Volvo AB, is the world’s second largest producer of commercial vehicles with headquarters in Gothenburg, Sweden. The parent company of the Shell group is Royal Dutch Shell plc, a global group of energy and petrochemical companies whose headquarters are in The Hague but which is incorporated in England and Wales. In the case of Royal Dutch Shell, the analysis situated the company in the historical development of the oil industry. Royal Dutch Shell is ranked as the second largest non‐financial company in the world. The full Reports were published as LOCAW documents: WP5.1: Results of the Document Analysis Concerning GHG Emissions in the Production Process at the Workplace: The Volvo Group – History and Structure of a Swedish Transnational Corporation and WP5.1: Royal Dutch Shell: from decentralization to consolidation within the global oil industry In this Report, we only include the concluding sections of the two aforementioned reports, which address the environmental policies and programmes of Volvo AB and Shell UK. 2. Volvo AB: The environmental programme at AB Volvo Lastvagnar, Umeå Many activities are involved when the cabs for Volvo trucks are produced. Activities include shearing, slitting, pressing, machining and welding sheet metal into finished truck cabs. Thereafter, the preparation of surface, sealing, coating and interior fitting are undertaken. These activities are so‐called internal processes that take place in Umeå, at Volvo Umeverken. As stated in Volvo’s environmental report, there are several pollutants resulting from their truck production: external noise, emissions of organic solvents into the air from paint, dust emissions from welding and grinding, the emission of gases from the thermal combustion of liquefied petroleum gas and solvent, and the discharge of polluted wastewater. Dust from the work of welding and grinding is cleaned in fabric filters. Process air from the painting activity, with solvent‐borne coatings, is cleaned through an air purification plant (known as KPR). Concentrates from the purification plant and air from the paint ovens are cleaned in an oven (known
LOCAW‐ 265155 – FP7 ENV.2010 – WP3– Deliverable 3.2: PART 1: DOCUMENTS AND INTERVIEWS ANALYSIS
74
as RTO) with regenerative combustion. Process wastewater is treated in an internal treatment plant before discharge to the Ume River. Water from the Ume River is taken and used in the plant operations for cooling and for the finishing process. “Close to the Ume River and the Volvo factory there is an underground ice river that maintains a constant cold temperature come summer or winter. The icy water from this river is pumped via a two kilometre long pipe into the factory’s own system. This water is used in various cooling systems and has replaced many of the cab factory’s refrigeration plants which otherwise used cooling agents such as Freon. The biggest consumer of cooling water is the dehumidification of the air that is fed to the paint‐boxes in the paintshop. The first supply of ice‐river water reached the factory about a year ago, and its cooling effect corresponds to 3000 kilowatts.” (Volvo AB Environmental Press release 2009). In the summer water from wells upstream of the Ume River is used as a complement to the river's water. Cooling systems are separate systems with heat exchangers and cooling water is led directly back to the river via the normal water system (as used by the city of Umeå). Source separations of waste products are introduced and recyclable waste is sent to companies for recycling. Since 1998 the operation at Volvo Umeverken is ISO14001: 2004 certified.4 Environmental work and facts Regarding energy Volvo Trucks as a whole have set ambitious targets for Co2 emissions both in respect to fuel consumption on the road as well as emissions of carbon dioxide during the production process. As reported5 energy consumption and carbon dioxide emissions per truck built dropped by 30 percent between 2001 and 2005. At the same time, Volvo’s goal is to terminate the use of oil and coal for heating purposes entirely. Volvo states that in the longer term, all production plants shall be entirely carbon dioxide‐neutral6. In 2007 Volvo Trucks announced that they had developed the world’s first carbon dioxide neutral automotive plant in Ghent, Belgium. This factory has invested in wind power and a biofuel plant to produce electricity and heat, which will result in an annual carbon dioxide emissions reduction of 10,000 tonnes7. In 2010 the intention was expressed to make three Swedish plants, in Tuve, Vara and in Umeå 100 percent carbon dioxide‐neutral. At the beginning of 2011, Volvo declared that Tuve had achieved this goal8. In Umeå the goal is almost achieved, with 90 percent of the energy consumption consisting of renewable energy.9 However, this calculation includes only those activities carried out in the Umeå plant directly. Other activities and processes are generally not part of the calculations. For example, raw material and semi‐manufactured components that are delivered to Umeå and the transport of completely assembled cabs, sent by rail to their final assembly plants in Sweden and Belgium (i.e.,where cabs are mounted on the chassis) are not taken into account. Neither are the flows of painted cab structures
4 Miljörapport 2010, Volvo Lastvagnar AB, Umeå 5 Volvo Trucks and the environment, 2007 6 Volvo Group Sustainability Report 2010 7 Volvo Group Sustainable Report 2010 8 Volvo Group Sustainability Report 2010 9 Miljörapport 2010, Volvo Lastvagnar AB, Umeå
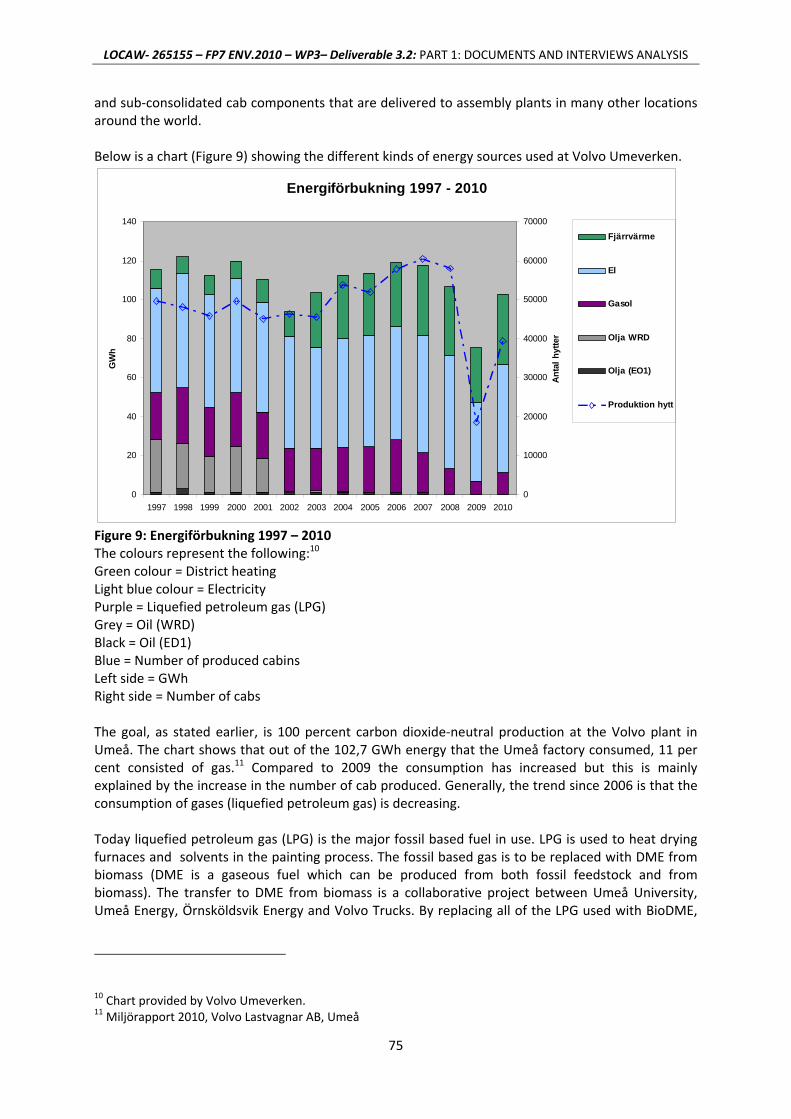
LOCAW‐ 265155 – FP7 ENV.2010 – WP3– Deliverable 3.2: PART 1: DOCUMENTS AND INTERVIEWS ANALYSIS
75
and sub‐consolidated cab components that are delivered to assembly plants in many other locations around the world. Below is a chart (Figure 9) showing the different kinds of energy sources used at Volvo Umeverken.
Energiförbukning 1997 - 2010
0
20
40
60
80
100
120
140
1997 1998 1999 2000 2001 2002 2003 2004 2005 2006 2007 2008 2009 2010
GW
h
0
10000
20000
30000
40000
50000
60000
70000
Ant
al h
ytte
r
Fjärrvärme
El
Gasol
Olja WRD
Olja (EO1)
Produktion hytt
Figure 9: Energiförbukning 1997 – 2010 The colours represent the following:10 Green colour = District heating Light blue colour = Electricity Purple = Liquefied petroleum gas (LPG) Grey = Oil (WRD) Black = Oil (ED1) Blue = Number of produced cabins Left side = GWh Right side = Number of cabs The goal, as stated earlier, is 100 percent carbon dioxide‐neutral production at the Volvo plant in Umeå. The chart shows that out of the 102,7 GWh energy that the Umeå factory consumed, 11 per cent consisted of gas.11 Compared to 2009 the consumption has increased but this is mainly explained by the increase in the number of cab produced. Generally, the trend since 2006 is that the consumption of gases (liquefied petroleum gas) is decreasing. Today liquefied petroleum gas (LPG) is the major fossil based fuel in use. LPG is used to heat drying furnaces and solvents in the painting process. The fossil based gas is to be replaced with DME from biomass (DME is a gaseous fuel which can be produced from both fossil feedstock and from biomass). The transfer to DME from biomass is a collaborative project between Umeå University, Umeå Energy, Örnsköldsvik Energy and Volvo Trucks. By replacing all of the LPG used with BioDME,
10 Chart provided by Volvo Umeverken. 11 Miljörapport 2010, Volvo Lastvagnar AB, Umeå
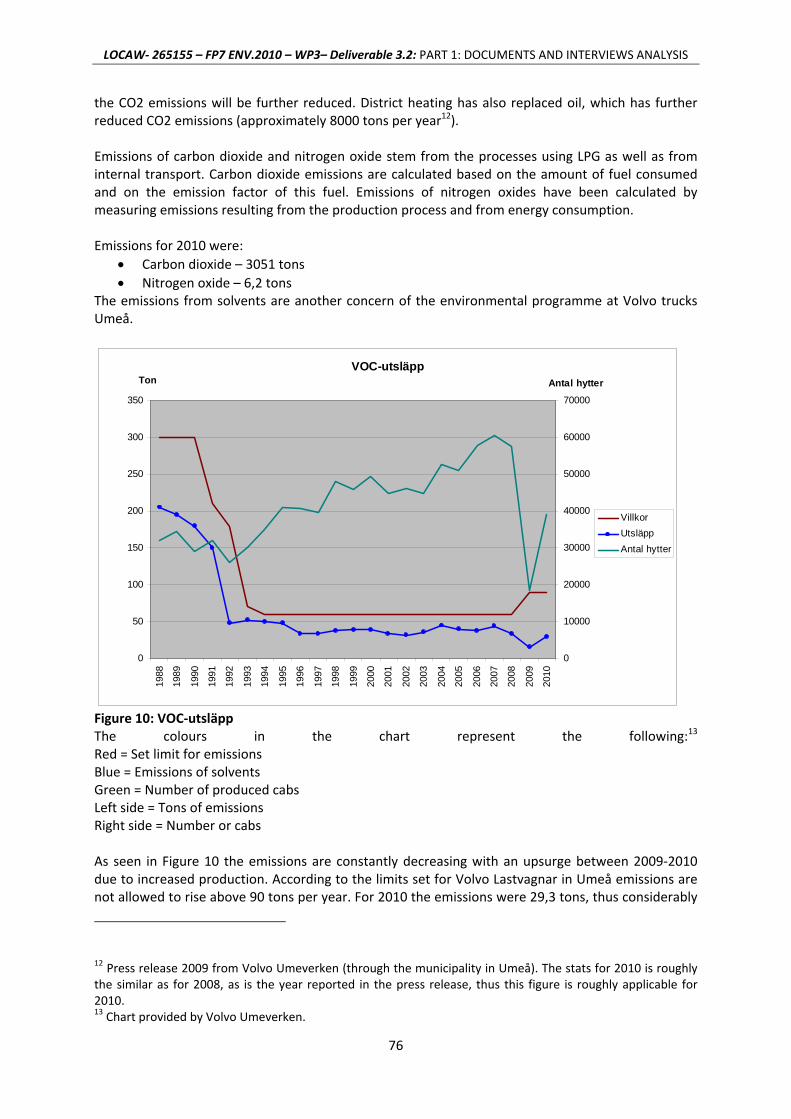
LOCAW‐ 265155 – FP7 ENV.2010 – WP3– Deliverable 3.2: PART 1: DOCUMENTS AND INTERVIEWS ANALYSIS
76
the CO2 emissions will be further reduced. District heating has also replaced oil, which has further reduced CO2 emissions (approximately 8000 tons per year12). Emissions of carbon dioxide and nitrogen oxide stem from the processes using LPG as well as from internal transport. Carbon dioxide emissions are calculated based on the amount of fuel consumed and on the emission factor of this fuel. Emissions of nitrogen oxides have been calculated by measuring emissions resulting from the production process and from energy consumption. Emissions for 2010 were:
• Carbon dioxide – 3051 tons • Nitrogen oxide – 6,2 tons
The emissions from solvents are another concern of the environmental programme at Volvo trucks Umeå.
VOC-utsläpp
0
50
100
150
200
250
300
350
1988
1989
1990
1991
1992
1993
1994
1995
1996
1997
1998
1999
2000
2001
2002
2003
2004
2005
2006
2007
2008
2009
2010
Ton
0
10000
20000
30000
40000
50000
60000
70000
Antal hytter
VillkorUtsläppAntal hytter
Figure 10: VOC‐utsläpp The colours in the chart represent the following:13 Red = Set limit for emissions Blue = Emissions of solvents Green = Number of produced cabs Left side = Tons of emissions Right side = Number or cabs As seen in Figure 10 the emissions are constantly decreasing with an upsurge between 2009‐2010 due to increased production. According to the limits set for Volvo Lastvagnar in Umeå emissions are not allowed to rise above 90 tons per year. For 2010 the emissions were 29,3 tons, thus considerably
12 Press release 2009 from Volvo Umeverken (through the municipality in Umeå). The stats for 2010 is roughly the similar as for 2008, as is the year reported in the press release, thus this figure is roughly applicable for 2010. 13 Chart provided by Volvo Umeverken.
LOCAW‐ 265155 – FP7 ENV.2010 – WP3– Deliverable 3.2: PART 1: DOCUMENTS AND INTERVIEWS ANALYSIS
77
this limit.14 Volvo claims that the cab paintshop in Umeå is the cleanest and most environmentally friendly that exists in car or truck production worldwide today.15 Regarding chemical products, Volvo has developed categories of chemical products, tailored to the automotive industry. A blacklist is a list of banned substances and a gray list is an observation list including chemical products that need to be phased out (predominately due to legal demands). Currently, three substances are on the grey list, and they have been on the list for some time and are likely to remain there for the time being since Volvo is not aware of any substitutes. Volvo is currently not using any chemical products that are on the black list. A routine h.as been implemented in which the introduction of chemical products at the company undergo an industrial hygiene assessment and an assessment of the exterior environment.16 Volvo is constantly monitored by inspectors conducting regular controls of its emissions. Regarding usage of water from the Umeå River Volvo Umeverken has permission to use 1 900 000 m3 per year. 2010 Volvo used 284 000 m3. Water has been taken from wells upstream of Ume River (glacial river/free cooling) and amounts to 199 209 m3 (used for cooling processes) which have reduced the use of river water. Some concluding remarks The environmental coordinator at Volvo states that the last years have witnessed a more systematic approach to environmental improvements. Before 2005‐6 the efforts undertaken were ad‐hoc in character, however still quite successful. The environmental management systems have been implemented at Volvo for quite some time, but it is only recently that these have been strictly followed and that ongoing monitoring has been carried out. Furthermore, the last years have proved to be difficult for environmental improvements and the primary explanation for this is the financial crisis. As in society at large it seems that in economically prosperous times, investments to protect the environment appear affordable, while they are seen as less affordable in times of economic crisis or a decrease in growth. Although Volvo Trucks as a conglomerate supplies guidelines stating the kinds of improvements that should be made, and although it also encourages individual parts of the organisation to apply for funding, the environmental work at Volvo Umeverken has lost a little momentum. When the financial crisis hits, production slows down, and employees are made redundant, and less importance is assigned to the environment. This is not to say that Volvo Umeverken has abandoned its environmental aspirations. As the environmental coordinator pointed out, since production has increased, so have environmental efforts. The environmental work at Volvo Umeverken has its challenges. Workers are not always willing to adjust to improvements since they are busy coping with the necessary production speed. Efficiency, productivity and safety issues are often considered key to production, less so environmental measures. Therefore, the environmental coordinator claims, environmental improvements have to become part of efficiency, productivity and safety measures. At the management level at Volvo Umeverken, environmental improvements are not directly in opposition to, but do not have an automatic place in the strategic planning of production in Umeå. That is to say, environmental measures have to be embedded in economic goals, such as cost reduction, efficiency, productivity, or safety in order to be approved.
14 Miljörapport 2010, Volvo Lastvagnar AB, Umeå 15 Volvo Group Sustainable Report 2010 16 Miljörapport 2010, Volvo Lastvagnar AB, Umeå

LOCAW‐ 265155 – FP7 ENV.2010 – WP3– Deliverable 3.2: PART 1: DOCUMENTS AND INTERVIEWS ANALYSIS
78
Nevertheless, environmental improvements originating in the Volvo Truck’s headquarters, describe ‘green’ projects as legitimate action to take. They are regarded as important for Volvo’s brand image and legitimacy. Volvo’s environmental work seems to be genuinely carried out because global warming demands corporations to take increased responsibility for the environment. In the future, one therefore expects to see even more ambitious goals. For instance, the inclusion of input into and output from the direct production process into the calculation of CO2 emissions. At Volvo Truck headquarters an initiative in this respect has started. 3. Shell’s environmental policies Since 1997 Shell has published annual Sustainability Reports in order to outline their specific environmental policies. These reports started to be published after some years of severe criticisms against the company in the mid‐1990s, primarily regarding the Brent Spar controversy and abuses against human rights in Nigeria. The company responded with reorganisation and formulation of proactive policies in the areas of environmental and social sustainability. At an early stage, Shell embraced the Kyoto protocol, recognized climate science, set goals to reduce its own GHG emissions and invested in renewables, in sharp contrast with US based oil companies17 18. These environmental polices evolved over time in two distinct periods, which mirrored the organisational structural changes of the company described above. In this section we outline the characteristics of environmental policies and practices as they were formulated during two periods: firstly the 1997‐2004 period and secondly the 2005‐2011 period. The section is primarily based on the company’s Sustainability Reports from 1997 to 2011, published annually and available at www.shell.com. 1997‐2004: Pro‐active and high profile environmental policies In its first sustainability report of 1998 (regarding the year 1997) Shell presented its aim of investing USD 500 million over five years in renewable energy technologies (solar power and biomass); this sum represented 10 % of the amount invested in oil and gas exploration, which was to be five billion over the same period. The company also launched a yearly external Health, Safety and Environmental (HSE) report intended to cover all Shell operations, such as exploration and production, oil products and chemicals. The HSE reporting followed the ISO 14001 environmental management system standard, as well as EU’s ECO‐management and Audit Scheme (EMAS), which meant a certification system in line with EU’s environmental management standard. It furthermore outlined the targets to increase investments in renewables, with the establishment of new core business area named Shell International Renewables. Another important target was to eliminate flaring by 2008 and to reduce GHG emissions on own operations by 10 % on the 1990 baseline by 2002. Already in 1997 Shell presented its tool of Scenario planning, which was refined in all subsequent reports. In 1997 the company assessed that by 2020 10 % of world energy could be supplied from renewable sources; increasing to 50 % by 2050. The major long term Scenario followed what Shell identified as a general “decarbonisation trend”. While expressing support of this trend, the company stated that all “agreed mechanisms to curb greenhouse gas emissions should be highly flexible” and action has to be taken “carefully”:
17 Skjaerseth, Jan Birger and Tora Skodvin (2001) Climate Change and the Oil Industry: Common Problems, Different Strategies. Global Environmental Policies 1:4, November 2001. 18 Levy, David L and Ans Kolk (2002): Strategic responses to global climate change: conflicting pressures on multinationals in the oil industry. Business and Politics Vol. 4, No 3 pp 275‐300.
LOCAW‐ 265155 – FP7 ENV.2010 – WP3– Deliverable 3.2: PART 1: DOCUMENTS AND INTERVIEWS ANALYSIS
79
“The carbon intensity of energy supply has steadily fallen as we have moved from wood, to coal, to oil, to gas. All the world’s estimated resources of conventional oil and gas could be consumed without raising atmospheric carbon concentrations about the limits suggested by even the most pessimistic observers. The real problem is with the very much larger resources of carbon intensive coal” (Shell sustainability report 1998). In the energy market scenario the prospects were based on the assumption of 20‐30 coming years of economic growth, which would require new reserves; Shell intended to produce oil and gas to fuel this growth and to find corresponding new reserves. It also intended to produce more natural gas, which emits less CO2 in relation to oil. The new core business area Shell International Renewables was to have three areas of interest; solar electricity; forestry as a business in its own right, and biomass power generation. Off shore wind farms were also planned. Despite these efforts, the company estimated that none of the renewables (sun, wind or biomass) would be able to compete with fossil fuels “except in niche markets”. In April 1998, Shell withdrew membership in the lobby group GCC in the USA (held by Shell Oil USA), as a consequence of its high profile in embracing the Kyoto Protocol and climate science formulated at company headquarters in London and The Hague. In the Shell sustainability report of 1998 it is further stated that the company supports the target to reduce GHG emissions by 5 % on 1990 levels by 2008‐2012, as formulated in the Kyoto Protocol. Shell already reduced emissions 5 % on its own operation in relation to 1990 levels, and declared commitment to reduce 5 % more by 2002, thus exceeding the Kyoto target. This would be possible mainly through reduction of flaring and energy efficiency. Flaring is the burning of gas as a by‐product of oil production – the gas is simply disposed of by burning it in absence of gas compression facilities and markets nearby production areas. Flaring represents a high proportion of GHG emissions from oil company operations. The target on GHG emissions in the following years were met in relation to the 1990 baseline; the baseline until 2002 was 114 million tonnes of CO2 equivalent. The actual GHG emissions however rose in the following years after 1997 and remained at about the same level before reaching the highest levels in 2003 and 2004 with 112 million tonnes of CO2 equivalent. Over the period, the target of 5 % reduction on 1990 baseline was nevertheless met throughout. The commitment to reduce a further 5 % until 2002 could also be met as the baseline for that same year was restated; on the previous baseline the 10 % reduction target would not have been met. The reason for restating the baseline was that a number of new acquisitions had taken place in 2002, when Shell bought seven new refineries. Their current levels of emissions were added to the baseline (Shell Sustainability Report 2002). The possibility of reducing GHG emissions is largely linked to reduction of flaring and increased energy efficiency in operations. However, while flaring was reduced in some years, it also increased other years during the period and remained at around 9‐10 million tonnes of CO2 equivalent per year. The track towards zero flaring by 2008 was not maintained over the 1997‐2004 period. Over the period earnings have been increasing steadily, basically a reflection of the increase in oil prices during the early 2000s. Upstream activities (exploration and production) generated high earnings, while margins in downstream activities (refineries and retail) were low. In 2000 Shell obtained a record level of profits of 24.5 billion USD. The development of corporate profits in the 1997‐2004 period were as following: 1997: 15.9 billion USD 1998: 3.1 billion USD 1999: 15.2 billion USD
LOCAW‐ 265155 – FP7 ENV.2010 – WP3– Deliverable 3.2: PART 1: DOCUMENTS AND INTERVIEWS ANALYSIS
80
2000: 24.5 billion USD 2001: 20.0 billion USD 2002: 9.2 billion USD 2003: 12.5 billion USD 2004: 18.2 billion USD These numbers show high earnings in all years during the period, except in 1998 when oil prices had sharply decreased (see the previous section). Lower profits in 2002 were linked to the economic downturn following 9/11 in 2001. That year’s report stated significant increases in spill volumes and gas flaring, while The Long Term Energy Scenario was restated in some respects, in particular in terms of the prospects of the possible share of renewables in world energy supply. In 1997 this share was estimated to be 50 % by 2050, while in 2001 the major scenario was a 30 % level. The major elements in the Long Term Energy Scenario in 2001 were: ‐ rapid economic growth will take place in the developing world ‐ 2050 there will be a fully sustainable energy mix and stable climate at 550 parts per million of
CO2 in the atmosphere ‐ 2‐3 times more energy than today will be needed to support the economic growth ‐ gas will occupy a bridging role while new technologies mature ‐ renewables will supply 1/3 of primary energy supply by 2050 ‐ 2.5 billion people in China and India will reach the standard of living as Europe in 1990 by
2050 ‐ new renewables (wind, solar) will be 4‐7% of primary energy supply by 2020 Shell uses the conventional Bruntland Commission definition of sustainability. It is accordingly stated that the company will approach its business “in a way that helps to meet the needs of the present without compromising the ability of future generations to meet their own needs”. Shell embraces the concept of social, economic and environmental sustainability, with the economic as priority, expressed as being “the bottom line”. In the 2002 report Chairman Philips Watts expressed that “we believe that sustainable development is good for business and business is good for sustainable development”, thus embracing the consensus view of the Bruntland Commission that no inherent contradictions exist between economic, social and environmental sustainability. As noted above, the company achieved record level profits in 2000 with 24.5 billion USD, with return on capital at 19.2%. This same year the oil and gas reserves were estimated to 20 billion barrels of oil equivalent. Dividends increased sharply from 1995/1996 to reach 220 % of 1992 values by 2001. In terms of investments in renewables, in 2001 the company expressed the same intention as in 1997, to spend 0.5 – 1 billion USD over the next 5 years, especially on solar and wind. This strategy translates into investing around 100 – 200 million USD per year in alternative renewable energy sources. In 2001 overall GHG emissions from own operations increased with 2 % from 2000 to 103 million tonnes CO2 equivalents; at the same time there was an increase in flaring by 11%. Shell nevertheless expressed that its goal was still to eliminate flaring by 2008. As mentioned, flaring contributes to a large part of the company’s GHG emissions from operations. Another prioritised area pointed out in 2001 was to expand and develop facilities for Liquefied Natural Gas (LNG), including off shore facilities, which would facilitate the transportation of gas to markets from remote production areas. Both flaring and spills represent serious environmental problems. As described above flaring remained at about the same level between 1997 and 2004. Regarding spills they varied from 13.2 thousand tonnes (tt) in 1998, to 18.7 tt in 1999, to 9.9 tt in 2000 and again up to 17.8 tt in 2001. Spills have mostly taken place in the operations in Nigeria, and Shell makes yearly estimates of what they see as high levels of sabotage as causing the spills. Several controversies have occurred regarding
LOCAW‐ 265155 – FP7 ENV.2010 – WP3– Deliverable 3.2: PART 1: DOCUMENTS AND INTERVIEWS ANALYSIS
81
spills from Shell’s operations in Nigeria, as reported by Amnesty International (Amnesty International 2009). In 2001 spills in Nigeria increased to 3.6 tt in Ogbodo village, of which the Sustainability Report indicate that “over 90 % was recovered”, while in Oman 1,2 tt was spilled and “completely restored”. According to the company in 2001 5.2 tt were spilled as a result of “acts of sabotage in Nigeria” (Shell Sustainability Report 2001). Every year Shell pays fines for breaking laws and regulations, and liabilities for clean‐up; these sums are reported on annually in the Sustainability Reports. In 2001 fines amounted to 1.4 million USD while liabilities for clean‐up were around 3 billion USD the same year, which represented an increase from 2000. Yearly fines were estimated at between 1.3 – 3.1 million USD between 1998 and 2001. In 2002 Shell was ranked at the top of energy sector companies in Dow Jones Sustainability Index. The same year the Shell Centre for Sustainability was established in Houston and a number of professorships were financed at universities in Norway and the UK. At the same time, environmental pressure groups rewarded the company with the “Greenwash Award” at the World Summit on Sustainable Development in Johannesburg. In 2002 the company had operations in 145 countries and employed 115000 people. It produced 3 % of world oil, 3,5 % of world gas and 13 % of world solar panels. Most investments were as previously in oil and gas; 25 billion in capital investments, 11 new acquisitions. The 2002 production of oil and gas reached the highest level in recent history: 4 million barrels per day. The scenario planning continued to stress how in the South five times more energy will be needed by 2050; the total energy demand will be double the current level; fossil fuels will remain central; it will take more than a decade until alternatives can compete. Solar energy is 10 times more costly than electricity from fossil fuels or nuclear power. Given these scenarios Shell will continue to explore for and produce oil and gas, develop gas markets in fast growing regions, reduce emissions and discharges from operations. Shell has introduced an internal cost system which integrates carbon costs – there is a penalty for GHG emissions in financial models, with the purpose of making projects pay for the GHG they emit. In 2002 oil and gas reserves were estimated as equivalent to 13 years of current production; production growth was planned to be 3 % per year. In 2002 oil production was up 7 % from 2001. Following the company’s estimates of proven reserves in December 2002, the year 2003 became turbulent as it was discovered that Shell had overstated its reserves significantly, which led to severe criticisms, high fines and demands for compensations. Shell removed 4.47 billion barrels of oil from stated reserves in 2002 as a result of the scandal, and the restated reserves were presented in early 2004. Key management persons were dismissed; the Chairman, the Chief finance officer and CE of Exploration and Production. The recategorization was costly for the company, not least in terms of lost confidence and negative publicity. It cost Shell 120 million USD in compensations and 32 million USD in civil penalty to US and UK authorities. The year 2004 was also marked by efforts to improve strained relations with local communities in Brazil, Nigeria, the Philippines and South Africa. In 2004 important structural changes were initiated, which were fully in place by 2005. These changes marked a new phase in the policies of the company, which also were translated in a different focus in terms of environmental strategies. By 2004 around 1 % of capital investments were made in renewables, while 99 % were directed to upstream and downstream operations in oil and gas. This contrasts with the ambition of 10 % of capital investments in renewables formulated in 1997. The focus on oil and gas exploration and production was further strengthened in the following 2005‐2011 period. 2005 – 2011: Upstream investments, all time high profits and lower profile in renewable alternatives
LOCAW‐ 265155 – FP7 ENV.2010 – WP3– Deliverable 3.2: PART 1: DOCUMENTS AND INTERVIEWS ANALYSIS
82
The overall corporate strategy for the 2005‐2010 period was formulated as “More Upstream and Profitable Downstream”. It was maintained that “sustainable development is part of our business principles” and “contribution to sustainable development for us means, above all, helping to meet the global energy challenge by responding to society’s rapidly‐growing need for energy and petrochemicals in environmentally and socially responsible ways” (Shell Sustainability Report 2005). The company intends to “listen to stakeholders to understand society’s changing expectations and learn to see our business through a wider lens” while continuing to “deliver the energy the world needs for economic growth and poverty reduction” (ibid.). The GHG emission target under the new organisation remained at the level of the Kyoto Protocol; 5 % lower than the 1990 level. Some important trends could be identified from 2005: ‐ GHG emissions in operations started to decrease from 2005, mainly due to production shut
down, portfolio change and minor reduction in flaring ‐ Record level profits from 2005 to 2008; thereafter from 2010 to 2011 ‐ Surge in upstream investments; top priority to invest in exploration and production ‐ Emphasis on reaching 50 % natural gas of total production ‐ Relative decline in investments in renewables ‐ New focus on “difficult gas” such as tight gas through new techniques of hydraulic fracturing;
but also continued focus on high cost oil and gas in the Arctic, deep water and oil sands In 2005 Shell produced 2.5 % of world oil, and 3.0 % of world gas, a loss in market shares since the early 2000s, mainly due to divestments. At the same time, investment levels doubled from 2000 to 16 billion USD, basically in upstream activities – in line with the strategy of more upstream and profitable downstream. While total capital investment doubled over this period, investments in renewables remained low at around 200 million USD per year, representing approximately 1 % of total capital investments. The levels of profits during the 2005‐2011 period were as following: 2005: 25.3 billion USD 2006: 26.0 billion USD 2007: 31.9 billion USD 2008: 26.5 billion USD 2009: 12.7 billion USD 2010: 20.5 billion USD 2011: 30.9 billion USD As compared with the previous period, earnings were considerably higher during this period. Despite the financial crisis of 2008‐2009, earnings remained high and also increased significantly towards the end of the period. New capital investments were made together with Statoil in order to develop new technologies to capture CO2 from fossil fuel and to store it underground, both on and off shore. CO2 Capture and Storage (CCS) has become an important focus of technology investment and research. The company works with GHG emission control of its own operations, while at the same time promoting projects to reduce emissions from the use of fossil fuels. The estimated emissions by consumers of products that Shell puts on the market is 7 times higher than the emissions created by production itself; if Shell emits around 100 million tonnes CO2 equivalents during its operations, consumers emit 750 million tonnes when using the fuels. The trend towards a leaner organisation could be seen from 2006 when Shell had operations in 130 countries and employed 108 000 people, a downward trend that continued in the following years. Three business areas were defined in the new unified structure of the Group in 2006; Upstream;
LOCAW‐ 265155 – FP7 ENV.2010 – WP3– Deliverable 3.2: PART 1: DOCUMENTS AND INTERVIEWS ANALYSIS
83
Downstream and Renewables, Hydrogen and CO2 mitigation, capture and storage (CCS). Important capital investments took place in Gas to Liquids technology, especially in Qatar. Shell is global leader in Liquefied Natural Gas (LNG) provision, with 35 % of world output of LNG. In 2006 there was a renewed focus on climate change issues as the Stern report19 was published. Shell declared its intention to continue to work with sustainable development in its operations and expressed its policies in a new common company‐wide Code of Conduct. This Code was to provide guidance to integrate environmental and social issues earlier in the planning of new upstream projects, as main area of investments by Shell. In 2007 Shell noted an all‐time high record level of profits, at 31.9 billion USD. High profits were re‐invested in new upstream activities, aiming at continuing increasing oil and gas production. Capital investments were as high as 27 billion USD in 2007, while at the same time oil and gas production remained at the same level of around 3.3 mb per day. Continued divestments took place and operations took place in even fewer countries, 110 countries (compared with 145 in 2002), employing 104,000 people (compared with 115,000 in 2002). The high oil price propelled exploration for more and more “difficult oil”. Shell has an expressed strategy of investing in difficult oil: costly, hard‐to‐extract, deep ocean, oil sands and Arctic, as these sources will be needed according to the Scenario planning of the company (Shell Sustainability Review 2007). In 2007 Shell was the highest bidder for 275 exploration leases off the Alaskan coast, making it one of the major actors in exploration and production in the Arctic region. The long term goal of increasing production of gas in relation to oil was beginning to show as this share rose from 40 % in 2007 to 48 % in 2011. Total GHG emissions from operations in 2007 were down at 92 mt CO2 equivalents, as much as 25% below the 1990 baseline. The explanation was closed production, and consequently reduction in flaring to 4 mt, especially in Nigeria. Spills, on the other hand, increased to 6 tt. The financial crisis marked the year 2008, while at the same time oil price had reached the record level of 147 USD per barrel in July 2008, the so called “third oil shock” (see above). Capital investments were as high as 32 billion USD, due to high earnings and high proceeds from major divestments which were re‐invested in new explorations. The share of world oil production by Shell was down to 2 % while the share of gas production remained at 3 %. Production was slightly down from the year before at 3.2 mboe per day, or which 45 % was gas. A slight increase in investments in renewables and CCS took place, to around 300 million per year as average for the past five years; however the percentage of total investments was lower than previous years, less than 1 %. Nevertheless, capacity in wind energy increased by 25 %. There was a continued exploration for difficult oil (Arctic, deep water, oil sands) and the first project to inject CO2 on shore was initiated in 2008. The target set in 1997 of zero flaring by 2008, established in the first Sustainability Report was not met. Flaring remained at around the same high level in 2008 as in 1997, around 9 mt of CO2 equivalent per year. GHG emissions were down to a record low of 75 mt CO2 equivalent, largely due to lower production and sales due to the financial crisis. Flaring was in the 2008 Sustainability Report reported as ended “except in Nigeria”. An increase in spills took place again in 2008, up to 8 tt. Capital investments continued in 2009 at a very high level at almost 30 billion USD, of which investments in alternatives and CCS remained at around 1 %. GHG emissions were at a lowest level 67 mt, explained by the economic downturn in 2008‐2009; production was at 3.1 mboe per day, of
19 Stern, N. (2006). Stern Review on the Economics of Climate Change. HM Treasury, London.
LOCAW‐ 265155 – FP7 ENV.2010 – WP3– Deliverable 3.2: PART 1: DOCUMENTS AND INTERVIEWS ANALYSIS
84
which gas reached 47 %. Divestments continued, operations were now in 90 countries with 101 000 people employed. The 2009 Sustainability Report presented six CO2 reduction pathways: 1) increase efficiency in operations 2) increase CCS capability; the centre in Mongstad, Norway is to capture 100000 tonnes of CO2
per year 3) Research & Development to be at 1.1 billion USD per year 4) Natural gas increase to reach more than 50 % of total production by 2012; continued strong
focus on LNG 5) New fuels for motor vehicles to be developed 6) Promotion of better CO2 regulations and market‐based mechanisms, support for the
establishment of a global price for CO2. During 2009 the less profitable downstream activities were reduced, but flaring remained high at 8 mt. Spills were restated this year for the year 2008 up to 9 tt after investigations that showed Shell´s responsibility for major spills in Nigeria. The spills in 2009 were estimated at 2 tt. The following year 2010 was marked by the BP Deepwater Horizon accident in the Mexican Gulf, which caused major changes in exploration plans and deep water production among major oil companies, including Shell. In the Scenario planning it was noted that 80 % of energy supply today comes from fossil fuels, and this will only change to a limited extent by 2050, when it is estimated to be at around 70%. However, there is s change from previous scenarios as nuclear energy was included as among the “alternatives” to reach 30 % by 2050 (the previous estimates were based on that solar, wind and biomass would represent 30% by 2050). The stress on natural gas continued in 2010 and was more pronounced than in previous years. Natural gas is difficult to produce but estimated to be abundant with 250 years of world supplies at current production rates. A new form of gas production was highlighted in the 2010 Sustainability Report: the production of gas trapped in dense rock, so called “tight gas”. Six major tight gas projects have been initiated in Canada, the US and China. The tight gas is produced through a technology called hydraulic fracturing, which forces gas out of the rock using a fluid of 99% water and sane and chemical additives. Currently a number of permits are searched for; production has yet not been permitted as the use of chemicals may affect fresh water wells. The gas would be produced at 1000 m depth. In the 2011 Sustainability Report, Shell stresses the importance of its explorations in the Arctic. The company estimates that 30 % of remaining undiscovered world natural gas and 13 % of yet‐to find oil are located in the Arctic, and 80 % of these sources are to be found off shore. The developments during the year 2011 were important in many respects, not least in terms of environmental issues: ‐ continued strong focus on new explorations in the Arctic ‐ gas flaring at increasingly high levels both during 2010 and 2011, rising to record levels at
around 10 mt per year ‐ spill also increased to high levels of 7 tt ‐ GHG emissions at 75 mt CO2 equivalents despite continued divestments, the high level
explained largely by increased flaring ‐ Production of oil and gas remained high at 3.2 mbpd; of which 48 % was gas The most spectacular development during 2011 in the oil industry in general and in Shell in particular was however the record levels of earnings due to the high oil price during the whole year of 2011. Shell was ranked the number one most profitable company in the world all categories in 2011, by Fortune’s Global 500 (Fortune 2012). The profit reached 30.9 billion USD; capital investments were at 31 billion USD. Divestment continued and in 2011 Shell had operations in 80 countries with 90 000

LOCAW‐ 265155 – FP7 ENV.2010 – WP3– Deliverable 3.2: PART 1: DOCUMENTS AND INTERVIEWS ANALYSIS
85
employees, which can be compared to 145 countries and 115 000 employees in 2002. A change in the definition of business areas is also telling of changes from the 1997‐2004 period; there are now three core areas presented as Upstream; Downstream; and Research and Technology. This shows a change in profile in relation to the 1997‐2004 period, when Shell Renewables International was established, as well as previous periods when business areas were highlighted as Renewables and Hydrogen and Renewables and CCS. The proportion of investments in renewables in relation to investments in fossil fuels declined from 10 % in 1997, to around 1 % in the 2005‐2011 period. However, the actual sum of money invested in renewables per year has remained about the same, and even been somewhat higher in the later period. This is explained by the extraordinary higher total levels of capital investments by the company in the recent decade, which were permitted by unprecedented high earnings, high oil prices and substantial divestments during the 2005‐2011 period. Oil companies and climate change issues In this final section we discuss some of the strategies developed by transnational companies in the oil industry in general regarding climate change and pressures from international controls of GHG emissions. In light of the above description, there are few indications of major shifts away from continued oil and gas exploration, given the sustained high levels of profits in the major oil companies’ upstream activities. As previously noted, the oil industry is the most global industry of all, and the private oil companies are similar in terms of assets, markets, ratio between oil and natural gas – despite this they initially developed different strategies in response to climate change. Levy and Kolk (2002) argue that home country institutional context and individual company history influenced corporate strategic responses to climate issues, but over time as the climate change topic matures, strategic responses have become more similar among the TNCs. Convergent pressures at the global industry and issue level have tended to predominate. The location of the companies in a global industry with a rather undifferentiated product creates convergent pressures, while at the same time there is a tension between the pursuit of global integration (global optimizing) and local responsiveness to home country institutional and market contexts. The three largest transnational companies in the oil industry (the Three Sisters) have similar production and distribution operations in the major production regions (North America, Europe and the Middle East) while they also are embedded in specific firm level and home country contexts. Levy and Kolk (2002) show how the corporations responded strikingly differently to climate change issues in the late 1990s. The largest US corporations, Exxon‐Mobil and Chevron (today merged with Texaco) aggressively questioned scientific research on climate change and opposed any regulation on emission controls, while BP and Shell at an early stage accepted climate science, supported the Kyoto Protocol and announced investment plans for alternative fuels. It is clear that the balance between strategies of local responsiveness on the one hand and pursuit of global integration on the other hand differed among the TNCs in the industry, and as well as it shifted over time within the same industry. Recognizing the need to coordinate their worldwide market and non‐market strategies on climate change, most of the large oil companies formed internal cross‐functional “climate teams” to develop unified company‐wide positions regarding the scientific, regulatory, and economic aspects of climate change issues. This was a necessary measure at this time, according to Levy and Kolk (2002): The cost of failing to do so became evident for Shell in the mid‐1990s, when Shell Europe moved toward acceptance of the need for internationally agreed greenhouse gas emission controls while Shell U.S. was still a member of the Global Climate Coalition (GCC), the industry association which lobbied aggressively against such measures. This inconsistency complicated the company’s efforts to pursue

LOCAW‐ 265155 – FP7 ENV.2010 – WP3– Deliverable 3.2: PART 1: DOCUMENTS AND INTERVIEWS ANALYSIS
86
a particular political strategy, and became a severe liability when it was publicized by environmental NGOs, leading Shell U.S. to leave the GCC in 1998 (ibid: 277). Over time, there was a convergence in the companies’ climate strategies. While Exxon developed a less aggressive stance and moved more towards Shell’s and BP’s positions on climate issues, the European based companies became less outspoken and invested less in alternative energy sources. While some investments were made in renewables, the vast majority of assets remain in the traditional oil and gas businesses. Markets for gas and oil appear for the companies as secure for the next quarter century (Levy and Kolk 2002). The convergence of strategic responses to climate issues can to some degree also be explained by pressures related to changes in organizational structure. Oil companies have abandoned decentralised geographic organisational structures and moved towards globally integrated businesses, with internationalised management. This was shown above to also be the case of Shell. In their interviews with the oil company representatives, Levy and Kolk (ibid.) found that initially both US and European majors had perceived climate change as a serious threat to their businesses, but over time this pessimism disappeared. The converging view was that core oil and gas businesses remain strong and oil will at least in the medium term be the primary fuel for transportation: The emerging, more optimistic view of the future of the oil and gas business reduces the stakes and thus the need for more assertive political or technological strategies. Moreover, companies are converging on the view that the flexible Kyoto mechanisms will provide only weak constraints on carbon emissions, reducing the cost of compliance. As a result, there are few rewards for proactively taking the risk of being a technological first‐mover, and a resistant strategy that aggressively challenges policy may not be worth the cost in political and social legitimacy (ibid: 296). These results point towards the conclusion that in the absence of major political pressures and shifts in the social and regulatory contexts in which companies and markets are embedded, oil companies will respond to global competitive pressures, including organizational pressures, and converge on strategies of continued expansion and exploration of traditional oil and gas production. The obstacles related to a transition from oil to other energy sources are furthermore related to the requirements of combinations of different energy resources/ sources, which means that organizational preconditions are not in place, and commercial actors are not willing to invest in larger system or infrastructural changes. Finally, a final point of comparison between the oil industry and the automotive industry. The large automotive TNCs, such as AB Volvo, have also developed companywide strategies and formed climate teams but the positions of these companies are more complex, due to the way the climate issue is layered on top of a regional industry structure of production, marketing and emissions regulation (ibid). There is therefore a distinction between the automotive industry and the oil industry in terms of structural conditions (globalization vs regionalization) which affect the balance between global vs multi‐domestic market and non‐market strategies. However, one similarity between the oil industry (Shell) and the automotive industry (Volvo) is the shift from firm level/home country divergent pressures towards convergent pressures at global industry level – but this shift is more pronounced in the oil industry as this industry is more globally integrated than the more regionally integrated automotive industry.
LOCAW‐ 265155 – FP7 ENV.2010 – WP3– Deliverable 3.2: PART 1: DOCUMENTS AND INTERVIEWS ANALYSIS
87
References Braun, V. & Clark, V. (2006), Using Thematic Analysis in Psychology, Qualitative Research in Psychology, 3, 77‐101. Federation of the Dutch municipalities (2007). Climate accord municipalities and government
2007‐2011. Den Haag: Federation of Dutch municipalities. Department Information en Administration (2008). Tightening of the procurement. Groningen: Municipality of Groningen. Levy, D. L. & Kolk, A. (2002). Strategic responses to global climate change: conflicting pressures on
multinationals in the oil industry. Business and Politics Vol. 4, No 3. Helbig, A. K., Steg, L., Bolderdijk, J. W., & Keizer. K. (2011). National Report University of Groningen
(The Netherlands). Groningen: University of Groningen, Faculty of Behavioural and Social Sciences, Department of Psychology.
Knowledge Center Europa Local (2011). Retrieved November 24, 2011, from http://www.europadecentraal.nl/ National waste generation plan 2009‐2021 (2011). Retrieved November 20, 2011, from http://www.lap2.nl/contact.asp Ryan, G.W. & Russell Bernard, H. (2003), Techniques to Identify Themes, Field Methods, 15, 85‐109.
Skjaerseth, J. B. & Skodvin T. (2001). Climate Change and the Oil Industry: Common Problems, Different Strategies. Global Environmental Policies 1:4, November 2001.
Stern, N. (2006). Stern Review on the Economics of Climate Change. HM Treasury, London.