Embed Size (px)
Citation preview

1
Local to regional scale modeled wildland fire impacts on O3 and PM
Kirk Baker, Luxi Zhou, Matt WoodyU.S. Environmental Protection Agency
Research Triangle Park, NCOctober 2016

2
Motivation• Current and future human health impacts from wildland fires• O3 and PM National Ambient Air Quality Standards (NAAQS)• Exceptional Event demonstrations (e.g., Flint Hills impacts on O3 in Kansas City)
• Regional Haze Rule• National Air Toxics Assessment• Exposure and health impact assessments• Understand how well our regulatory modeling system (SMARTFIRE2,
BLUESKY, SMOKE, CMAQ) represents wild and prescribed fires to best inform regulatory assessments
3
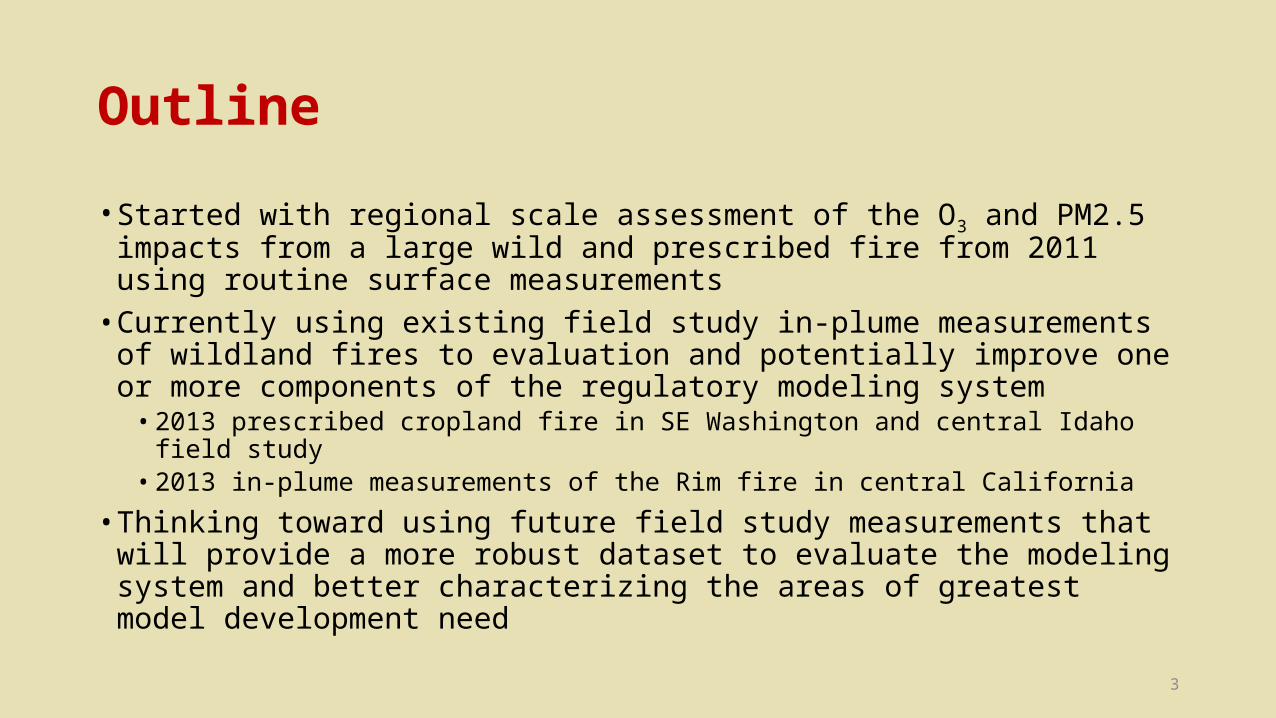
Outline• Started with regional scale assessment of the O3 and PM2.5 impacts from a
large wild and prescribed fire from 2011 using routine surface measurements• Currently using existing field study in-plume measurements of wildland fires
to evaluation and potentially improve one or more components of the regulatory modeling system• 2013 prescribed cropland fire in SE Washington and central Idaho field study• 2013 in-plume measurements of the Rim fire in central California
• Thinking toward using future field study measurements that will provide a more robust dataset to evaluate the modeling system and better characterizing the areas of greatest model development need
4
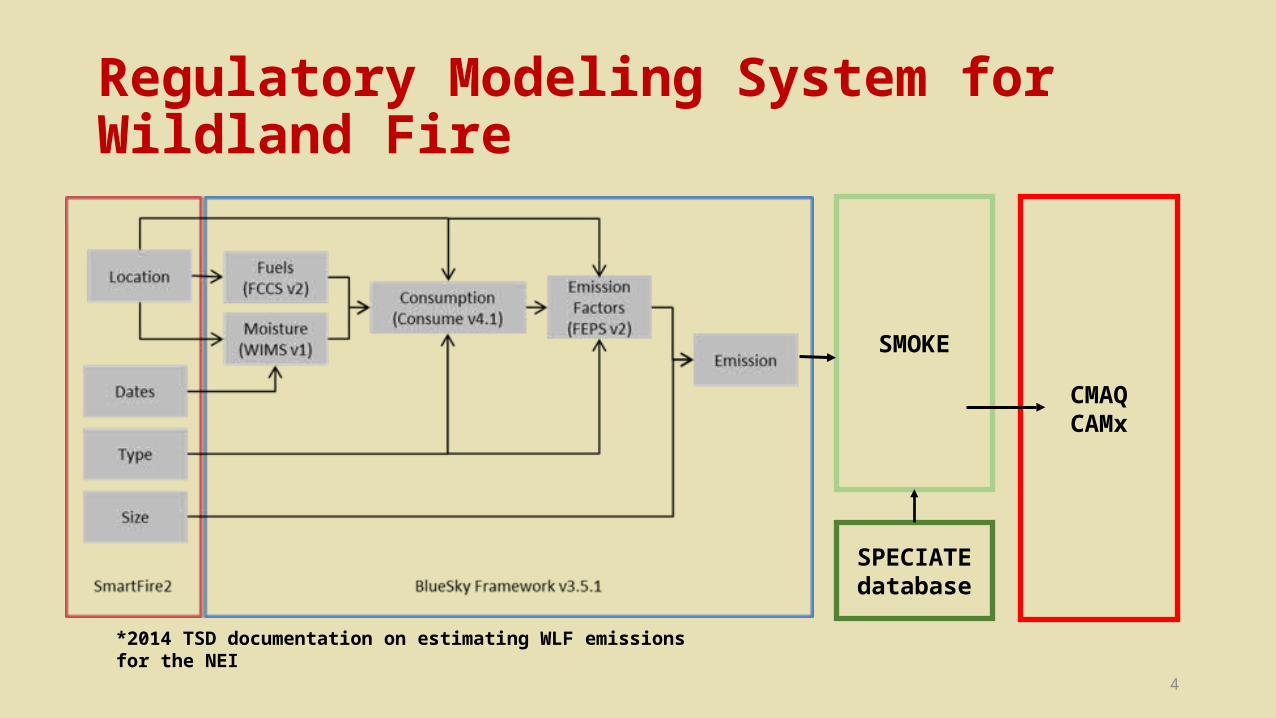
Regulatory Modeling System for Wildland Fire
SMOKE
CMAQCAMx
*2014 TSD documentation on estimating WLF emissions for the NEI
SPECIATE database
5
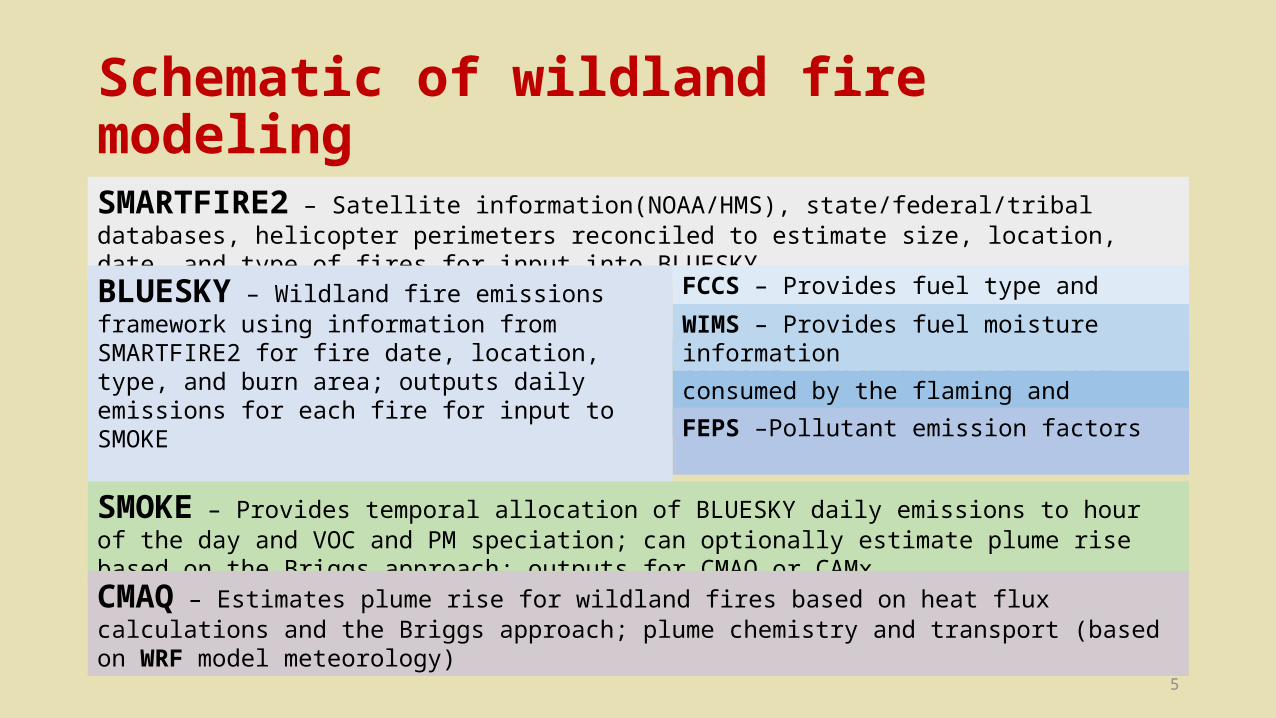
Schematic of wildland fire modelingSMARTFIRE2 – Satellite information(NOAA/HMS), state/federal/tribal databases, helicopter perimeters reconciled to estimate size, location, date, and type of fires for input into BLUESKY
BLUESKY – Wildland fire emissions framework using information from SMARTFIRE2 for fire date, location, type, and burn area; outputs daily emissions for each fire for input to SMOKE
SMOKE – Provides temporal allocation of BLUESKY daily emissions to hour of the day and VOC and PM speciation; can optionally estimate plume rise based on the Briggs approach; outputs for CMAQ or CAMx
CMAQ – Estimates plume rise for wildland fires based on heat flux calculations and the Briggs approach; plume chemistry and transport (based on WRF model meteorology)
FCCS – Provides fuel type and loading information
CONSUME – Estimates total fuel consumed by the flaming and smoldering components of fireFEPS –Pollutant emission factors
WIMS – Provides fuel moisture information

6
Ozone• Modeled impacts of Wallow fire shown for June 5, 2011 at 2pm LST• NOX and VOC emissions from wildfires important• PAN and aldehydes important in local to regional scale O3 production
7
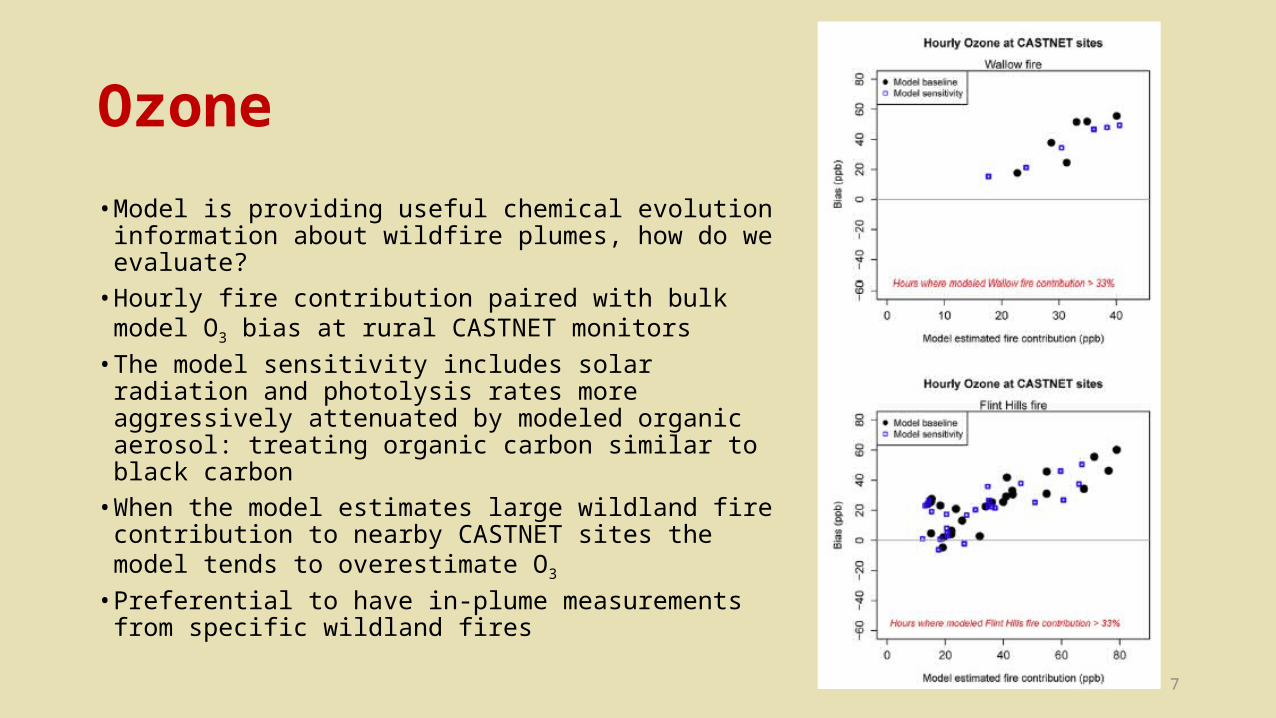
Ozone• Model is providing useful chemical evolution information
about wildfire plumes, how do we evaluate?• Hourly fire contribution paired with bulk model O3 bias at
rural CASTNET monitors• The model sensitivity includes solar radiation and
photolysis rates more aggressively attenuated by modeled organic aerosol: treating organic carbon similar to black carbon
• When the model estimates large wildland fire contribution to nearby CASTNET sites the model tends to overestimate O3
• Preferential to have in-plume measurements from specific wildland fires

8
PM2.5• Episode maximum hourly impacts from the Flint Hills fire to PM2.5.• POA largest component (treated as non-volatile in these simulations)• Daily averaged modeled Flint Hills fire contribution paired with bulk
model speciated PM2.5 bias at rural IMPROVE monitors

9
PM2.5 OA• Maximum hourly impacts from Wallow
(top row) and Flint Hills (bottom row) fires to modeled PM2.5 organic aerosol.
• The difference between the AE6 and standard VBS are also shown. • Cool colors indicate less PM2.5 organic aerosol
contribution with the sensitivity simulation• Disagreement about SOA formation from
wildland fires within the scientific community—best approach not clear
• In-plume measurements needed to inform these choices
10
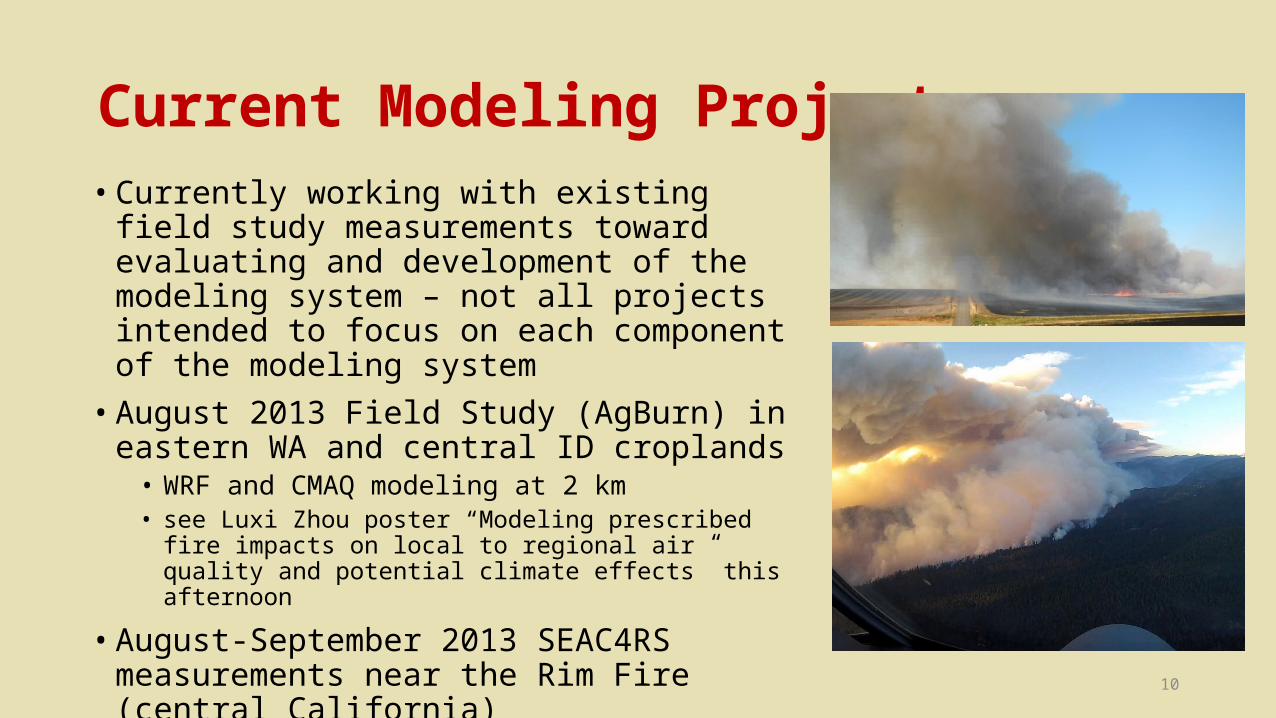
Current Modeling Projects• Currently working with existing field study
measurements toward evaluating and development of the modeling system – not all projects intended to focus on each component of the modeling system• August 2013 Field Study (AgBurn) in eastern WA and
central ID croplands• WRF and CMAQ modeling at 2 km• see Luxi Zhou poster “Modeling prescribed fire impacts on local
to regional air quality and potential climate effects” this afternoon
• August-September 2013 SEAC4RS measurements near the Rim Fire (central California)• WRF and CMAQ modeling at 12 and 4 km• see Matt Woody presentation “Assessment of Air Quality Impacts
from the 2013 Rim Fire” immediately following this talk

11
Washington Palouse
Nez Perce Reservation
August 2013 Washington/Idaho Field Study *see Luxi Zhou poster “Modeling prescribed fire impacts on local to regional air quality and potential climate effects” this afternoon for more details.
12
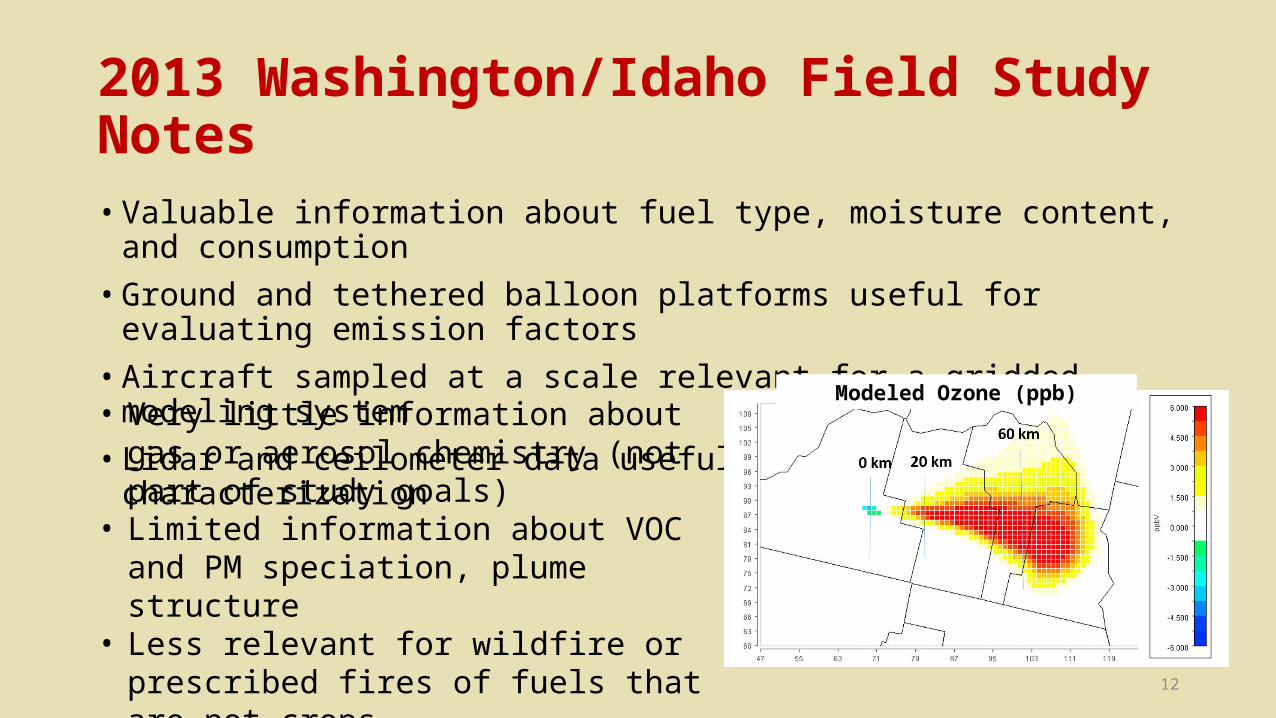
2013 Washington/Idaho Field Study Notes• Valuable information about fuel type, moisture content, and consumption• Ground and tethered balloon platforms useful for evaluating emission factors• Aircraft sampled at a scale relevant for a gridded modeling system• Lidar and ceilometer data useful for evaluating plume characterization
Modeled Ozone (ppb)• Very little information about gas or aerosol
chemistry (not part of study goals)• Limited information about VOC and PM
speciation, plume structure• Less relevant for wildfire or prescribed fires
of fuels that are not crops

13
Emissions• Compare emission factors
estimated by the Bluesky framework with the distribution of emission factors measured using the ground, aerostat, aircraft, and open burn test facility platforms• MCE (modified combustion
efficiency) shown for measurements to indicate range of flaming to smoldering conditions
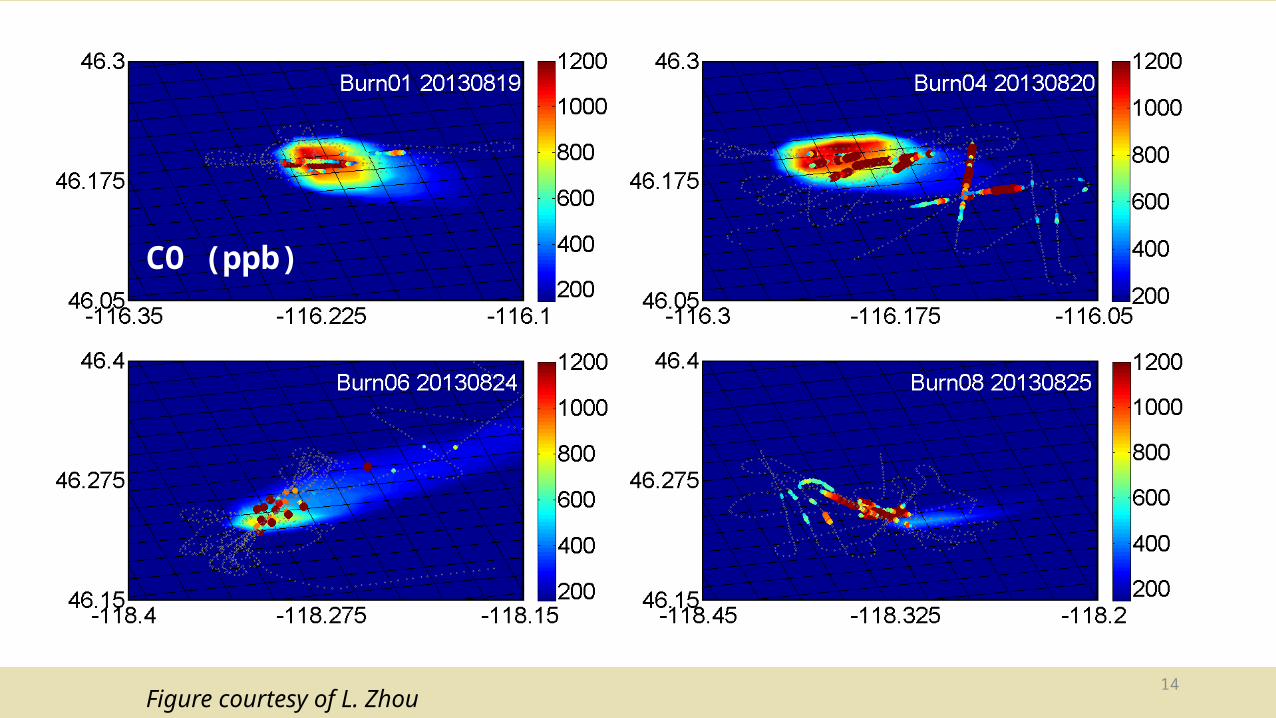
14Figure courtesy of L. Zhou
CO (ppb)
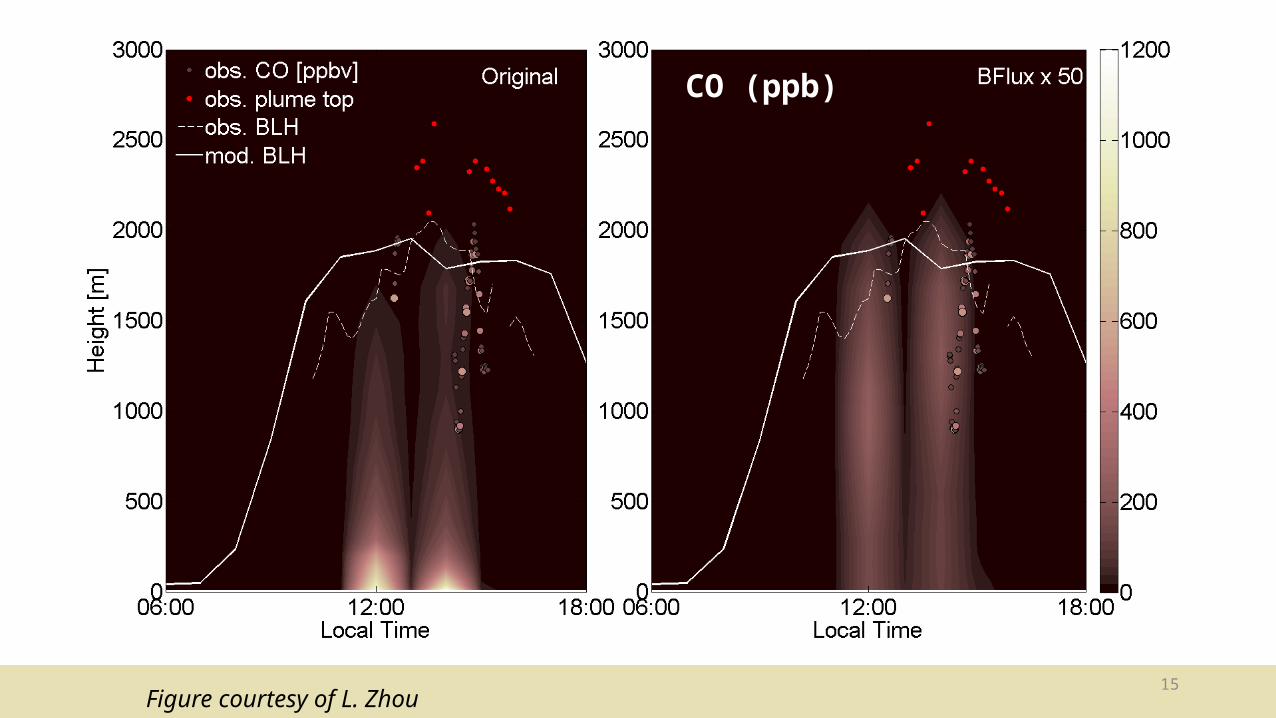
15Figure courtesy of L. Zhou
CO (ppb)
16
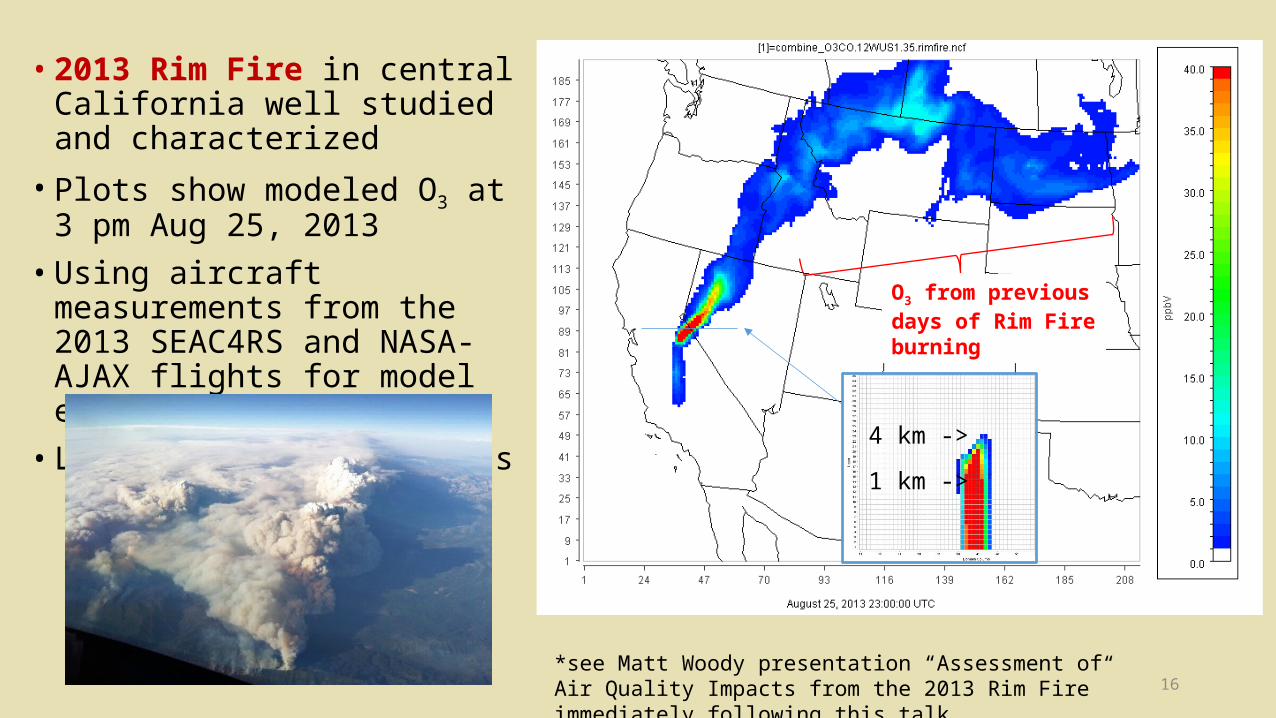
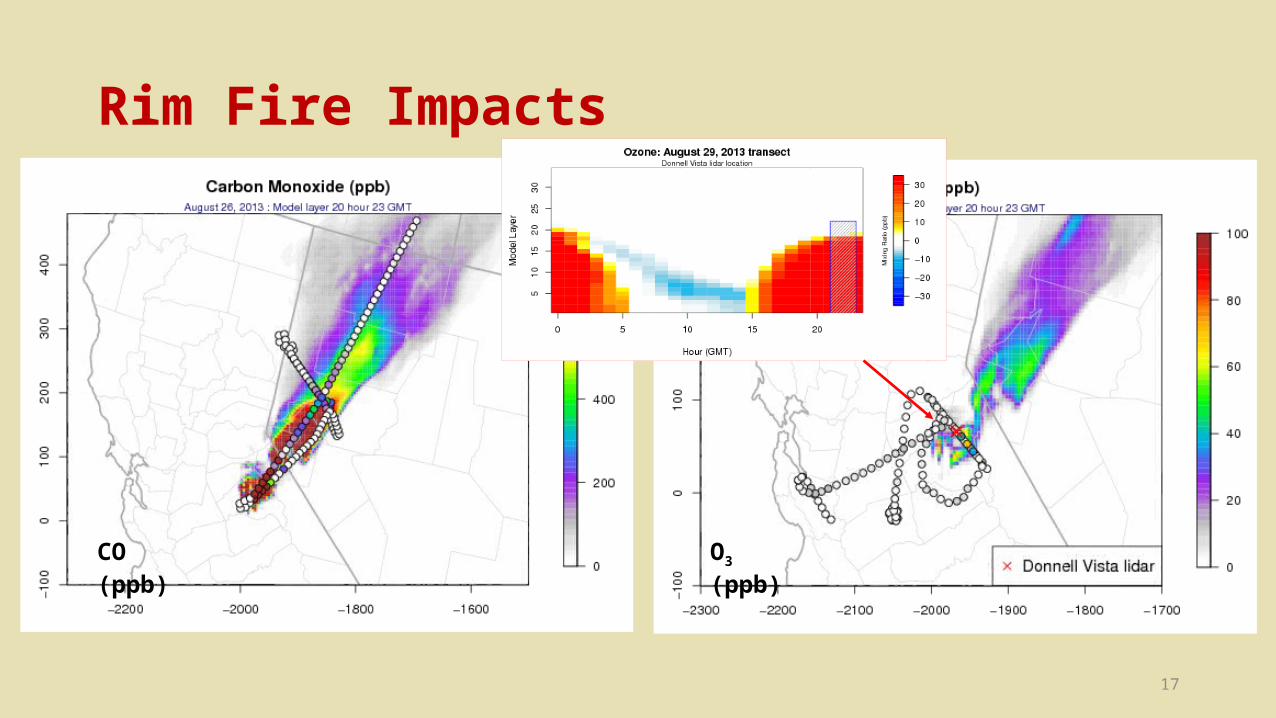
• 2013 Rim Fire in central California well studied and characterized• Plots show modeled O3 at 3 pm
Aug 25, 2013• Using aircraft measurements from
the 2013 SEAC4RS and NASA-AJAX flights for model evaluation• Lidar plume measurements
O3 from previous days of Rim Fire burning
4 km ->
1 km ->
*see Matt Woody presentation “Assessment of Air Quality Impacts from the 2013 Rim Fire” immediately following this talk
17
Rim Fire Impacts
O3 (ppb)CO (ppb)
18
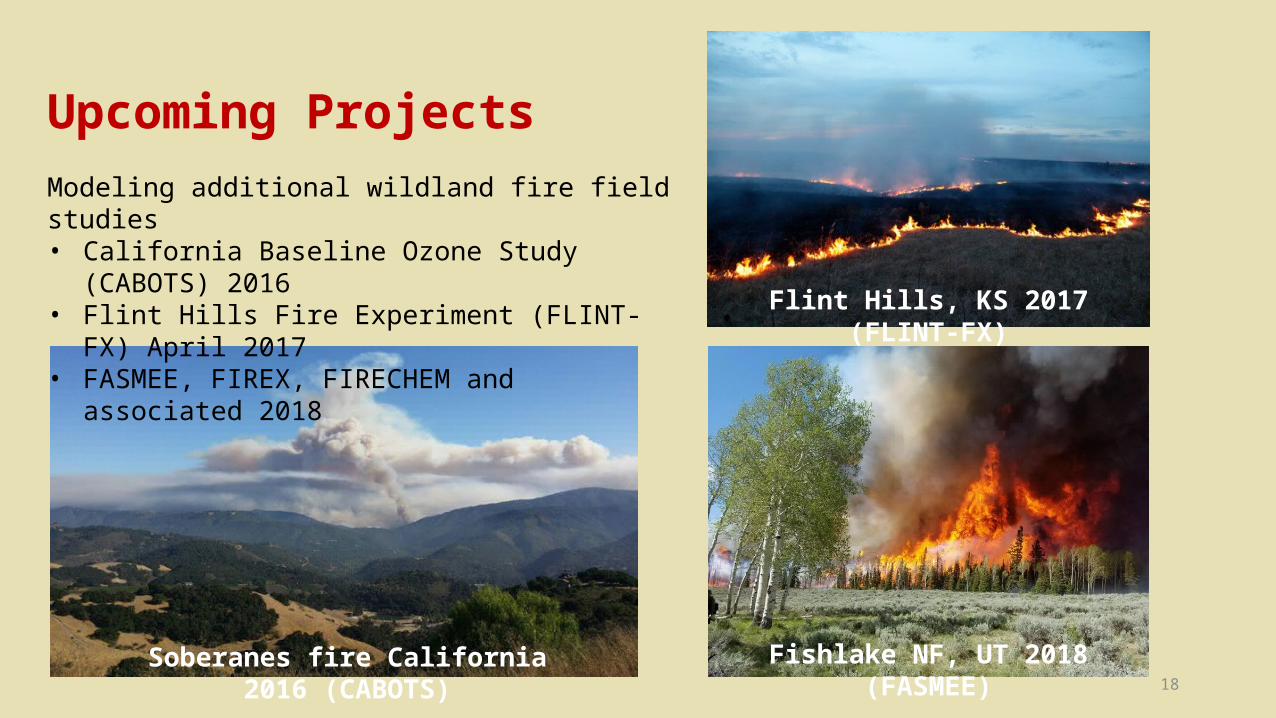
Upcoming ProjectsModeling additional wildland fire field studies• California Baseline Ozone Study (CABOTS) 2016• Flint Hills Fire Experiment (FLINT-FX) April 2017• FASMEE, FIREX, FIRECHEM and associated 2018
Soberanes fire California 2016 (CABOTS)
Flint Hills, KS 2017 (FLINT-FX)
Fishlake NF, UT 2018 (FASMEE)
19
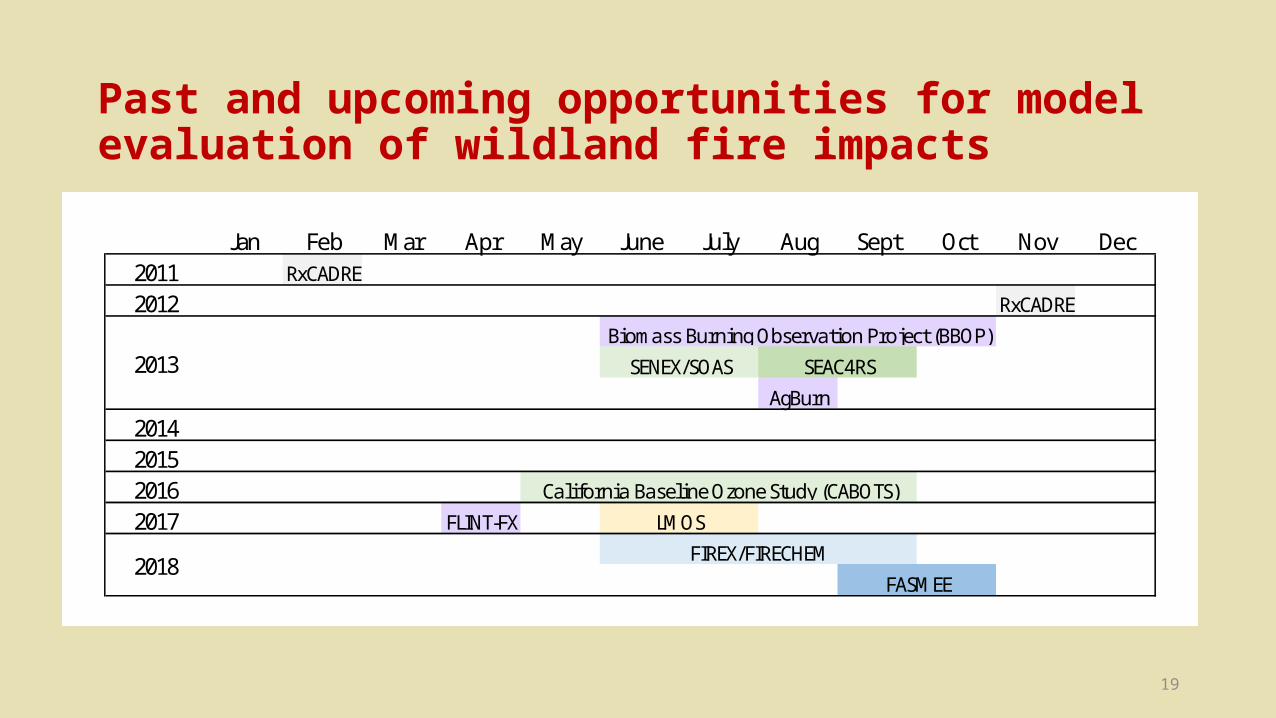
Past and upcoming opportunities for model evaluation of wildland fire impacts
Jan Feb Mar Apr May June July Aug Sept Oct Nov Dec2011 RxCADRE2012 RxCADRE
AgBurn2014201520162017 FLINT-FX
2018
California Baseline Ozone Study (CABOTS)
FIREX/FIRECHEMFASMEE
SENEX/SOAS SEAC4RS2013Biomass Burning Observation Project (BBOP)
LMOS

20
What are outstanding needs for local to regional scale O3/PM wildland fire modeling?• Evaluate existing satellite detection process and new geostationary satellite
scheduled to be operational by 2017• Fire emissions by fuel type and combustion component (flaming to smoldering)
• Includes speciation of VOC, directly emitted PM2.5, oxidized nitrogen gases• Temporal (hour of the day) allocation of emissions by combustion component
• Plume rise/vertical allocation for flaming and smoldering emissions in CMAQ photochemical model (and SMOKE) during day and night time
• Near-event and downwind O3 and PM2.5 chemistry during day and night time• Optical properties of smoke are not well characterized meaning photochemistry
may be overstated near large fires• Projecting future year wildland fires for climate impact scenarios
21
Acknowledgements• James Beidler, Chris Allen, Allan Beidler, Lara Reynolds, Kathy Brehme – CSRA • Emma Yates, Laura Iraci – NASA-AMES• Tom Pierce, George Pouliot, Sergey Napelenok, Tyler Fox – US EPA
References• Baker KR, Woody M, Tonnesen G, Hutzell G, Pye H, Beaver M, Pouliot G, Pierce T. 2016.
Contribution of regional-scale fire events to ozone and PM2.5 air quality estimated by photochemical modeling approaches. Atmospheric Environment, dx.doi.org/10.1016/j.atmosenv.2016.06.032.
22
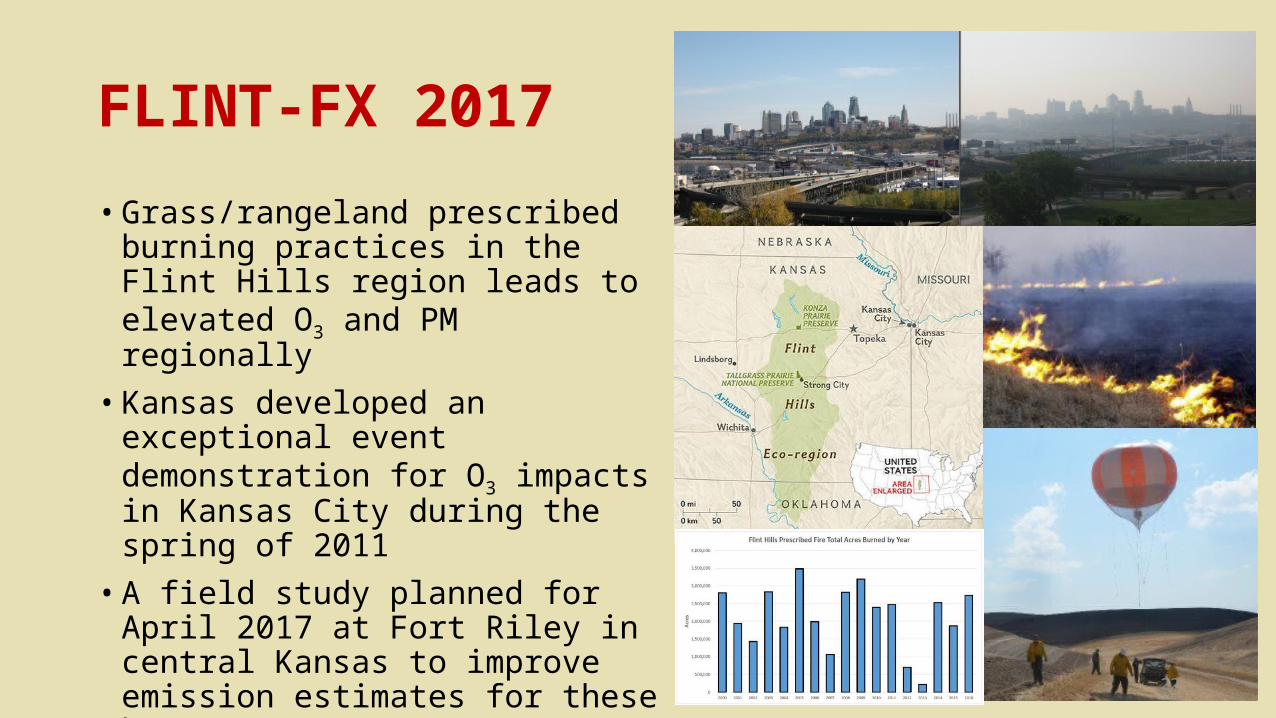
FLINT-FX 2017• Grass/rangeland prescribed burning
practices in the Flint Hills region leads to elevated O3 and PM regionally• Kansas developed an exceptional event
demonstration for O3 impacts in Kansas City during the spring of 2011• A field study planned for April 2017 at
Fort Riley in central Kansas to improve emission estimates for these burns• Contact Kirk Baker (baker.kirk@epav) or
Brian Gullett ([email protected]) for information about this field study

23
F3: FASMEE, FIREX, FIRECHEM• Field campaigns providing important chemical and optical
measurements include FIREX (2018) and FIRECHEM (2018) for western U.S. wildfires• http://www.esrl.noaa.gov/csd/projects/firex/
• Field campaigns providing fuel information, area burned, plume structure, and chemical measurements include FASMEE for western U.S. (2018) and southeast U.S. (TBD) prescribed fires• Fire and Smoke Modeling Evaluation Experiment (www.fasmee.net)