Embed Size (px)
Citation preview
WPS 2.61+
POLIcy RESEARCH WORKING PAPER 2644
Local Institutions, Poverty, Social capital-includingLocal Institutions, Poverty, membership in an association
and Household Welfare such as an agrarian
in Bolivia syndicate-reduces theprobability of being poor in
Bolivia. The returns to
Cbristiaan Grootaert household investment in
Deepa Narayan social capital are generallygreater for the poor than for
the rich, and greater for
households with little land
than for those with more
land. Returns to such
membership for Bolivia's
poorest exceed returns to
education and other assets.
The World Bank
Social Development Departmentand
Poverty Reduction and Economic Management NetworkPoverty Division
July 2001
Pub
lic D
iscl
osur
e A
utho
rized
Pub
lic D
iscl
osur
e A
utho
rized
Pub
lic D
iscl
osur
e A
utho
rized
Pub
lic D
iscl
osur
e A
utho
rized

POLICY RESEARCH WORKING PAPER 2644
Summary findingsGrootaert and Narayan empirically estimate the impact effect of social capital on household welfare was foundof social capital on household welfare in Bolivia - where to be 2.5 times that of human capital. Increasing thethey found 67 different types of local associations. They average educational endowment of each adult in thefocus on household memberships in local associations as household by one year (about a 25-percent increase)being especially relevant to daily decisions that affect would increase per capita household spending 4.2household welfare and consumption. percent; a similar increase in the social capital
On average, households belong to 1.4 groups and endowment would increase spending 9 to 10.5 percent.associations: 62 percent belong to agrarian syndicates, 16 They measured social capital along six dimensions:percent to production groups, 13 percent to social density of memberships, internal heterogeneity ofservice groups, and 10 percent to education and health associations (by gender, age, education, religion, etc.),groups. Smaller numbers belong to religious and meeting attendance, active participation ingovernment groups. decisionmaking, payment of dues (in cash and in kind),
Agrarian syndicates, created by government decree in and community orientation. The strongest effect came1952, are now viewed mainly as community-initiated from number of memberships. Active memberslhip in aninstitutions to manage communal resources. They have agrarian syndicate is associated with an average 11.5been registered as legal entities to work closely with percent increase in household spending. Membership inmunicipalities to represent the interests and priorities of another local association is associated with a 5.3-percentlocal people in municipal decisionmaking. higher spending level.
The effects of social capital operate through (at least) Empirical results partly confirm the hypothesis thatthree mechanisms: sharing of information among social capital provides long-term benefits such as betterassociation members; the reduction of opportunistic access to credit and a higher level of trust in thebehavior; and better collective decisionmaking. The community as a source of assistance in case of need.
This paper-a joint product of the Social Development Department and the Poverty Division, Poverty Reduction andEconomic Management Network-is part of a larger effort in the Bank to understand better the role of local institutions,and social capital in general, for poverty reduction.. Copies of the paper are available free from the World Bank, 1818 HStreet NW, Washington, DC 20433. Please contact Gracie Ochieng, room MC5-410, telephone 202-473-1123, fax 202-522-3247, email address gochieng@(worldbank.org. Policy Research Working Papers are also posted on the Web at http://econ.worldbank.org. The authors may be contacted at cgrootaert(kworldbank.org or [email protected]. July2001. (66 pages)
The Policy Research Working Paper Series disseminates the findings of work in progress to encourage the exchange of ideas aboutdevelopment issues. An objective of the series is to get the findings out quickly, even if the presentations are less than fully polished. Thepapers carry the namzes of the authors and should be cited accordingly. The findings, interpretations, and conclusions expressed in thispaper are entirely those of the authors. The) do not necessarily represent the view of the World Bank, its Executive Directors, or the
countries they represent.
Produced by the Policy Research Dissemination Center

LOCAL INSTITUTIONS, POVERTY AND
HOUSEHOLD WELFARE IN BOLIVIA
Christiaan GrootaertDeepa Narayan
The World BankSocial Development FamilyEnvironmentally and Socially
Sustainable Development Network

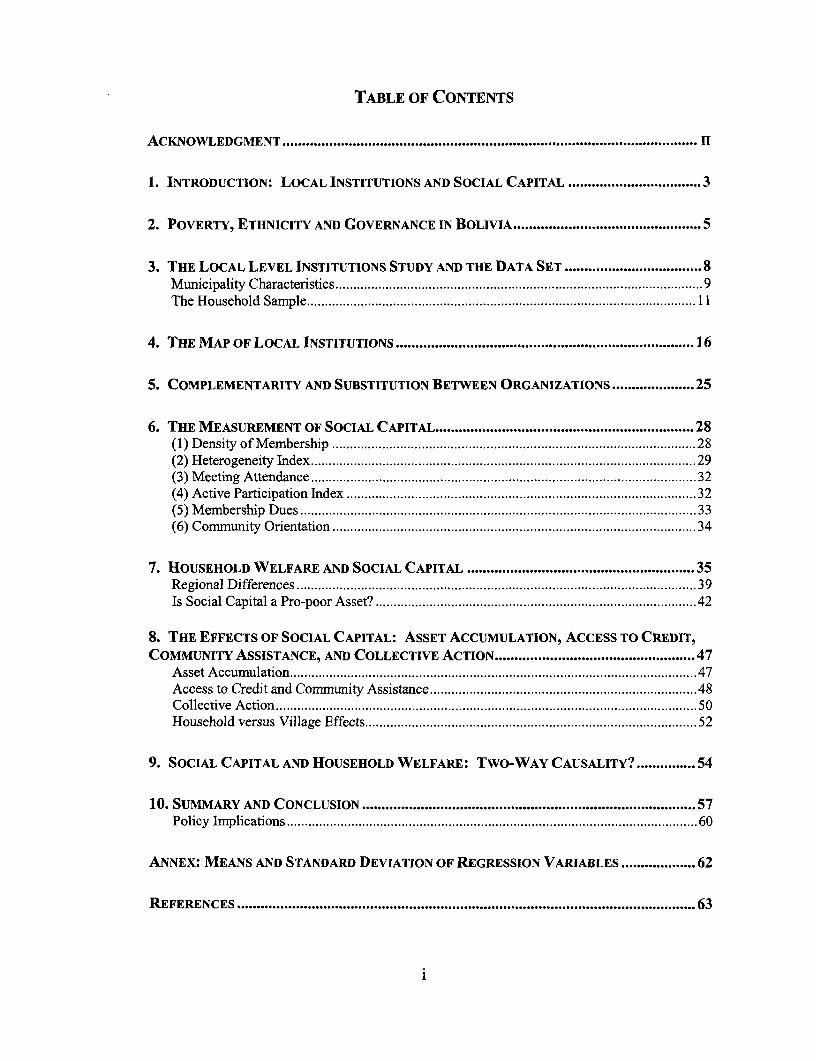
TABLE OF CONTENTS
ACKNOWLEDGMENT ................................................................................................ II
1. INTRODUCTION: LOCAL INSTITUTIONS AND SOCIAL CAPITAL ............. ..................... 3
2. POVERTY, ETHNICITY AND GOVERNANCE IN BOLIVIA ................................................ 5
3. THE LOCAL LEVEL INSTITUTIONS STUDY AND THE DATA SET .............. ..................... 8Municipality Characteristics .................................................................... 9The Household Sample .................................................................... 11
4. THE MAP OF LOCAL INSTITUTIONS ............................ .................................. 16
5. COMPLEMENTARITY AND SUBSTITUTION BETWEEN ORGANIZATIONS ......... ............ 25
6. THE MEASUREMENT OF SOCIAL CAPITAL .............................................................. 28(1) Density of Membership .................................................................... 28(2) Heterogeneity Index .................................................................... 29(3) Meeting Attendance .................................................................... 32(4) Active Participation Index .................................................................... 32(5) Membership Dues .................................................................... 33(6) Community Orientation .................................................................... 34
7. HOUSEHOLD WELFARE AND SOCIAL CAPITAL .......................................................... 35Regional Differences .................................................................... 39Is Social Capital a Pro-poor Asset? . .................................................................... 42
8. THE EFFECTS OF SOCIAL CAPITAL: ASSET ACCUMULATION, ACCESS TO CREDIT,COMMUNITY ASSISTANCE, AND COLLECTIVE ACTION ................................................... 47
Asset Accumulation .................................................................... 47Access to Credit and Community Assistance .................................................................... 48Collective Action .................................................................... 50Household versus Village Effects .................................................................... 52
9. SOCIAL CAPITAL AND HOUSEHOLD WELFARE: Two-WAY CAUSALITY? ............... 54
10. SUMMARY AND CONCLUSION ............................................................... 57Policy Implications .................................................................... 60
ANNEX: MEANS AND STANDARD DEVIATION OF REGRESSION VARIABLES ......... .......... 62
REFERENCES .............................................................. 63
i

ACKNOWLEDGMENT
The authors would like to thank Anthony Bebbington for helpful comments on an earlierdraft. The processing and management of the data files was the responsibility of KalpanaMehra and Gi-Taik Oh. General research assistance was provided by Susan Assaf and BenJones. Gracie Ochieng was responsible for text processing.
The Local Level Institutions (LLI) study was conducted under the leadership ofGloria Davis, Director, Social Development Department. In the initial phases, taskManagers were Anthony Bebbington (July 1995 -June 1996) and Christiaan Grootaert(July 1996 - December 1997). The final phase of the study was undertaken as a jointventure between the ESSD and PREM Networks and co-managed by Christiaan Grootaertand Deepa Narayan. The study received financial support from the Government ofNorway.
The Bolivia country-study was undertaken by a team from the consulting firmSinergia. Coordinator was Godofredo Sand6val and the research team consisted of JulioCordova, Beatriz Ascarrunz, Afredo Balb6a, Griselda Gonzales, and Gloria Velasquez.
The Burkina Faso country-study was coordinated by Paula Donnelly-Roark. Thefield work was undertaken under the auspices of the Commission Nationale pour laDecentralisation.
The Indonesia country-study was coordinated by Scott Guggenheim and theresearch team consisted of Kamala Chandrakirana, Pieter Evers, Sjari Manaf and SilviaWerner.
ii
1. INTRODUCTION: LOCAL INSTITUTIONS AND SOCIAL CAPITAL
Of every four Bolivians, three are Indians
Xavier Alb6, 1994
With decentralization the current rage in development, the importance of local levelinstitutions should reach new heights. Yet, the primary focus in the decentralizationliterature is on the structures and functions of devolved formal authorities. Formalgovernment systems are embedded in the local social organizational context. Henceunderstanding how and when local governments become inclusive and function effectivelyin basic service provision and poverty reduction, requires understanding the interplaybetween the formal and informal institutions and the interplay between history, politics andchanges in social organization over time. This requires overlaying quantitative data withhistorical qualitative data. The Local Level Institutions (LLI) Study in Bolivia, provides aparticularly rich context to disentangle these relationships.
We combine two rich data sets both of which were collected as part of the LLIStudy. The qualitative data explore the history, politics and dynamics of localassociations, municipal government, and the history and nature of social relations in fourdifferent municipalities: Mizque, Charagua, Tiahuanacu and Villa Serrano. We use aquantitative data set derived from a household survey to develop indices of social capitaland econometric techniques to explore linkages between poverty and social capital at thehousehold and community level in the same four municipalities. Both data sets werecreated by the Sinergia group in Bolivia led by Godofredo Sandoval. We also makeextensive use of their report Grassroots Organizations and Local Development in Boliviawritten by Sandoval and associates (1998).
We draw four main conclusions. First, social capital measured by memberships inagrarian syndicates and other associations matters for poverty reduction. Some dimensionsof social capital or characteristics of groups are more central than others. Household andvillage social capital matters but so does bridging or linking social capital. As an asset,social capital matters more for the poor than the non-poor and has greater effect onhousehold welfare than investment in primary education. Households with higher socialcapital are likely to have more permanent physical assets which help them smoothconsumption during periods of income fluctuation. They are more likely to participate incollective action and be able to draw on community resources in times of need.
Second, there is a relation of complementarity and substitution between theinformal and formal institutions. At the municipal level, the relationship between socialcapital and welfare is modified by the nature and presence of other formal institutions.Thus, Mizque achieves complementarity between strong traditional institutions, strongsupra-community linkage organizations, and effective municipal government. Mizque isalso the most prosperous of the four municipalities. On the other extreme is Villa Serrano,
3

in which the traditional institutions are weak and exclude the poor, the poor belong to otherlocal associations to cope with poverty, and there are weak linkage organizations and anineffective municipal govermnent. Villa Serrano is the poorest of the four municipalities.Charagua, which has managed a renewal of supra-community indigenous organizations,has an effective municipal government even though it is dominated by the elite, andexperiences higher levels of economic prosperity.
Third, history, politics and the existing social and power structures have far-reaching effects on social capital formation. However, when there are deep changes inlaw, politics, economic structure and markets, changes in social capital formation whichlead to poverty reduction are possible. The strategy has to be context specific. Over thelong run NGOs and other external agents can play a critical role in bringing about positivechanges in poverty-reducing social capital. The form of assistance is context-specific andneeds to be derived from a thorough diagnosis of the local social, political, institutionaland economic context situated in the broader national context.
Fourth, the degree of access to markets and ease of communication throughproximity to major roads and access to electricity affects both economic opportunities andsocial capital formation. When economic opportunities are low in the local areas, peoplemigrate to cities seeking new sources of income. This affects organizational life.However, proximity to cities, such as in Tiahuanacu, results in migrants maintaining closecontact with the local areas. Organizational life seems to be most negatively affected inareas of low economic potential, with migration into cities and physical isolation. This ismost evident in Villa Serrano. However, as new opportunities open up in local areas,communities witness reverse migration, as many indigenous groups prefer to live in theirown communities where their tradition, identity and culture are honored. This is clearestin Charagua.
4

2. POVERTY, ETHNICITY AND GOVERNANCE IN BOLIVIA
Bolivia, with a population of 7.2 million, is a poor country with great ethnic andgeographic diversity. Based on an index of unsatisfied basic needs' set in 1992,approximately 70% of the population was classified poor. Overall, 94% of the ruralpopulation was classified poor, compared to 98% in 1976. In addition, among the poor,about 90% were classified as being below the extreme poverty line. In terms of urbanpoverty, while 50% of the population was classified poor in 1992, the number was 65% in1976 (World Bank, 1996).
Radical structural adjustment measures in the 1980's consisting of liberalization ofmost prices, privatization, reform of public enterprises and closing of unprofitable mines,helped curtail hyper-inflation. It also led to increased migration to the cities (30,000miners were laid off) and did little for poverty reduction in the rural areas.
Seventy percent of the population is indigenous. There is great overlap betweenbeing poor and being indigenous. In rural areas, 90% of the population is indigenous,primarily Aymara and Quechua, who traditionally live in the altiplano and the valley of thehigh Andes. Poverty and extreme poverty are more prevalent in Aymara speakinghouseholds. Another 30 to 40 ethnic and language groups are spread across the altiplanoand lowlands of Eastern and Northern Bolivia (Strobele-Gregor, 1994, Alb6, 1994).
According to World Bank (1996) estimates, 1) being indigenous increases theprobability of being poor by about 14%; 2) each additional child increases the probabilityof being poor by 6.5%; 3) an unemployed household head increases the probability ofbeing poor by about 14%; and 4) each additional year of schooling reduced the probabilityof being poor significantly. In all studies, indigenous women appear the worst off on everymeasure of basic needs.
Bolivia has an unequal distribution of income, which is severe even by LatinAmerican standards. This inequality has not improved over time (Birdsall et al. 1998). Ina cross-country analysis, Birdsall and Londofio (1997) have shown that the greater theinitial inequality in land and education, the lower the growth rates experienced bycountries. The impact of initial inequality on income growth more than doubles when thesample is restricted only to poor countries.
Most writers on Bolivia agree that Bolivian society since 1532 has been a highlystratified dual society of Spaniards and Indians. Following independence in 1825, theBolivian state was dominated by a small oligarchy of tin-mining interests until the defeatin the Chaco War against Paraguay in the 1930s (Alb6, 1994; Garcia Arganaras, 1992).This defeat proved to be so traumatic that it generated widespread questioning of the
The implied rural poverty line was 158.9 Bs per month (59% of the urban poverty line) and theextreme poverty line in rural areas was 119.2 Bs per person per month (80% of the urbanequivalent).
5

landed and mining interests ruling both state and society. It sowed the seeds for theemergence of the MNR (Movimiento Nacionalista Revoluci6nario) - a revolutionaryalliance of urban traders, peasants, and mine-workers. The 1952 agrarian reform was partof this process whereby land was redistributed, mines nationalized and peasantorganizations, the sindicatos, 'incorporated' into the state. The goal was a nation statewith the culture of the Mestizo, with the Indians and half-Indians adopting the culture ofthe ruling society and becoming culturally white (Alb6, 1994). The land redistribution wasnot equally successful everywhere and in many areas haciendas remained intact (Str6bele-Gregor, 1996).
It was only in the early 1980's that Bolivia moved from a military state to ademocratic state. The 1980's marked the beginning of an adoption of neoliberal market-based economic strategies and the gradual consolidation of democracy (Albro, 1998). Thegrowing gap between ideology and a reality which denied basic rights, fostered widespreaddiscrimination and excluded indigenous groups from all spheres of social, political andeconomic life, led gradually to the emergence of cultural identity movements, identitypolitics and demands for autonomous organizations and cultural pluralism. In the early1970's the Katarista movement emerged among the Aymara Indians. The movement wasnamed in memory of Tupaj Katari, an Aymara leader who led an anticolonial uprising in1781. This movement was also the forerunner of the first independent national peasantconfederation, the CSUTCB, (Confederaci6n Unica de Trabajadores Campesinos deBolivia) established in 1979. While the Katarista movement experienced internal rifts anddifficulties in organizing, the ideas they espoused, including the creation of a plurinationalstate, gained ground (Alb6, 1995). In the late 1980's indigenous organizations emerged inthe lowlands of eastern Bolivia, and in 1991 the Coordinator of Indigenous Peoples of theBeni led the well-publicized "March for Territory and Dignity" in which 12 ethnic groupsmarched 700 kilometers through the jungle and the snow-capped Andes to La Paz,captivating the country's attention for 40 days and creating national awareness of theirissues (Alb6, 1995). But while the indigenous groups created political parties, they did notdo well at the polls. This was due to lack of funds, parochial organization and internaldivisions. Within the Katarista movement, it was Victor Hugo Cardenas, an Aymara andKatarista movement leader since 1978 who came to the fore. A one-time parliamentarian,Cardenas was invited to share a presidential ticket with Gonzalo Sanchez de Lozada toform a coalition with the MNR for the 1993 election. The MNR alliance with the MRTKL(Movimiento Revolucionario Tupaj Katari de Liberaci6n) won the election, and an AymaraIndian became a Vice-President for the first time.
Having instituted structural economic reforms in the 1980's and having won the1993 elections, the MNR government, under the leadership of President Sanchez deLozado, undertook a second generation of reforms to deepen economic changes anddemocracy and to address the issues of inequality resulting from 500 years of ethnicexclusion.
In a radical step to address rural poverty issues, Bolivia promulgated the Law ofPopular Participation (Ley de Participaci6n Popular, LPP) in 1994, and theDecentralization Law (Ley de Descentralizaci6n Administrativa, LDA) in 1995, whichgave resources and responsibilities to municipalities and structured the involvement of
6
local grassroots organizations in the planning, implementation and monitoring ofmunicipal government.2 Almost overnight, Bolivia moved from a highly centralizedpolitical, administrative and economic state, to a devolved state consisting of 311municipalities, 248 of which were newly created. Over 30% of the municipalities weresmall and consisted of less than 5,000 people (Tuchschneider, 1998). Whereas before thereform the three main cities received 84% of all devolved funds while the majority of ruralcommunities received nothing, after the reform the share of the three cities fell to 29% andprovincial and rural area budgets increased from 42% to over 3000% (Faguet, 1998). Thecriteria of allocation of resources to different areas shifted from one of politicalconsideration to allocation based on population. Title to local infrastructure and futureprovision of basic services became a municipal responsibility. Most importantly, the LPPrecognized over 15,000 existing territorial organizations, indigenous organizations, peasantorganizations and neighborhood councils as legitimate grassroots organizations andincorporated them into 1,600 Oversight Vigilance Committees (OTBs) (Tuchschneider,1998). To keep municipalities accountable, the Oversight Committees were to channellocal citizen preferences and demands and provide independent oversight over municipalresource allocation decisions and actions. Thus, for the first time in Bolivia, OTBs becarnethe chief local mechanism for ensuring local government accountability.
Bolivia is also characterized by great regional differences in social structure, in thedegree of harmony and conflict and the nature of social relations between indigenous andSpanish populations, the degree of inclusion of indigenous groups in formal systems ofgovernance, the degree of social cohesion among indigenous groups, the presence of'linkage' organizations, the degree of linkage to markets and the presence of NGOs. Thesefactors comprise the social capital of an area and influence the extent to which OTBs canfunction effectively to create responsive municipal governments. It is against this historyof repression, exclusion, and radical economic and social restructuring that the results fromour study need to be considered.
2 A third law enacted at that time relates to privatization of public enterprises, and stipulated that half theproceeds from the sales will be used to create a national pension fund and solidarity bonds for allBolivians above age 21. The educational system will also be updated to reflect the cultural and linguisticdiversity of Bolivia.
7
3. THE LocAL LEVEL INSTITUTIONS STUDY AND THE DATA SET
The data set for this paper comes from the Local Level Institutions (LLI) Study, acomparative study for three countries (Bolivia, Burkina Faso and Indonesia), that aims toinvestigate the role of local institutions in providing service delivery and in affectingwelfare and poverty outcomes.3 Data were collected at the community, the district and thehousehold level.
At the level of the community, interviews with focus groups of households and withcommunity leaders were held to establish a map of functioning institutions in thecommunity. Three instruments were used:
* Informnation on community services was obtained through interviews with keyinformants such as the village chief, teacher, health provider, etc. This wassupplemented with information on the local economy (infrastructure anddistance to markets), local society (ethnic/religious composition) and localinstitutions.
* Community services were also discussed with groups of households, with theobjective of learning the community's perspective on the quality of service, itsexperience with collective action, and its views on local institutions anddevelopment projects.
a For the most important local institutions, interviews were held with leaders andmembers, as well as non-members, in order to get a balanced view of the role ofthe institutions in the village, their development over time, their main activities,relations with other institutions and government, and their main strengths andweaknesses.
At the district level (defined as the administrative level above the village orcommunity), data were collected concerning the extent of service coverage and theinstitutional arrangements for the provision of services. Information was also obtainedabout the general functioning of the district administration and its relation with civicorganizations, through interviews with general and sectoral managers at the district level.
The third and critical part of the data collection was a household survey that aimedto capture households' actual participation in local institutions, their use of services, andinformation that identifies the welfare level of households and their coping strategies. Thequestionnaire consisted of six sections:
The objectives of the Local Level Institutions Study and the questionnaires are further discussed in WorldBank (1998).
8

* demographic information on household members
* participation in local institutions
* characteristics of the most important groups
* service provision profiles
* perceptions of community trust and collaboration
* household economy and coping strategies.
The limited resources available did not make possible a sampling framework suchthat the studies would be representative for the countries at the national level. Instead,three or four areas were selected in each country (municipalities in Bolivia, provinces inBurkina Faso and Indonesia), which represent different economic, social and institutionalenvironments. In the case of Bolivia, the collected data covered four municipalities("municipios"): Charagua, Mizque, Tiahuanacu and Villa Serrano.
Bolivia is a country with a strong geographical and cultural heterogeneity.Climate, ecology and altitude vary significantly, ranging from the eastern plains at about1,000 meters above sea level, to the highlands at altitudes approaching 4,000 meters abovesea level. As already discussed, Bolivia is a multi-ethnic and multi-lingual country. Thethree most important indigenous groups are the Aymara who live in the highlands, theQuechua who inhabit the valleys, and the Guarani in the eastern lowlands. The fourselected municipalities cover the main ecological zones of Bolivia as well as its principalindigenous groups.
Municipality Characteristics4
Mizque, population 20,000, is located in Bolivia's central valleys in the Cochabambadepartment at about 2,200 meters above sea level (Table 1). The climate is hot and thearea is subject to periods of drought. It is inhabited by Quechua campesinos who farmintensively on small parcels of land. Agriculture, irrigated and unirrigated, is the mostimportant economic activity and there are several irrigation committees to manage waterresources collectively. Most land tenure has its origin in the adjudication of expropriatedhaciendas, but in most cases, land ownership has still not been legalized. Mizqueexperiences seasonal migration to Chapare where young men work as day laborers in theproduction and processing of coca leaf. Young women go to Cochabamba to work asdomestic servants. Mizque has a trunk road that connects the municipal capital withCochabamba, 180 kilometers away.
4 These descriptions are summarized from Sandoval et al, 1998. For full descriptions see their report.
9

Table 1: Selected Socio-Economic Characteristics of the Study Areas
Charagua Mizque Tiahuanacu Villa SerranoRegion Chaco Plain Central Andean Southern
Valleys ValleysAltitude
(meters above sea level) 980 2,225 3,870 2,378Population 18,769 20,170 13,151 12,616Rural population (%) 71% 96% 92% 80%% of communities with
primary school 79% 22% 100% 61%Number of health centers| and hospitals 16 11 6 7
Source: Sandoval et al (1998).
Tiahuanacu, population 13,000, is located in the highlands just an hour away fromthe city of La Paz. An asphalt road connects it to the Bolivian capital. Tiahuanacu has thebest developed road system of the four provinces with secondary roads passablethroughout the year. Cold and arid, Tiahuanacu is located at an altitude of 3,900 metersabove sea level. It is inhabited by Aymara campesinos who engage in subsistence farmingand dairy production. Even within the municipality, which consists of 41 communities, theagro-ecological zones vary considerably in agricultural prosperity. In this area, landreform did result in the break-up of haciendas. Life in Tiahuanacu is dominated by theproximity to La Paz. Seasonal and permanent migration anong the young to La Paz is afact of life and is reflected in the fact that 41% of household heads are over 56 years ofage, compared to approximately 20% in the other three municipalities.
Charagua, population 19,000, is located on the plains of Eastern Bolivia at analtitude of about 1,000 meters. It is populated by the Guarani who until recently have beendominated by the Criollo minority. It is an 8 hour trip by road from the city of Santa Cruz.Unlike the other municipalities, Charagua has experienced population growth. This isbecause the in-migration of merchants and the poor who come for the cotton harvest hasmore than offset the out-migration to Santa Cruz, Argentina, Paraguay and Brazil. TheGuarani indigenous population lives side by side with hacienda owners engaged in raisinglivestock and the exploitation of forests. Local power is concentrated in the hands oftimber companies and cattle ranchers. The municipality consists of three agro-ecologicalzones: the scrub forest, the foothills and the sandy Chaco plain with very low rainfall andsome of the poorest communities in the municipality.
Villa Serrano, population 13,000, is located in the valleys of southern Bolivia atabout 2,400 meters above sea level. It is 155 miles away from the city of Sucre. Its variedclimate is typical of the many different micro-climates found in the mountainous Andeancountryside. Its population, although original Quechua, has been largely hispanicized andpractices subsistence fanning. Haciendas still exist in this part of the country and controllocal power. The small population is dispersed over large areas which leads to migrationand poor social service coverage. In Villa Serrano, the population has declined because ofout-migration primarily to the more prosperous Santa Cruz department.
10

The Household Sample
Within each municipality, nine rural communities were selected randomly. The capital ofthe municipality was included to represent the urban areas. In each of these samplingunits, 25 households were selected randomly for a total sample of 1,000 households.5 Thefollowing tables provide a brief description of the social and economic characteristics ofthe sample households.
In order to evaluate whether the characteristics of the respondent, specificallygender and position in the household, would have an effect on responses, the field workwas organized to attempt to interview roughly 50% men and 50% women. Table 2indicates that this objective was fairly well achieved: for the study zone as a whole, 53%of respondents were male and 47% were female. Almost two-thirds of the respondentswere heads of households and one-third were spouses.
Table 2: Selected Characteristics of Respondents (in %)
Charagua Mizque Tiahuanacu Villa AllSerrano I
Gender of RespondentMale 48.8 49.6 58.0 55.2 52.9Female 51.2 50.4 42.0 44.8 47.1
Position in HouseholdHead 55.2 59.2 76.8 62.4 63.4Spouse 44.8 40.8 23.2 37.6 36.6
LanguageCastellano 58.0 2.0 5.6 95.6 40.3Aymara 0.0 0.0 94.4 0.0 23.6Quechua 0.0 98.0 0.0 4.4 25.6Guarani 42.0 0.0 0.0 0.0 10.5
ReligionCatholic 74.4 94.4 77.6 94.4 85.2Evangelical Protestant 24.0 4.8 21.2 4.4 13.6Other 1.6 0.8 1.2 1.2 1.2
Average years lived incommunity 30.1 33.4 44.2 32.5 35.0
Table 2 also indicates the linguistic diversity of Bolivia: indigenous languagesdominate in Mizque (Quechua) and Tiahuanacu (Aymara), while Spanish is spoken themost in Villa Serrano and Charagua. The majority of the population is Catholic, butimportant Protestant groups live in Charagua and Tiahuanacu.
5 For further details on the sampling procedure and the survey field work, see Sandoval et al, 1998.
11
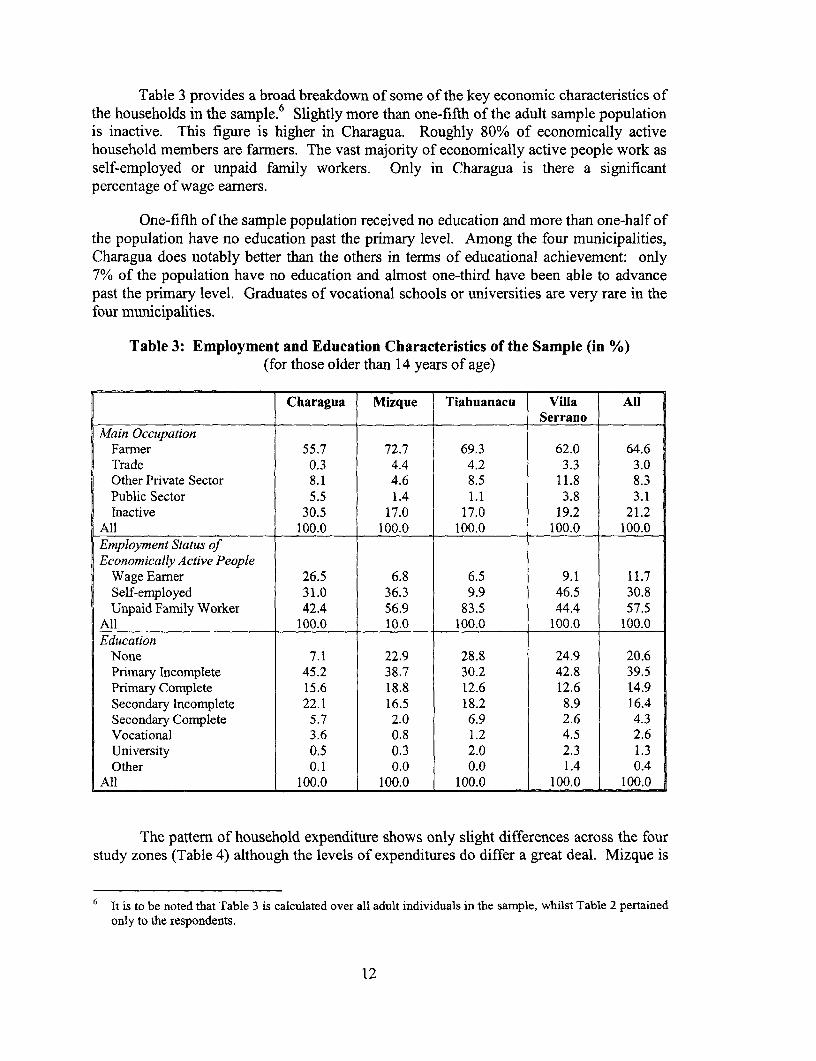
Table 3 provides a broad breakdown of some of the key economic characteristics ofthe households in the samnple.6 Slightly more than one-fifth of the adult sample populationis inactive. This figure is higher in Charagua. Roughly 80% of economically activehousehold members are farmers. The vast majority of economically active people work asself-employed or unpaid family workers. Only in Charagua is there a significantpercentage of wage earners.
One-fifth of the sample population received no education and more than one-half ofthe population have no education past the primary level. Among the four municipalities,Charagua does notably better than the others in terms of educational achievement: only7% of the population have no education and almost one-third have been able to advancepast the primary level. Graduates of vocational schools or universities are very rare in thefour municipalities.
Table 3: Employment and Education Characteristics of the Sample (in %)(for those older than 14 years of age)
Charagua Mizque Tiahuanacu Villa AllSerrano
Fanrmer 55.7 72.7 69.3 62.0 64.6Trade 0.3 4.4 4.2 3.3 3.0OtherPrivate Sector 8.1 4.6 8.5 11.8 8.3Public Sector 5.5 1.4 1.1 3.8 3.1Inactive 30.5 17.0 17.0 19.2 21.2
All 100.0 100.0 100.0 100.0 100.0Employment Status ofEconomically Active People
Wage Earner 26.5 6.8 6.5 9.1 11.7Self-employed 31.0 36.3 9.9 46.5 30.8Unpaid Family Worker 42.4 56.9 83.5 44.4 57.5
All 100.0 10.0 100.0 100.0 100.0Education
None 7.1 22.9 28.8 24.9 20.6Primary Incomplete 45.2 38.7 30.2 42.8 39.5Primary Complete 15.6 18.8 12.6 12.6 14.9Secondary Incomplete 22.1 16.5 18.2 8.9 16.4Secondary Complete 5.7 2.0 6.9 2.6 4.3Vocational 3.6 0.8 1.2 4.5 2.6University 0.5 0.3 2.0 2.3 1.3Other 0.1 0.0 0.0 1.4 0.4
All 100.0 100.0 100.0 100.0 100.0
The pattern of household expenditure shows only slight differences across the fourstudy zones (Table 4) although the levels of expenditures do differ a great deal. Mizque is
6 It is to be noted that Table 3 is calculated over all adult individuals in the sample, whilst Table 2 pertainedonly to the respondents.
12
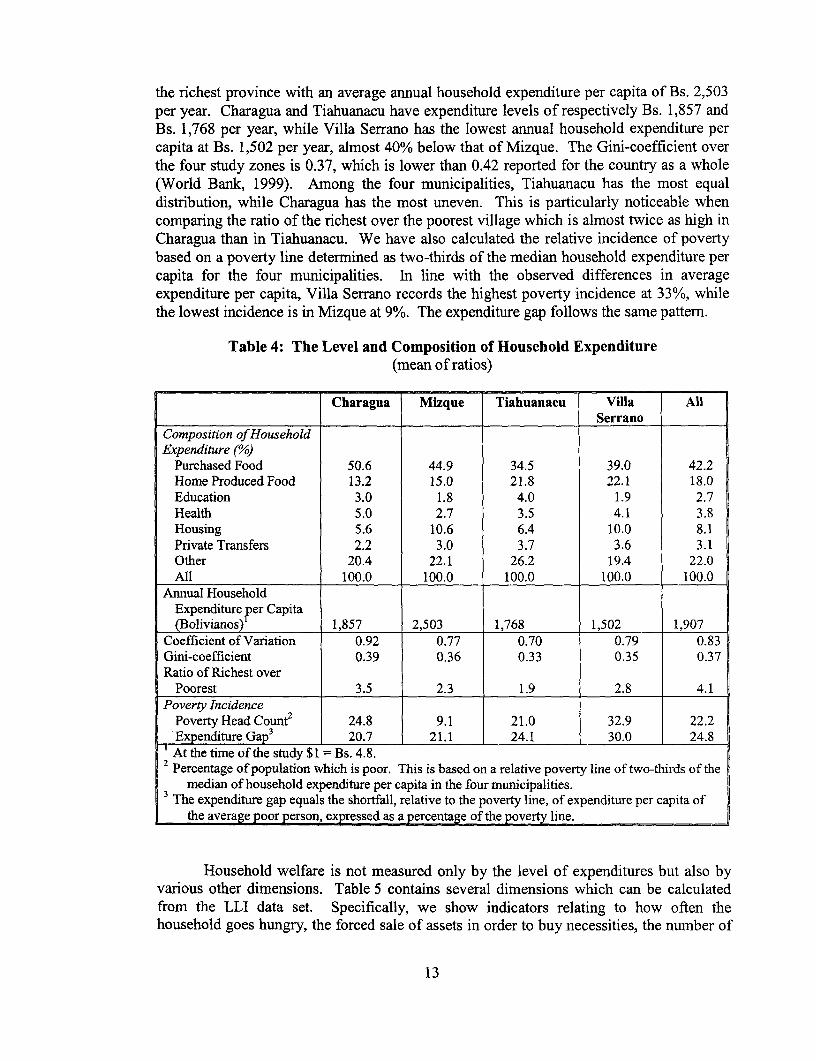
the richest province with an average annual household expenditure per capita of Bs. 2,503per year. Charagua and Tiahuanacu have expenditure levels of respectively Bs. 1,857 andBs. 1,768 per year, while Villa Serrano has the lowest annual household expenditure percapita at Bs. 1,502 per year, almost 40% below that of Mizque. The Gini-coefficient overthe four study zones is 0.37, which is lower than 0.42 reported for the country as a whole(World Bank, 1999). Among the four municipalities, Tiahuanacu has the most equaldistribution, while Charagua has the most uneven. This is particularly noticeable whencomparing the ratio of the richest over the poorest village which is almost twice as high inCharagua than in Tiahuanacu. We have also calculated the relative incidence of povertybased on a poverty line determined as two-thirds of the median household expenditure percapita for the four municipalities. In line with the observed differences in averageexpenditure per capita, Villa Serrano records the highest poverty incidence at 33%, whilethe lowest incidence is in Mizque at 9%. The expenditure gap follows the same pattern.
Table 4: The Level and Composition of Household Expenditure(mean of ratios)
Charagua Mizque Tiahuanacu Villa AllSerrano
Composition of HouseholdExpenditure (°/)
Purchased Food 50.6 44.9 34.5 39.0 42.2Home Produced Food 13.2 15.0 21.8 22.1 18.0Education 3.0 1.8 4.0 1.9 2.7Health 5.0 2.7 3.5 4.1 3.8Housing 5.6 10.6 6.4 10.0 8.1Private Transfers 2.2 3.0 3.7 3.6 3.1Other 20.4 22.1 26.2 19.4 22.0All 100.0 100.0 100.0 100.0 100.0
Annual HouseholdExpenditure per Capita(Bolivianos) 1,857 2,503 1,768 1,502 1,907
Coefficient of Variation 0.92 0.77 0.70 0.79 0.83Gini-coefficient 0.39 0.36 0.33 0.35 0.37Ratio of Richest over
Poorest 3.5 2.3 1.9 2.8 4.1Poverty Incidence
Poverty Head Count2 24.8 9.1 21.0 32.9 22.2Expenditure Gap3 20.7 21.1 24.1 30.0 24.8At the time of the study $1 = Bs. 4.8.
2 Percentage of population which is poor. This is based on a relative poverty line of two-thirds of themedian of household expenditure per capita in the four municipalities.
3 The expenditure gap equals the shortfall, relative to the poverty line, of expenditure per capita ofthe average poor person, expressed as a percentage of the poverty line.
Household welfare is not measured only by the level of expenditures but also byvarious other dimensions. Table 5 contains several dimensions which can be calculatedfrom the LLI data set. Specifically, we show indicators relating to how often thehousehold goes hungry, the forced sale of assets in order to buy necessities, the number of
13

children aged 5-14 who do not attend school, and access to tap water and electricity. Thedata are shown by quintiles which rank households based on household expenditure percapita. Table 5 suggests that 25% of sample households indicate that they often go hungryin the course of the year. However, the rate is much higher (38.5%) among the pooresthouseholds. About 1 in 5 households declared that in the past year they had to selllivestock or equipment in order to buy necessities. This figures varies less pronouncedly byquintile and is actually slightly higher for the richer households (presumably because theyhave more assets to sell). In the two poorest quintiles, more than 22% of households donot send all of their children to school, while in the richest quintile this is only 5.5%. Inaddition, 11.7% of households had to pull children out of school in order to work at homeor to work on the farm. However, the incidence of this is three times as high in the poorestas in the richest quintile. In terms of access to amenities, electricity is significantly moreavailable to the rich than to the poor although access to tap water is fairly even across thefive quintiles.
Table 5: Selected Indicators of Households Well-being
QuintilePercent of Households Poorest 2 3 4 Richest All
Which often go hungry 38.5 30.0 24.5 19.5 13.5 25.2Which sold land, livestockor equipment in order tobuy necessities 19.5 18.5 26.0 25.5 24.0 22.7Where not all children 5-14attend school 22.3 22.5 16.9 18.2 5.5 18.4Which pulled boys out ofschool to help on farm or athome 9.9 6.7 6.8 7.3 2.5 7.1Which pulled girls out ofschool to help on farm or athome 7.5 6.7 6.8 5.5 2.5 6.2Which pulled children outof school to help on farm orat home 15.5 12.1 11.4 11.0 4.9 11.7With access to electricity 12.5 18.0 23.5 40.0 57.5 30.3With access to tap water 45.5 49.0 51.0 52.0 60.5 51.6
Table 6 shows the ownership of various assets by households, such as durablegoods, land and animals. The durable goods most frequently owned by the samplehouseholds are a radio (present in almost two-thirds of all households), an audio system, abicycle, and a sewing machine. Overall, asset ownership is slightly higher in Tiahuanacu,which is probably explained by its proximity to La Paz, which improves access to suchassets, and in Mizque which also has the highest per capita expenditures. Overall assetownership is lowest in Villa Serrano. Ownership of animals is quite high in the study area:each household owns on average 20 large animals, and the variation across the fourprovinces is slight. The average household also owns 3.8 hectares of land. However, in
14

Charagua the average land ownership is somewhat higher at 5.0 hectares, while in Mizqueit is lowest at only 2.5 hectares.
From a social capital perspective, ease of communication is important. Themunicipalities differ in their overall access to communication and hence accessibility andease of networking. Once again Mizque and Tiahuanacu lead the other two provinces.Close to 50% of households in Mizque have access to electricity, 40% in Tiahuanacu, 22%in Charagua and 10% in Villa Serrano.
Table 6: Ownership of Household Durables, Land and Animals
Charagua Mizque Tiahuanacu Villa AllSerrano
Percent of HouseholdsOwning
Car/Tmck 1.2 4.0 2.0 1.6 2.2Boat 0.0 0.0 11.6 0.0 2.9Outboard Motor 0.4 0.8 0.4 0.0 0.4Motorcycle/Moped 1.6 6.4 3.2 2.0 3.3Bicycle 44.8 50.8 55.6 12.4 40.9Color TV 5.6 8.0 4.4 2.4 5.1Black/White TV 6.8 6.4 12.0 6.0 7.8Audio System 36.0 41.6 48.4 50.4 44.1Telephone 3.2 2.0 3.2 0.8 2.3Radio 64.4 58.8 82.4 54.4 65.0Refrigerator/Freezer 9.2 10.4 3.2 5.2 7.0Sewing Machine 19.2 22.8 33.2 26.0 25.3Washing Machine/Dryer 0.4 0.8 0.8 0.4 0.6Pressure Lamp 1.6 24.0 3.6 9.2 9.6Other Major Durable 4.0 4.8 3.6 17.2 7.4
Average Asset Score 2.0 2.4 2.7 1.9 2.2Average Number of Large-
Animals Owned 22.8 16.1 21.2 17.8 19.5Average Hectares of Land
Owned or Rented 5.0 2.5 3.9 3.7 3.8Oxen, cattle, horses, mules, goats, sheep and pigs.
In summary, the LLI sample shows four very diverse municipalities. Mizque, inBolivia's Central Valleys, is characterized by intensive agriculture on small plots of landand is the richest area. Charagua in the eastern plains of the country is the mostlinguistically and religiously diverse municipality. It has the highest education level andthe highest prevalence of wage employment, but is also characterized by the most unequaldistribution of household expenditure. Tiahuanacu is close to La Paz, and is characterizedby subsistence farming and a slightly below average household expenditure level. Lastly,Villa Serrano, in the valleys of southern Bolivia, is the poorest of the four study zones.
15

4. TiHE MAP OF LOCAL INSTITUTIONS
The LLI questionnaire includes a large section to record the number of organizations andhouseholds' memberships in these organizations. Overall, 67 different types oforganizations were recorded in the four municipalities. The total membership in theseorganizations was 1,432. Thus, the average households belonged to 1.4 groups andassociations. This density is much lower than in the two other countries in the LLI study:in both Indonesia and Burkina Faso, the average household belongs to 6 groups (althoughin the case of Burkina Faso, most of these memberships were not active). Thedisaggregation in categories of groups reported in Table 7 is parallel to the other countriesto allow a comparison. However the rest of the report recombines groups to reduce thenumber of categories and to reflect a functional distribution of groups and memberships.
The landscape of local institutions is dominated by the presence of agrariansyndicates (sindicatos campesinos). Although these were created by the state during theland redistribution reforms of 1952, over time they have come to function as the centralcommunity organization group. Agrarian syndicates are largely perceived to be managingcommunity resources ranging from land, forests, and water to resolving conflict. Thenumber of memberships in agrarian syndicates varies by municipality.
Table 7: Active Memberships in Local Institutions, by Municipality(original classification)
Tiahuanacu Villa Serrano Mizque Charagua All % of______ ______ ______ ~~~Total
____________________________ rTotal % Total % Total % Total %Community-Wide Organizations 238 54.0 119 31.2 237 72.3 46 16.3 640 44.7Sub-conrmunity Gender Groups 4 0.9 37 9.7 22 6.7 61 21.6 124 8.7Sub-community Generation Groups 1 0.2 1 0.3 0 0.0 4 1.4 6 0.4Religious Groups 17 3.9 15 3.9 2 0.6 21 7.4 55 3.8Social Service Groups 0 0.0 0 0.0 0 0.0 0 0.0 0 0.0Environmental Service Groups 2 0.5 4 1.0 0 0.0 0 0.0 6 0.4Productive Groups 20 4.5 12 3.1 7 2.1 66 23.4 105 7.3Labor Groups 3 0.7 3 0.8 2 0.6 1 0.4 9 0.6Natural Resource Management
Groups 0 0.0 21 5.5 12 3.7 6 2.1 39 2.7Credit/Finance Groups 2 0.5 0 0.0 9 2.7 0 0.0 11 0.8Marketing Groups 0 0.0 1 0.3 4 1.2 1 0.4 6 0.4Supra-community Level
Membership Organizations 22 5.0 41 10.8 13 4.0 2 0.7 78 5.4Recreational Groups 18 4.1 0 0.0 6 1.8 6 2.1 30 2.1Other 114 25.9 127 33.3 14 4.3 68 24.1 323 22.6,Total 441 100.0 381 100.0 328 100.0 282 100.0 1432 100.0
Memberships in groups managed by women are the next most prevalent categery,totaling 9% of memberships. These include: mothers clubs, originally created to channelfood distribution, but which now primarily focus on sewing, kitchen gardens, andprovision of school breakfasts; women's syndicates established to represent women's
16
demands since the creation of the agrarian syndicates; women's "food for work" groups;and a small number of women's credit groups.
About 7% of all memberships are in a variety of production-oriented groups. Theseinclude agricultural producers groups, livestock groups, artisan, trade and a range of othercommercially-oriented groups. Smaller numbers of memberships are in environmentalgroups (0.4%/o), labor groups (0.6%), natural resource management groups (2.7%), andcredit and finance groups (0.8%).
The total number of reported memberships in religious groups is surprisingly small,3.8%. However, this may be a function of the way people interpreted the question ratherthan reflecting church attendance.
Linkage organizations or supra-community organizations accounted for 5% of allmemberships. These include syndicate organizations at the cantonal, provincial anddepartmental levels as well as other associations that represented particular types of groupsacross communities. These included sports, religious, commercial, infrastructure, trade andwomen's groups.
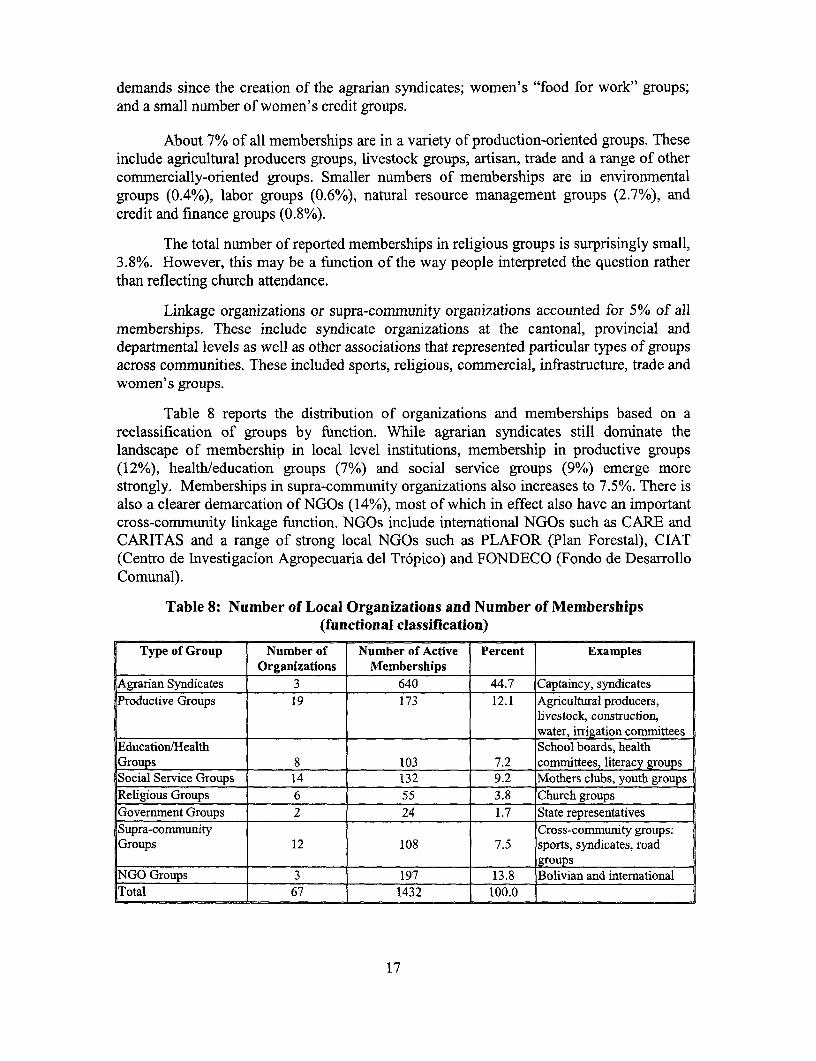
Table 8 reports the distribution of organizations and memberships based on areclassification of groups by function. While agrarian syndicates still dominate thelandscape of membership in local level institutions, membership in productive groups(12%), health/education groups (7%) and social service groups (9%) emerge morestrongly. Memberships in supra-community organizations also increases to 7.5%. There isalso a clearer demarcation of NGOs (14%), most of which in effect also have an importantcross-community linkage function. NGOs include international NGOs such as CARE andCARITAS and a range of strong local NGOs such as PLAFOR (Plan Forestal), CIAT(Centro de Investigacion Agropecuaria del Tr6pico) and FONDECO (Fondo de DesarrolloComunal).
Table 8: Number of Local Organizations and Number of Memberships(functional classification)
Type of Group Number of Number of Active Percent ExamplesOrganizations Memberships
Agrarian Syndicates 3 640 44.7 Captaincy, syndicatesProductive Groups 19 173 12.1 Agricultural producers,
livestock, construction,water, irrigation comrnittees
Education/Health School boards, healthGroups 8 103 7.2 cornmittees, literacy groupsSocial Service Groups 14 132 9.2 Mothers clubs, youth groupsReligious Groups 6 55 3.8 Church groupsGovernment Groups 2 24 1.7 State representativesSupra-community Cross-cormnunity groups:Groups 12 108 7.5 sports, syndicates, roadI_________ ____________groups_ __
NGO Groups 3 197 13.8 Bolivian and internationalTotal 67 1432 100.0
17

Table 9 reports the distribution of memberships across groups by municipality andTable 10 reports the distribution of households participating in local organizationls bymunicipality. It is important to note that most households in Mizque and Tiahuanacu areactive members of agrarian syndicates but that this is true for only 50% of households inVilla Serrano and less than 20% of households in Charagua.7 As is explored in more detailin the later section on measuring social capital, in municipalities where the syndicate is notactive or excludes the poor, other organizations that focus on improving livelihoods oreducation and health emerge to play important roles in people's lives. Thus, over 25% ofhouseholds in Charagua belong to social service clubs and to productive groups. In VillaSerrano, over 20% belong to education and health groups. Most of these groups are eithercommunity initiated or initiated by NGOs.
Table 9: Active Memberships in Local Institutions, by Municipality
Tiahuanacu Villa Mizque Charagua All % ofSerrano Total
Total % Total % Total % Total %Agrarian Syndicates 238 54.0 119 31.2 237 72.3 46 16.3 640 44.7Productive Groups 25 5.7 39 10.2 34 10.4 75 26.6 173 12.1Education/Health
Groups 29 6.6 59 15.5 8 2.4 7 2.5 103 7.2Social Service Groups 9 2.0 36 9.4 22 6.7 65 23.0 132 9.2Religious Groups 17 3.9 15 3.9 2 0.6 21 7.4 55 3.8Government Groups 8 1.8 12 3.1 0 0.0 4 1.4 24 1.7Supra-community
Groups 40 9.1 41 10.8 19 5.8 8 2.8 108 7.5NGO Groups 75 17.0 60 15.7 6 1.8 56 19.9 197 13.8|Total 441 100.0 381 100.0 328 100.0 282 100.0 1432 100.0
Table 10: Percentage of Households Participating in Local Associations,by Region
Tiahuanacu Villa Serrano Mizque Charagua AllAgrarian Syndicates 92.8 47.6 91.2 18.0 62.4Productive Groups 10.0 13.2 12.4 28.0 15.9Education/Health Groups 11.2 21.2 3.2 2.8 9.6Social Service Groups 3.6 14.4 8.4 25.2 12.9Religious Groups 6.8 6.0 0.8 8.4 5.5Government Groups 3.2 3.6 0.0 1.2 2.0Supra-community Groups 15.2 14.0 7.6 3.2 10.0NGO GroUps 24.4 18.4 2.0 21.2 16.5
7 In principle, membership in agrarian syndicates is mandatory. Household responses to the membershipquestion capture the household's assessment of whether it is an active participant in the syndicate'saffairs.
18
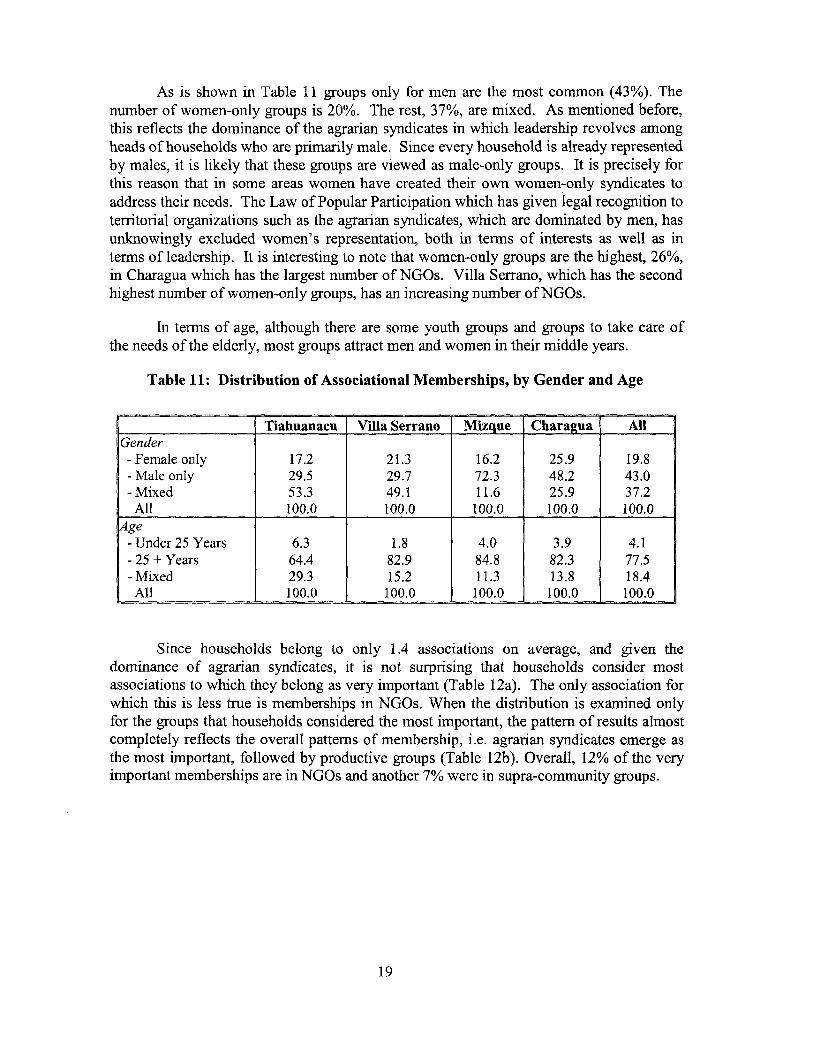
As is shown in Table 11 groups only for men are the most common (43%). Thenumber of women-only groups is 20%. The rest, 37%, are mixed. As mentioned before,this reflects the dominance of the agrarian syndicates in which leadership revolves amongheads of households who are primarily male. Since every household is already representedby males, it is likely that these groups are viewed as male-only groups. It is precisely forthis reason that in some areas women have created their own women-only syndicates toaddress their needs. The Law of Popular Participation which has given legal recognition toterritorial organizations such as the agrarian syndicates, which are dominated by men, hasunknowingly excluded women's representation, both in terms of interests as well as interms of leadership. It is interesting to note that women-only groups are the highest, 26%,in Charagua which has the largest number of NGOs. Villa Serrano, which has the secondhighest number of women-only groups, has an increasing number of NGOs.
In terms of age, although there are some youth groups and groups to take care ofthe needs of the elderly, most groups attract men and women in their middle years.
Table 11: Distribution of Associational Memberships, by Gender and Age
Tiahuanacu Villa Serrano Mizque Charagua AllGender- Female only 17.2 21.3 16.2 25.9 19.8- Male only 29.5 29.7 72.3 48.2 43.0- Mixed 53.3 49.1 11.6 25.9 37.2All 100.0 100.0 100.0 100.0 100.0
Age- Under 25 Years 6.3 1.8 4.0 3.9 4.1- 25 + Years 64.4 82.9 84.8 82.3 77.5- Mixed 29.3 15.2 11.3 13.8 18.4All 100.0 100.0 100.0 100.0 100.0
Since households belong to only 1.4 associations on average, and given thedominance of agrarian syndicates, it is not surprising that households consider mostassociations to which they belong as very important (Table 12a). The only association forwhich this is less true is memberships in NGOs. When the distribution is examined onlyfor the groups that households considered the most important, the pattern of results almostcompletely reflects the overall pattems of membership, i.e. agrarian syndicates emerge asthe most important, followed by productive groups (Table 12b). Overall, 12% of the veryimportant memberships are in NGOs and another 7% were in supra-community groups.
19
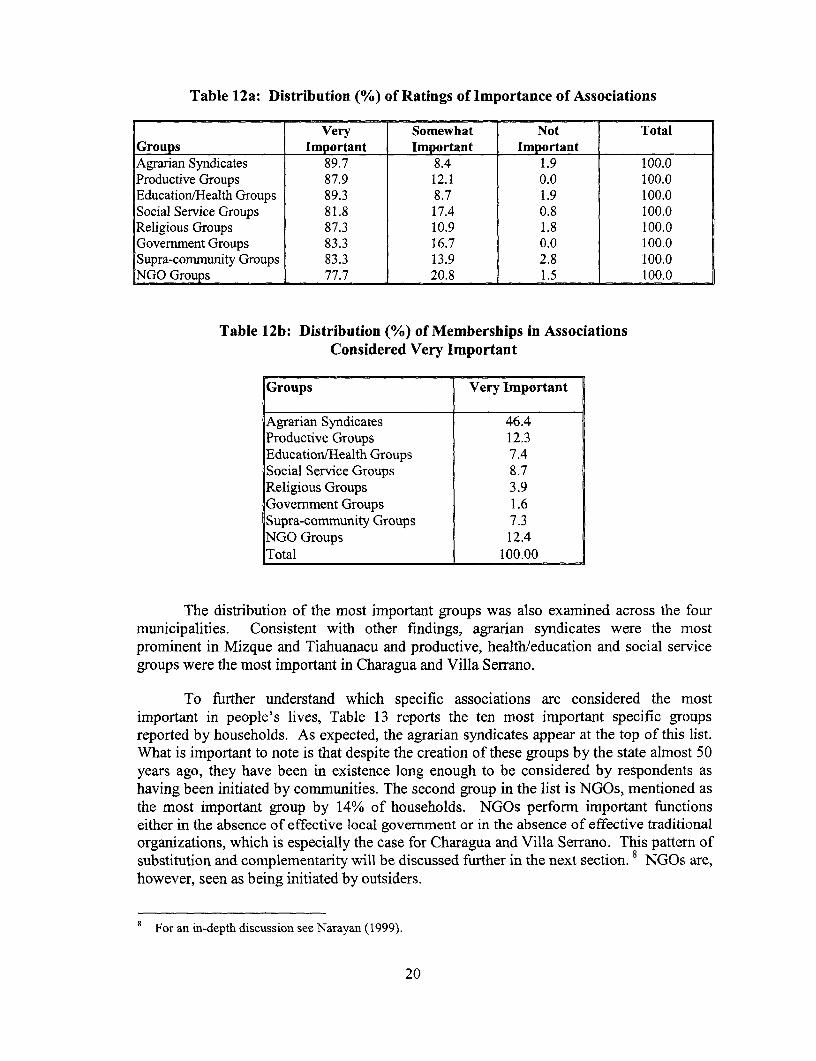
Table 12a: Distribution (%) of Ratings of Importance of Associations
Very Somewhat Not TotalGroups Important Important Important l
Agrarian Syndicates 89.7 8.4 1.9 100.0Productive Groups 87.9 12.1 0.0 100.0Education/Health Groups 89.3 8.7 1.9 100.0Social Service Groups 81.8 17.4 0.8 100.0Religious Groups 87.3 10.9 1.8 100.0Government Groups 83.3 16.7 0.0 100.0Supra-community Groups 83.3 13.9 2.8 100.0INGO Groups 77.7 20.8 1.5 100.0
Table 12b: Distribution (%) of Memberships in AssociationsConsidered Very Important
Groups Very Important
Agrarian Syndicates 46.4Productive Groups 12.3Education/Health Groups 7.4Social Service Groups 8.7Religious Groups 3.9Government Groups 1.6Supra-conimunity Groups 7.3NGO Groups 12.4Total 100.00
The distribution of the most important groups was also examined across the fourmunicipalities. Consistent with other findings, agrarian syndicates were the mostprominent in Mizque and Tiahuanacu and productive, health/education and social servicegroups were the most important in Charagua and Villa Serrano.
To further understand which specific associations are considered the mostimportant in people's lives, Table 13 reports the ten most important specific groupsreported by households. As expected, the agrarian syndicates appear at the top of this list.What is important to note is that despite the creation of these groups by the state almost 50years ago, they have been in existence long enough to be considered by respondents ashaving been initiated by communities. The second group in the list is NGOs, mentioned asthe most important group by 14% of households. NGOs perform important functionseither in the absence of effective local government or in the absence of effective traditionalorganizations, which is especially the case for Charagua and Villa Serrano. This pattern ofsubstitution and complementarity will be discussed further in the next section. s NGOs are,however, seen as being initiated by outsiders.
8 For an in-depth discussion see Narayan (1999).
20

The community is the source of most associations in all categories, except forreligious groups and NGO groups, which are seen as having been initiated outside thecommunity (Table 14). Government sponsored groups are of course categorized primarilyas initiated by the state. In addition to official state bodies, this category includesassociations created by the Social Investment Fund and Rural Development Fund. It isalso striking that all categories of local associations in Bolivia rely strongly on a formalorganizational structure (Table 14). Only education/health groups and social servicegroups are infornally organized to some degree.
Table 13: The Ten Most Important Local Associations
Group Name Category Initiated by Formal/ Times CitedGovernment, Informal (% of Total
Community or Group Citations)Outside
Community1. Agrarian Syndicate Sindicatos C F 584 (41.3%)
Campesinos2. Non-denominational NGOs NGO Groups 0 F 194 (13.7%)3. Mothers Club Social C/O F/I 65 (4.6%)
Service4. Agricultural Producer's Association Productive C/O F 60 (4.2%)(Work Groups) Groups5. Denominational NGOs NGO Groups 0 F 48 (3.4%)6. Women's Center Social C/O F/I 46 (3.3%)l_____________________________________ Service7. Captaincy Sindicatos C F 43 (3.0%)
Carnpesinos8. Central/Sub-central Sindicatos C F 39 (2.8%)Association/Federation of Rural People Campesinos9. Heads of Family Association Education/ C F 39 (2.8%)I_____________________________________ Health10. Informal Education Group Education/ 0 F/I 23 (1.6%)
Health . ._._._.._.
Table 14: Type of Initiation and Organization of Groups
Initiation OrganizationState Community Outside Formal Informal
l ___________ ____________ __________ Com m unityAgrarian Syndicates 10.9 84.5 4.5 96.4 3.6Productive Groups 6.9 65.9 27.2 92.5 7.5Education/Health Groups 6.8 63.1 30.1 82.5 17.5Social Service Groups 6.1 60.6 33.3 75.0 25.0Religious Groups 3.6 32.7 63.6 94.6 5.5Government Groups 70.8 16.7 12.5 91.7 8.3Supra-community Groups 7.4 83.3 9.3 90.7 9.3NGO Groups 3.6 8.1 88.3 87.8 12.2
21
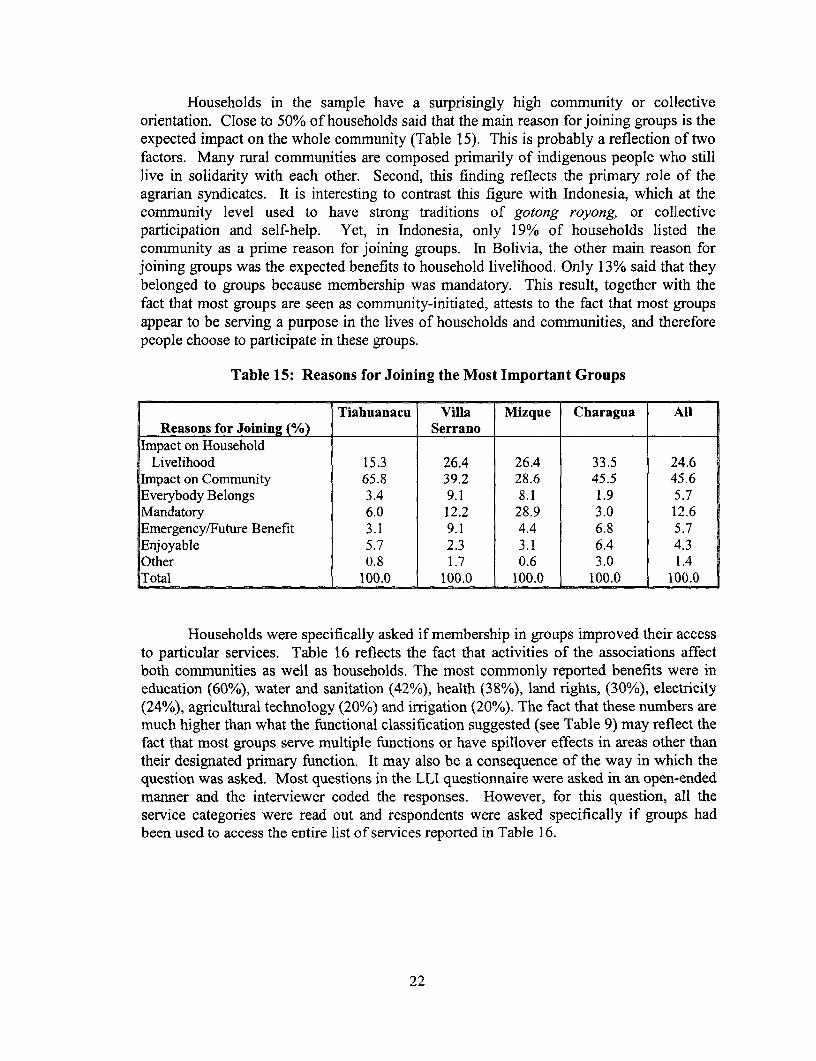
Households in the sample have a surprisingly high community or collectiveorientation. Close to 50% of households said that the main reason for joining groups is theexpected impact on the whole community (Table 15). This is probably a reflection of twofactors. Many rural communities are composed primarily of indigenous people who stilllive in solidarity with each other. Second, this finding reflects the primary role of theagrarian syndicates. It is interesting to contrast this figure with Indonesia, which at thecommunity level used to have strong traditions of gotong royong, or collectiveparticipation and self-help. Yet, in Indonesia, only 19% of households listed thecommunity as a prime reason for joining groups. In Bolivia, the other main reason forjoining groups was the expected benefits to household livelihood. Only 13% said that theybelonged to groups because membership was mandatory. This result, together with thefact that most groups are seen as community-initiated, attests to the fact that most groupsappear to be serving a purpose in the lives of households and communities, and thereforepeople choose to participate in these groups.
Table 15: Reasons for Joining the Most Important Groups
Tiahuanacu Villa Mizque Charagua AllReasons for Joining (%) Serrano
Impact on HouseholdLivelihood 15.3 26.4 26.4 33.5 24.6
Impact on Community 65.8 39.2 28.6 45.5 45.6Everybody Belongs 3.4 9.1 8.1 1.9 5.7Mandatory 6.0 12.2 28.9 3.0 12.6Emergency/Future Benefit 3.1 9.1 4.4 6.8 5.7Enjoyable 5.7 2.3 3.1 6.4 4.3Other 0.8 1.7 0.6 3.0 1.4Total 100.0 100.0 100.0 100.0 100.0
Households were specifically asked if membership in groups improved their accessto particular services. Table 16 reflects the fact that activities of the associations affectboth communities as well as households. The most commonly reported benefits were ineducation (60%), water and sanitation (42%), health (38%), land rights, (30%), electricity(24%), agricultural technology (20%) and irrigation (20%). The fact that these numbers aremuch higher than what the functional classification suggested (see Table 9) may reflect thefact that most groups serve multiple functions or have spillover effects in areas other thantheir designated primary function. It may also be a consequence of the way in which thequestion was asked. Most questions in the LLI questionnaire were asked in an open-endedmanner and the interviewer coded the responses. However, for this question, all theservice categories were read out and respondents were asked specifically if groups hadbeen used to access the entire list of services reported in Table 16.
22

Table 16: Involvement in Service Provision of the Most Important Groups
Percent of Groups Active in Tiahuanacu Villa Mizque Charagua AllSerrano
Education 63.2 75.3 46.3 50.8 59.8Health 33.7 44.0 36.0 39.5 38.2Water Supply and Sanitation 28.0 48.3 53.4 39.8 41.9Electricity 43.3 7.1 22.8 15.8 24.3Credit 3.9 3.4 9.6 24.4 9.3Savings 4.9 1.7 7.5 5.6 4.8Agricultural Inputs/Technology 13.5 22.2 22.7 26.3 20.6Irrigation 7.0 13.1 55.9 7.1 20.5Land, Forestry, Water Rights 33.1 13.6 41.9 32.0 30.1
Membership in groups provides a rich environment for social learning (Table 17).In addition, it can provide experiences in leadership. In most societies leadershippossibilities are limited to the local elite. In Bolivia, by contrast, 50.9% of households inthe poorest quintile report being able to take up leadership positions in groups. This figurediffers little from the median and upper income groups (57% and 51% respectively). Thereare, however, strong differences between municipalities and these parallel to some extentthe differences in income inequality. In Tiahuanacu, 80% of households in the poorestvillages and 76% of households in the richest villages have been in leadership positions.In Villa Serrano, by contrast, households in the richest villages are more frequently inleadership positions (49%) than households in the poorest villages (40%). One shouldkeep in mnind the widespread poverty in rural Bolivia and the strong communal orientationin many indigenous communities. It is interesting to compare these figures with Indonesia,where only 18% of the poorest households have been in leadership positions, as comparedto 29% of the richest households.
23

Table 17: Leadership Positions in Local Associations, by Income Level
% of Households withLeadership Positions in the
Most Important AssociationsHousehold Quintiles 5
Poorest 509 MA2 55.33 56.84 53.3Richest 50.8
Village QuintilesPoorest 46.02 66.13 52.04 60.6Richest 40.7
MunicipalityTiahuanacu:
Poorest villages 80.7Richest villages 76.0
Villa Serrano:Poorest villages 39.8Richest villages 48.5
Mizque:Poorest villages 44.3Richest villages 45.3
Charagua:Poorest villages 41.8Richest villages 41.4
24

5. COMPLEMENTARITY AND SUBSTITUTION BETWEEN ORGANIZATIONS
In order to understand the impact of associations, it is important to dig a little deeper intothe dynamic interaction between institutions and to understand the evolution of theseassociations. For this purpose, we consider four types of organizations: agrariansyndicates, other local organizations, municipal government and linkage organizations,including some NGOs.
In Tiahuanacu, Mizque and Villa Serrano rural communities are represented byagrarian syndicates (sindicatos campesinos). These organizations date back to 1952 whenthey were created by the state as a mechanism for political control. As mentioned in theprevious section, they have since evolved into an organization of local self-governmentwhich legitimizes the status of farmers as participants in the political and planning process.The Law of Popular Participation of 1994 gave the syndicates formal status as channels ofcommunication with the municipal government. The eastern plains of Bolivia, however,have remained largely untouched by this process of agrarian reform and establishment ofsyndicates. Specifically in Charagua, rural comnmunities are organized around theRegional Assembly of the Guarani people, which performs functions similar to those of theagrarian syndicates. However, the traditional captaincy position was in a semi-feudalrelationship to hacienda owners which served to reinforce the subservient position offarmers, who were a source of cheap and reliable labor to the Hacienda owners.
Participation in agrarian syndicates is based on a rotation system which is foundthroughout the Andean region (Pearse, 1984; Booth et al, 1996). Heads of households whoown land-parcels in the community must assume directive posts in the syndicate at leastonce (at the risk of receiving fines and penalties if they do not take their turn). The systemrequires an annual rotation in directors so that there is a broad participation of householdsin the management of the syndicate. This system makes a significant claim on availablehuman resources, especially in Mizque and Tiahuanacu where the agrarian syndicates arewell established. In Villa Serrano the rotation system is not applied and in Charagua thetraditional Guarani pattern of hereditary captaincies is followed, hence leadership skills arenot widely shared.
In addition to the agrarian syndicates, functional organizations (primarily of womenand of producers) are active in each of the four municipalities. Their membership isvoluntary and they are primarily oriented to imparting benefits on the family rather than onthe community. The institutional history and strength of different types of organizations isdifferent in the four selected municipalities. Tiahuanacu and Mizque have a strongorganizational tradition which has preserved many of the indigenous patterns oforganization. In contrast, Villa Serrano and Charagua have a weaker organizationaltradition which was usurped in the service of the dominant group of landowners and timberand ranching interests. Both in Villa Serrano and in Charagua, because of the relativeabsence of agrarian syndicates and because of exclusionary practices, the poor belong toother organizations which have emerged, mainly thanks to the activities of NGOs.
25

Mizque and Charagua are characterized by effective municipal government. InMizque, municipal government is headed by an established campesino elite that has trainedworkers and incorporated technical procedures. In Charagua, municipal government ismade up of ranchers and timber barons, but it is open to dialogue with the Guaraniindigenous population. In Villa Serrano and Tiahuanacu, municipal government isrelatively weak. In Tiahuanacu the elite has direct access to La Paz and bypasses the localstructures (Sandoval et al, 1998).
Why is it that in Charagua municipal government is responsive and effectivedespite being dominated by particular economic interests that had previously suppressedlocal populations? To understand this we need to examine the role of linkageorganizations including NGOs and the role of the Law of Popular Participation. Regionalgrassroots organizations and NGOs serve to link organizations together so as to increasenegotiating power vis-a-vis the state and markets or to increase access to new informationand resources. Regional grassroots leadership plays an important role in the interactionbetween the communities and the municipal government. It consists primarily cf thedirectors of the supra-comrnmunal syndicate organization ("campesino central") wvhichcoordinates the activities of the communal syndicates. In Charagua, regional leadershipconsists of the directors of the Zonal Assemblies of the Guarani People which coordinatesthe actions of the Local Assemblies. This regional leadership constitutes an "inter-community political arm" which is recognized both by the communities and the municipalgovernment. They held the third leading position in the CUSTB in 1993 and won a seat inparliament in an alliance with Cardenas's MRTKL (Alb6, 1995). This new leadership andaccompanying political clout has broken the hold hacienda owners had on the traditionalcaptaincy of the Guarani people. It is this new regional Guarani Assembly, which is ablend of old and new in terrns of organizational design, that has led to a new era ofnegotiation with the local elite. The relations between the dominant elite and the Guaraniare now cordial rather than conflictual.
Among the other three municipalities, this regional leadership is the most effectiveand dynamic in Mizque. In Tiahuanacu, regional leadership is still emerging while in VillaSerrano the weakness of regional leadership reflects the low overall presence of agrariansyndicates in that municipality (Sandoval et al, 1998).
Furthernore, in each of the four municipalities there are NGOs actively working inthe areas of health, education and agricultural and livestock production. They playimportant direct roles in service provision and in reorienting regional leaders away fromnational political issues to regional development issues.
The Law of Popular Participation is beginning to have an impact by breaking upthe hold of the former political elite on municipal decision making. Before the Law ofPopular Participation, Civic Committees, consisting of the local elite, pressured bothprefectures and the central government into channeling resources in favor of the dominantgroups in each region. In Mizque, Charagua and Villa Serrano, the civic committee hasalmost ceased to function. In Tiahuanacu, there is still a Residents Committee that consistsof townspeople who have emigrated to La Paz but who come each year to party and "showoff' their social and economic progress.
26

In summary, it is possible to classify the four municipalities along two axes - thestrength of traditional institutions and the strength of regional grassroots leadership andmunicipal government - as in Figure 1.
Figure 1. The Four Municipalities, by Strength of Institutions
Strong institutional tradition
Tiahuanacu Mizque
Weak regional leadership Strong regional leadership
Ineffective municipal government Effective municipal government
Villa Serrano Charagua
Weak institutional tradition
27

6. THE MEASUREMENT OF SOCIAL CAPITAL
Social capital is the norms, networks and social relations embedded in formal and informalinstitutions of society that enable people to coordinate action and achieve desired goals.All societies are rich in social capital. Most people belong to primary social groups -- thefamily, kin groups, ethnic groups - as well as informal and formal associations. Bonding,solidarity or social cohesion provides the basis for reciprocity and exchanges within thesegroups. However when the power and resources of these social groups is limited, bridgingor linking social capital with other groups becomes important to access different resources,information and power (Putnam, 1995; Portes and Landolt, 1996; Evans, 1996; Woolcock,1997; Narayan, 1997). In the Bolivian context, solidarity within indigenous groupsprovides the foundation for identity and survival. Linkages between indigenous groupsconsolidate their resources and power and change their ability to be heard and to negotiatewith the formal governance structures. The social relations and preferences withingovernment structures are also important and influence their openness to inclusion ofindigenous groups as well as their responsiveness to local needs and demands.
In this study, we construct a quantitative social capital measure which focuses onsocial capital in groups and associations and supra-community associations. Our indexdoes not distinguish the latter explicitly because the number of supra-community orlinkage organizations is numerically small in the data set. However their importancecomes through in the in-depth qualitative data.
The effectiveness with which social capital in the form of local associations canfulfill its role in disseminating information, reducing opportunistic behavior, andfacilitating collective decision making depends on many aspects of the associationreflecting its structure, its membership, and its functioning. For this study, we focus on sixaspects of local associations.
(1) Density of Membership
This is measured by the number of memberships of each household in existingassociations. The provision of a map of local associations was one of the prime objectivesof the LLI study and a complete inventory of all existing associations was made at thevillage level. Each household was then given that inventory and asked which associationsthey were a member of. The survey recorded 67 different organizations in the 40communities in the study, for a total of 1,432 active memberships. This indicates that onaverage each household is a member of one or two associations. The most important ofthese is the agrarian syndicate, which as the previous section indicated, takes account of45% of all memberships. It is therefore essential in the case of Bolivia that density ofassociations be measured separately for agrarian syndicates and other local institutions.
Table 18 indicates that in Tiahuanacu and Mizque, close to 90% of households areactive members of the agrarian syndicate. In Villa Serrano this is only 57% and inCharagua it is only 18%. (As we indicated previously, agrarian syndicates are not active in
28
Charagua and their functions are implemented by the Regional Assembly of the Guaranipeople. Given the similarities of functions, membership in this organization is tabulatedunder the heading of agrarian syndicate.) It is striking that active membership in agrariansyndicates declines steadily with a rising level of education. At an aggregate level, thecorrelation with income level is quite low, but this masks regional differences. Indeed, inthe two municipalities with high active membership, membership is below average only inthe richest quintile (Mizque) or the richest two quintiles (Tiahuanacu) (Table 19). In thetwo other municipalities, membership is below average in the poorest quintile, peaks in thesecond poorest quintile, and then declines steadily with rising income level. This suggeststhat in Charagua and Villa Serrano, the poorest households are to a significant degreeexcluded from active membership in the agrarian syndicates.
However, Villa Serrano and Charagua have the highest membership in other localorganizations and this membership is strongest among the poorer households. This reflectsthe complementarity between different types of organizations. In Tiahuanacu and Mizque,the agrarian syndicates are very effective and are active in the provision of a wide range ofservices. It stands to reason that where this is not the case people create voluntaryorganizations to fill the void.
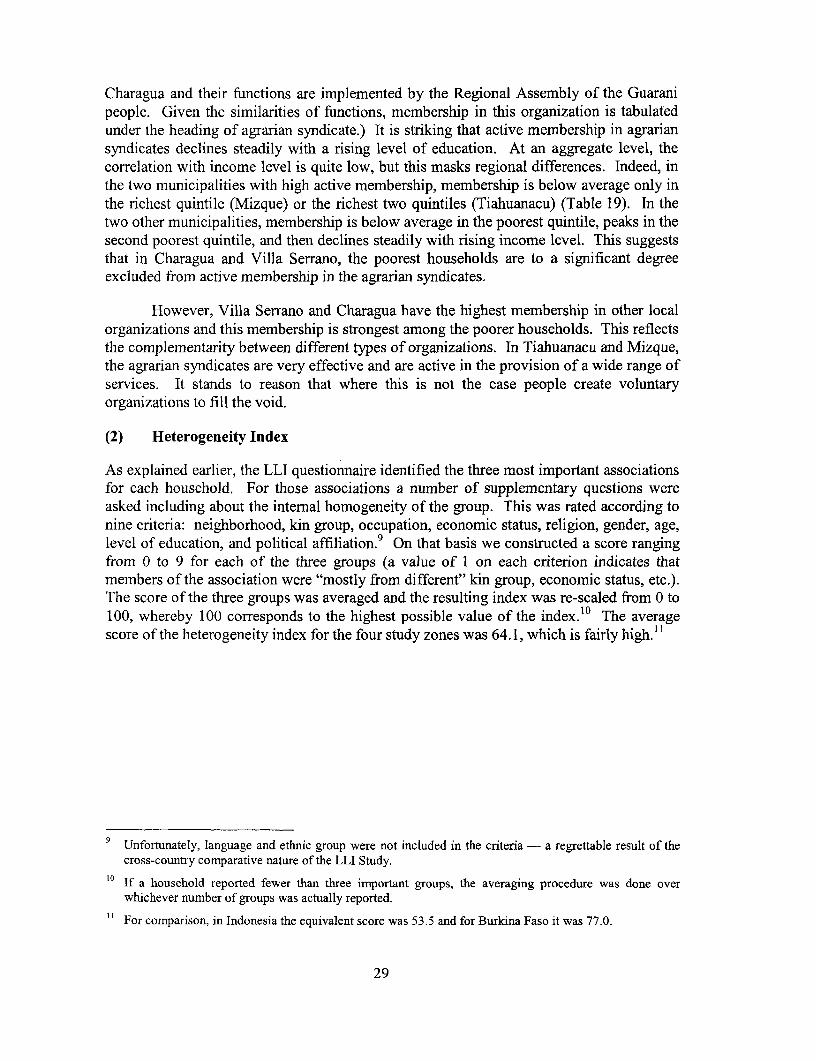
(2) Heterogeneity Index
As explained earlier, the LLI questionnaire identified the three most important associationsfor each household. For those associations a number of supplementary questions wereasked including about the internal homogeneity of the group. This was rated according tonine criteria: neighborhood, kin group, occupation, economic status, religion, gender, age,level of education, and political affiliation.9 On that basis we constructed a score rangingfrom 0 to 9 for each of the three groups (a value of 1 on each criterion indicates thatmembers of the association were "mostly from different" kin group, economic status, etc.).The score of the three groups was averaged and the resulting index was re-scaled from 0 to100, whereby 100 corresponds to the highest possible value of the index.1° The averagescore of the heterogeneity index for the four study zones was 64. 1, which is fairly high."1
9 Unfortunately, language and ethnic group were not included in the criteria - a regrettable result of thecross-country comparative nature of the LLI Study.
t° If a household reported fewer than three important groups, the averaging procedure was done overwhichever number of groups was actually reported.
" For comparison, in Indonesia the equivalent score was 53.5 and for Burkina Faso it was 77.0.
29

Table 18: Social Capital Dimensions, by Region and Household Characteristics
Memberships Memberships Index of Meeting Index of Index of Communityin Sindicatos in Other Local Heterogeneity Attendance Participation Contributions OrientationCampesinos Associations In Decision
(%) (number) MakingMunicipality
Charagua 17.6 1.0 56.8 6.6 85.7 5.8 56.4Mizque 90.4 0.3 52.3 5.4 88.3 4.8 76.7Tiahuanacu 88.0 0.8 73.8 3.7 86.7 4.7 73.3Villa Serrano 57.2 0.9 72.7 5.4 77.7 1.7 64.5
Head of HouseholdMale 63.3 0.8 64.0 5.3 85.2 4.4 67.6Female 63.1 0.6 64.1 4.7 82.8 3.3 74.7
ReligionCatholic 64.0 0.7 63.2 5.0 84.2 4.2 70.3Evangelical Protestant 58.8 0.9 68.7 6.2 89.2 5.2 57.1
Education of HeadNone 71.7 0.5 66.9 4.4 84.2 2.9 73.5Primary-Incomplete 62.5 0.8 63.6 5.7 85.5 4.3 68.6Primary-Completed 62.8 0.9 61.3 5.1 84.3 5.3 67.0Secondary- Incomplete 60.0 0.9 59.7 5.5 83.9 5.1 66.8Secondary-Completed 53.1 0.9 70.3 4.7 86.7 3.8 61.1Vocational 40.0 1.5 74.5 3.8 86.0 6.2 52.2University/Other 22.2 1.6 72.0 2.9 81.3 3.2 58.3
QuintilePoorest 58.0 0.8 67.8 4.4 85.3 3.5 63.12 62.5 0.9 62.7 5.5 86.0 3.0 61.03 67.5 0.7 64.8 5.3 87.7 4.2 74.64 66.5 0.7 62.4 5.5 85.5 5.1 71.2Richest 62.0 0.7 62.7 5.2 80.1 5.5 72.8
All 63.3 0.8 64.1 5.2 84.9 4.3 68.5Variable definitions are (for details, see text):* Memberships in sindicatos campesinos: percent of households who are members of sindicatos campesinos.* Memberships in other local associations: average number of memberships per household.* Index of heterogeneity: scale (0- 100) of internal heterogeneity of three most important groups, according to nine criteria.* Meeting attendance: average number of times a household member attended a group meeting in the last three months.* Index ofparticipation in decision making: scale (0-100) of extent of active participation in decision making in three most important groups.* Indexofcontribution: score (0-100) of average and in-kind fees paid fornmemberships in three most important groups.* Community orientation: percent of memberships in organizations which are community-initiated.Note: Except for column 1, averages exclude households with no active memberships. Figures for agrarian syndicates differ slightly from those in Table 10 because the supra-community structure of the syndicates was included in "membership in sindicatos campesinos" for the regression analysis while it was in the separate category "supra-communitygroup" in Table 10.
A ~~~~~~~~~~~~~~~~~~~~~~~~~~~~~~~~~, .
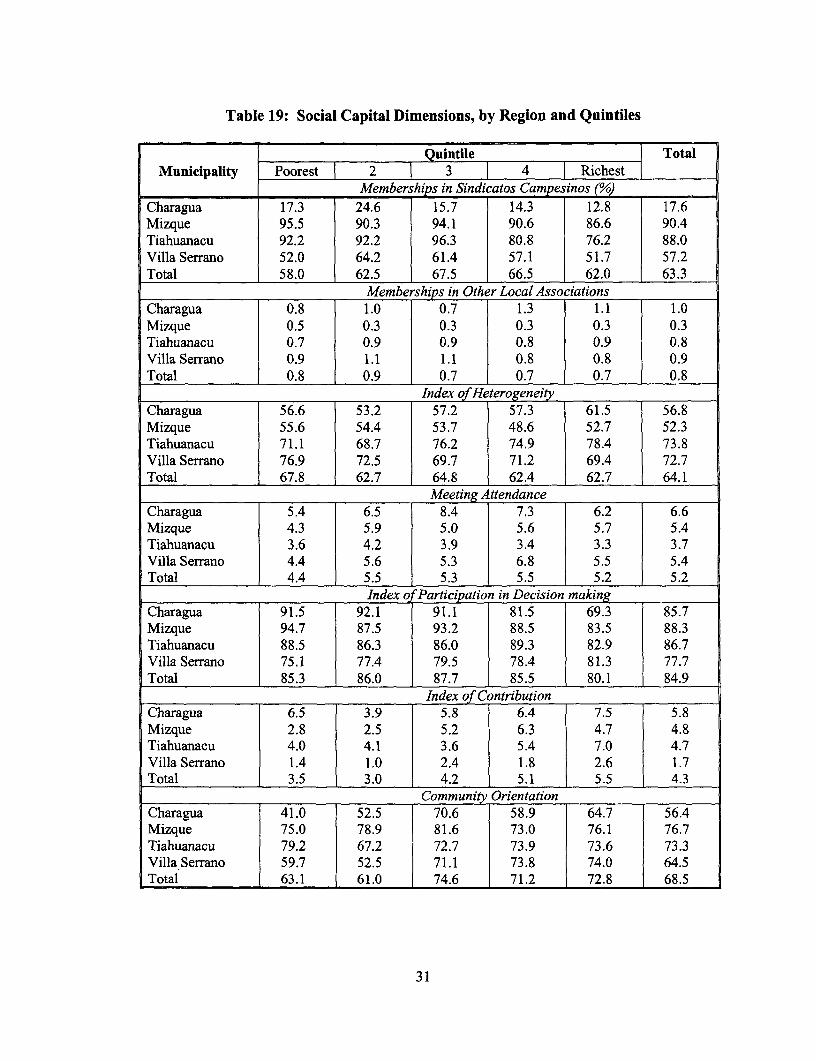
Table 19: Social Capital Dimensions, by Region and Quintiles
Quintile TotalMunicipality Poorest 2 3 4 I Richest
Member hips in Sindi atos Campesinos : _ _
Charagua 17.3 24.6 15.7 14.3 12.8 17.6Mizque 95.5 90.3 94.1 90.6 86.6 90.4Tiahuanacu 92.2 92.2 96.3 80.8 76.2 88.0Villa Serrano 52.0 64.2 61.4 57.1 51.7 57.2Total 58.0 62.5 67.5 66.5 62.0 63.3
Memberships in Other Local AssociationsCharagua 0.8 1.0 0.7 1.3 1.1 1.0Mizque 0.5 0.3 0.3 0.3 0.3 0.3Tiahuanacu 0.7 0.9 0.9 0.8 0.9 0.8Villa Serrano 0.9 1.1 1.1 0.8 0.8 0.9Total 0.8 0.9 0.7 1 0.7 0.7 0.8
Index o HeterogeneityCharagua 56.6 53.2 57.2 57.3 61.5 56.8Mizque 55.6 54.4 53.7 48.6 52.7 52.3Tiahuanacu 71.1 68.7 76.2 74.9 78.4 73.8Villa Serrano 76.9 72.5 69.7 71.2 69.4 72.7Total 67.8 62.7 64.8 62.4 62.7 64.1
Meeting AttendanceCharagua 5.4 6.5 8.4 7.3 6.2 6.6Mizque 4.3 5.9 5.0 5.6 5.7 5.4Tiahuanacu 3.6 4.2 3.9 3.4 3.3 3.7Villa Serrano 4.4 5.6 5.3 6.8 5.5 5.4Total 4.4 5.5 5.3 5.5 5.2 5.2
Index of Participation in Decision makingCharagua 91.5 92.1 91.1 81.5 69.3 85.7Mizque 94.7 87.5 93.2 88.5 83.5 88.3Tiahuanacu 88.5 86.3 86.0 89.3 82.9 86.7Villa Serrano 75.1 77.4 79.5 78.4 81.3 77.7Total 85.3 86.0 87.7 85.5 80.1 84.9
Index of Contribution ICharagua 6.5 3.9 5.8 6.4 7.5 5.8Mizque 2.8 2.5 5.2 6.3 4.7 4.8Tiahuanacu 4.0 4.1 3.6 5.4 7.0 4.7Villa Serrano 1.4 1.0 2.4 1.8 2.6 1.7Total . 3.5 3.0 4.2 5.1 5.5 4.3
Community OrientationCharagua 41.0 52.5 70.6 58.9 64.7 T 56.4Mizque 75.0 78.9 81.6 73.0 76.1 76.7Tiahuanacu 79.2 67.2 72.7 73.9 73.6 73.3Villa Serrano 59.7 52.5 71.1 73.8 74.0 64.5Total 63.1 61.0 74.6 71.2 72.8 68.5
31

The index shows a distinct regional and socioeconomic pattern (Table 18).Associations in Tiahuanacu and Villa Serrano are much more heterogeneous than in theother two municipalities. The index follows a U-shaped pattern in relation to education:heterogeneity is highest for people with low or no education and for those with the highestamount of education. The index is not systematically related to income level, althoughhouseholds in the poorest quintile appear to be members of slightly more heterogeneousassociations (Table 19). It is also worth noting that the internal heterogeneity of theagrarian syndicates and that of other associations do not systematically differ from eachother (Table 20).
(3) Meeting Attendance
Meetings are often considered an indicator of participation. We therefore constructed ameeting attendance index which measured the average number of times someone from thehousehold attended group meetings, normnalized for the number of memberships of eachhousehold.
For each membership in an association, the average sample household attends5.2 meetings in a three-month period. This figure is slightly higher in Charagua and lowerin Tiahuanacu. Male heads of households attend meetings more frequently than femaleheads of households. Meeting attendance shows an inverse U-pattern with respect toeducation and level of income: the highest meeting attendance is recorded for people inthe middle quintiles and with average levels of education. Meetings of agrarian syndicatesare generally attended slightly less frequently than those of other organizations, except inTiahuanacu (Table 20).
(4) Active Participation Index
It has been argued that associations which follow a democratic pattern of decision makingare more effective than others. The LLI questionnaire asked association members toevaluate subjectively whether they were "very active", "somewhat active", or "not veryactive" in the group's decision making. This response was scaled from 2 to 0 respectively,and averaged across the three most important groups. The resulting index was re-scaledfrom 0 to 100. The average value for this index is 84.9, indicating a very high degree ofactive participation in decision making.
The index is systematically higher for agrarian syndicates than for otherorganizations. This explains why the index is the highest for Tiahuanacu and Mizque,the two municipalities where agrarian syndicates are most active. Male heads ofhouseholds participate somewhat more actively than female heads of households. Thecorrelation with education and income is weak except that the richest quintile shows alower participation rate than others. However, as Table 19 indicates, there are strongregional differences in this correlation. In Charagua, active participation in the Guaranicouncils is at a very high level (over 90%) for the lowest three quintiles and thendeclines sharply with income thereafter. In Villa Serrano, the reverse pattern isobserved and active participation is the highest in the two richest quintiles. InTiahuanacu and Mizque, the correlation with income is weaker.
32
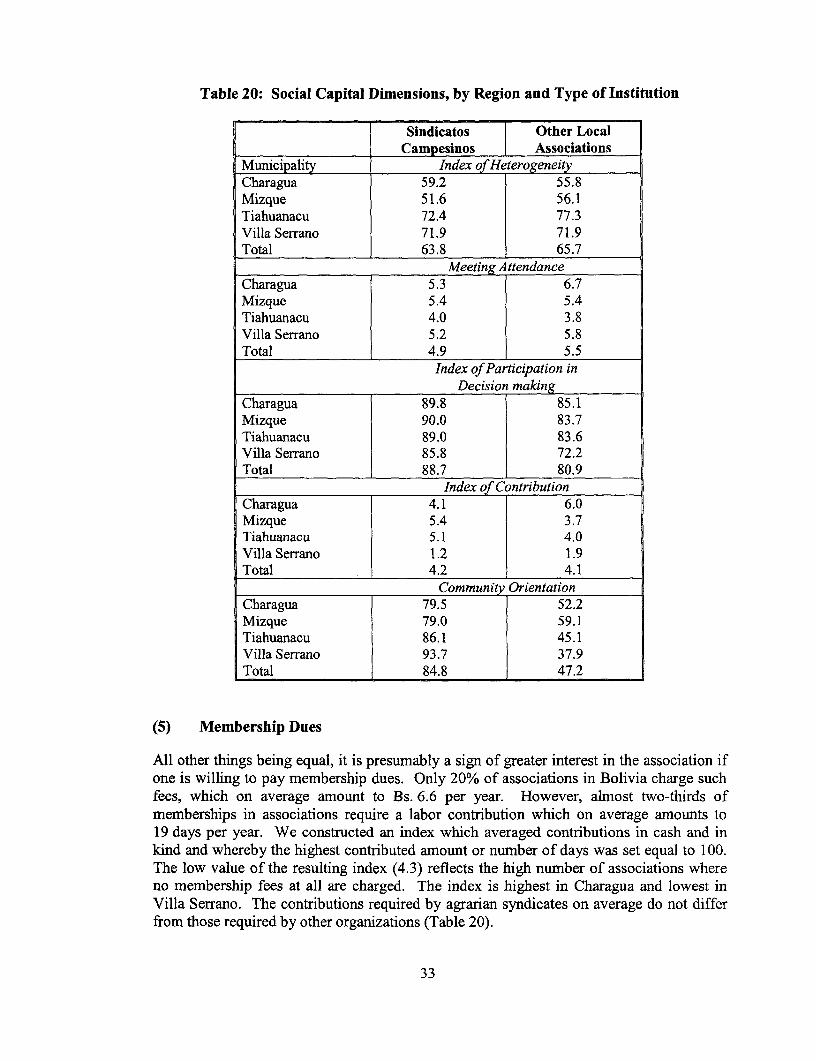
Table 20: Social Capital Dimensions, by Region and Type of Institution
Sindicatos Other LocalCampesinos Associations
Municipality Index of HeterogeneityCharagua 59.2 55.8Mizque 51.6 56.1Tiahuanacu 72.4 77.3Villa Serrano 71.9 71.9Total 63.8 65.7
Meeting AttendanceCharagua 5.3 6.7Mizque 5.4 5.4Tiahuanacu 4.0 3.8Villa Serrano 5.2 5.8Total 4.9 5.5
Index of Participation in.___________ Decision making
Charagua 89.8 85.1Mizque 90.0 83.7Tiahuanacu 89.0 83.6Villa Serrano 85.8 72.2Total 88.7 80.9
Index of ContributionCharagua 4.1 6.0Mizque 5.4 3.7Tiahuanacu 5.1 4.0Villa Serrano 1.2 1.9Total 4.2 4.1
Community OrientationCharagua 79.5 52.2Mizque 79.0 59.1Tiahuanacu 86.1 45.1Villa Serrano 93.7 37.9Total 84.8 47.2
(5) Membership Dues
All other things being equal, it is presumably a sign of greater interest in the association ifone is willing to pay membership dues. Only 20% of associations in Bolivia charge suchfees, which on average amount to Bs. 6.6 per year. However, almost two-thirds ofmemberships in associations require a labor contribution which on average amounts to19 days per year. We constructed an index which averaged contributions in cash and inkind and whereby the highest contributed amount or number of days was set equal to 100.The low value of the resulting index (4.3) reflects the high number of associations whereno membership fees at all are charged. The index is highest in Charagua and lowest inVilla Serrano. The contributions required by agrarian syndicates on average do not differfrom those required by other organizations (Table 20).
33

(6) Community Orientation
Many case studies on the functioning of local associations have argued that voluntaryorganizations that find their roots in the community are more effective than externallyimposed and/or mandated groups (Uphoff, 1992; Narayan, 1995; Ostrom, 1995). Eighty-five percent of respondents regarded the agrarian syndicates as being community initiated.As discussed earlier, this is a remarkable result given that historically the syndicates wereestablished by the government as a vehicle for political control. It underscores the degreeto which the nature of the organization and the local involvement have changed over time.Only 47% of other local organizations are community-initiated (Table 20). In Mizque andCharagua, however, there was a stronger degree of community involvement in setting upnon-syndicate organizations.
34
7. HOUSEHOLD WELFARE AND SOCIAL CAPITAL
In this section we address the question whether households with a higher level of socialcapital are better off. In other words, can we establish empirically a positive correlationbetween an index of social capital or the dimensions of social capital discussed in theprevious section and various outcome indicators which measure household welfare? Jnprinciple it is not difficult to adjust a conventional model of household economic behaviorto reflect the role of social capital. Such a model consists of three sets of equations.
* The first set of equations explains the income generating behavior of thehousehold and describes how the household combines its various assetendowments to make decisions regarding labor supply for each of its members,taking the wage rates and demand situation in the labor market as given. In thisformulation, social capital can be considered as one among several classes ofassets available to the household to make its decisions. Social capital iscombined with human capital, physical capital and the ownership of land tomake productive decisions.
* The second set of equations portrays the household's demand for inputs(agricultural inputs, credit) and services (education, health) which may need tobe combined with labor supply in order to generate income. Here too, socialcapital is one category of capital which determines these decisions.
* A third set of equations explains the households' consumption and savingsbehavior as a function of the level and composition of income.
The customary reduced-form model of these structural equations relates householdexpenditure directly to the exogenous asset endowment of the household and yields thefollowing estimating equation:12
fnEi = a + 8SCi + rHCi + 6°Ci + Xi + qZi + ui (1)
Where Ei = household expenditure per capita of household i
SC, = household endowment of social capital
HCi = household endowment of human capital
oCi = household endowment of other assets
Xi = a vector of household characteristics
Zi = a vector of village/region characteristics
ui = error term
12 This reduced-form model was also the basis for the empirical study by Narayan and Pritchett (1997) onsocial capital in Tanzania.
35
The key feature of this model is the assumption that social capital is truly "capital"and hence has a measurable return to the household. Social capital has many "capital"features: it requires resources (3especially time) to be produced, and it is subject toaccumulation and decumulation.' Social capital can be acquired in formal or informalsettings, just like human capital (e.g., schools versus learning-by-doing). Much socialcapital is built during interactions which occur for social, religious, or cultural reasons.Other interactions occur in settings specifically aimed to yield economic benefits. InBolivia, this is the case with the agrarian syndicates and other production-oriented groups.The key assumption is that the networks built through these interactions have measurablebenefits to the participating individuals, and lead, directly or indirectly, to a higher level ofwell-being. This is the proposition which we test empirically in this paper by means ofequation (1). Structurally, the returns to social capital could be measured in the earningsfunctions if, e.g., one's network helps in getting better-paying jobs or promotions. It couldalso show up in the various functions that detennine access to credit, agricultural inputs orother factors which enhance the productivity of a household enterprise.
The dependent variable of equation (1) is the natural logarithm of householdexpenditure per capita.14 The explanatory variables consist of the asset endowments of thehouseholds, demographic control variables, and locational dummy variables. Householdassets are assumed to consist of human capital, social capital, land, and physical assets.We have already discussed in the previous section the variables used to measure thehousehold's endowment of social capital. Human capital is measured conventionally bythe years of education of the adult members of the household.'5 Three productive assetsrelevant in rural settings were included: the number of hectares of land owned, the numberof large animals and the number of pieces of major farm equipment.
In addition to the asset variables, the regressions include demographic variables,such as household size and gender of the head of household. Age of the head of householdand its squared term were included to capture the life cycle of household welfare. Lastly, aset of dummy variables were included to indicate the municipality (Tiahuanacu was usedas the omitted category) and whether households lived in the municipality's capital city.These variables capture the general economic and social conditions of the municipalitiesalong dimensions other than those which we were able to include in the model.
The social capital dimensions which we discussed in the previous section can beincluded in the model as separate variables or they can be aggregated into an index. Astudy by Narayan and Pritchett (1997) which estimated the effect of social capital on thewelfare of households in Tanzania used a multiplicative index capturing the number of
Events in transition economies such as Russia and former Yugoslavia are powerful evidence of the effectsof the decumulation of social capital (Rose, 1995).
4 This variable was constructed in nominal form and does not capture any regional price variation that mayexist in Bolivia. As of writing we do not have access to a regional price index to deflate householdexpenditure per capita. We assume that the regional dummy variable included in the regression willcapture price differences.
5 The LLI questionnaire recorded only the level of educational achievement of each adult in the householdand the number of years of education was imputed from that information.
36

memberships in associations, their internal heterogeneity, and aspects of internalfunctioning. The use of a multiplicative procedure regards the different dimensions asinteracting with one another, e.g., heterogeneity or internal functioning may have differenteffects depending upon the number of organizations of which the household is a member.However, it is also possible to consider an additive index whereby the assumption is madethat each social capital dimension acts independently (although not necessarily with equalweight). The conceptual literature on social capital is not advanced to the stage thattheoretical arguments can be put forth to select one model or the other. We show thereforein Table 21 the results of different aggregations as well as the model which includes thedimensions separately. In line with the index used by Narayan and Pritchett (1997), weconstructed a multiplicative index of the number of memberships, the index ofheterogeneity and the index of active participation in decision making. We alsoconstructed an additive index as the arithmetic average of all six social capital dimensions.As an alternative, we constructed an additive index of four of the six social capitaldimensions, excluding the heterogeneity index and the index of active participation (forreasons discussed below).
Column 1 of Table 21 indicates that the basic reduced-form model of householdwelfare, excluding any social capital variables, explains 41% of the variance in householdwelfare. Most of the included assets and control variables are significant. The resultsindicate that an additional year of education on average yields a 4.7% higher level ofhousehold welfare. The results indicate fairly low returns to the ownership of land andanimals, but very high returns to the ownership of farm equipment (such equipment isowned by relatively few households). There is a distinct life-cycle pattern to welfare,peaking at age 58. Women-headed households, all other things being the samne, have a10% lower welfare level than male-headed households. The large and significantcoefficients of the locational dummy variables indicate that there remain importantlocation-specific determinants of household welfare which were not captured by the model.
Columns 2 and 3 show the results of adding respectively a multiplicative and anadditive index of social capital to the specification.' Of the two indexes only the additivespecification has a coefficient significantly different from zero. The coefficient of thesocial capital index indicates that an increase of 10 points on the index is associated with a5.7% increase in household welfare.
Column 3 indicates that an increase in the household's stock of human capital ofone year is associated with an increase in household welfare of approximately 4.5%.Among the sample households, the average stock of human capital equals four years sothis corresponds to a 25% increase. A similar increase in the index of social capital(average= 23.6) is associated with an increase of 3.4% of household welfare. This
Significance tests indicated that the additive index with four dimensions performed better than the onewith six dimensions, hence only the results of the former are shown here.
37

suggests that the returns to education are of similar magnitude to the returns of socialcapital. 17
The last column of Table 21 introduces the six social capital dimensions separately.This leads to a slight increase in the model's ability to explain the variance of householdwelfare relative to the index approach. More importantly, it shows the relative importanceof the different dimensions. The results indicate that active membership in an agrariansyndicate is associated with an 11.5% higher level of household welfare. Membership inanother association leads to a 5.3% increase in welfare. Active investments by householdsin associations - measured by attending meetings, making cash or in-kind contributions- as well as a strong community orientation are all associated with higher welfare levels,although the coefficients are fairly small.'s
In the context of the model which we discussed in section 3, the coefficient ofmembership is interpreted as the benefit of membership in local associations. It ispossible, however, that there is reverse causation. High income households might have ahigher demand for associational life because they have more leisure (although theopportunity cost to their time is also higher). One can certainly argue that associationallife has a consumption value and is not sought merely for its economic benefit. Clearlythis is related to the type of association: participating in a church choir or a soccer clubmay have more consumption value than the agrarian syndicate or other professionalassociations. We address later (section 8) formally the question of reverse causation withinstrumental variables.
The results in Table 21 indicate that the heterogeneity index is not a significantsocial capital dimension, which is a different result from that obtained for Indonesia andBurkina Faso (Grootaert, 1999; Grootaert, Oh and Swamy, 1999). As has been noted inthe previous section, the heterogeneity index in Bolivia is in-between that of the two othercountries. However, also as noted before, neither heterogeneity in language nor ethnicity,both critical indicators, could be included in our heterogeneity index. As the qualitativedata shows, ethnicity in the Bolivian context does matter. It appears that otherdemographic and socioeconomic characteristics are not important criteria for membershipin associations and bear no relation to the effectiveness of the association. A noteworthy
17 Strictly speaking the coefficient of human capital cannot be interpreted as the returns to educationbecause we do not employ the standard Mincerian formulation of the human capital model. The term"return" is used here to indicate the partial effect of a one unit increase in the stock of human oT socialcapital on household welfare.
18 The regression model distinguishes membership in agrarian syndicates from other memberships becausethe organizations have different historical origins and because the extent of membership is very different.The variables describing the other social capital dimensions, however, do not make that distinction. AsTable 20 indicated, there are no fundamental differences in social capital characteristics in terms ofheterogeneity, meeting attendance, etc., between syndicates and other organizations. We did howeverestimate the regression model distinguishing between syndicates and other organizations for each of thesix social capital dimensions. The empirical results indicated that among the syndicate characteristics,only membership was significant and that the other attributes of the syndicates did not have a significantimpact on the outcome variables. We therefore distinguish in Table 22 and following tables syndicatesand other associations only in the membership variable.
38

result is the negative and significant coefficient of the index of participation. This resulttoo stands in contrast to that obtained for the other two countries in the LLI study.Looking back at Tables 19 and 20 makes clear why this is the case: active participation inthe decision making of associations is strongest among poorer households, especially inMizque and Charagua. (Incidentally, the negative sign of the participation index and thelack of significance of the heterogeneity index explain why the additive model excludingthese two components performs better than the index which consists of all six componentsand why the multiplicative index fails to be significant.)
Table 21: Household Welfare and Social Capital (OLS regressions)'
(1) (2) (3) (4)Intercept 6.8349 (46.82) 6.8358 (46.13) 6.6722 (44.08) 6.7383 42.58Social Capital Index- Multiplicative index2 -0.0001 (0.04)- Additive index3 0. 005 7 (4 .39) -
Social Capital Dimensions- Membership in agrarian - - - 0.1153 (2.29)
syndicates- Number of other memberships - - _ 0.0529 (2.54)- Heterogeneity index - - - -0.0002 (0.29)- Meeting attendance - - - 0.0107 (3.63)- Index of participation - - - -0.0021 (3.50)- Index of contribution - - - 0.0068 (3.99)- Community orientation - - - 0.0013 (3.01)Household Size -0.1449 (17.18) -0.1449 (17.17) -0.1459 (17.42) -0.1470 (17.42)Years of Education 0.0468 (7.65) 0.0469 (7.59) 0.0453 (7.45) 0.0453 (7.41)Female Head of Household -0.1027 (1.78) -0.1028 (1.79) -0.1084 (1.90) -0.0993 (1.76)Age of Head of Household 0.0288 (4.69) 0.0288 (4.69) 0.0294 (4.78) 0.0287 (4.63)Age of Head of Household Squared -0.0003 (4.06) -0.0003 (4.05) -0.0003 (4.09) -0.0002 (3.97)Non-Farmer Household 0.0820 (1.47) 0.0820 (1.47) 0.0829 (1.51) 0.0828 (1.55)Land Ownership (hectare) 0.0033 (3.59) 0.0033 (3.59) 0.0028 (3.16) 0.0024 (2.85)Animal Ownership (number) 0.0012 (2.68) 0.0012 (2.68) 0.0012 (2.68) 0.0013 (2.91)Farm Equipment Ownership (number) 0.1053 (2.78) 0.1054 (2.79) 0.0932 (2.47) 0.0925 (2.49)Villa Serrano -0.0385 (0.80) -0.0387 (0.80) -0.0061 (0.13) -0.0208 (0.42)Mizque 0.4734 (9.89) 0.4729 (9.39) 0.4763 (9.90) 0.4701 (8.99)Charagua 0.2612 (4.63) 0.2606 (4.40) 0.3123 (5.46) 0.3106 (4.72)Municipality's Capital City 0.3933 (6.35) 0.3931 (6.31) 0.4191 (6.84) 0.4346 (6.95)Number of Observations 999 999 999 999R-squared 0.41 0.41 0.42 0.43F-statistic 49.2 45.7 48.1 38.5Notes: 1. The dependent variable = In (household expenditure per capita); t-statistics are in parentheses and are based on
robust standard errors (Hubert-White estimator for non-identically distributed residuals).2. The multiplicative index is the product of the number of memberships, the heterogeneity index and the participation
index, re-scaled 0 tolOO.3. The additive index is the arithmetic average of the number of memberships, meeting attendance, the contribution
index and the comimunity orientation index.
Regional Differences
Given the regional differences in ethnicity, geography, history and relative prosperity,reinforced by the high coefficients of the locational dummy variables, and to tease out theinstitutional story, we thought it would be worthwhile to estimate regressions separatelyfor each municipality and for rural residents and those of the capital cities of the
39

municipalities. Table 22 shows that the relative role of the different social capitaldimensions is indeed different between rural and urban areas. Overall, the returns to socialcapital in local institutions appear to be higher in cities than in rural areas. While an activemembership in an agrarian syndicate leads to a 9% higher level of household welfare inrural areas, in the cities this corresponds to an increase of 36%. For other associations therespective figures are 4.5% and 17.5%. These differences need to be interpreted withcaution. The urban sample is small (only 100 households) and active membership inagrarian syndicates is low. The few urban residents who are farners and members ofagrarian syndicates are likely to be very different from the typical rural campesino.
Table 22: Household Welfare and Social Capital, by Location
Rural Areas Municipality CapitalCities
Social Capital Index (additive) 0.0055 (3.98) 0.0077 (1.94)Social Capital Dimensions- Membership in agrarian syndicates 0.0906 (1.67) 0.3611 (2.09)- Number of other memberships 0.0454 (2.08) 0.1753 (2.04)- Heterogeneity index -0.0003 (0.34) 0.0023 (0.88)-Meeting attendance 0.0110 (3.65) -0.0162 (0.93)- Index of participation -0.0016 (2.46) -0.0060 (3.15)-Index of contribution 0.0065 (3.67) -0.0031 (0.37)- Community orientation 0.0012 (2.56) 0.0020 (1.65)
We also re-estimated the regression model for each municipality separately as wellas for combinations of municipalities along the institutional dimensions identified inFigure 1. Looking at the results for each municipality, the additive social capital index isonly significant in Villa Serrano and Charagua (Table 23). These two provinces arecharacterized by a weak institutional tradition. In Villa Serrano the agrarian syndicates arenot well established because the haciendas survived the 1952 revolution. In Charagua, theAssembly of the Guarani People has only been formally established since 1987. However,as discussed earlier, this weak institutional tradition also explains why the incidence andmembership of other local institutions is higher in Villa Serrano and in Charagua.Furthermnore, since the agrarian syndicates are so weak, they lay little claim on the humanresources available in the region which are therefore available to strengthen the functioningof other local organizations (Sandoval et al, 1998).
The results of the individual municipality regressions confirm the importance ofnon-syndicate organizations in Villa Serrano and Charagua since these are the only twoprovinces where there is a positive and significant relationship between membership inother local associations and household welfare level. However, the results also indicatethat in none of the four municipalities, active membership in agrarian syndicates issignificantly related to household welfare. The fact that we found such a significantrelation at the national level means therefore that this is largely due to inter-municipalityeffects. In particular, Mizque is the province with the highest income as well as thehighest active membership in agrarian syndicates.
40
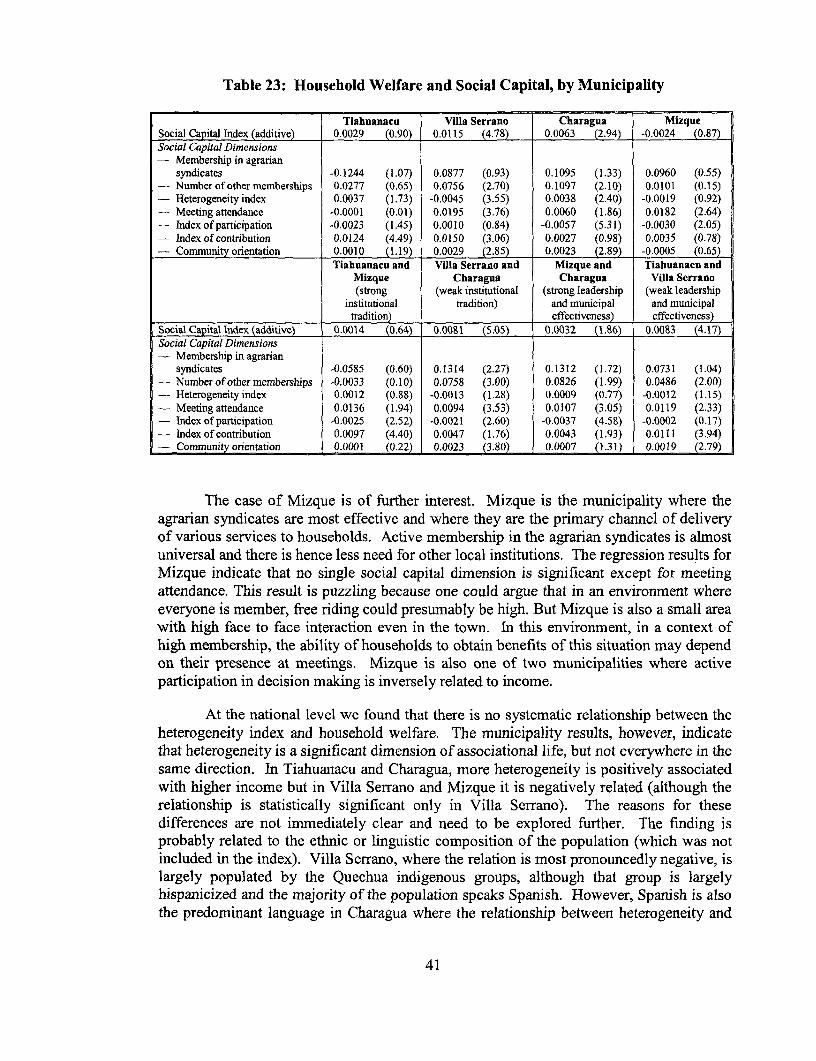
Table 23: Household Welfare and Social Capital, by Municipality
Tiahuanacu Villa Serrano Charagua MizqueSocial Capital hidex (additive) 0.0029 (0.90) 0.0115 (4.78) 0.0063 (2.94) -0.0024 (0.87)Social Capital Dimensions- Membership in agrarian
syndicates -0.1244 (1.07) 0.0877 (0.93) 0.1095 (1.33) 0.0960 (0.55)- Number of other memberships 0.0277 (0.65) 0.0756 (2.70) 0.1097 (2.10) 0.0101 (0.15)- Heterogeneity index 0.0037 (1.73) -0.0045 (3.55) 0.0038 (2.40) -0.0019 (0.92)- Meeting attendance -0.0001 (0.01) 0.0195 (3.76) 0.0060 (1.86) 0.0182 (2.64)- Index of participation -0.0023 (1.45) 0.0010 (0.84) -0.0057 (5.31) -0.0030 (2.05)- Index of contribution 0.0124 (4.49) 0.0150 (3.06) 0.0027 (0.98) 0.0035 (0.78)- Community orientation 0.0010 (1.19) 0.0029 (2.85) 0.0023 (2.89) -0.0005 (0.65)
Tiahuanacu and Villa Serrano and Mizque and Tiabuanacu andMizque Charagas Charagua Villa Serrano(strong (weak institutional (strong leadership (weak leadership
institutional tradition) and municipal and municipalr_ adition) effectiveness) effectiveness)
Social Capital Index (additive) 0.0014 (0.64) 0.001 (5.05) 0.0032 (1.86) 0.0083 (4.17)Social Capital Dimensions- Membership in agrarian
syndicates -0.0585 (0.60) 0.1314 (2.27) 0.1312 (1.72) 0.0731 (1.04)-Numberofothermemberships -0.0033 (0.10) 0.0758 (3.00) 0.0826 (1.99) 0.0486 (2.00)- Heterogeneity index 0.0012 (0.88) -0.0013 (1.28) 0.0009 (0.77) -0.0012 (1.15)-Meeting attendance 0.0136 (1.94) 0.0094 (3.53) 0.0107 (3.05) 0.0119 (2.33)- idex of participation -0.0025 (2.52) -0.0021 (2.60) -0.0037 (4.58) -0.0002 (0.17)- Index of contribution 0.0097 (4.40) 0.0047 (1.76) 0.0043 (1.93) 0.0111 (3.94)- Communtyorentation 0.0001 (0.22) 0.0023 (3.80) 0.0007 (1.312 0.0019 (2.79)
The case of Mizque is of further interest. Mizque is the municipality where theagrarian syndicates are most effective and where they are the primary channel of deliveryof various services to households. Active membership in the agrarian syndicates is almostuniversal and there is hence less need for other local institutions. The regression results forMizque indicate that no single social capital dimension is significant except for meetingattendance. This result is puzzling because one could argue that in an environment whereeveryone is member, free riding could presumably be high. But Mizque is also a small areawith high face to face interaction even in the town. In this environment, in a context ofhigh membership, the ability of households to obtain benefits of this situation may dependon their presence at meetings. Mizque is also one of two municipalities where activeparticipation in decision making is inversely related to income.
At the national level we found that there is no systematic relationship between theheterogeneity index and household welfare. The municipality results, however, indicatethat heterogeneity is a significant dimension of associational life, but not everywhere in thesame direction. In Tiahuanacu and Charagua, more heterogeneity is positively associatedwith higher income but in Villa Serrano and Mizque it is negatively related (although therelationship is statistically significant only in Villa Serrano). The reasons for thesedifferences are not immediately clear and need to be explored further. The finding isprobably related to the ethnic or linguistic composition of the population (which was notincluded in the index). Villa Serrano, where the relation is most pronouncedly negative, islargely populated by the Quechua indigenous groups, although that group is largelyhispanicized and the majority of the population speaks Spanish. However, Spanish is alsothe predominant language in Charagua where the relationship between heterogeneity and
41

income is strongly positive (note, however, that the population of Charagua is split about50-50 between indigenous and other people). Mizque and Tiahuanacu are the mostethnically homogeneous municipalities with predominantly indigenous people, but therelation between heterogeneity and household welfare is not the same in the twomunicipalities.
We noted earlier the negative correlation between participation in decision makingand household welfare, reflecting the fact that the poor participate more actively than therich. This result is predominantly due to Mizque and Charagua, and in this regard theregressions confirm the earlier tabular results (see Table 19). The importance ofcommunity initiation of local associations is strongest in Villa Serrano and Charagua,which as we discussed earlier are the two municipalities with the weakest traditionalinstitutions and hence the highest membership in non-syndicate local associations.
A fuller social capital story emerges when municipalities are paired according tothe strength of traditional institutions, strength of regional leadership and linkageorganizations and presence of effective municipal govermnent, i.e., along the dimensionsof Figure 1.
The regressions of pairs of municipalities suggest that all these institutionaldimensions identified in Figure I are relevant in explaining the impact of local institutionson household welfare. Comparing Tiahuanacu and Mizque where institutional traditionsare strong with Villa Serrano and Charagua where institutional traditions are weak, it isclear that in the latter context, the active membership of households in agrarian syndicatesand other local associations explains variations in household welfare to a much strongerdegree. Community initiation and involvement in the associations as indicated by meetingattendance and making large contributions are strong positive factors. In Tiahuanacu andMizque in contrast, membership in local associations per se, regardless of type (i.e.,whether they are syndicates or not, whether they are community or state initiated) does notmatter, and differential effects on household welfare are due to differences in the degree ofinvolvement by households in the affairs of the associations through meeting attendanceand contributions.
Comparing Tiahuanacu and Villa Serrano where regional leadership and municipaleffectiveness are weak with Mizque and Charagua where leadership and municipalgovermment are strong, the results indicate that the latter situation contributes to a strongerpositive correlation between membership in local associations and household welfare.This may reflect the complementarity between the actions of local associations and amunicipal government which is responsive to local needs.
Is Social Capital a Pro-poor Asset?
So far we have provided evidence that several dimensions of social capital and particularcombinations of institutions have positive effects on household welfare. However, sinceequation (1) imposes constant parameters over the entire distribution, the results do not saywhether social capital helps the poor to the same degree as the rich and whether investmentin social capital can help poor groups escape from poverty. In this context, it is important
42

to note that the 'ownership' of social capital (as measured by membership in localassociations and its different dimensions) is much more equally distributed than othertypes of assets (Table 24).
Table 24: Ownership of Assets, by Quintile of Household Expenditure per Capita
QuintilePoorest 2 3 4 Richest All
Social Capital Index- Multiplicative index 19.7 20.1 20.2 18.2 16.2 18.9- Additive index 21.4 22.7 24.1 24.7 25.0 23.6Years of Education 3.3 3.8 3.9 4.1 4.5 3.9Land Ownership (hectare) 2.7 3.9 2.9 2.7 4.8 3.4Animal Ownership (number) 19.1 16.6 19.9 19.4 22.4 19.5Farm Equipment Ownership 0.5 0.4 0.5 0.5 0.5 0.5
(number)Household Durables 1.7 1.9 2.2 2.4 3.0 2.2
The poorest quintile of households has only 3.3 years of education against 4.5 yearsfor the richest quintile. Land and household durables are distributed more unequally. Incontrast, the additive social capital index is only slightly below average for the poorestquintile and the multiplicative index is even above average. The question remains whetherthis accumulation of social assets by the poor is rational, in the sense that it indeed helpsthem escape poverty or at least provides them with relatively higher returns than otherassets.
We address this question in several ways. First, we estimated a probit model of thelikelihood to be poor.19 The results indicate that social capital can significantly reduce theprobability to be poor (Table 25). A household which is an active member of an agrariansyndicate has a 14% lower probability to be poor than a similar household with nomembership. Membership in another local organization reduces the probability to be poorby 2.8%. This 5:1 ratio is much higher than the 2:1 ratio we found earlier between thecoefficients measuring the impact on household welfare, indicating that there is a strongercorrelation between active membership in an agrarian syndicate and poverty status thanbetween membership and welfare level in general. This could either reflect a strongpoverty reducing effect resulting from the activities of agrarian syndicates, but it could alsoreflect that the syndicates are not always open to the poor and exclude them from activemembership.
19 The poverty line was set at two-thirds of median household expenditure per capita.
43

Table 25: Social Capital and the Probability to be Poor (probit estimation)
Impact on the Probability to be Poor'Social Capital Dimensions- Membership in agrarian syndicates -0.1405 (3.60)- Number of other memberships -0.0284 (2.15)- Heterogeneity index 0.0009 (1.76)- Meeting attendance -0.0083 (2.83)- Index of participation 0.0006 (1.54)- Index of contribution -0.0021 (1.21)- Community orientation -0.0002 (0.86)Household Size 0.0500 (9.55)Years of Education -0.0214 (4.46)Female Head of Household 0.0955 (2.38)Age of Head of Household -0.0125 (3.49)Age of Head of Household Squared 0.0001 (3.47)Non-Farmer Household -0.0358 (1.06)Land Ownership (hectare) -0.0029 (1.23)Animal Ownership (number) -0.0003 (0.85)Farm Equipment Ownership (number) -0.0168 (0.66)Villa Serrano 0.0389 (1.15)Mizque -0.0943 (3.00)Charagua -0.0882 (2.31)Municipality's Capital City -0.1230 (3.57)Number of Observations 999Log Likelihood -372.5Chi-squared 137.05Probability > Chi-squared 0.0000
Probability derivatives at the mean of each explanatory variable (or for 0 to 1 change fordunimy variables) and z-scores based on robust standard errors.
Quantile regressions are a further way to explore differences in the role of socialcapital between the poor and the rich. Quantile regressions estimate the regression linethrough given points on the distribution of the dependent variable (whilst an OLSregression line goes through the mean) and can assess whether certain explanatoryvariables are weaker or stronger in different parts of the distribution. However, thecoefficients of quantile regressions are conditional upon the values of the explanatoryvariables, and hence coefficients from quantile regressions are not comparable with thoseof OLS regressions.2 0
The results from quantile regressions (Table 26) confirm that the importance ofsocial capital and its specific dimensions is not the same across the distribution. Lookingat the additive index, it appears that the correlation between social capital and householdwelfare decreases as one moves to higher levels of the distribution. An active membershipof an agrarian syndicate is most critical for people located between the 25th percentile and
20 Specifically, the coefficients show the effect of a marginal change in an explanatory variable onthe xd' conditional quantile of the dependent variable (Buchinsky, 1998).
44

the median of the distribution. Given that the poor are practically excluded frommemberships in two municipalities, this result makes sense. As a substitute however,membership of local organizations, are most critical for the people in the lowest 25% of thedistribution. The importance of attending meetings is highest at the 25th percentile andgradually declines after that. It is quite remarkable that the coefficient of index ofcontribution gradually declines as one moves up the distribution. This indicates that thepayoff of a dollar's worth of membership fee or a day worked as in-kind contribution ishighest for the poorest and declines after that. These results strongly underline theimportance, not only of membership, but of active participation in the activities of theassociation.
Table 26: Social Capital and the Distribution of Household Welfare(quantile regressions)
Quantile of the Distribution of Household Welfare10 25 50 75 90
(median)Social Capital Index (additive) 0.0059* 0.0052* 0.0055* 0.0055* 0.0044*Social Capital Dimensions- Membership in agrarian syndicates 0.0366 0.1564* 0.1240* 0.0851 0.0209- Number of other memberships 0.0568* 0.0613* 0.0284 0.0431 0.0574- Heterogeneity index 0.0008 -0.0019* -0.0002 0.0015 0.0005- Meeting attendance 0.0080* 0.0123* 0.0097* 0.0076* 0.0071- Index of participation -0.0010 -0.0016* -0.0023* -0.0036* -0.0014- Index of contribution 0.0135* 0.0103* 0.0082* 0.0061 * 0.0011- Community orientation 0.0008 0.0010 0.0015* 0.0014* 0.0009Years of Education 0.0467* 0.0444* 0.0512* 0.0376* 0.0424*Land Ownership (hectares) 0.0000 0.0030* 0.0022* 0.0010 0.0059*Animal Ownership (number) 0.0006 0.0022* 0.0020* 0.0017* 0.0010*Farner Equipment Ownership 0.1064* 0.1056* 0.0751 * 0.0900 0.0516
(number) I_I_INote: Entries are coefficients of quantile regressions through the X quantile of the
distribution of household expenditure per capita. Asterisk indicates significance at the90% confidence level.
A third way to assess whether the impact of social capital on household welfarevaries across the distribution, is to split the sample according to households' endowment ofassets. In the rural setting of the study area, land is clearly a key asset to households andwe split the sample households according to whether they had less or more than onehectare of land (Table 27).
The results indicate that the correlation between social capital and householdwelfare is almost twice as strong for smallholders than for households with more land.The critical difference is in memberships in non-syndicate local organizations which areassociated with an 8.3% increase in household welfare for smallholders against only 3.6%for households with more land. In contrast, the effect of active membership in an agrariansyndicate goes the other way. It is much higher for households with more than one hectareof land.
45
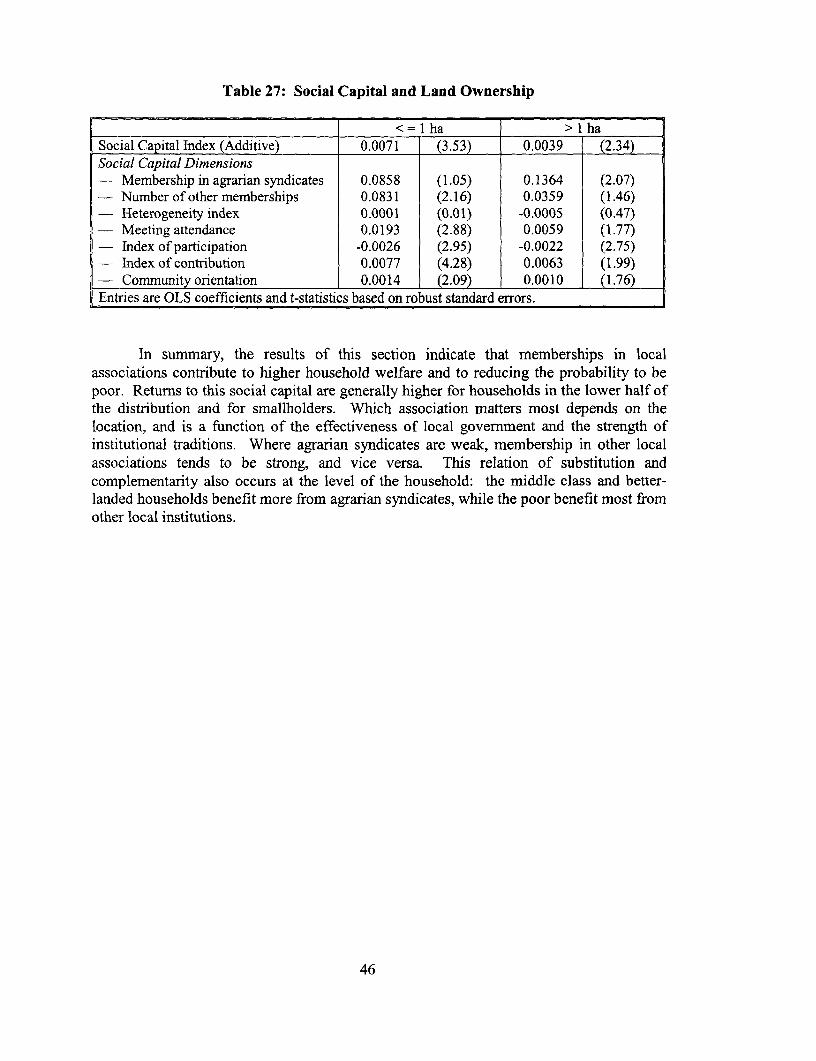
Table 27: Social Capital and Land Ownership
<= L ha > i haSocial Capital Index (Additive) 0.0071 (3.53) 0.0039 (2.34)Social Capital Dimensions- Membership in agrarian syndicates 0.0858 (1.05) 0.1364 (2.07)- Number of other memberships 0.0831 (2.16) 0.0359 (1.46)- Heterogeneity index 0.0001 (0.01) -0.0005 (0.47)- Meeting attendance 0.0193 (2.88) 0.0059 (1.77)- Index of participation -0.0026 (2.95) -0.0022 (2.75)- Index of contribution 0.0077 (4.28) 0.0063 (1.99)- Community orientation 0.0014 (2.09) 0.0010 (1.76)Entries are OLS coefficients and t-statistics based on robust standard errors.
In summary, the results of this section indicate that memberships in localassociations contribute to higher household welfare and to reducing the probability to bepoor. Returns to this social capital are generally higher for households in the lower half ofthe distribution and for smallholders. Which association matters most depends on thelocation, and is a function of the effectiveness of local government and the strength ofinstitutional traditions. Where agrarian syndicates are weak, membership in other localassociations tends to be strong, and vice versa. This relation of substitution andcomplementarity also occurs at the level of the household: the middle class and better-landed households benefit more from agrarian syndicates, while the poor benefit most fromother local institutions.
46

8. THE EFFECTS OF SOCIAL CAPITAL: ASSET ACCUMULATION, ACCESS TOCREDIT, COMMUNITY ASSISTANCE, AND COLLECTIVE ACTION
Asset Accumulation
So far we have concentrated on the impact of local associations on current income asproxied by expenditure per capita. However, in a relatively poor rural setting, a primeconsideration for households is to have available coping strategies to deal with the risk ofincome fluctuations. Accumulating assets which can be sold or borrowed against in timeof need or arranging access to credit are important components of such strategies.Households' ownership of consumer durable goods is one measure of the extent to whichhouseholds have been able to save and accumulate assets. As we saw earlier (Table 6), theaccumulation of household durables in the study areas is at a low level. Out of a list of 15such assets, the average household owned only 2.2 assets.
We aggregated this information into a durable goods ownership score for thehousehold using weights derived from a principal component analysis of the 15 variables.Re-estimating equation (1) with this ownership score as dependent variable provides anassessment whether social capital has contributed to asset accumulation and long-termincreases in household welfare. The results (column 1, Table 28) indicate a strongcorrelation between membership in local organizations and ownership of durable goods.Active membership in an agrarian syndicate is associated with an increase in the ownershipscore of 0.076 (an increase of 12.1%), while membership in other organizations isassociated with an increase of 0.046 (an increase of 7.3%). The results for the otherdimensions are similar to those for current consumption, with the most important positiveeffect coming from meeting attendance. It is again noteworthy that the effect of humancapital (years of education) is almost identical to that of social capital as measured bymembership in organizations. The demographic and locational control variables in thisequation show however very different results for the accumulation of durable goods asopposed to current expenditure. Specifically, female-headed households are at a muchgreater disadvantage, while non-farmer households have a much greater advantage inaccumulating assets, controlling for all other characteristics. Among the locationalvariables, accumulation is much higher in cities than in rural areas although the differencesbetween municipalities are smaller than was the case for current consumption.
Another aspect of asset accumulation is the ability to have savings. While the LLIquestionnaire did not record the amount of savings, it did ask whether households had beenable to increase savings in the past year. Households with more memberships in localassociations were significantly more able to do so than others (column 2, Table 28).Membership in an agrarian syndicate was associated with a 4.8% higher probability ofhaving increased savings, whilst the effect of membership in another association wasassociated with a 2.0% increase in this probability. We also tested whether membership inan association with specific financial objectives, for example, a rotating credit and savingsassociation, made a difference. This did not tum out to be the case. The sample contained
47
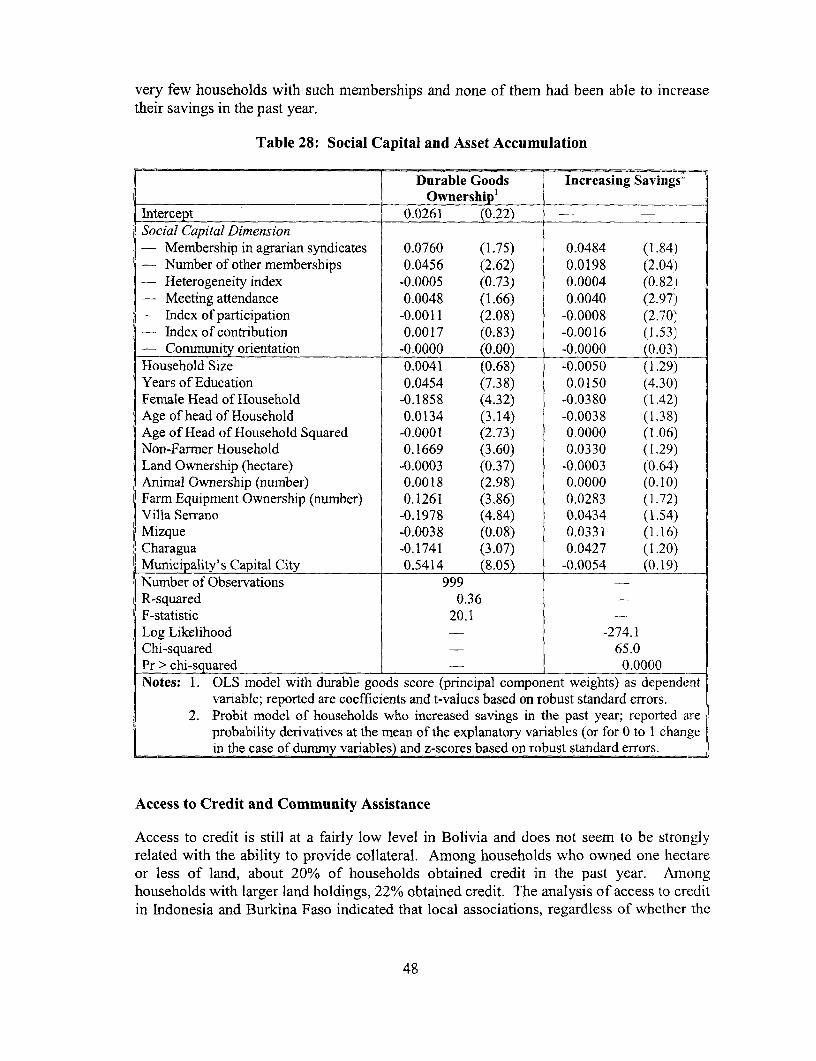
very few households with such memberships and none of them had been able to increasetheir savings in the past year.
Table 28: Social Capital and Asset Accumulation
Durable Goods Increasing Savings2Ownership'
Intercept 0.0261 (0.22)Social Capital Dimension- Membership in agrarian syndicates 0.0760 (1.75) 0.0484 (1.84)- Number of other memberships 0.0456 (2.62) 0.0198 (2.04)- Heterogeneity index -0.0005 (0.73) 0.0004 (0.821- Meeting attendance 0.0048 (1.66) 0.0040 (2.97)- Index of participation -0.0011 (2.08) -0.0008 (2.70)- Index of contribution 0.0017 (0.83) -0.0016 (1.53)- Cornmunity orientation -0.0000 (0.00) -0.0000 (0.03)Household Size 0.0041 (0.68) -0.0050 (1.29)Years of Education 0.0454 (7.38) 0.0150 (4.30)Female Head of Household -0.1858 (4.32) -0.0380 (1.42)Age of head of Household 0.0134 (3.14) -0.0038 (1.38)Age of Head of Household Squared -0.0001 (2.73) 0.0000 (1.06)Non-Farmer Household 0.1669 (3.60) 0.0330 (1.29)Land Ownership (hectare) -0.0003 (0.37) -0.0003 (0.64)Animal Ownership (number) 0.0018 (2.98) 0.0000 (0.10)Farm Equipment Ownership (number) 0.1261 (3.86) 0.0283 (1.72)Villa Serrano -0.1978 (4.84) 0.0434 (1.54)Mizque -0.0038 (0.08) 0.0331 (1.16)Charagua -0.1741 (3.07) 0.0427 (1.20)Municipality's Capital City 0.5414 (8.05) -0.0054 (0. 19)Number of Observations 999R-squared 0.36F-statistic 20.1Log Likelihood _ -274.1Chi-squared 65.0Pr > chi-squared 0.0000Notes: 1. OLS model with durable goods score (principal component weights) as dependent
variable; reported are coefficients and t-values based on robust standard errors.2. Probit model of households who increased savings in the past year; reported are
probability derivatives at the mean of the explanatory variables (or for 0 to 1 changein the case of dummy variables) and z-scores based on robust standard errors.
Access to Credit and Community Assistance
Access to credit is still at a fairly low level in Bolivia and does not seem to be stronglyrelated with the ability to provide collateral. Among households who owned one hectareor less of land, about 20% of households obtained credit in the past year. Amonghouseholds with larger land holdings, 22% obtained credit. The analysis of access to creditin Indonesia and Burkina Faso indicated that local associations, regardless of whether the
48

provision of financial services was the prime objective, played a key role in ensuringaccess to credit. The results of Table29 suggest that this is not the case in Bolivia.Overall, the regression explaining the probability of obtaining credit showed only very lowcorrelation with any of the social capital variables, as well as with most of thecharacteristics of the households.21 However, a noteworthy result is that larger and female-headed households are more likely to receive credit. Nevertheless, the key factor seems tobe location. Specifically, being a resident of the municipality of Mizque provides asignificant increase in the probability of obtaining credit. This municipality indeed hasvarious local associations that specialize in this activity.
As we mentioned earlier, there are very few households in the sample who aremembers of an association with explicit financial objectives. However, the results inTable 29 do suggest that these associations achieved their objective since such membershipis associated with a 22% increase in the probability to obtain credit.
In addition to inquiring about credit, the LLI questionnaire also asked householdswhether they thought they would be able to get assistance from people in the communityother than relatives or friends in case of need. Sixty-four percent of households answeredthat they "definitely" or "probably" would be able to get such assistance. Among those,22% listed community organizations as the first source where they would turn to for suchhelp. Column 2 in Table 29 suggests that households who are members of localorganizations are more likely to have faith in 'the community as a source of help. This isnot at all related to the characteristics or the wealth of the household, but it is stronglyinfluenced by the location. Households in Tiahuanacu are least likely to turn to thecommunity for help, while those in Charagua are most likely to do so.
21 A Tobit regression explaining the amount of credit obtained yielded a similar result.
49

Table 29: Social Capital and Access to Credit and Community Assistance
Credit1 Community Assistance
Social Capital Dimension- Membership in financial
associations 0.2177 (1.63)- Membership in agrarian syndicates -0.0356 (0.84) 0.0433 (1.57)- Number of other memberships 0.0174 (1.01) 0.0282 (2.58)- Heterogeneity index 0.0008 (1.15) -0.0007 (1.37)- Meeting attendance -0.0035 (1.34) 0.0019 (1.26)- Index of participation -0.0001 (0.11) 0.0004 (1.04')- Index of contribution 0.0016 (0.89) 0.0016 (1.53)- Community orientation -0.0005 (1.45) 0.0009 (3.34)Household Size 0.0207 (3.45) 0.0074 (1.73)Years of Education -0.0029 (0.57) 0.0029 (0.69)Female Head of Household 0.0821 (1.86) -0.0372 (1.19)Age of head of Household -0.0040 (0.73) 0.0020 (0.49)Age of Head of Household Squared 0.0000 (0.35) -0.0000 (0.56)Non-Farmer Household 0.0272 (0.65) -0.0240 (0.86)Land Ownership (hectare) _ -0.0018 (1.27)Animal Ownership (number) -0.0001 (0.57)Farm Equipment Ownership (number) - 0.0251 (1.13)Villa Serrano 0.0221 (0.54) 0.2920 (5.301Mizque 0.0940 (2.14) 0.1737 (3.40;Charagua -0.0888 (1.92) 0.4418 (6.36)Municipality's Capital City -0.0048 (0.10) 0.1479 (3.09)Number of Observations 999 999Log Likelihood -495.9 -339.8Chi-squared 44.7 117.0Pr > Chi-squared 0.0005 0.0000Notes: 1. Probit model with receipt of credit as dependent variable; reported are probability
derivatives at the mean of the explanatory variables (or for 0 to I change in the caseof dummy variables) and z-scores based on robust standard errors. Physical assetsvariables were excluded from the specification because ownership of such assets isarguable endogenous to obtaining credit, since credit is often used to buy assets.
2. Probit model of the probability to select a community organization as first or secondchoice to receive assistance, conditional upon the perception of a high likelihood toreceive assistance in case of need. Reported are probability derivatives at the meanof the explanatory variables (or for 0 to 1 change in the case of dummy variables)and z-scores based on robust standard errors.
Collective Action
In addition to contributing to asset accumulation and to improving access to credit andassistance, social capital has also been documented to aid in collective action andcollective decision making. This is especially relevant in rural settings where comnmTonproperty resources such as water, forestry or grazing land need to be managed by the
50
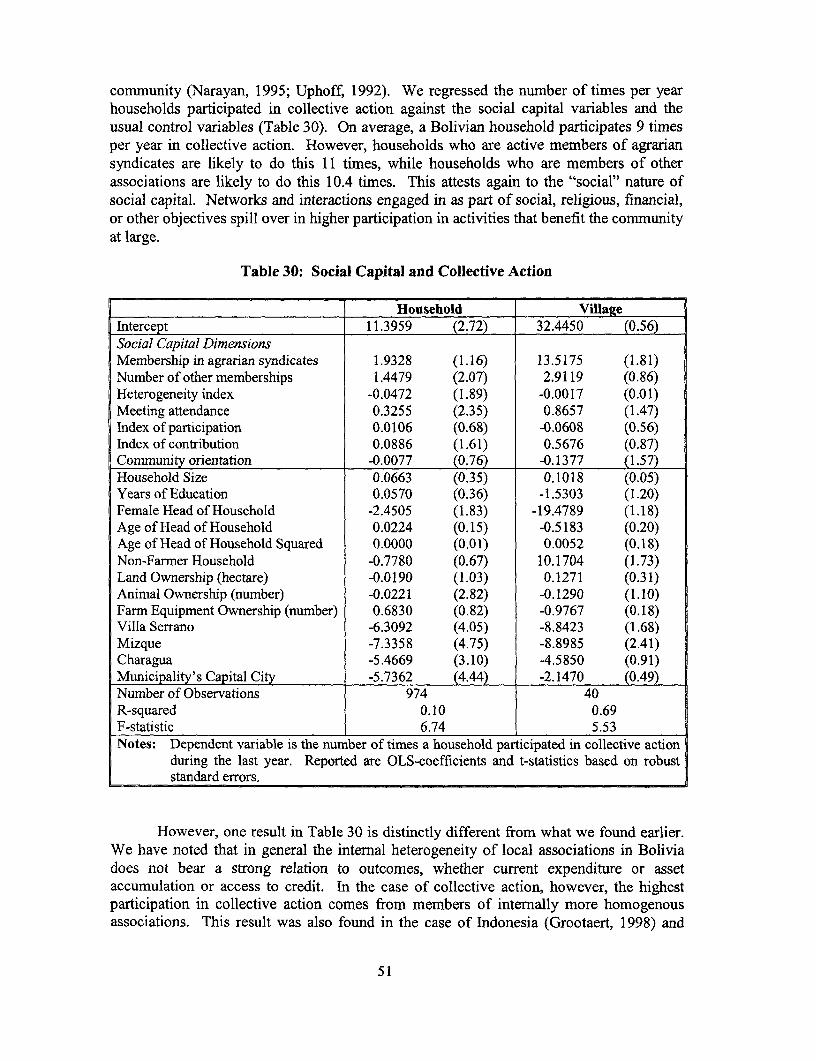
community (Narayan, 1995; Uphoff, 1992). We regressed the number of times per yearhouseholds participated in collective action against the social capital variables and theusual control variables (Table 30). On average, a Bolivian household participates 9 timesper year in collective action. However, households who are active members of agrariansyndicates are likely to do this 1I times, while households who are members of otherassociations are likely to do this 10.4 times. This attests again to the "social" nature ofsocial capital. Networks and interactions engaged in as part of social, religious, financial,or other objectives spill over in higher participation in activities that benefit the communityat large.
Table 30: Social Capital and Collective Action
Household VillageIntercept 11.3959 (2.72) 32.4450 (0.56)Social Capital DimensionsMembership in agrarian syndicates 1.9328 (1.16) 13.5175 (1.81)Number of other memberships 1.4479 (2.07) 2.9119 (0.86)Heterogeneity index -0.0472 (1.89) -0.0017 (0.01)Meeting attendance 0.3255 (2.35) 0.8657 (1.47)Index of participation 0.0106 (0.68) -0.0608 (0.56)Index of contribution 0.0886 (1.61) 0.5676 (0.87)Community orientation -0.0077 (0.76) -0.1377 (1.57)Household Size 0.0663 (0.35) 0.1018 (0.05)Years of Education 0.0570 (0.36) -1.5303 (1.20)Female Head of Household -2.4505 (1.83) -19.4789 (1.18)Age of Head of Household 0.0224 (0.15) -0.5183 (0.20)Age of Head of Household Squared 0.0000 (0.01) 0.0052 (0.18)Non-Farmer Household -0.7780 (0.67) 10.1704 (1.73)Land Ownership (hectare) -0.0190 (1.03) 0.1271 (0.31)Animal Ownership (number) -0.0221 (2.82) -0.1290 (1.10)Farm Equipment Ownership (number) 0.6830 (0.82) -0.9767 (0.18)Villa Serrano -6.3092 (4.05) -8.8423 (1.68)Mizque -7.3358 (4.75) -8.8985 (2.41)Charagua -5.4669 (3.10) 4.5850 (0.91)Municipality's Capital City -5.7362 (4.44) -2.1470 (0.49)Number of Observations 974 40R-squared 0.10 0.69F-statistic 6.74 5.53Notes: Dependent variable is the number of times a household participated in collective action
during the last year. Reported are OLS-coefficients and t-statistics based on robuststandard errors.
However, one result in Table 30 is distinctly different from what we found earlier.We have noted that in general the internal heterogeneity of local associations in Boliviadoes not bear a strong relation to outcomes, whether current expenditure or assetaccumulation or access to credit. In the case of collective action, however, the highestparticipation in collective action comes from members of internally more homogenousassociations. This result was also found in the case of Indonesia (Grootaert, 1998) and
51
points to a potential conflict between the interests of the households and those of thecommunity. We have explored these results further to identify which of the ninedimensions that make up the heterogeneity index are most important in causing this resultand it turns out that collective action is the highest in associations that are mosthomogenous according to kin, age, and education.
It is also worth noting that female-headed households are significantly less likely toparticipate in collective action than other households. There are also important locationaleffects. Collective action is more likely to take place in rural areas than in cities and it ismost predominant in the municipality of Tiahuanacu.
Given that by nature collective action is organized at the level of the community,we also estimated the collective action regression using the village as unit of observation.The results largely confirm those of the household-level regression but they do highlightthe role of agrarian syndicates: villages with high membership in the syndicates aresignificantly more likely to organize collective action.
Household versus Village Effects
Lastly, we wish to address to the question whether social capital operates primarily at thehousehold level or at the village level. The earlier cited study on Tanzania by Narayan andPritchett (1997) concluded that social capital is primarily a village effect, based on thesignificance of the social capital variables in village regressions. When we re-estimateequation (1) using the village as unit of observation, we find mixed results (results notreported here).22 The additive social capital index is significant in a village-levelregression but the separate social capital dimensions are not. The sole, but importantexception is the community orientation variable which is positively related to the welfarelevel of the village. These results suggest that in Bolivia social capital exhibits somevillage-level externalities, but that the distribution of benefits within the village is afunction of the extent to which households are directly linked into the associationalnetworks, via membership and active participation.
A further test of the relative role of village-effects versus household-effects consistsof adding village-level social capital variables to the household regressions. We found thatthe household-level social capital variables retain their significance while the village-levelsocial capital variables are not significant. This suggests that village-level social capitaleffects play little role in explaining the variance of household welfare (although they can ofcourse explain the variance of village welfare).
This conclusion, however, needs to be treated with caution because of the possibleexistence of omitted-variable bias, in case the regression does not control for all relevantvillage factors. We try to tackle this question in two ways. As a first approach, we addedto the basic specification of Table 21 a dummy variable for each village (minus oneomitted village), under the assumption that these variables capture all omitted relevant
22 In a village-level regression, all variables are recalculated as village-level averages, with the exception ofthe location dummy variables.
52

village factors. This raises the R-squared from 0.42 to only 0.47, suggesting that theamount of potential omitted variable bias is fairly limited. More importantly, it changesthe coefficients of the social capital variables only very slightly and leaves theirsignificance pattern unaffected. This suggests that our finding of significant social capitaleffects at the household level is not the result of omitted variables to capture the socialcapital effects at the village level.
A second and more interesting approach is to include in the regression informationon the villages' general economic and social condition. The village-level data files includea number of economic variables (number of inhabitants, distance to nearest service center,presence of all-year passable road, number of development projects in the community), aswell as a set of social and institutional variables. When added to equation (1), none turnedout to be significant, lending strong support to the proposition that there is no omittedvariable bias in the results discussed in this paper.
53
9. SOCIAL CAPITAL AND HOUSEHOLD WELFARE: Two-WAY CAUSALITY?
The model underlying this paper and presented in section 6 took the fundamental positionthat social capital is an input in the household's production function and can be modeledsimilar to human capital and other household asset endowments. However, like humancapital, social capital is also, at least partly, a consumption good. This is certainly true forparticipation in non-mandatory social groups pursuing leisure activities. Since leisure isusually a luxury good, demand for it will rise with income, and then there could be areverse causality from welfare level to social capital. If so, the estimated coefficient ofsocial capital in equation (1) is upward biased.
The strongest evidence in support of a causation from social capital to incomecomes from estimating structural equations which indicate the role of social capital inaccess to services, such as credit or in determnining collective action. Such evidence waspresented by Narayan and Pritchett (1997) for Tanzania documenting the role of socialcapital in obtaining access to agricultural inputs such as fertilizer. Likewise, Grcotaert(1998) documented the positive role of social capital in access to credit in Indonesia.Grootaert, Swamy and Oh (1998) similarly found that social capital was a powerfuldeterminant in access to credit as well as in improving risk management for the householdby reducing the forced sale of assets. In the case of Bolivia, the results presented in theprevious section show weaker evidence of the role of social capital in providing access tocredit although there is a strong role of social capital in collective action.
However, the extent of two-way causality is empirically testable by means ofinstrumental variable estimation. The real challenge is to find a suitable instrument set forsocial capital: instrunents must deternine social capital but not household welfare (nor bedetermined by household welfare). In order to make this task more feasible, we limit ourattention to the model which uses a single social capital index. We argue that thefollowing are conceptually suitable instruments for social capital:
(I) Ethnic and religious diversity of the village. This affects directly thepotential heterogeneity of associations, which is one of the components ofthe aggregate social capital index. If there is only one religion in thevillage, it is not possible to have a religiously heterogeneous association.There is also no reason to assume that ethnic or religious compositionwould affect income, nor, obviously, will income affect diversity.2 3
(2) The density and democratic functioning of institutions in the village.Clearly, the possibility for a given household to join an associationincreases as more associations exist in the village. The likelihood to joinand to be active in the association can also be expected to increase asinstitutions are perceived to function democratically. As we have already
23 This position is not inconsistent with the possibility that ethnic diversity may affect economic growth atthe national level (as has been shown for Africa by Easterly and Levine, 1995, and Collier, 1998).
54
demonstrated earlier, the density of associations at the village level does notsignificantly affect the level of household expenditure directly.
(3) The extent of community involvement in the creation of grassrootsorganizations. Where a community is perceived to be actively involved inthe creation of local organizations, it may increase the level of trust in theassociation and hence make it more likely that households will join theassociation. This variable is the village equivalent of the communityorientation variable which we used in the household regression. As ourearlier results indicate, the village variable does not have a direct impact onthe level of household expenditure.
Given the content of the available village data file, this leads to four possibleinstruments: an index of ethnic and religious diversity, the number of existing associationsin the village, an index capturing whether leaders of the three most important associationsare elected democratically, and an index capturing whether the three most importantassociations were originated by the community.24
We added those 4 variables to equation (1) and found that none were significant.Hence they meet the first criterion for being a valid instrument, namely not affectinghousehold welfare. To test the second criterion, we applied the test for over-identifyingrestrictions proposed by Davidson and MacKinnon (1993). This tests the joint nullhypothesis that the underlying model (equation (1) is correctly specified and that theapplied instruments are valid. (The latter hypothesis cannot be tested separately.)Table 31 reports the test-statistic's p-value as well as the coefficient and t-statistic of thesocial capital index in the 2SLS equation. To check for the sensitivity of results to specificinstrument selection, we tested several combinations of the instruments. Althoughincreases in the R-squared in the first stage equation are modest, all combinations ofinstruments pass the over-identifying restrictions test.
In all cases, the instrumental variables method leads to higher coefficients (rangingfrom 0.0153 to 0.0177) for the social capital index than in the OLS model (where it was0.0057). This indicates that equation (1) is correctly specified and that social capital is anexogenous determinant of household welfare. If there were significant reverse causality,the coefficient of the social capital index in the 2SLS regression would have been lowerthan the OLS coefficient. This outcome is the same as that reported by Narayan andPritchett (1997) for Tanzania, by Grootaert (1999) for Indonesia, and by Grootaert, Oh andSwamy (1999) for Burkina Faso.
The higher coefficient of the instrumented social capital index implies that a 10%increase in the household's social capital endowment leads to a 3.6% to 4.2% increase inhousehold expenditure per capita. This is significantly larger than the effect from a 10%
24 It is important to point out that these variables were collected independently of the household data, bymeans of interviews with village leaders, teachers, health professionals, etc., and also with focus groupsof households who did not answer the household questionnaire.
55

increase in the human capital endowment, which would increase household expenditureper capita by 1.6%.
Table 31: Social Capital and Household Welfare: Instrumental Variables Results
Social Capital Index Incremental OIR TestInstrument Set Coefficient t-statistic R-squared p-value
.I Diversity, institutional density,democratic functioning,community initiation 0.0177 2.18 0.024 0.97
2. Institutional density, democraticfunctioning, community initiation 0.0166 1.91 0.021 0.'3
3. Tnstitutional density, communityinitiation 0.0153 1.62 0.018 0. 87
This finding strengthens the case for viewing social capital as an input in thehousehold's production function. This in turn opens up the case for investing in socialcapital, just as investments are made in human capital. However, there is a criticaldifference: education is embodied in one individual and can be acquired by one individualregardless of what other people do. By definition, social capital can only be acquired by agroup of people and requires a form of cooperation among them (although, as our resultshave shown, the extent to which different members of a group capture the benefits doesdepend upon their individual actions, especially the extent of active participation throughmeeting attendance and contributions). This gives social capital an inevitable public goodcharacter and this has implications for its production (Coleman, 1988, 1990). In particular,like all public goods, it will tend to be underproduced relative to the social optimum,unless the group responsible for its production can fully internalize the externalityinvolved. Which group is best suited to producing social capital thus depends largely oTIthe scope of the created externality and this determines the size of the group needed tointernalize it effectively and avoid free rides. For example, in the case of farmers'associations, the scope is local; in the case of the rule of law, it is national and the centralgovernment needs to play the essential role.
However, the case of Bolivia also illustrates the importance of the linkages betweenthe local associations and the municipal and regional government. The agrarian syndicateswhich were set up originally by the government have, over time, come to be perceived ascommunity-oriented by many of the respondents in the study. In part this reflects theimportant role which these syndicates have played as a communication channel betweenthe community and the local and regional level of government. Both functions -- thecreation of social capital among the members of the association and the linkage with otherassociations and with government -are the channels through which they benefit theirmembers and the community.
56
10. SUMMARY AND CONCLUSION
Bolivia is characterized by a large number and variety of local level institutions. We found67 different types of local associations. On average, households belong to 1.4 groups andassociations. The landscape of local institutions is dominated by the presence of agrariansyndicates which were created by government decree in 1952 but now are viewedprimarily as community-initiated institutions to manage communal resources. As part ofthe Law of Popular Participation, these are territorial organizations that have beenregistered as legal entities to work closely with municipalities to represent the interests andpriorities of local people in municipal decision making.
Of the total number of memberships, 45% were in agrarian syndicates, 12% inproduction groups, 9% in social service groups, and 7% in education and health groupswith smaller numbers belonging to religious and government groups. Overall, 14% of thememberships were in NGO-initiated groups and another 8% in other supra-communitygroups. These included cross-community syndicate groups, trade and sports associations.In terms of gender, memberships in men-only groups were the most frequent (43%),followed by memberships in mixed groups (37%) and in women-only groups (20%). Thelatter tended to be the most frequent in areas where NGOs had been active, particularly inCharagua and Villa Serrano.
The issue of the role of local level institutions was probed in different ways.Tabulation of which among the 67 groups households considered as the most important,revealed that agrarian syndicates ranked first, 41%, followed by non-denominationalNGOs, 14%. Except for NGOs and religious groups, a majority of households said that thegroups were initiated by the community and had formal status in the communities. Thereis still a strong communal orientation in the communities studied. When asked whyhouseholds had joined the groups that they had rated the most important, approximately50% said it was because of the positive impact on the community. Overall, 25% said thatthey had joined to improve household welfare. Households reported many benefits frombelonging to groups. These included increased access to education services, water supplyand sanitation, electricity, irrigation, agriculture technology, land and forest rights, creditand savings.
In many areas agrarian syndicates rotate leadership among households. Whilesome writers consider this to be a drawback, this practice has led to the inclusion of thepoor in leadership roles. Across the study sample, 51% of the poorest households reportedhaving been in leadership positions in groups and associations. On the other hand, we didfind evidence that suggests that in some areas the poor are excluded from activemembership in the syndicates.
In addition to community-based groups, supra-community or linkage organizationsthat work across communities have important roles to play in linking groups and incollective bargaining. In this study, we found that 8% of memberships were in suchorganizations. Although numerically small, these organizations play critical roles in
57

shifting basic power relations between community groups and the state, represented by themunicipality.
There were important differences in the patterning of institutions in the fourmunicipalities. In Mizque which has the highest per capita expenditure, almost everyonewas an active member of agrarian syndicates. This was also true for Tiahuanacu with a93% membership rate. By contrast, only 18% of households in Charagua and 48% ofhouseholds in Villa Serrano were active in the syndicates. To substitute, in these twomunicipalities, households belong instead to a variety of production groups, social serviceand health and education groups. We found that the four municipalities could bedistinguished along two dimensions: strength of traditional institutions on the one hand,and effective municipal government and supra-community leadership or linkageorganizations, on the other hand. Mizque and Tiahuanacu have a strong institutionaltradition, while Villa Serrano and Charagua have weak traditional institutions. We alsofound that Charagua and Mizque were characterized by strong regional leadership andeffective municipal government while Tiahuanacu and Villa Serrano were characterized byineffective municipal government and weak regional leadership. It is important to notethat Mizque had the highest per capita expenditure and Villa Serrano the lowest per capitaexpenditure. This pattern is the result of the interaction of historical factors with the natureof society and long-term interventions by outside actors such as NGOs.
In this paper we estimated empirically the impact of social capital on householdwelfare and poverty in Bolivia. The focus was on households' memberships in localassociations -an aspect of social capital that is particularly relevant for households' day-to-day decisions which affect their welfare and consumption.
We used a reduced-forrn model of household welfare, which controls for relevanthousehold and location characteristics, to estimate the contribution of social capital tohousehold welfare. The underlying structural equations treat social capital as an input,together with human and physical capital, in the household's production function. Theeffects of social capital operate through (at least) three mechanisms: sharing ofinformation among association members, reduction of opportunistic behavior, andimproved collective decision making. The magnitude of the social capital effect was foundto be about 2.5 times larger than that of human capital. Increasing the averageendowments of education for each adult in the household by one year (which is about a25% increase) would increase household expenditure per capita by 4.2%. A similarincrease in social capital endowment would increase household expenditure per capita by9% to 10.5%.
We measured social capital along six dimensions: density of memberships, internalheterogeneity of associations (by gender, age, education, religion, etc.), meetingattendance, active participation in decision making, payment of dues (in cash and in kind),and community orientation. Among these, the strongest effect was found to come from thenumber of memberships. An active membership in an agrarian syndicate is associated onaverage with an 11.5% higher household expenditure per capita. A membership in anotherlocal association is associated with a 5.3% higher expenditure level. However, our resultsalso suggest that households who participate actively in the association by attending
58

meetings frequently and by making larger contributions in cash or in kind benefit morethan others. We also found that households who are primarily members of community-initiated organizations obtain larger benefits, but this effect was quite small. A distinctfeature of associational life in Bolivia is that the poor household groups participate moreactively in decision making. This was especially observed in Mizque and Charagua.
The four study zones in our data set have a different institutional tradition as wellas different strengths of regional leadership and municipal government. We found thesefeatures to be related to the impact of social capital at the household level. Specifically, inMizque where membership in agrarian syndicates is almost universal, the impact of otherlocal associations on household welfare is very small. In order to benefit, households needto participate actively in the associations by attending their meetings. Mizque also hasstrong linkage organizations, social cohesion and a strong municipal government. In VillaSerrano and Charagua, where the institutional tradition is weaker, we found a strongimpact of membership both in agrarian syndicates and other associations on householdwelfare. Over and above this, active participation in the association and communityinitiation were found to be important variables. In Charagua, the linkage organizations arestrong as is the municipal government, and the traditional organizational structures arebeing revived through the Guarani Assembly which has already become a political force insome areas.
Social capital reduces the probability to be poor, and the returns to householdinvestment in social capital are generally higher for the poor than for the rich. The effectof the aggregate social capital index was about one-third larger at the 1 0 h percentile of thedistribution than at the 90th percentile. This was primarily due to membership in agrariansyndicates which had the largest impact between the 25th percentile and the median of thedistribution, while the impact of membership in other local organizations was the strongestin the bottom quartile of the distribution. Likewise, the benefits from membership arehigher for households with little land than for those with more land. The pooresthouseholds in Bolivia are actually members of more non-syndicate organizations than therich and our results indicate that this investment is warranted. It exceeds the returns toeducation and other assets quite significantly.
Social capital is hypothesized to have several long-term benefits, such as betteraccess to credit and a resulting better ability to smoothen out income fluctuations byborrowing and/or accumulating assets. Our empirical results partially confirm the validityof these propositions. Households with higher levels of social capital are significantlymore successful in accumulating household durables which suggests that they have beenbetter able to smoothen out their consumption over time. Our results also provide directevidence that these households have the highest probability of increasing their savings. Onthe other hand, we found only weak evidence that households which are well integrated inthe network of local associations have better access to credit. We found the latter to beprimarily a function of location, with access to credit being strongest in Mizque. We alsofound that households with many memberships in local associations and who frequentlyattend their meetings are more likely to participate in collective action. Households withstrong ties in local associations also have a higher level of trust in their community as asource of assistance in case of need.
59

Social capital affects household welfare but there can also be reverse causality:richer households could have a higher demand for memberships in associations and havemore time to participate (although the opportunity cost of their time is also higher).Instrumental variable estimation suggested that the direct effect of social capital on welfaredominates the reverse effect in explaining the correlation between the two variables. Thisfinding is robust for several sets of instruments available in the data.
Historical evidence also strengthens this interpretation. Agrarian syndicates werecreated almost 50 years ago in a situation of widespread poverty. Although this wasaccompanied by land reform, indigenous people did not get clear title over their land as didthe elite. In areas where the haciendas were not broken up, other groups and organizationsevolved to help people cope with inequitable distribution of assets and limited economicand social opportunity.
Thus, on balance, this study for Bolivia found compelling empirical evidence thatlocal social capital - defined as household membership in local associations -makes asignificant contribution to household welfare, over and above that stemming from humancapital and other household assets.
Policy Implications
Our findings support a policy by governments, non-government organizations and donorsto invest in social capital - either directly or indirectly by creating an environmentfriendly to the emergence of local associations. Our findings also indicate that investmentsin local social capital deserve to be part of poverty alleviation programs since the returns toinvestment in social capital are larger for the poor than for others.
However, policy prescriptions to support social capital formation of the type thatreduces poverty in the context of social polarization have to be nuanced and take intoaccount the local social relations and power structures both in informal and formalorganizations. Not all institutions are equally inclusive or serve the needs of the poor.Institutions are embedded in history, culture and politics. All of these need to beunderstood to avoid the simplistic prescription of 'create local groups'. The creation oflocal associations in the context of Bolivia's ongoing decentralization process also requiresa balanced approach to capacity building of both local government and local associations.There is a danger to overloading task and programs on communities before they havehoned their skills to work effectively in municipal decision making. This is in fact alreadyhappening and will be counter-productive.
Given the radical changes in governance, democracy and laws supportinggrassroots involvement in municipal government, we offer five specific recomrnendationsfor the Bolivian context.
First, the delivery of basic local infrastructure and basic health and educationservices should take into account the social structure and social inequities in designing ofstrategies to create participatory groups and associations. Processes that build inclusivesocial capital (i.e., including the poor and both men and women) at the local level in the
60

delivery of these services will increase the degree of organization of local communities aswell as increase the sustainability of these services. Funds to support these social andinstitutional processes need to be an integral part of project financing in exactly the sameway as financing of physical construction.
Second, the country-wide processes of local participation and municipaldecentralization need to be fine-tuned in recognition of the fact that they depend on locallevel social capital. In this context, the Bolivian government needs to monitor the socialcomposition of vigilance committees and the density, composition and strength of bothsolidarity groups and supra-community linkage groups in local communities. Given thedangers of cooption of the vigilance committees by political parties, this monitoring willhelp refine municipal procedures and perhaps even election procedures. It is alsoimportant that data be gender disaggregated. Several writers have noted that territorialorganizations tend to be dominated by men. In fact, even at the municipal level, as ruralcouncils were given resources, the number of women councilors declined as more menbecame interested in what was perceived to be potentially powerful positions.
Third, as is already being done, technical assistance needs to be provided tograssroots organizations and vigilance committees and people need to be educated aboutthe new laws and their rights. Technical assistance is also needed at the municipal level.Given the scale of the program, NGOs and other external support agencies have a role toplay in technical assistance, both as links to outside resources and in the training of localorganizations to fulfil their mandates without being coopted by the state. However, NGOsmay have their own agenda, which may or may not be best suited for local empowermentstrategies. Cross-linking or supra-community NGOs that stay in the region for a long timehave important roles to play. As is now being done in other countries, local organizationsshould be able to choose their partners from among NGOs where they exist and buyneeded technical assistance as part of grant programs funded through various channels.
Fourth, to transforrn the social capital of the poor from a coping strategy to aproductive strategy will require investments in increasing poor people's access toproductive assets, economic opportunity, education and credit.
Fifth, although groups and associations can be counted, the processes used in thesegroups, including rotation of leadership, leads to the acquisition of new skills andbehaviors and new social connections. The social learning that takes place is probably asimportant as the direct benefits received by members. It is this social characteristic ofgroups that makes social capital different from other forms of capital.
61

ANNEX: MEANS AND STANDARD DEVIATION OF REGRESSION VARIABLES
Total Tiahuanacu Villa Serrano Mizaue CharaguaMean Standard Mean Standard Mean Standard Mean Standard Mean Standard
I Deviation Deviation _ Deviation Deviation DeviationLog (household expenditure per capita) 7.33 0.65 7.30 0.60 7.11 0.63 7.61 0.63 7.29 0.64Asset Ownership Score 0.63 0.50 0.74 0.49 0.52 0.48 0.68 0.54 0.57 0.47Proportion of Poor Households 0.18 0.38 0.16 0.37 0.28 0.45 0.08 0.27 0.19 0.37Collective Action 8.87 13.48 13.27 19.54 7.15 10.97 6.94 8.28 8.16 11.56Increased Savings 0.09 0.29 0.08 0.27 0.12 0.32 0.09 0.28 0.10 0.30Obtained Credit 0.21 0.41 0.19 0.39 0.24 0.43 0.28 0.45 0.16 0.36Community Assistance 0.14 0.35 0.02 0.14 0.16 0.37 0.11 0.32 0.27 0.45
Social Capital IndexMultiplicative index 18.89 17.32 26.46 22.07 21.36 18.65 15.00 10.44 12.75 11.96Additive index 23.56 12.91 27.61 8.95 21.60 13.31 26.85 11.38 18.17 14.90
Social Capital DimensionsMembership in agrarian syndicates 0.63 0.48 0.88 0.33 0.57 0.50 0.90 0.30 0.18 0.38Number of other memberships 0.77 0.91 0.84 0.90 0.95 1.09 0.33 0.63 0.95 0.83Heterogeneity index 56.50 27.34 73.46 16.05 59.33 32.52 50.04 18.65 43.16 28.61Meeting attendance 4.58 5.12 3.68 2.85 4.45 4.56 5.21 4.32 5.00 7.49Index of participation 74.84 35.68 86.37 22.54 63.43 38.70 84.43 28.16 65.13 43.12Index of contribution 3.77 7.62 4.71 7.96 1.38 3.58 4.56 6.95 4.42 10.05ComTnunity orientation 60.45 43.44 72.97 35.87 52.88 43.16 73.30 40.82 42.63 45.36
Household Size 4.98 2.35 4.15 2.34 4.93 2.07 4.82 2.01 6.02 2.54Years of Education 3.90 2.81 3.57 3.15 3.33 2.50 3.67 2.57 5.04 2.66Female Head of Household 0.13 0.34 0.22 0.42 0.08 0.27 0.12 0.33 0.09 0.29Age of Head of Household 45.97 15.03 52.17 16.55 44.42 12.64 43.37 14.87 43.94 14.12Age of Head of Household Squared 2339.0 1530.6 2994.2 1829.9 2131.8 1174.6 2101.0 1478.9 2128.9 1381.6Non-Farmer Household 0.16 0.36 0.16 0.37 0.12 0.32 0.11 0.32 0.24 0.43Land Ownership (hectare) 3.41 11.15 3.46 3.92 3.43 7.33 2.08 2.62 4.66 20.47Animal Ownership (number) 19.47 31.36 21.17 15.68 17.84 24.52 16.05 31.16 22.81 45.81Farm Equipment Ownership (number) 0.46 0.53 0.80 0.42 0.52 0.51 0.46 0.55 0.04 0.30Tiahuanacu 0.25 0.43 1.00 0.00 0.00 0.00 0.00 0.00 0.00 0.00Villa Serrano 0.25 0.43 0.00 0.00 1.00 0.00 0.00 0.00 0.00 0.00Mizque 0.25 0.43 0.00 0.00 0.00 0.00 1.00 0.00 0.00 0.00Charagua 0.25 0.43 0.00 0.00 0.00 0.00 0.00 0.00 1.00 0.00Municipality's Capital City 0.10 0.30 0.10 0.30 0.10 0.30 0.10 0.30 0.10 0.30Castellano 0.40 0.49 0.06 0 23 0.96 0.21 0.02 0.14 0.58 0.49Aymara 0.24 0.42 0.94 0.23 0.00 0.00 0.00 0.00 0.00 0.00Quechua 0.26 0.44 0.00 0.00 0.04 0.21 0.98 0.14 0.00 0.00Guarani 0.11 0.31 0.00 0.00 0.00 0.00 0.00 0.00 0.42 0.49Village Proportion - Non-Castellano 0.60 0.41 0.94 0.09 0.04 0.10 0.98 0.05 0.42 0.22

REFERENCES
Alb6, X. 1994. "Ethnic Violence: The Case of Bolivia." in The Culture of Violence, Tokyo;New York: United Nations University Press.
Albo, X., 1995. "And from Kataristas to MNRistas? The surprising and bold alliancebetween Aymaras and Neoliberals in Bolivia." in Donna Lee Van-Cott (ed.),Indigenous Peoples and Democracy in Latin America, St. Martin's Press in associationwith the Inter-American Dialogue.
Albro, R. 1998. "Introduction: a New Time and Place for Bolivian Popular Politics."Ethnology, 37/2 (Spring '98) p. 99-115.
Bebbington, A. 1998. "Sustaining the Andes? Social Capital and Policies for RuralRegeneration in Bolivia." Mountain Research and Development, 18/2, pp. 173-181.
Birdsall, N., C. Graham, and R. H. Sabot (eds.). 1998. Beyond Tradeoffs: Market Reformsand Equitable Growth in Latin America. Washington, D.C.: Inter-AmericanDevelopment Bank; Brookings Institution Press.
Birdsall, Nancy and Juan Luis Londofno. 1997. "Asset Inequality Matters: An Assessmentof the World Bank's Approach to Poverty Reduction." American Economic Review,87/2, pp. 32-37.
Booth, D., S. Clisby and C. Widmark. 1996. Popular Participation and RuralDemocratisation in Bolivia: Phase I report, Phase 2 report. (first draft), Departmentof Social Anthropology, Stockholm University.
Calderon, F. and J. Dandler (eds.). 1984. Bolivia. Ia fuerza hist6rica del campesinado,UNRISD, CERES, Cochabamba.
Coleman, J. 1988. "Social Capital in the Creation of Human Capital." American Journal ofSociology. 94 (Supplement) S95-S120.
Coleman, J. 1990. Foundations of Social Theory. Cambridge, Mass.: Harvard UniversityPress.
Collier, P. 1998. "The Political Economy of Ethnicity." Paper presented at Annual BankConference on Development Economics, April 2-21, 1998. Washington, DC: WorldBank.
Dasgupta, P. 1988. "Trust as a Commodity." In Gambetta, ed., Trust: Making andBreaking Cooperative Relations. Oxford: Blackwell.
Davidson, R. and J. MacKinnon. 1993. Estimation and Inference in Econometrics. NewYork: Oxford University Press.
63

Easterly, W. and R. Levine. 1995. "Africa's Growth Tragedy: A Retrospective 1960-89".Policy Research Working Paper No. 1503. Washington, DC: World Bank.
Evans, P. 1996. "Government Action, Social Capital and Development: Reviewing theEvidence on Synergy." World Development, 24(6), pp.1 119-1132
Faguet, Jean Paul. 1998. Decentralisation and Local Government Performance. ImprovingPublic service provision in Bolivia. (mimeo), Centre for Economic Performance andDevelopment Studies Institute, London: London School of Economics,
Garcia Arganaras, F. 1992. "Bolivia's Transformist Revolution." Latin AmericanPerspectives, vol. 19 (Spring '92) pp. 44-71.
Graham, C. 1998. Private Markets for Public Goods: Raising the Stakes in EconomicReform. Washington, D.C.: Brookings Institution Press, 380 p.
Grootaert, Christiaan. 1998. Social Capital, Household Welfare and Poverty in Indonesia,Local Level Institutions Study. (draft), Social Development Department,Environmentally and Socially Sustainable Development Network. Washington, DC:World Bank.
Grootaert, Christiaan, Anand Swamy and Gi-Taik Oh. 1999. "Social Capital andDevelopment Outcomes in Burkina Faso." Mimeo, Social Development Department.Washington, DC: World Bank.
Hartmann, Felipe. 1997/98. Land Reform and Social Capital, Their Roles in Social andEconomic Development: A Case Study of Rural Bolivia. MSc Dissertation, LSE:Development Studies Institute.
Healy, K. 1996. "Ethnodevelopment of Indigenous Bolivian Communities: EmergingParadigms." in Alan Kolata (ed.), Tiwanaku and its Hinterland: Archaeology andPaleoecology of an Andean Civilization, Washington; London: SmithsonianInstitution Press. xix, 323 p.
Moe, J. A. 1997. Bolivia's Laws on Popular Participation and AdministrativeDecentralization: Progress and Challenges. (draft) Washington, DC: Inter-AmericanDevelopment Bank.
Narayan, D. 1995. "Designing Community-Based Development," Environment DepartmentPaper No. 7, Washington, DC: World Bank.
Narayan, D. 1999. "Bonds and Bridges: Social Capital and Poverty." Policy ResearchWorking Paper No. 2167, Washington, DC: World Bank.
Narayan, D. and L. Pritchett. 1997. "Cents and Sociability - Household Income and SocialCapital in Rural Tanzania." Policy Research Working Paper No. 1796, Washington,DC: World Bank.
64
O'Neill, K. and G. Malina. 1998. "Social Capital in a Multi-Ethnic Society", paperpresented at the Annual Meeting of the American Political Science Association,Boston, Mass., September 3-6, 1998.
Ostrom, E. 1995. "Incentives, Rules of the Game, and Development." In M. Bruno andB. Pleskovic, eds., Annual Bank Conference on Development Economics 1995.Washington, DC: World Bank.
Pearse, A. 1984. "Campesinado y revoluci6n: el caso de Bolivia", in Calderon and Dandler(1984).
Portes, A., and P, Landolt. 1996. "The Downside of Social Capital." The AmericanProspect. 26 (May-June): 18-21, 94.
Putnam, R. 1995. "Bowling Alone: America's Declining Social Capital." Journal ofDemocracy, 6(1).
Putnam, R. with R. Leonardi and R. Nanetti. 1993. Making Democracy Work: CivicTradition in Modern Italy. Princeton: Princeton University Press.
Rose, R. 1995. "Russia as an Hour-Glass Society: A Constitution without Citizens." EastEuropean Constitutional Review, 4(3).
Sandoval, G., J. Cordova, B. Ascarrunz, A. Balb6a, G. Gonzales and G. Velasques. 1998."Grassroots Organizations and Local Development in Bolivia", Local LevelInstitutions Working Paper Number 4, Washington, DC: World Bank.
Str6bele-Gregor, J. 1994. "From Indio to Mestizo . . . to Indio: New Indianist Movements inBolivia." Latin American Perspectives, 21/2 (Spring '94) pp. 106-123.
Str6bele-Gregor, J. 1996. "Culture and political practice of the Aymara and Quechua inBolivia: autonomous forms of modernity in the Andes." Latin American Perspectives,vol. 23 (Spring '96) pp. 72-90.
Tarrow, S. 1998. Power in Movement: Social Movements and Contentious Politics. SecondEdition. Cambridge: Cambridge University Press.
Tilly, C. 1998. Durable Inequality. Berkeley: University of California Press.
Tuchschneider, David. 1998. Decentralization and Rural Development in Bolivia: In Searchof a Model. (mimeo).
Uphoff, N. 1992. Learningfrom Gal Oya -Possibilities for Participatory Development andPost-Newtonian Social Science. Ithaca: Cornell University Press.
Woolcock, M. 1998. "Social Capital and Economic Development: Toward a TheoreticalSynthesis and Policy Framework." Theory and Society, 27(2), pp. 151-208.
65

World Bank. 1996. Bolivia, Poverty, Equity, and Income: Selected Policies for ExpandingEarning Opportunities for the Poor, Vol. 1. No. 15272-BO, LAC, Washington, DC:World Bank.
World Bank. 1998. "The Local Level Institutions Study: Program Description andPrototype Questionnaires." Local Level Institutions Working Paper No. 2, SocialDevelopment Department, Washington, DC: World Bank.
World Bank. 1999. World Development Report - Knowledge for Development, New York:Oxford University Press.
66

Policy Research Working Paper Series
ContactTitle Author Date for paper
WPS2628 Monopoly Power and Distribution in Hanan G. Jacoby June 2001 P. KokilaFragmented Markets: The Case of Rinku Murgai 33716Groundwater Saeed Ur Rehman
WPS2629 Bridging the Digital Divide: How George R. G. Clarke July 2001 P. Sintim-AboagyeEnterprise Ownership and Foreign 37644Competition Affect Internet Accessin Eastern Europe and Central Asia
WPS2630 Parallel Imports of Pharmaceutical Mattias Ganslandt July 2001 L.TabadaProducts in the European Union 36896
WPS2631 Pension Reform in Hungary: Roberta Rocha July 2001 L. GrossA Preliminary Assessment Dimitri Vittas 37030
WPS2632 Human Capital and Growth: The Sebastien Dessus July 2001 K. MazoRecovered Role of Education Systems 39744
WPS2633 Bank Privatization in Argentina: George R. G. Clarke July 2001 P. Sintim-AboagyeA Model of Political Constraints and Robert Cull 37644Differential Outcomes
WPS2634 Chile's Regional Arrangements and Glenn W. Harrison July 2001 L. Tabadathe Free Trade Agreement of the Thomas F. Rutherford 36896Americas: The Importance of Market David G. TarrAccess
WPS2635 Optimal Use of Carbon Sequestration Franck Lecocq July 2001 V. Soukhanovin a Global Climate Change Strategy: Kenneth Chomitz 35721Is There a Wooden Bridge to a CleanEnergy Future?
WPS2636 Processes, Information, and Javier Campos-Mendez July 2001 G. Chenet-SmithAccounting Gaps in the Regulation Antonio Estache 36370of Argentina's Private Railways Lourdes Trujillo
WPS2637 Technical Efficiency Gains from Antonio Estache July 2001 G. Chenet-SmithPort Reform: The Potential for Marianela Gonzalez 36370Yardstick Competition in Mexico Lourdes Trujillo
WPS2638 On Financing Global and International Todd Sandler July 2001 S. KpundehPublic Goods
WPS2639 Public Policy toward Nongovernmental William Jack July 2001 H. SladovichOrganizations in Developing Countries 37698
WPS2640 Where Has All the Foreign Investment Harry G. Broadman July 2001 S. CraigGone in Russia? Francesca Recanatini 33160
Policy Research Working Paper Series
ContactTitle Author Date for paper
WPS2641 Is Russia Restructuring? New Harry G. Broadman July 2001 S. CraigEvidence on Job Creation and Francesca Recanatini 33160Destruction
WPS2642 Does the Exchange Rate Regime liker Domag July 2001 A. CarcaniAffect Macroeconomic Performance? Kyles Peters 3024~Evidence from Transition Economies Yevgeny Yuzefovich
WPS2643 Dollarization and Semi-Dollarization in Paul Beckerman July 2001 P. HoltEcuador 37707'