Embed Size (px)
Citation preview

Official
Wandsworth Local Housing Needs Assessment
Wandsworth Council
December 2020
Prepared by
GL Hearn
65 Gresham Street
London EC2V 7NQ
T +44 (0)20 7851 4900
glhearn.com

Wandsworth Local Housing Needs Assessment, December 2020
GL Hearn Page 2 of 176
Wandsworth Housing Needs Assessment
Official
Contents
Section Page
1 EXECUTIVE SUMMARY 10
2 INTRODUCTION 15
3 POLICY REVIEW 16
4 HOUSING MARKET AREA 20
5 HOUSING PROFILE 24
6 LOCAL HOUSING NEED 34
7 DEMOGRAPHICS 41
8 AFFORDABLE HOUSING NEED 47
9 PRIVATE RENTED SECTOR 76
10 HOUSING MIX 95
11 HOUSING NEEDS OF SPECIFIC GROUPS 127
12 CONCLUSIONS AND RECOMMENDATIONS 161
Appendices
APPENDIX A: HOUSING NEEDS ASSESSMENT GLOSSARY 167

Wandsworth Local Housing Needs Assessment, December 2020
GL Hearn Page 3 of 176
Wandsworth Housing Needs Assessment
Official
LIST OF FIGURES
FIGURE 1: TYPE OF DWELLINGS IN LBW, LONDON AND ENGLAND (2011) 25
FIGURE 2: NUMBER OF BEDROOMS IN LBW, LONDON AND ENGLAND (2011) 26
FIGURE 3: HOUSEHOLDS BY TENURE IN LBW, LONDON AND ENGLAND (2011) 27
FIGURE 4: OVER-CROWDING AND UNDER-OCCUPATION (2011) 28
FIGURE 5: MARKET DWELLING COMPLETIONS (2013 – 2018) 29
FIGURE 6: COMPLETIONS BY DWELLING SIZE (2013– 2018) 30
FIGURE 7: AFFORDABLE COMPLETIONS BETWEEN 2011/12 AND 2018/19 31
FIGURE 8: AFFORDABLE COMPLETIONS BY DWELLING SIZE (2011/12-2018/19) 31
FIGURE 9: LBW POPULATION GROWTH 2011-2018 37
FIGURE 10: WANDSWORTH COMPONENTS OF CHANGE, 2001 TO 2018 41
FIGURE 11: PROJECTED HOUSEHOLD REPRESENTATIVE RATES BY AGE OF HEAD OF
HOUSEHOLD 43
FIGURE 12: DISTRIBUTION OF HOUSEHOLD INCOME IN LBW (MID-2018 ESTIMATED) 51
FIGURE 13: HOUSING AFFORDABILITY BY TENURE 62
FIGURE 14: ESSENTIAL LOCAL WORKERS, HOUSING AFFORDABILITY 65
FIGURE 15: DISTRIBUTION OF HOUSEHOLD INCOME (MID-2018 ESTIMATE 69
FIGURE 16: INCOME REQUIRED FOR DIFFERENT AFFORDABLE HOUSING TENURES 70
FIGURE 17: COST OF HOUSING VERSUS INCOMES 72
FIGURE 18: TRENDS IN TENURE, 1980 TO 2015-16 – ENGLAND 78
FIGURE 19: DISTRIBUTION OF PRS IN WANDSWORTH (LSOA LEVEL) 79
FIGURE 20: DISTRIBUTION OF HOUSING BENEFIT CLAIMANTS IN WANDSWORTH
(LSOA LEVEL) 80
FIGURE 21: DISTRIBUTION OF HMOS IN WANDSWORTH (LSOA LEVEL) 82
FIGURE 22: TENURE BY AGE OF HOUSEHOLD IN LBW (2011) 85
FIGURE 23: HOUSEHOLD COMPOSITION BY TENURE TYPE IN LBW (2011) 87
FIGURE 24: ACCOMMODATION TYPE BY TENURE (HOUSEHOLDS) – LBW (2011) 88
FIGURE 25: ACCOMMODATION SIZE BY TENURE (HOUSEHOLDS) – LBW (2011) 89

Wandsworth Local Housing Needs Assessment, December 2020
GL Hearn Page 4 of 176
Wandsworth Housing Needs Assessment
Official
FIGURE 26: PROFILE OF PRS BY ECONOMIC ACTIVITY 90
FIGURE 27: MEDIAN PRIVATE SECTOR RENT (PER MONTH) (2014 - 2019) 91
FIGURE 28: CHANGE IN MEDIAN RENTAL VALUES AND HOUSE PRICES (2014-19) 92
FIGURE 29: AVERAGE BEDROOM BY AGE AND TENURE IN LBW 96
FIGURE 30: OCCUPANCY RATE OF OLDER PERSON HOUSEHOLDS 102
FIGURE 31: FINAL MODELLED MIX OF HOUSING BY SIZE AND TENURE IN LBW 105
FIGURE 32: STUDENT NUMBERS BY TYPE, 2011/12 – 2017/17, ROEHAMPTON
UNIVERSITY 146
FIGURE 33: STUDENT NUMBERS BY TYPE, 2011/12 – 2017/17, ST. GEORGE’S
UNIVERSITY 147
FIGURE 34: 148
FIGURE 35: PROFILE OF BY AGE AND HOUSEHOLD TYPE IN LBW, 2011 149
FIGURE 36: STUDENT HOUSING ARRANGEMENTS 152
FIGURE 37: STUDENT HOUSING ARRANGEMENTS 154
FIGURE 38: GROWTH IN AIRBNB ACTIVITY, 2014 TO 2019 (INDEXED TO 2014) 158
FIGURE 39: NUMBER OF PRIVATE ROOMS LISTED WITH AIRBNB 2014 TO 2019
(INDEXED TO 2014) 158
LIST OF TABLES
KEY GOVERNMENT HOUSING REFORMS 18
COMMUTING PATTERNS IN AND OUT OF LBW 21
MIGRATION IN AND OUT OF WANDSWORTH LBW (2018) 22
CHANGE IN HOUSEHOLD TENURE IN LBW, LONDON AND ENGLAND (2001-
2011) 27
CHANGE IN POPULATION – 2014 AND 2016 BASED SNPP 38
PROJECTED POPULATION CHANGE IN WANDSWORTH (2019-2037) 45
LOWER QUARTILE COST OF HOUSING TO BUY BY SIZE (MARCH 2019) 48
SUGGESTED INCOME THRESHOLD FOR DIFFERENT LEVELS OF HOUSING
COST 50

Wandsworth Local Housing Needs Assessment, December 2020
GL Hearn Page 5 of 176
Wandsworth Housing Needs Assessment
Official
SOURCES FOR ASSESSING THE CURRENT UNMET NEED FOR
AFFORDABLE HOUSING 52
ESTIMATED NUMBER OF HOUSEHOLDS LIVING IN UNSUITABLE HOUSING
52
ESTIMATED CURRENT AFFORDABLE HOUSING NEED FOR LBW 53
ESTIMATED AFFORDABLE HOUSING NEED FROM NEWLY FORMING
HOUSEHOLDS (PER ANNUM) 54
PAST SOCIAL/AFFORDABLE RENTED HOUSING RE-LET SUPPLY (PER
ANNUM) (2015/16-2017/18) 55
ESTIMATED NEED FOR AFFORDABLE HOUSING IN LBW 56
RENTS FOR SOCIAL RENTED DWELLINGS 57
LIVING RENTS (PER MONTH) (2018 BASE) 58
MAXIMUM LOCAL HOUSING ALLOWANCE (HOUSING BENEFIT) BY
LOCATION AND PROPERTY SIZE (APRIL 2018) 58
ESTIMATED LEVEL OF NEED FOR AFFORDABLE HOME OWNERSHIP (PER
ANNUM) 60
ESSENTIAL LOCAL WORKERS, PAY AND AFFORDABILITY OF ENTRY-
LEVEL PROPERTIES 64
AFFORDABLE HOME OWNERSHIP PRICES (2018 BASE) 66
ESTIMATE AFFORDABLE EQUITY SHARE BY SIZE OF DWELLING 67
CHANGE IN TENURE THOSE AGED UNDER 35 IN LBW (2001-2011) 86
MEDIAN PRIVATE SECTOR RENT (PER MONTH) 2012 AND 2019 – LBW 91
BUILD-TO-RENT ACTIVITY IN LBW 93
NUMBER OF BEDROOMS BY TENURE (LBW, LONDON AND ENGLAND) 98
PROJECTED CHANGE IN HOUSEHOLDS BY AGE OF HOUSEHOLD
REFERENCE PERSON IN LBW 99
CHANGE IN HOUSEHOLD TYPES 2019-37 IN LBW 100
OCCUPANCY RATING AND NUMBER OF BEDROOMS (OWNER-OCCUPIED
SECTOR) 101
OCCUPANCY RATING FOR KEY TENURES, LONDON AND WANDSWORTH
106
ENTRIES ON THE HOME OWNERSHIP LIST BY NUMBER OF BEDROOMS 108

Wandsworth Local Housing Needs Assessment, December 2020
GL Hearn Page 6 of 176
Wandsworth Housing Needs Assessment
Official
ENTRIES ON THE HOME OWNERSHIP LIST BY NUMBER OF BEDROOMS
(PRE 2014) 108
WARD LEVEL INDICATORS 111
NET UPLIFT IN DIFFERENT SIZES OF HOME BY TENURE (BALHAM WARD)
2011-19 112
NET UPLIFT IN DIFFERENT SIZES OF HOME BY TENURE (BEDFORD WARD)
2011-19 113
NET UPLIFT IN DIFFERENT SIZES OF HOME BY TENURE (EARLSFIELD
WARD) 2011-19 113
NET UPLIFT IN DIFFERENT SIZES OF HOME BY TENURE (EAST PUTNEY
WARD) 2011-19 114
NET UPLIFT IN DIFFERENT SIZES OF HOME BY TENURE (EAST PUTNEY
WARD) 2011-19 114
NET UPLIFT IN DIFFERENT SIZES OF HOME BY TENURE (FURZEDOWN
WARD) 2011-19 115
NET UPLIFT IN DIFFERENT SIZES OF HOME BY TENURE (GRAVENEY
WARD) 2011-19 116
NET UPLIFT IN DIFFERENT SIZES OF HOME BY TENURE (LATCHMERE
WARD) 2011-19 117
NET UPLIFT IN DIFFERENT SIZES OF HOME BY TENURE (LATCHMERE
WARD) 2011-19 117
NET UPLIFT IN DIFFERENT SIZES OF HOME BY TENURE (NORTHCOTE
WARD) 2011-19 118
NET UPLIFT IN DIFFERENT SIZES OF HOME BY TENURE (QUEENSTOWN
WARD) 2011-19 118
NET UPLIFT IN DIFFERENT SIZES OF HOME BY TENURE (QUEENSTOWN
WARD) 2011-19 119
NET UPLIFT IN DIFFERENT SIZES OF HOME BY TENURE (ST. MARY’S
WARD) 2011-19 120
NET UPLIFT IN DIFFERENT SIZES OF HOME BY TENURE (SHAFTESBURY
WARD) 2011-19 120
NET UPLIFT IN DIFFERENT SIZES OF HOME BY TENURE (SOUTHFIELDS
WARD) 2011-19 121
NET UPLIFT IN DIFFERENT SIZES OF HOME BY TENURE (THAMESFIELD
WARD) 2011-19 121

Wandsworth Local Housing Needs Assessment, December 2020
GL Hearn Page 7 of 176
Wandsworth Housing Needs Assessment
Official
NET UPLIFT IN DIFFERENT SIZES OF HOME BY TENURE (TOOTING WARD)
2011-19 122
NET UPLIFT IN DIFFERENT SIZES OF HOME BY TENURE (WANDSWORTH
COMMON WARD) 2011-19 122
NET UPLIFT IN DIFFERENT SIZES OF HOME BY TENURE (WEST HILL WARD)
2011-19 123
NET UPLIFT IN DIFFERENT SIZES OF HOME BY TENURE (WEST PUTNEY
WARD) 2011-19 124
SIZE AND TENURE MIX (LBW) 2037 124
OLDER PERSONS POPULATION (2018) 129
PROJECTED CHANGE IN POPULATION OF OLDER PERSONS, 2019 TO 2036
(‘000S) 129
PROJECTED CHANGE IN HOUSEHOLDS BY AGE OF HOUSEHOLD
REFERENCE PERSON 130
OLDER PERSONS’ DWELLING AND CARE BEDSPACE REQUIREMENTS TO
2037 132
OLDER PERSONS’ DWELLING AND CARE BEDSPACE REQUIREMENTS TO
2037 (PERCENTAGE UPLIFT) 133
CHANGE IN HOUSEHOLDS IN 65-74 AGE COHORT IN LBW 2019-2037 134
TENURE OF HOUSEHOLDS WITH HRR AGE 65-74 134
GROWTH THOSE AGED 65-74 OCCUPYING DIFFERENT TENURES TO 2037
135
RESIDENTS AGED 50-64 AND 65+ WHOSE ACTIVITIES ARE LIMITED BY
DISABILITY BY TENURE 135
RESIDENTS AGED 65-74 WHOSE ACTIVITIES ARE LIMITED BY DISABILITY
BY TENURE 136
DEGREE OF ADAPTATIONS REQUIRED TO GENERAL HOUSING TO ENABLE
THOSE AGED 65-74 TO REMAIN IN THEIR OWN HOMES 136
SPECIALIST HOUSING FOR OLDER PEOPLE, PROVISION ON NEW AND RE-
DEVELOPED SITES 2011-19 (LBW) 139
TENURE OF HOUSEHOLDS WITH HRR AGE 16-64 141
PROJECTED CHANGE IN HOUSEHOLDS BY AGE OF HOUSEHOLD
REFERENCE PERSON– LBW (SELECTED AGE GROUPS) 142
GROWTH IN THE NUMBER OF PERSONS IN SELECTED AGE GROUPS
OCCUPYING DIFFERENT TENURES IN LBW 142

Wandsworth Local Housing Needs Assessment, December 2020
GL Hearn Page 8 of 176
Wandsworth Housing Needs Assessment
Official
RESIDENTS IN WANDSWORTH OF SELECTED AGE GROUPS WHOSE
ACTIVITIES ARE LIMITED BY DISABILITY 142
THE NEED FOR SPECIALIST HOUSING FOR DISABLED PEOPLE IN LBW BY
TENURE 2019-37 143
PROJECTED CHANGES TO POPULATION WITH A RANGE OF DISABILITIES
– WANDSWORTH 144
PROFILE OF STUDENTS BY AGE AND HOUSEHOLD TYPE IN LBW, 2011 149
CHANGES IN STUDENTS BY DIFFERENT ACCOMMODATION TYPES, 2001-11
150
STUDENT AGE STRUCTURE 2001-11, LBW 151
GROWTH IN STUDENT NUMBERS, 2019/20 - 2024/5 152
GROWTH IN STUDENT NUMBERS, 2019/20 - 2024/5 153
Wandsworth Local Housing Needs Assessment, December 2020
GL Hearn Page 9 of 176
Wandsworth LHNA
Official
Quality Standards Control
The signatories below verify that this document has been prepared in accordance with our quality
control requirements. These procedures do not affect the content and views expressed by the
originator.
This document must only be treated as a draft unless it is has been signed by the Originators and
approved by a Business or Associate Director.
DATE ORIGINATORS APPROVED
August 2020 Ivan Tennant Paul McColgan
Associate Director
Laura Carver
Graduate Planner
Limitations
This document has been prepared for the stated objective and should not be used for any other
purpose without the prior written authority of GL Hearn; we accept no responsibility or liability for
the consequences of this document being used for a purpose other than for which it was
commissioned.

Wandsworth Local Housing Needs Assessment, December 2020
GL Hearn Page 10 of 176
Wandsworth LHNA
Official
1 EXECUTIVE SUMMARY
Housing Market Area
1.1 The analysis demonstrates that LBW forms part of London’s wider housing market area and has strong
on-going relationships with the Boroughs that make up the South West Sub-Regional housing market.
Housing Profile
1.2 Of the 13,105 dwellings completed in Wandsworth since 2013, around 74% of dwellings have been one
and two bedroom homes (c 9,700); this suggests the market is responding to demand from smaller
households (singles and couples) and those with a lower or average household income to buy or rent.
1.3 The balance of smaller homes is forecast to increase in the future with 81% of dwellings in the
development pipeline having 2 bedrooms or fewer.
1.4 The pipeline also indicated 16% of new dwellings will be 3-bedrooms.
Local Housing Need Figure
1.5 LBW should arrive at a Local Housing Needs Figure based on the Standard Method. The stepped
approach set out in PPG results in a figure of 2,537 or 45,666 between 2019 and 2037.
1.6 The current draft of the London Plan sets a ten year housing target of 19,500, or 1,950 dwellings per
annum.
Demographic Change
1.7 The components of change in the population in LBW shows that population growth is driven by natural
growth (more births than deaths). However, the positive natural change is offset by the negative levels of
internal migration from the Borough.
1.8 Based on demographic projections, by 2037 those aged 65-69 are forecast to increase by 5,290 people;
those aged 75-79 by 3,341 people, and those aged 85 and over increasing by 2,988 people.
1.9 Currently, those aged 20-64 (the age groups most likely to be active in the labour market) number 227,277
people. This group is forecast to expand by 44,872 individuals by 2037, an increase of around 20%.

Wandsworth Local Housing Needs Assessment, December 2020
GL Hearn Page 11 of 176
Wandsworth LHNA
Official
Affordable Housing Need
1.10 The affordable housing model generates a total net need of 3,575 dwellings per annum. This is broken
down to 2,327 affordable rented dwellings per annum and 1,248 Affordable Home Ownership (AHO) units
per annum between 2019 and 2037.
1.11 The overall need for affordable homes exceeds the borough’s housing target set out in the draft London
Plan. Such circumstances are recognised by the national policy, which requires the Council to set
affordable housing targets that are realistic. An important exercise is therefore to identify those in priority
need.
Size Mix
1.12 Based on demographic trends, the size mix of new market housing provision should be biased towards
1-and 2-bedroom properties. The size mix of new affordable housing should also be focused on smaller
properties, reflecting the preferences of households on the Wandsworth’s Housing Register.
1.13 Based on the evidence gathered, this LHNA results in the following recommended mix of homes:
Studio 1-Bed 2-Bed 3-Bed 4+ Bed
Market 0-5% 30-40% 30-40% 15-25% 5-10%
Affordable home ownership 0% 35-40% 40-45% 15-20% 5-10%
Affordable housing (rented) 0% 40-45% 30-35% 20-25% 5-10%
1.14 It is however important to emphasise that the analysis was undertaken prior to the COVID-19 pandemic,
and therefore does not necessarily reflect potential changes in relation to out-migration and how this may
affect the type and size of home needed. Therefore, there is a need for the authority to maintain flexibility
in its approach to the provision of market housing in order to be able to be responsive to changing
circumstances.
Older and disabled persons’ housing need
Specialist Accommodation
1.15 Demographic forecasts indicate that the number of households aged 75+ across Borough is projected to
increase by 58% by 2037 based on 2,537 dwellings per annum.
1.16 The report estimates an additional need for 1,453 specialist dwellings for older people by 2037. These
dwellings will contribute to the fulfilment of LBW’s overall housing needs figure.

Wandsworth Local Housing Needs Assessment, December 2020
GL Hearn Page 12 of 176
Wandsworth LHNA
Official
1.17 LBW has produced an analysis that sets out their assessment of the need for additional affordable housing
for older people by 2035. The estimated need for affordable extra-care accommodation is estimated to
be between 50 and 150 dwellings, and for nursing care bed-spaces between 190 and 210 spaces.
Pre-Retirement
1.18 An estimated 664 people aged 65-74 with more serious disabilities are likely to require extensive
adaptations to their homes by 2037 to enable them to remain in their home and enjoy an acceptable
standard of living.
16-64
1.19 For those aged between 16 and 64, we estimate that 1,689 dwellings should be prioritised for adaptation
to meet the needs of people with a serious disability.
Wheelchair users
1.20 Across all age groups, a need is identified for 76 wheelchair adapted homes per year, or 1,258 by 2037.
This need will form a subset of identified need for specialist homes and home adaptations for the 75+,
65-75 and 16-64 age groups.
1.21 Decisions about the appropriate mix of specialist housing for older and disabled people should take
account of the current stock, other local needs evidence as appropriate, and policies regarding
accommodation and care for older persons.
PRS
1.22 In 2011, the Census recorded that the private rented sector (PRS) accounted for around 30% of all
households in Wandsworth (41,317 households), 5% higher than the London average of 25%, and notably
higher than national rate (16%). The number of households in this sector has grown substantially
(increasing by 65% in the 2001-11 period).
1.23 The LHNA does not estimate the need for additional private rented housing. It is likely that the decision
of households as to whether to buy or rent a home in the open market is dependent on a number of factors
which mean that demand can fluctuate over time.
1.24 There is a case for Build to Rent (BtR) development in the Borough, as opposed to traditional private
rented housing, on the basis of the expansion of households in the PRS, and demographic trends that
support affordable market dwellings of 1 and 2 bedrooms.
Wandsworth Local Housing Needs Assessment, December 2020
GL Hearn Page 13 of 176
Wandsworth LHNA
Official
Custom and Self Build
1.25 As of the 1st of December 2019 Wandsworth has 17 entrants on the Council’s self-build register in total.
Given that the Council has granted planning permission for 64 CIL exempt dwellings since the start of the
plan period, no further provision is required to sought in policy.
Short-term Lets
1.26 The current level of activity identified in this study does not pose a significant threat to residents seeking
properties to rent in Wandsworth.
1.27 The sharp upward trend in activity observed during 2019 is a cause for concern however, and this should
be monitored moving forward.
Policy recommendations
1.28 The Council should consider its objectively assessed need for housing to be 2,537 dwellings per annum
and seek to meet this as much as possible, subject to sufficient supply of deliverable sites being identified.
1.29 Given the substantial need for affordable housing, LBW should seek to provide as much possible, subject
to viability constraints. We note that BtR development is on-going in the Borough and this may prove
generate an additional stream of affordable units in addition to those secured on for-sale schemes.
1.30 The affordable housing policy should seek to strike a balance between low-cost rented and intermediate
tenures. Whilst there is a significant need for low-cost rented housing, the tenure mix should also meet
the needs of those working households on low to middle incomes who would neither have priority for
social housing nor be able to afford most forms of market housing.
1.31 The approach to affordable housing should take into account forecast demographic trends to offer a route
to suitable accommodation to a range of households in order to maintain mixed and balanced
communities. The analysis indicates that LBW should allocate up to 50 per cent (20 percentage points)
of the discretionary affordable housing target to intermediate tenures as long as future policies prioritise
London Living Rent over Affordable Rent dwellings at 80% market discount.
1.32 The guidance set out in this LHNA regarding size mix provides the basis for a monitoring mechanism to
ensure that future market delivery is not unbalanced when compared with the likely requirement as driven
by the demographic change in the area.

Wandsworth Local Housing Needs Assessment, December 2020
GL Hearn Page 14 of 176
Wandsworth LHNA
Official
1.33 The Council should give consideration to how best to deliver the identified specialist housing need,
including, for instance, the potential to identify sites in accessible locations for specialist housing (transport
hubs and near town centres) or to require provision of specialist housing for older people as part of larger
strategic development schemes or master-planning sites.
1.34 A very substantial proportion of the need for supported housing among older and disabled residents may
take the form of adaptation to their current home. Policy to actively support such measures even among
those currently with light disabilities will safeguard resources by limiting the provision of specialist
accommodation for those in need and reducing demand in future years by delaying the onset of severe
illness or disability.

Wandsworth Local Housing Needs Assessment, December 2020
GL Hearn Page 15 of 176
Wandsworth LHNA
Official
2 INTRODUCTION
2.1 The London Borough of Wandsworth (LBW) is currently undertaking a review of its local policies, evidence
base and site allocations to ensure they are still relevant and achieving the outcomes desired and that
they are in compliance with the National Planning Policy Framework (NPPF).
2.2 In order to support this review, the Council have appointed GL Hearn to prepare a Local Housing Needs
Assessment (LHNA) to identify the scale and nature of local housing demand by 2037. The LHNA forms
the principle evidence base for housing policies to be contained within LBW's emerging Local Plan.
2.3 In particular, the LHNA will be used by the Council to:
• inform Wandsworth’s housing requirement within the emerging Local Plan;
• determine the need for affordable housing1 for Wandsworth;
• determine the need for specialist forms of housing including sheltered, extra care and supported
housing2; and
• inform wider housing policy in the emerging Local Plan.
1 See Glossary 2 See Glossary

Wandsworth Local Housing Needs Assessment, December 2020
GL Hearn Page 16 of 176
Wandsworth LHNA
Official
3 POLICY REVIEW
National Planning Policy Framework and Guidance
3.1 This LHNA responds to and is compliant with the requirements of the Revised National Planning Policy
Framework3 (the NPPF2); in approach and structure it follows the Revised Planning Practice Guidance4
(PPG), in particular the paragraphs that address ‘housing and economic needs assessments’5.
NPPF
3.2 The Ministry of Housing, Communities and Local Government (MHCLG) published a revised National
Planning Policy Framework (NPPF) in July 2018 with minor updates in February 2019. This updated and
replaced the March 2012 version.
3.3 NPPF (2019) states that the minimum number of homes Local Planning Authorities (LPAs) should plan
for in the development of their Local Plans should derived from the standard method.6
Planning Practice Guidance
3.4 Guidance on ‘housing and economic needs assessments’ deals with how LPAs should arrive at the
minimum level of housing need for their area. It provides a framework against which evidence-based
studies, such as this, are assessed at local planning examinations and planning appeals, and thus the
methodology that needs to be followed.
3.5 The PPG methodology was updated in July and September 2018 and again in February 2019 and is
available online. 7 It is framed by the Government’s objective to significantly boost housing supply,
underpinning the government’s target of 300,000dpa by the mid-2020s.
3.6 Critically, LPAs should set aside the latest (2016-based) household projections produced by the Office
for National Statistics (ONS), instead reverting to the 2014-based figures when using the standard
method.8
3.7 It is clear that while the OAN derived from the standard methodology is a minimum, there is ample scope
(indeed, it is encouraged) for local authorities to provide housing in excess of this.9
3https://assets.publishing.service.gov.uk/government/uploads/system/uploads/attachment_data/file/728643/Revised_NPPF_2018.pdf 4https://assets.publishing.service.gov.uk/government/uploads/system/uploads/attachment_data/file/687239/Draft_planning_practice_guidance.pdf 5https://www.gov.uk/guidance/housing-and-economic-development-needs-assessments 6 NPPF, para 60 7https://www.gov.uk/guidance/housing-and-economic-development-needs-assessments 8 PPG, Paragraph: 015 Reference ID: 2a-015-20190220 9 PPG, Paragraph: 010 Reference ID: 2a-010-20190220

Wandsworth Local Housing Needs Assessment, December 2020
GL Hearn Page 17 of 176
Wandsworth LHNA
Official
Draft London Plan
3.8 Within London, there is a two-tier planning system with housing targets set centrally by the Mayor. The
“Intend to Publish” draft of the London Plan sets out a need to deliver 19,500 additional homes (1,950 per
annum) between 2019/20 and 2028/29 in LBW and has been informed by the 2017 London SHLAA. The
target reflects the potential capacity of large and small housing sites and considers the character and
context of the borough. The figure constitutes an approximately 8% increase from the previous LBW
target of 1,812 dwellings per annum.
Unconstrained Need
3.9 While this LHNA arrives at a minimum number of homes to be delivered over the plan period, it is
important to note it is unconstrained.
3.10 National Policy (NPPF2 and PPG) and the Draft London Plan provide important inputs into setting targets
for housing provision, but plan-making should also take into account factors such as the supply of land
for new development, local infrastructure capacity, open spaces and environmental constraints.
3.11 These factors may limit the amount of development which can be sustainably accommodated. It should
also be noted that the SHMA does not set housing targets. It provides an assessment of the need for
housing, making no judgements regarding future policy decisions which the Borough may take. Housing
targets will be set through the local plan.
Wider Government Reforms
3.12 There are a number of wider current housing policy issues and proposed reforms which will affect demand
and supply of housing. Some of these have already come in to force while others are still being proposed.
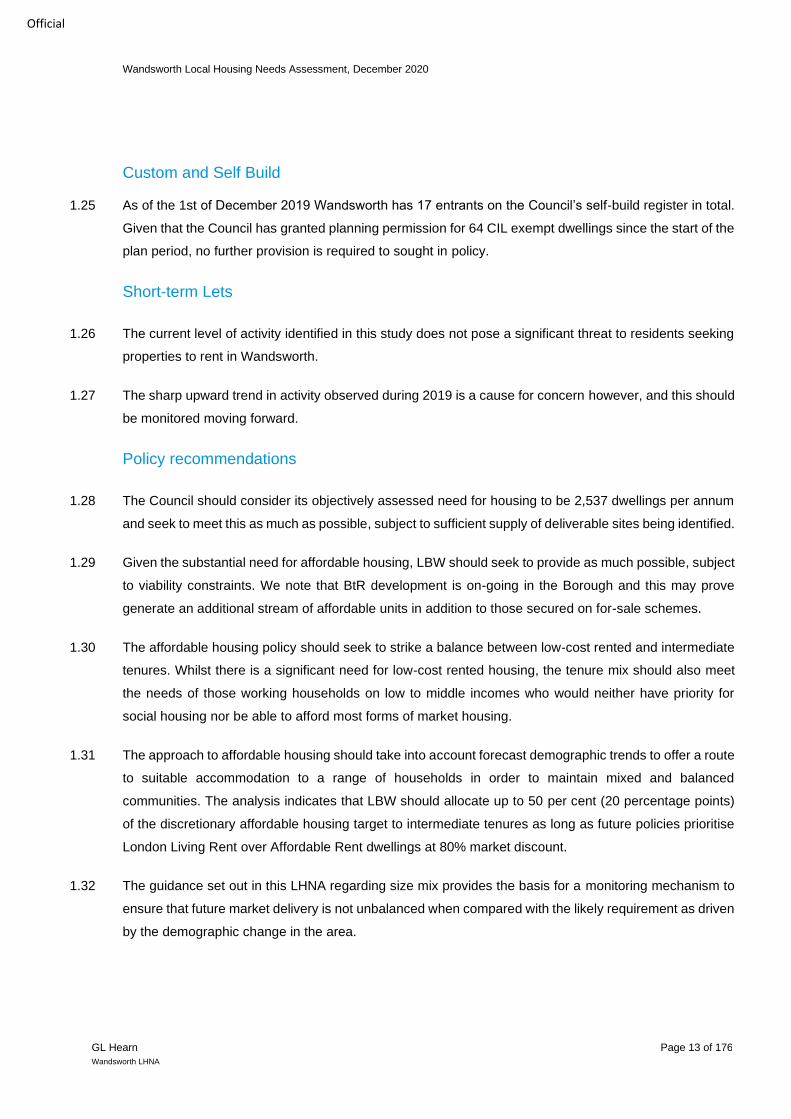
Amongst these are the changes set out in the table overleaf from the Housing Green Paper among others:
Wandsworth Local Housing Needs Assessment, December 2020
GL Hearn Page 18 of 176
Wandsworth LHNA
Official
Key Government Housing Reforms
Policy Reform Details
Scraping the sale of
vacant social housing
This proposal would stop local authorities having to sell off affordable
housing stock of a higher value once it becomes vacant.
Councils to be given
new flexibilities to
spend the money
raised from right to
buy sales on new
homes
The proposals include holding receipts for up to five years or giving them to
a housing company owed by the Council. The proposals are also
consulting on the removal or increase the cap on spending on replacement
units and/or allow them to buy additional stock or to replace the affordable
stock with shared ownership.
Scraping the planned
requirement for a fixed
tenancy
Local authorities will still be able to use fixed-term tenancies for social and
affordable rents at their discretion.
Government to make
deals with housing
associations to
provide certainty of
funding
This is intended to address the intermittent nature of the government’s
current approach to allocating funding for five years at a time.
Lowering the
household benefit
cap threshold
The Welfare Reform and Work Act 2016 will lower the household benefit
cap threshold from £26,000 for a family and £18,200 for a single person, to
£23,000 in London (£15,410 for a single person). There will also be a four-
year benefits freeze.
Social Housing Rent
Reductions
As part of the Summer Budget 2015, the Chancellor announced that rents
in social housing would be reduced by 1% a year for four years resulting in
a 12% reduction in average rents by 2020-21.
Extension of Right-to-
Buy to Housing
Association Tenants
As set out above, the Housing & Planning Bill includes proposals for the
voluntary extension of Right-to-Buy by Housing Associations to their
tenants.
While the secondary legislation required to affect this change is not been
enacted, this could reduce affordable housing stock and reduce the
number of re-lets. Research by Joseph Rowntree Foundation10 predicts
that nationally 8.3% of housing association tenants will be eligible for and
could afford the RTB and that 71% of those will purchase their home over
the first five years.
10 Understanding the likely poverty impacts of the extension of Right to Buy on housing association tenants. JRF 21st November 2015.
Wandsworth Local Housing Needs Assessment, December 2020
GL Hearn Page 19 of 176
Wandsworth LHNA
Official
Policy Reform Details
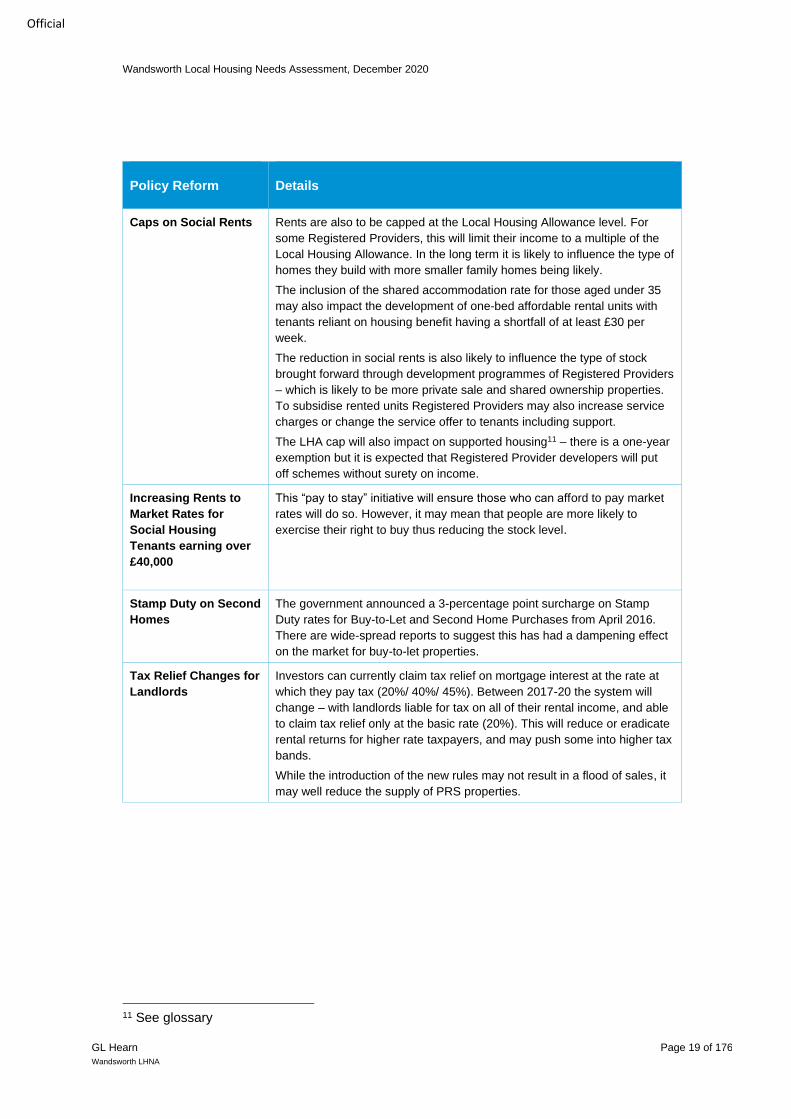
Caps on Social Rents Rents are also to be capped at the Local Housing Allowance level. For
some Registered Providers, this will limit their income to a multiple of the
Local Housing Allowance. In the long term it is likely to influence the type of
homes they build with more smaller family homes being likely.
The inclusion of the shared accommodation rate for those aged under 35
may also impact the development of one-bed affordable rental units with
tenants reliant on housing benefit having a shortfall of at least £30 per
week.
The reduction in social rents is also likely to influence the type of stock
brought forward through development programmes of Registered Providers
– which is likely to be more private sale and shared ownership properties.
To subsidise rented units Registered Providers may also increase service
charges or change the service offer to tenants including support.
The LHA cap will also impact on supported housing11 – there is a one-year
exemption but it is expected that Registered Provider developers will put
off schemes without surety on income.
Increasing Rents to
Market Rates for
Social Housing
Tenants earning over
£40,000
This “pay to stay” initiative will ensure those who can afford to pay market
rates will do so. However, it may mean that people are more likely to
exercise their right to buy thus reducing the stock level.
Stamp Duty on Second
Homes
The government announced a 3-percentage point surcharge on Stamp
Duty rates for Buy-to-Let and Second Home Purchases from April 2016.
There are wide-spread reports to suggest this has had a dampening effect
on the market for buy-to-let properties.
Tax Relief Changes for
Landlords
Investors can currently claim tax relief on mortgage interest at the rate at
which they pay tax (20%/ 40%/ 45%). Between 2017-20 the system will
change – with landlords liable for tax on all of their rental income, and able
to claim tax relief only at the basic rate (20%). This will reduce or eradicate
rental returns for higher rate taxpayers, and may push some into higher tax
bands.
While the introduction of the new rules may not result in a flood of sales, it
may well reduce the supply of PRS properties.
11 See glossary
Wandsworth Local Housing Needs Assessment, December 2020
GL Hearn Page 20 of 176
Wandsworth LHNA
Official
4 HOUSING MARKET AREA
4.1 In 2014, the Council published its Strategic Housing Market Assessment (SHMA) as an update to 2012
Wandsworth SHMA. The 2014 SHMA references the London Plan statement that ‘though there are
differences in the type, quality and cost of housing across London, the complex linkages between them
mean that for planning purposes, London should be treated as a single market’12 .
4.2 The document outlines that ‘the Council supports this position particularly given the cross-Borough nature
of housing markets in London and mobility of households as they seek the housing they require or aspire
to’ (Wandsworth SHMA, 2014).
4.3 The SHMA (2014) set out evidence (drawing on house prices, migration flows and travel-to-work data)
that demonstrated that Wandsworth’s housing market was ‘inextricably linked’ with these Boroughs.
Commuting
4.4 As part of undertaking this LHNA, GL Hearn have tested a number of indicators to identify whether
Wandsworth’s Housing Market Area, as established in the 2014 SHMA, remains relevant. With reference
to Table 2 below, analysis of flow data demonstrates a travel-to-work self-containment rate13 of 43% and
domestic house-moves self-containment rate of 23%.
4.5 Of those commuting to Wandsworth the greatest numbers originated from Merton (9%), Lambeth (5%)
and Southwark (4%). Analysis of those commuting out of Wandsworth data illustrates that 20% commute
to the City of London, 17% to Westminster and 10% to Southwark.
4.6 Focusing on the South West Sub-Region geography as defined in the 2012 Wandsworth SHMA, the data
in Table 2 shows that 30% of residents in LBW commute to locations in the South West Sub-Region. A
large proportion (65%) of those working in LBW reside somewhere in the South West Sub-Region.
12 Paragraph 3.15, the London Plan 13 See glossary

Wandsworth Local Housing Needs Assessment, December 2020
GL Hearn Page 21 of 176
Wandsworth LHNA
Official
Commuting patterns in and out of LBW
Local Authority Commuting In-flow Commuting Outflow
Barking and Dagenham 0.7% -
Barnet - -
Bexley - -
Brent 0.4% 0.8%
Bromley 0.9% 0.5%
Camden 0.4% 4.7%
City of London - 20.2%
Croydon 2.2% 1.2%
Ealing 0.5% -
Greenwich 0.6% -
Hackney 0.4% -
Hammersmith and Fulham 3.0% 2.7%
Haringey 0.4% 0.3%
Harrow 1.5% -
Havering - -
Hillingdon 0.8% 0.3%
Hounslow 2.2% 1.4%
Islington 0.3% 0.3%
Royal Borough of Kensington and Chelsea
2.4% 5.8%
Kingston upon Thames 3.5% 0.1%
Lambeth 5.2% 2.0%
Lewisham 1.9% -
Merton 9.1% 3.6%
Newham - -
Redbridge - -
Richmond upon Thames 2.3% 1.7%
Southwark 3.9% 9.9%
Sutton - -
Tower Hamlets - 4.0%
Waltham Forest - -
Wandsworth 43.1% 23.0%
Westminster 2.6% 17.5%
Source: 2011 Census
Migration
4.7 When observing migration patterns, NHS data (2018) on internal UK migration has been used. With
reference to Table 3, it is evident that the internal migration patterns of those moving to and from LBW
are aligned with patterns at the South-West Sub-Region level.
Wandsworth Local Housing Needs Assessment, December 2020
GL Hearn Page 22 of 176
Wandsworth LHNA
Official
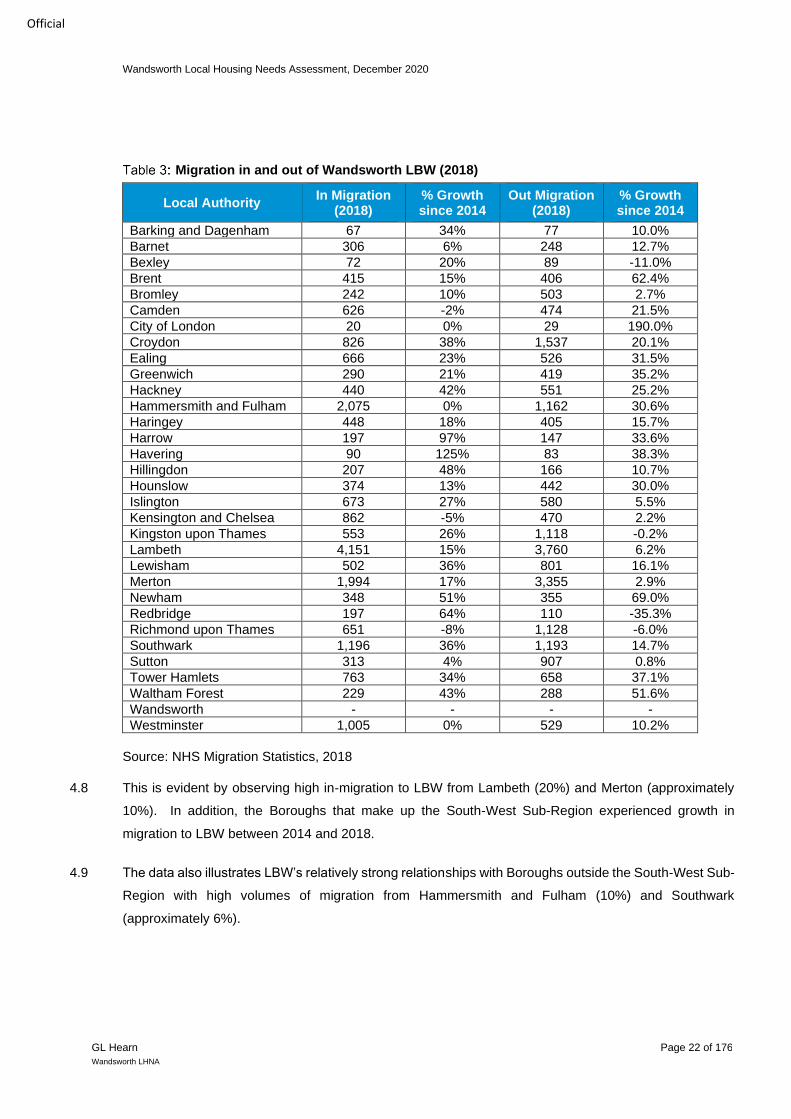
Migration in and out of Wandsworth LBW (2018)
Local Authority In Migration
(2018) % Growth since 2014
Out Migration (2018)
% Growth since 2014
Barking and Dagenham 67 34% 77 10.0%
Barnet 306 6% 248 12.7%
Bexley 72 20% 89 -11.0%
Brent 415 15% 406 62.4%
Bromley 242 10% 503 2.7%
Camden 626 -2% 474 21.5%
City of London 20 0% 29 190.0%
Croydon 826 38% 1,537 20.1%
Ealing 666 23% 526 31.5%
Greenwich 290 21% 419 35.2%
Hackney 440 42% 551 25.2%
Hammersmith and Fulham 2,075 0% 1,162 30.6%
Haringey 448 18% 405 15.7%
Harrow 197 97% 147 33.6%
Havering 90 125% 83 38.3%
Hillingdon 207 48% 166 10.7%
Hounslow 374 13% 442 30.0%
Islington 673 27% 580 5.5%
Kensington and Chelsea 862 -5% 470 2.2%
Kingston upon Thames 553 26% 1,118 -0.2%
Lambeth 4,151 15% 3,760 6.2%
Lewisham 502 36% 801 16.1%
Merton 1,994 17% 3,355 2.9%
Newham 348 51% 355 69.0%
Redbridge 197 64% 110 -35.3%
Richmond upon Thames 651 -8% 1,128 -6.0%
Southwark 1,196 36% 1,193 14.7%
Sutton 313 4% 907 0.8%
Tower Hamlets 763 34% 658 37.1%
Waltham Forest 229 43% 288 51.6%
Wandsworth - - - -
Westminster 1,005 0% 529 10.2%
Source: NHS Migration Statistics, 2018
4.8 This is evident by observing high in-migration to LBW from Lambeth (20%) and Merton (approximately
10%). In addition, the Boroughs that make up the South-West Sub-Region experienced growth in
migration to LBW between 2014 and 2018.
4.9 The data also illustrates LBW’s relatively strong relationships with Boroughs outside the South-West Sub-
Region with high volumes of migration from Hammersmith and Fulham (10%) and Southwark
(approximately 6%).

Wandsworth Local Housing Needs Assessment, December 2020
GL Hearn Page 23 of 176
Wandsworth LHNA
Official
4.10 The Boroughs of Havering (125%), Harrow (97%) and Redbridge (64%) experienced increases in the
percentage of their residents migrating to the LBW. However, over the 2014-2018 period, the South-West
Sub-Region has maintained some of the highest volumes of in-migration to the LBW.
4.11 In terms of out migration from Wandsworth, the 2018 patterns remain fairly similar to 2014. It is evident
that there remain high volumes of the population migrating out of the LBW to Boroughs that make up the
South-West Sub-Region. This includes Lambeth (approximately 17%), Merton (approximately 15%),
Croydon (approximately 7%) and Kingston upon-Thames (5%).
4.12 The analysis demonstrates that LBW continues to both form part of London’s wider housing market area
and has a strong on-going relationships with the Boroughs that make up the South West Sub-Regional
housing market.

Wandsworth Local Housing Needs Assessment, December 2020
GL Hearn Page 24 of 176
Wandsworth LHNA
Official
5 HOUSING PROFILE
Introduction
5.1 This section of the report profiles the current housing stock in LBW. To contextualize housing need, the
analysis looks at the current stock, recent supply by tenure and size, the development pipeline, the
capacity of development sites and over-crowding and under-occupancy.
For the purposes of the bedroom standard, a separate bedroom shall be allocated to the following
persons:
• A person living together with another as husband and wife (whether that other person is of the
same sex or the opposite sex)
• A person aged 21 years or more
• Two persons of the same sex aged 10 years to 20 years
• Two persons (whether of the same sex or not) aged less than 10 years
• Two persons of the same sex where one person is aged between 10 years and 20 years and
the other is aged less than 10 years
•
• Any person aged under 21 years in any case where he or she cannot be paired with another occupier
of the dwelling so as to fall within, (d) or above.
Current stock
5.2 At 2011, there were approximately 135,900 dwellings in LBW, accounting for 4% of all dwellings in London
and 0.6% of dwellings nationally. As illustrated in the figure below, flats are the dominant dwelling type in
LBW making up 66% of all dwellings. This is followed by terrace dwellings (24%) and semi-detached
dwellings (7%). Detached dwellings account for only 2% of dwellings.

Wandsworth Local Housing Needs Assessment, December 2020
GL Hearn Page 25 of 176
Wandsworth LHNA
Official
Figure 1: Type of dwellings in LBW, London and England (2011)
Source: 2011 Census
5.3 Perhaps unsurprisingly, the profile of LBW is more aligned with trends in London than the rest of England.
Despite this, it is worth noting the higher proportion of flats in LBW (66%) compared to London (52%).
This reflects the Borough’s inner-city location and the resultant higher density development. In addition,
both LBW and London have a significantly greater percentage of flats compared to England (22%).
Conversely, LBW notably has a smaller proportion of semi-detached dwellings compared to London
(19%) and England (31%).
Dwellings by size
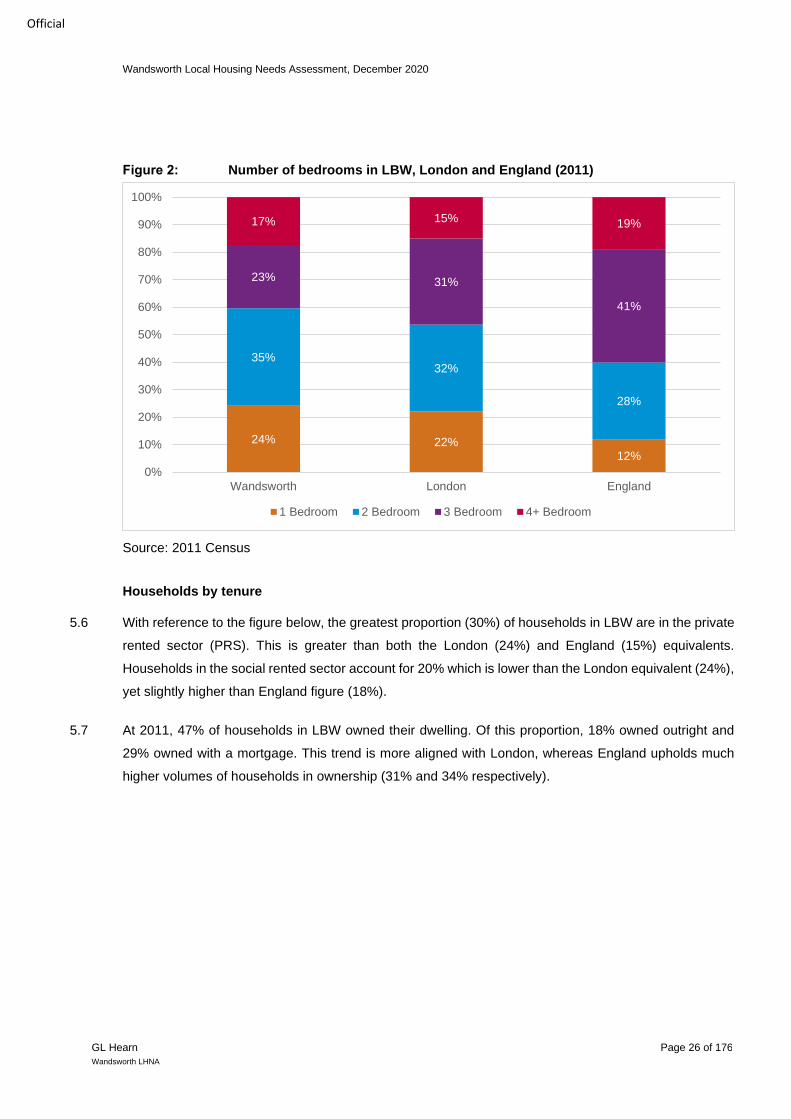
5.4 As illustrated in the figure below, there is a higher proportion of smaller dwellings in LBW compared to
both London and England. Around 24% of dwellings have 1-bedroom and 35% with 2 bedrooms. This
reflects the nature of the housing profile of LBW with a greater proportion of flats and terrace dwellings.
5.5 In terms of larger dwellings, LBW has the lowest proportion (23%) of 3-bedroom dwellings across all
geographies. There is a slightly higher proportion of 4+ bedrooms in LBW (17%) in comparison to London
(15%). However, as anticipated, both geographies contain a slightly lower percentage of larger homes
than England (19%).
2% 6%
22%7%
19%
31%
24%
23%
24%66%
52%
22%
0%
10%
20%
30%
40%
50%
60%
70%
80%
90%
100%
Wandsworth London England
Detached Semi-detached Terrace Flat
Wandsworth Local Housing Needs Assessment, December 2020
GL Hearn Page 26 of 176
Wandsworth LHNA
Official
Figure 2: Number of bedrooms in LBW, London and England (2011)
Source: 2011 Census
Households by tenure
5.6 With reference to the figure below, the greatest proportion (30%) of households in LBW are in the private
rented sector (PRS). This is greater than both the London (24%) and England (15%) equivalents.
Households in the social rented sector account for 20% which is lower than the London equivalent (24%),
yet slightly higher than England figure (18%).
5.7 At 2011, 47% of households in LBW owned their dwelling. Of this proportion, 18% owned outright and
29% owned with a mortgage. This trend is more aligned with London, whereas England upholds much
higher volumes of households in ownership (31% and 34% respectively).
24% 22%12%
35%32%
28%
23% 31%
41%
17% 15% 19%
0%
10%
20%
30%
40%
50%
60%
70%
80%
90%
100%
Wandsworth London England
1 Bedroom 2 Bedroom 3 Bedroom 4+ Bedroom

Wandsworth Local Housing Needs Assessment, December 2020
GL Hearn Page 27 of 176
Wandsworth LHNA
Official
Figure 3: Households by tenure in LBW, London and England (2011)
Source: Census 2011
Change in tenure
5.8 As Table 4 shows the most significant growth in tenures within LBW occurred in the private rented sector
which increasing by 65% between 2001 and 2011. However, both London and England experienced
greater rates of growth in the private rented sector, increasing by 79% and 89% respectively.
Change in Household tenure in LBW, London and England (2001-2011)
2001 2011 Growth (%)
LBW London England LBW London England LBW London England
Owned outright
21,350 665,061 5,969,670 24,067 689,898 6,745,584 13% 4% 13%
Owned with a mortgage
37,863 1,010,629 7,950,759 35,326 928,417 7,403,200 -7% -8% -7%
Social rented
26,551 790,371 3,940,728 26,516 785,993 3,903,550 0% -1% -1%
Private rented
25,008 432,482 1,798,864 41,317 775,591 3,401,675 65% 79% 89%
Source: Census 2001 and 2011
5.9 Over the same period the number of households in dwellings owned outright increased by 13%, which is
on par with England (13%) and notably greater than London (4%). The number of households in dwellings
owned with a mortgage decreased by 7% in LBW over the Census periods. This decline was also evident
18% 21%31%
29%28%
34%
20%24%
18%
30%24%
15%
0%
10%
20%
30%
40%
50%
60%
70%
80%
90%
100%
Wandsworth London England
Owned outright Owned with a mortgage Social rented Private rented

Wandsworth Local Housing Needs Assessment, December 2020
GL Hearn Page 28 of 176
Wandsworth LHNA
Official
across London (-8%) and England (-7%) and can be linked to restricted access to mortgages and
worsening affordability.
5.10 Notably, households in the social rented sector in LBW remained static with no change over the Census
periods. This is in contrast to the picture in both London and England where the proportion of households
in this sector declined.
Over-crowding and under-occupation
5.11 In terms of over-crowding and under-occupation, the figure below illustrates that 49% (64,137) of
households in LBW are under-occupied14 which aligns with the trend seen in London. Yet, this trend is
much lower than the rate of under-occupation at the national level (69%).
5.12 Around 9% (11,440) of households in LBW are over-crowded, meaning there is one fewer bedroom than
required. This rate is slightly lower than the London equivalent. However, over-crowding is more
prominent in both LBW and London compared to England (5%).
Figure 4: Over-crowding and under-occupation (2011)
Source: Census 2011
5.13 A relatively high rate of households in LBW are considered to have the correct number of bedrooms at
42% (54,916). This rate is higher than London (39%) and England (27%).
5.14 Over the 2001 and 2011 Census period, under-occupancy in LBW increased by 23% (22,402). This level
of growth is greater than the rate experienced in London (16%) and England (11%).
14 See glossary
49% 49%
69%
42% 39%
27%
9% 11%5%
0%
10%
20%
30%
40%
50%
60%
70%
80%
90%
100%
Wandsworth London England
Under-occupied Neutral Over-crowded

Wandsworth Local Housing Needs Assessment, December 2020
GL Hearn Page 29 of 176
Wandsworth LHNA
Official
5.15 In contrast, over-crowded households decreased in LBW by 40% (-7,562) over the period. London and
England also experienced a decline in over-crowded households albeit to a lesser extent, decreasing by
29% in London and 30% across the nation.
Dwelling completions
Market completions
5.16 Between 2013 and 2018 there have been over 13,105 net dwellings completed in LBW as per the
Authority Monitoring Report. As illustrated in the figure below, net annual completions were relatively low
in the earlier years, particularly in 2014 where there was a significant drop from the previous year, however
this increased from 2015.
Figure 5: Market dwelling completions (2013 – 2018)
Source: Wandsworth Borough Council AMR, 2013- 2018
5.17 The greatest volume in completions occurred in 2016 with around 4,400 net dwellings delivered. Following
that the net volume of completions started to decline to around 1,200 dwellings by 2018.
5.18 This data can also be disaggregated by number of bedrooms being completed. With reference to the
figure below, the types of dwellings being completed in LBW have predominately been smaller dwellings
in the form of 1-bedroom and 2-bedrooms.
-
500
1,000
1,500
2,000
2,500
3,000
3,500
4,000
4,500
5,000
2013 2014 2015 2016 2017 2018
Wandsworth Local Housing Needs Assessment, December 2020
GL Hearn Page 30 of 176
Wandsworth LHNA
Official
Figure 6: Completions by dwelling size (2013– 2018)
Source: Wandsworth Borough Council AMR, 2013-2018
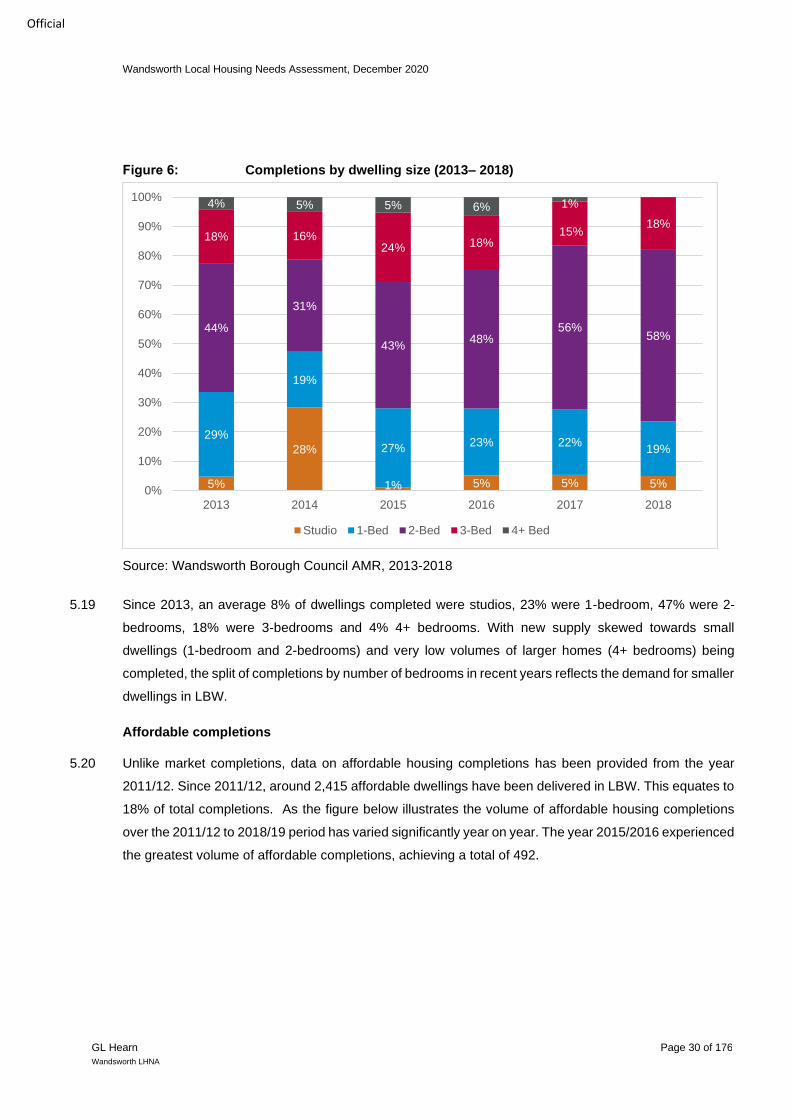
5.19 Since 2013, an average 8% of dwellings completed were studios, 23% were 1-bedroom, 47% were 2-
bedrooms, 18% were 3-bedrooms and 4% 4+ bedrooms. With new supply skewed towards small
dwellings (1-bedroom and 2-bedrooms) and very low volumes of larger homes (4+ bedrooms) being
completed, the split of completions by number of bedrooms in recent years reflects the demand for smaller
dwellings in LBW.
Affordable completions
5.20 Unlike market completions, data on affordable housing completions has been provided from the year
2011/12. Since 2011/12, around 2,415 affordable dwellings have been delivered in LBW. This equates to
18% of total completions. As the figure below illustrates the volume of affordable housing completions
over the 2011/12 to 2018/19 period has varied significantly year on year. The year 2015/2016 experienced
the greatest volume of affordable completions, achieving a total of 492.
5%
28%
1% 5% 5% 5%
29%
19%
27%23% 22%
19%
44%
31%
43%48%
56%58%
18% 16%24% 18%
15%18%
4% 5% 5% 6% 1%
0%
10%
20%
30%
40%
50%
60%
70%
80%
90%
100%
2013 2014 2015 2016 2017 2018
Studio 1-Bed 2-Bed 3-Bed 4+ Bed

Wandsworth Local Housing Needs Assessment, December 2020
GL Hearn Page 31 of 176
Wandsworth LHNA
Official
Figure 7: Affordable completions between 2011/12 and 2018/19
Source: Wandsworth Borough Council, 2011 – 2019
5.21 As with market accommodation affordable housing completions have predominately been delivered as
smaller dwellings, reflecting the preference of households on the Wandsworth’s Housing Register. Since
2011 there has been an average of 43% of affordable dwellings built have had 1-bedroom and 41% 2-
bedrooms completed.
Figure 8: Affordable completions by dwelling size (2011/12-2018/19)
Source: Wandsworth Borough Council AMR, 2011 – 2019
5.22 The delivery of 3-bedrooms has fluctuated from year to year, but since 2011 this size of property has
averaged 13%. Larger 4+ bedroom affordable dwellings have only averaged 3% of all affordable housing
completions over the same period.
0
100
200
300
400
500
600
2011/12 2012/13 2013/14 2014/15 2015/16 2016/17 2017/18 2018/19
42%28%
54% 48% 43% 46%33%
48%
39%
43%
34% 40% 46% 43%
48%
39%
10% 27%
12% 8% 11% 7%17% 10%
9%2% 4% 1% 3% 2% 3%
0%
10%
20%
30%
40%
50%
60%
70%
80%
90%
100%
2011/12 2012/13 2013/14 2014/15 2015/16 2016/17 2017/18 2018/19
1 Bed 2 Bed 3 Bed 4 Bed

Wandsworth Local Housing Needs Assessment, December 2020
GL Hearn Page 32 of 176
Wandsworth LHNA
Official
5.23 This Council data also identifies which of these net completions fall under the banner of lifetime homes
(M4(2)) and wheelchair accessible (M4(3)) homes. Over the same period, there has been 1,765 M4(2)
net dwellings completed and 590 M4(3) net dwellings completed.
Development pipeline
5.24 LBW Monitoring data indicates that there are approximately 11,350 dwellings in the development pipeline.
This figure includes planning proposals that have received permission but are yet to be constructed. Of
this total, 6% of dwellings in the pipeline are studios, 28% are 1-bedroom, 47% 2-bedrooms, 16% 3-
bedrooms and 4% are 4+ bedrooms. This will further skew the Borough’s housing stock towards smaller
properties.
Wandsworth Local Housing Needs Assessment, December 2020
GL Hearn Page 33 of 176
Wandsworth LHNA
Official
Summary of Housing Profile • The typically smaller flatted stock of housing reflects LBW's inner-city location in terms of both type
and size of homes.
• LBW has a significantly higher proportion of homes within the PRS compared with London, and
this has grown substantially over the inter-censual period (2001-2011); this is an indicator of the
relative unaffordability of for sale dwellings.
• The unaffordability of for-sale homes is also captured in the lower proportion of households in
owner-occupation (47%) compared with both London (49%) and England (65%), and the fact that
the numbers of households who own their dwelling with a mortgage declined over the period (-7%).
• The increase in the numbers of dwellings owned outright suggests an increase in the older
population, (those who have paid off their mortgages) is also likely to point to wealthy cash buyers
entering the market as investors.
• Around 74% of dwellings completed since 2013 have been one and two bed homes; this suggests
the market is responding to demand from smaller households (singles and couples) and those with
a lower or average household income to buy or rent.
• The balance of smaller homes is forecast to increase in the future with 81% of dwellings in the
development pipeline having 2 bedrooms or fewer. Around 16% of dwellings in the pipeline are 3-
bedrooms.
• The marginally smaller degree of over-crowding compared with London (9% as against 11%) at
the time of the last census suggests the housing stock is relatively well aligned with demand.
However, this data is drawn from dated Census data and may require corroboration from other
sources to be reliable.

Wandsworth Local Housing Needs Assessment, December 2020
GL Hearn Page 34 of 176
Wandsworth LHNA
Official
6 LOCAL HOUSING NEED
Introduction
6.1 This section sets out GL Hearn’s initial findings as regards the Local Housing Needs Figure (LHNF) for
the London Borough of Wandsworth. We take as a starting point the Standard Method before considering
the plausibility of arriving at an alternative figure using demographic evidence and existing local and
regional policy.
Housing Need and the Standard Method
6.2 The MHCLG three step methodology takes the official household projections as the starting point. This is
adjusted on the basis of market signals. However, that adjustment is then capped to 40% above a shifting
figure depending on the status of the local authority’s local plan and the scale of its housing requirement
in relation to the household projections. These steps are set out below.
Step 1: Setting the baseline
6.3 The initial revisions to the Planning Practice Guidance made it clear that national household projections
should provide the demographic baseline for every local authority. After a period of consultation in
February 2019, the MHCLG confirmed that local authorities should revert to the 2014-based household
projections (rather than the 2016-based projections) when calculating their LHNF using the standard
methodology. This was to ensure the government’s stated target of 300,000 per annum could be achieved.
6.4 The Standard Method proposes that the demographic baseline should be the annual average household
growth over a 10-year period with the current year being the first year. As this document is being
published in 2020 then the period examined is 2020 - 2030.
6.5 Across the Borough, the 2014-based projections show household growth of 14,062 for the 2020-30period
(143,179 households in 2020 increasing to 157,241 in 2030) or 1,406 households per annum. This
equates to a 9.8% increase in households over the same period.
Step 2: Adjustment to take account of affordability
6.6 The methodology seeks to adjust the demographic baseline on the basis of local affordability. The
adjustment increases the housing need where house prices are high relative to workplace incomes. This
uses the median workplace-based affordability ratios published by ONS. That is the ratio between median
workplace earnings in a given area and the median house price in the same location.

Wandsworth Local Housing Needs Assessment, December 2020
GL Hearn Page 35 of 176
Wandsworth LHNA
Official
6.7 Specifically, the adjustment increases the housing need derived from the household projections by 0.25%
for every percentage point the affordability ratio is above four (4.0). This is justified on the basis that four
is the typical multiple used as lending practice by mortgage providers. The equation is as follows:
Adjustment factor = ((Local affordability ratio – 4)/4) x 0.25
6.8 In 2019, the median workplace affordability ratio in Wandsworth was 18.44; i.e. median house prices were
18.44 times the median earnings of those working in the Borough. This means that the adjustment factor
for Wandsworth is 0.903 or 90.3%. This is calculated as follows: ((18.44 - 4) / 4) × 0.25).
6.9 To this point, the housing need in Wandsworth would be 90.3% above the demographic baseline of 1,406
households per annum. This uplift takes the housing need figure to 2,675 dwellings per annum.
Step 3: Capping the level of any increase
6.10 The final step in the standard method is to cap the market signals uplift if necessary. In the PPG it is noted
that “the market adjustment could lead to a significant increase in the local housing need in some parts
of the country. To help ensure the method is deliverable, a cap on the local housing need may be applied”.
6.11 The cap is only applied to local authorities where the uplift in stage 2 is greater than 40%. There are two
situations where a cap is applied. The first is where an authority has reviewed their plan (including
developing an assessment of housing need) or adopted a plan (including spatial development strategies
(such as the London Plan) within the last five years. In this instance, the need may be capped at 40%
above the requirement figure set out in the plan.
6.12 The second situation is where plans and evidence are more than five years old. In such circumstances,
a cap may be applied at 40% of the higher of the projected household growth over the 10 year period
identified in step 1 or the housing requirement in the most recent plan (where this exists).
6.13 In Wandsworth, given that the most recent plan is the current London Plan15 which was adopted in March
2015 i.e. more than 5 years ago, the capping means that the housing need would be set at 40% above
the Borough target (1,812 dpa) in the London Plan given that this exceeds projected household growth
(1,406).
6.14 A cap of 40% above the current target (i.e. 1,812 × 1.4) would lead to a figure of 2,537 dwellings per
annum for the 2020-30 period. The cap applies given the capped figure (2,537 dpa) is less than the figure
15 The London Plan is used for this calculation on account of the primacy of the London Plan over Wandsworth’s Local Plan

Wandsworth Local Housing Needs Assessment, December 2020
GL Hearn Page 36 of 176
Wandsworth LHNA
Official
arrived at in step 2 (2,675 dwellings). Therefore 2,537 dpa would be classed as the local housing
need figure (LHNF) for the Borough under the Standard Method.
6.15 According to the PPG16 “The cap reduces the minimum number generated by the standard method but
does not reduce housing need itself”. This the total housing need and while it may not be deliverable, it
should be planned for through the duty to cooperate if it cannot be delivered locally.
Alternatives to the Standard Method
6.16 This section of the report considers the possibility of arriving at an alternative LHNF to the Standard
Method. The PPG states that where a plan-making authority seeks to do this, this must be justified “using
robust evidence, that the figure is based on realistic assumptions of demographic growth”17.
6.17 In other words, it must be shown that the 2014-based household projections on which the standard
method relies are erroneous in the case of the local authority in question, and that the evidence used to
make this argument is credible and compelling.
6.18 Firstly we consider whether the 2018 Mid-Year Population Estimates produced by ONS in 2019 or the
2016-based population projections, indicate that the 2014-based household projections actually
transpired and how far off they actually were. In the figure below, we set out the population from each of
these sources for the years 2011 to 2018.
16 Paragraph: 007 Reference ID: 2a-007-20190220 17PPG, Paragraph: 015 Reference ID: 2a-015-20190220
Wandsworth Local Housing Needs Assessment, December 2020
GL Hearn Page 37 of 176
Wandsworth LHNA
Official
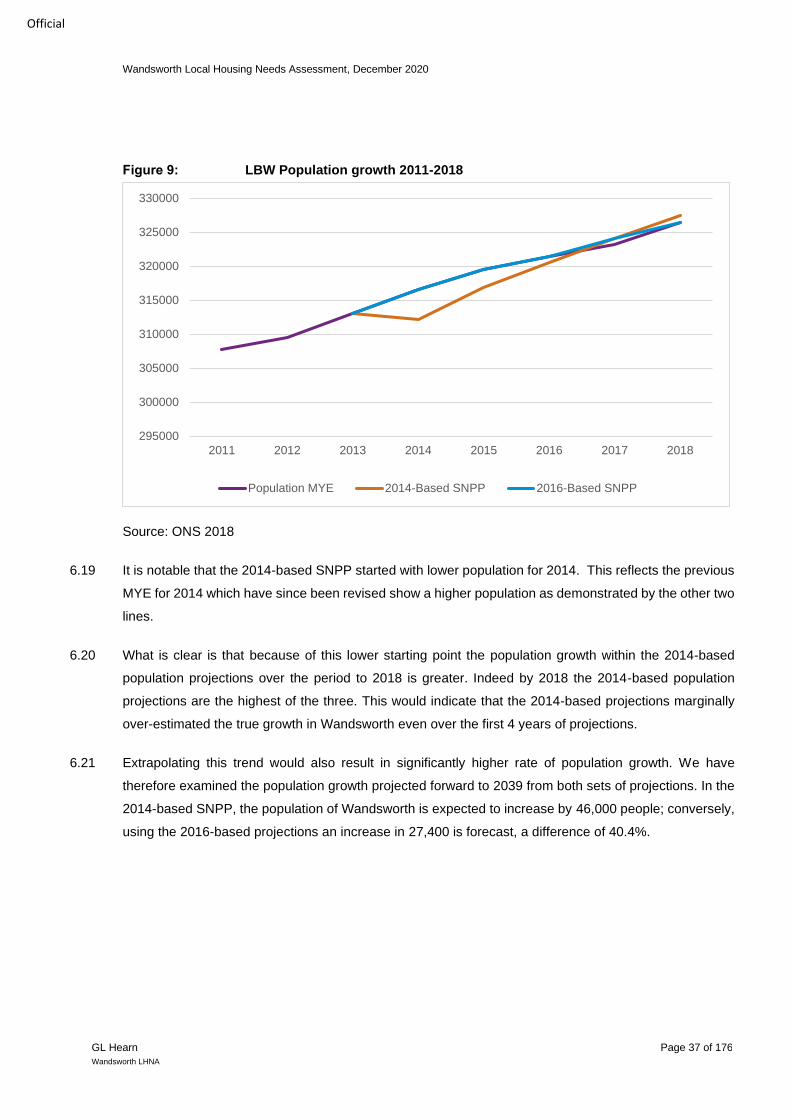
Figure 9: LBW Population growth 2011-2018
Source: ONS 2018
6.19 It is notable that the 2014-based SNPP started with lower population for 2014. This reflects the previous
MYE for 2014 which have since been revised show a higher population as demonstrated by the other two
lines.
6.20 What is clear is that because of this lower starting point the population growth within the 2014-based
population projections over the period to 2018 is greater. Indeed by 2018 the 2014-based population
projections are the highest of the three. This would indicate that the 2014-based projections marginally
over-estimated the true growth in Wandsworth even over the first 4 years of projections.
6.21 Extrapolating this trend would also result in significantly higher rate of population growth. We have
therefore examined the population growth projected forward to 2039 from both sets of projections. In the
2014-based SNPP, the population of Wandsworth is expected to increase by 46,000 people; conversely,
using the 2016-based projections an increase in 27,400 is forecast, a difference of 40.4%.
295000
300000
305000
310000
315000
320000
325000
330000
2011 2012 2013 2014 2015 2016 2017 2018
Population MYE 2014-Based SNPP 2016-Based SNPP

Wandsworth Local Housing Needs Assessment, December 2020
GL Hearn Page 38 of 176
Wandsworth LHNA
Official
Change in population – 2014 and 2016 based SNPP
2019 2039 Change (19-39) % Change
2014 based SNPP
331,000 377,000 46,000 13.9%
2016 based SNPP
328,500 355,900 27,400 8.3%
Difference 2,500 21,100 18,600 40.4%
6.22 The observation that the 2016-based SNPP is more closely in line with the MYE provides some evidence
that the 2016-based SNPP is a more accurate reflection of demographic growth than the 2014-based
SNPP both over the short term and potentially over the longer term.
6.23 Were LBW to use the 2016-based SNPP as the basis for their LHNF, this would reduce the final housing
requirement substantially. Indeed, the “start point” figure used in the Standard Method would only need
to fall by 138 dpa (the difference between the capped figure of 2,537 and 2,675 dpa) for the reduction to
make a tangible impact on Wandsworth’s LHNF.
6.24 However, it is important to note that the 2016-based SNPP should be used with caution given that PPG
specifically states that that an LHNF arrived at on this basis of 2016-based household projections “will not
be considered to be following the standard method”18. It is therefore likely to be treated by the Planning
Inspectorate, in principle, as unsound.
6.25 While the MYE reinforce the appropriateness of alternatives to the 2014-based projections we do not
consider these to be the most robust platform from which to base and defend the Local Plan given what
the PPG suggests.
6.26 In addition, the London Plan is currently moving through the examination process and has recently
produce an intend to publish version19. As currently drafted Wandsworth has been given a target of 1,950
dpa. This is an approximately 8%increase to the current housing target (1,812 dpa).
6.27 If adopted, this would mean that the buffer would be 40% higher than 1,950 (1.4*1,950=2,730 dpa).
However, this would effectively mean that the Wandsworth figure would be uncapped as the Step 2 figure
(2,675dpa) is less than 40% above the Draft London Plan figure.
18 PPG, Paragraph: 015 Reference ID: 2a-015-20190220 19 https://www.london.gov.uk/sites/default/files/intend_to_publish_-_tracked.pdf

Wandsworth Local Housing Needs Assessment, December 2020
GL Hearn Page 39 of 176
Wandsworth LHNA
Official
6.28 Furthermore, the Greater London Authority is likely to be required by MHCLG and/or the Planning
Inspectorate to undertake an immediate review of their housing target to ensure conformity with the
Standard Method. This was indicated in 2019 by the former housing minister James Brokenshire.
6.29 As noted, the inspectors had previously found that the modelling used to arrive at the forecast contribution
made by small sites to be "insufficiently accurate to give a true picture of the likely available capacity".20
In their report put forward an alternative approach based on an annual growth rate of 0.3% that they feel
is likely to reflect a more realistic output from small sites. The approach used in the Intend to Publish
London Plan to arrive at the proposed housing targets is thus policy-on assessment.
6.30 This policy-on position, provides a housing requirement figure consistent with paragraph 65 of the NPPF.
The Standard Method figure provides a housing needs figure, an unconstrained number that does not
reflect the extent to which the Council can meet need over the plan period.
6.31 Crucially, national policy and guidance make it clear that the LHNF identified using the standard method
does not in itself establish an area’s housing requirement. Rather, it is a starting point for considering the
level of housing need to be accommodated through the plan-making process. The Council also needs to
take account of the need to ensure that sufficient land is available for other essential land uses. For this
reason, the NPPF requires local authorities to inform the housing requirement by identifying a supply of
specific deliverable sites available in their area.
6.32 Given the purpose of this report is to arrive at a LHNF, rather than the requirement figure, we recommend
a figure of 2,537 dpa based on the standard method provides a sound starting point for plan-making in
the Borough. This indicates that there is an acute need for conventional homes in LBW.
6.33 While we have not found justifiable reason to diverge from the minimum LHNF the PPG21 advised that
this is minimum need and the local authorities could consider planning for higher numbers on the basis
of:
• growth strategies for the area that are likely to be deliverable, for example where funding is in place
to promote and facilitate additional growth (e.g. Housing Deals);
• strategic infrastructure improvements that are likely to drive an increase in the homes needed
locally; or
• an authority agreeing to take on unmet need from neighbouring authorities, as set out in a
statement of common ground;
6.34 However, these increases would be at the discretion of the local authority and would not form part of the
LHNA.
20 The Planning Inspectorate, Report of the Examination in Public of the London Plan 2019, page 41 21 Paragraph: 010 Reference ID: 2a-010-20190220

Wandsworth Local Housing Needs Assessment, December 2020
GL Hearn Page 40 of 176
Wandsworth LHNA
Official
Summary of Local Housing Need
• Step 1 of calculating the standard method establishes the demographic baseline. Across the
Borough, the 2014-based projections indicate household growth of 14,062 for the 2020-2030 period
or 1,406 per annum.
• Step 2 adjusts the demographic baseline based on the median workplace affordability ratio which
in Wandsworth is 18.44 (2019). This means that housing need in Wandsworth would be 90.3%
above the demographic baseline of 1,406households per annum. This uplift takes the housing need
figure to 2,675 dwellings per annum.
• Step 3 caps the uplift. For LBW, capping means that housing would be set at 40% above the
Borough target (1,812 dpa) in the current Local Plan (2015) which was adopted more than five
years ago. Applying the 40% cap results in a housing need for LBW of 2,537 dpa.
• The "intend to publish" version of the London Plan sets 10 year targets for net housing completions
for each borough. For Wandsworth, this is 19,500 (1,950dpa).

Wandsworth Local Housing Needs Assessment, December 2020
GL Hearn Page 41 of 176
Wandsworth LHNA
Official
7 DEMOGRAPHICS
Recent Demographic Trends
7.1 The figure below shows the components of population change in the Borough between 2001-18. This
shows that much of the population growth is driven by natural growth (more births than deaths). The
positive natural change is offset by the negative levels of internal migration from Wandsworth.
Figure 10: Wandsworth Components of Change, 2001 to 2018
Source: ONS
Household Formation Rates
7.2 Having studied the population size, the next step in the process is to convert this information into estimates
of the number of households in the area. To do this the concept of household representative rates (HRR)
is used. HRRs can be described in their most simple terms as the number of people who are counted as
heads of households (or in this case the more widely used Household Reference Person (HRP)).
7.3 The 2016-based SNHP have come under some heavy criticism, this is largely because they are based
only on data in the 2001-11 Census period and arguably build in the suppression of household formation
experienced in that time. The criticism of the 2016-Based HRR resulted in the standard method required
by updated national policy and guidance and employed in this report.
7.4 The previous (2014-based) projections used a longer time-series (all Census points back to 1971) and
therefore do cover a wider housing market cycle. However, while the 2014- based projections point to a
0
1000
2000
3000
4000
5000
6000
-5000
-4000
-3000
-2000
-1000
0
1000
2000
3000
4000
5000
200
1
200
2
200
3
200
4
200
5
200
6
200
7
200
8
200
9
201
0
201
1
201
2
201
3
201
4
201
5
201
6
201
7
Popula
tion C
hange
Com
ponent
Change
Natural Change Internal International Other Population Change

Wandsworth Local Housing Needs Assessment, December 2020
GL Hearn Page 42 of 176
Wandsworth LHNA
Official
greater level of need than the 2016-based projections for households headed by people aged 25-34,
there remains a deterioration of their ability to form a household, which is reflected in the forward
projections.
7.5 Were LBW to use of the 2016-based projections as the basis for arriving at their LHNF, it is suggested
that some adjustments are made to reduce the apparent suppression (as well as to deal with possible
issues within older age groups).

Wandsworth Local Housing Needs Assessment, December 2020
GL Hearn Page 43 of 176
Wandsworth LHNA
Official
Figure 11: Projected Household Representative Rates by age of head of Household
15-24 25-34
35-44 45-54
55-64 65-74
75-84 85 and over
Source: Derived from ONS and CLG data
0.05
0.1
0.15
0.2
0.25
2001
2003
2005
2007
2009
2011
2013
2015
2017
2019
2021
2023
2025
2027
2029
2031
2033
2035
2037
2016-based
2014-based
2008-based
0.3
0.35
0.4
0.45
0.5
2001
2003
2005
2007
2009
2011
2013
2015
2017
2019
2021
2023
2025
2027
2029
2031
2033
2035
2037
2016-based
2014-based
2008-based
0.55
0.6
0.65
0.7
0.75
2001
2003
2005
2007
2009
2011
2013
2015
2017
2019
2021
2023
2025
2027
2029
2031
2033
2035
2037
2016-based
2014-based
2008-based
0.55
0.6
0.65
0.7
0.75
2001
2003
2005
2007
2009
2011
2013
2015
2017
2019
2021
2023
2025
2027
2029
2031
2033
2035
2037
2016-based
2014-based
2008-based
0.6
0.65
0.7
0.75
0.8
2001
2003
2005
2007
2009
2011
2013
2015
2017
2019
2021
2023
2025
2027
2029
2031
2033
2035
2037
2016-based
2014-based
2008-based
0.6
0.65
0.7
0.75
0.8
2001
2003
2005
2007
2009
2011
2013
2015
2017
2019
2021
2023
2025
2027
2029
2031
2033
2035
2037
2016-based
2014-based
2008-based
0.7
0.75
0.8
0.85
0.9
2001
2003
2005
2007
2009
2011
2013
2015
2017
2019
2021
2023
2025
2027
2029
2031
2033
2035
2037
2016-based
2014-based
2008-based
0.75
0.8
0.85
0.9
0.95
2001
2003
2005
2007
2009
2011
2013
2015
2017
2019
2021
2023
2025
2027
2029
2031
2033
2035
2037
2016-based
2014-based
2008-based

Wandsworth Local Housing Needs Assessment, December 2020
GL Hearn Page 44 of 176
Wandsworth LHNA
Official
7.6 If either the 2014-based or 2016-based HRR figures are used it would be clear that the objective of the
affordability adjustment would not be met as households in the 25-34 age groups would still not be able to
form in the way that they once did and arguably should.
7.7 In such circumstances, it would be reasonable to consider a further adjustment to HRR, as otherwise,
residents in these younger age groups would not be able to form in the way in which they would perhaps
like to or had done so historically.
7.8 A sensitivity test has thus been developed to model an increase in the household formation rates of the
population aged 15-85 years and over. This links back to the 2014-based SNHP and can be termed a ‘part-
return-to-trend’, where the rate of household formation sits somewhere between figures in the 2014-based
projections and those in an older 2008-based version.
Migration
7.9 The changes to migration have been applied on a proportionate basis; the methodology assumes that the
age/sex profile of both in- and out-migrants is the same as underpins the 2016-based SNPP with
adjustments being consistently applied to both internal (domestic) and international migration. Adjustments
are made to both in- and out-migration (e.g. if in-migration is increased by 1% then out-migration is reduced
by 1%).
7.10 This changes the overall level of growth away from the 2016-based SNPP but also changes the age
structure. The higher population growth typically results in a much stronger growth in what might be
considered as ‘working-age’ groups. This arises because ONS data shows that migrants are heavily
concentrated in those age groups (along with their associated children).
7.11 The tables below show the age structure of the population projected to be consistent with the housing need
associated with the standard method housing need.

Wandsworth Local Housing Needs Assessment, December 2020
GL Hearn Page 45 of 176
Wandsworth LHNA
Official
Projected population change in Wandsworth (2019-2037)
Population 2019
Population 2037
Change in population
% change
0-4 21,828 27,213 5,384 24.7%
5-9 19,747 22,363 2,616 13.2%
10-14 15,523 18,604 3,081 19.8%
15-19 12,746 16,468 3,721 29.2%
20-24 20,497 25,264 4,767 23.3%
25-29 40,583 48,778 8,195 20.2%
30-34 41,892 46,091 4,199 10.0%
35-39 34,724 36,175 1,451 4.2%
40-44 24,834 31,774 6,940 27.9%
45-49 20,516 24,370 3,854 18.8%
50-54 17,950 22,714 4,764 26.5%
55-59 14,910 20,426 5,516 37.0%
60-64 11,371 16,558 5,186 45.6%
65-69 9,248 14,538 5,290 57.2%
70-74 8,133 12,370 4,237 52.1%
75-79 5,677 9,018 3,341 58.9%
80-84 4,399 6,281 1,883 42.8%
85 & over 3,980 6,968 2,988 75.1%
Total 328,559 405,972 77,413 23.6%
Source: demographic projections
7.12 By 2037, older persons age groups are forecast to experience the most significant proportional growth
with the ages 65-69 increasing by 57.2%, ages 75-79 increasing by 58.9% and ages 85 and over
increasing by 75.1%.
7.13 Currently, working professionals make up a large proportion of Wandsworth’s population with the 25-29
and the 30-34 age groups the most populous age groups. However, these age groups are forecast to
experience relatively small growth over the time period.

Wandsworth Local Housing Needs Assessment, December 2020
GL Hearn Page 46 of 176
Wandsworth LHNA
Official
Summary of demographics
• The components of population change data shows that much of the population growth is driven by
natural growth (more births than deaths). The positive natural change is offset by the negative
levels of internal migration from Wandsworth.
• The 2014-based household projections use longer time-series than the 2016-based household
projections and in so doing point to a greater level of need than the 2016-based projections for
households headed by people aged 25-34.
• In order to fulfill the objective of the affordabilty adjustment in the standard method to increase the
number of homes available, a sensitivity test has been developed to model an increase in the
household formation rates of the population aged 15-85 years and over.
• The age structure is changed by adjustments made to migration rates. The higher population
growth typically results in a much stronger growth in what might be considered as ‘working-age’
groups.
• The number of working age people is forecast to show little growth over the plan period compared
with older people.

Wandsworth Local Housing Needs Assessment, December 2020
GL Hearn Page 47 of 176
Wandsworth LHNA
Official
8 AFFORDABLE HOUSING NEED
Introduction
8.1 Affordable housing is defined in Annex 2 of the National Planning Policy Framework (NPPF2). The NPPF2
definition is slightly wider than the previous NPPF definition; in particular, a series of ‘affordable home
ownership’ options are now considered to be affordable housing.
8.2 The method for arriving at the need for affordable housing is set out in Planning Practice Guidance (PPG).
The PPG in this area was updated in February 2019 and now requires plan-makers to identify the number
of households requiring some form of subsidized housing (the established definition) but also those
households currently in rented accommodation who aspire to own their own home.22
8.3 The analysis below is therefore split between the established definition of affordable need and the
additional widened definition, to arrive at an understanding of those households who aspire to home
ownership.
Affordable Housing Need (established definition)
8.4 The method for studying the need for affordable housing has been enshrined in Strategic Housing Market
Assessment (SHMA) guidance for many years. The established approach looks at the number of
households who are unable to afford market housing (to either rent or buy). The analysis below follows
the methodology and key data sources in guidance and can be summarised as:
• Current need (an estimate of the number of households who have a need now and based on a
range of data);
• Projected newly forming households in need (based on projections developed for this project
along with an affordability test to estimate numbers unable to afford the market);
• Existing households falling into need (based on studying the types of households who have
needed to access social/affordable rented housing and based on studying past lettings data);
• The above three bullet points added together provide an indication of the gross need (the
current need is divided by 18 so as to meet the need over the 2019-37 period);
• Supply of affordable housing (an estimate of the likely number of letting that will become
available from the existing social housing stock – drawing on data from CoRe23 and the LBW);
and
• Subtracting the supply from the gross need provided an estimate of the overall net (annual)
need for affordable housing
22PPG Paragraph: 020 Reference ID: 2a-020-20190220
23The Continuous recording of lettings and sales in Social Housing in England (referred to as CoRe) is a national
information source that records information on the characteristics of both private registered providers and local
authority new social housing tenants and the homes they rent.
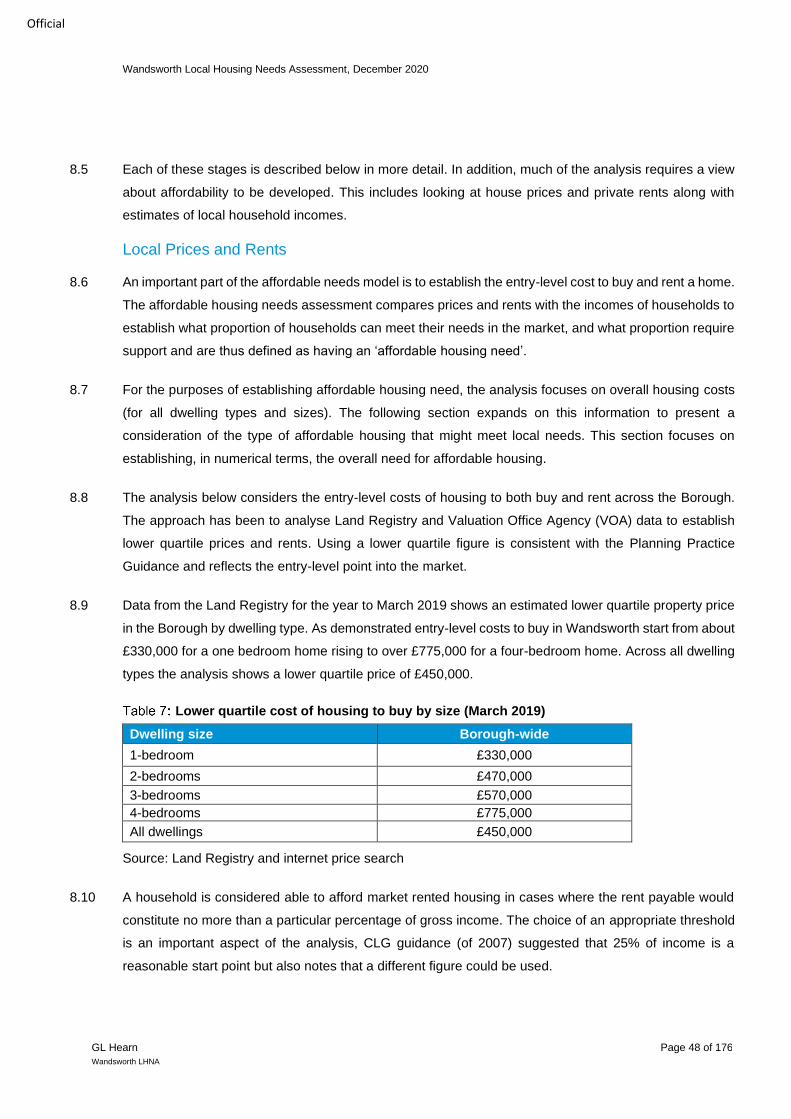
Wandsworth Local Housing Needs Assessment, December 2020
GL Hearn Page 48 of 176
Wandsworth LHNA
Official
8.5 Each of these stages is described below in more detail. In addition, much of the analysis requires a view
about affordability to be developed. This includes looking at house prices and private rents along with
estimates of local household incomes.
Local Prices and Rents
8.6 An important part of the affordable needs model is to establish the entry-level cost to buy and rent a home.
The affordable housing needs assessment compares prices and rents with the incomes of households to
establish what proportion of households can meet their needs in the market, and what proportion require
support and are thus defined as having an ‘affordable housing need’.
8.7 For the purposes of establishing affordable housing need, the analysis focuses on overall housing costs
(for all dwelling types and sizes). The following section expands on this information to present a
consideration of the type of affordable housing that might meet local needs. This section focuses on
establishing, in numerical terms, the overall need for affordable housing.
8.8 The analysis below considers the entry-level costs of housing to both buy and rent across the Borough.
The approach has been to analyse Land Registry and Valuation Office Agency (VOA) data to establish
lower quartile prices and rents. Using a lower quartile figure is consistent with the Planning Practice
Guidance and reflects the entry-level point into the market.
8.9 Data from the Land Registry for the year to March 2019 shows an estimated lower quartile property price
in the Borough by dwelling type. As demonstrated entry-level costs to buy in Wandsworth start from about
£330,000 for a one bedroom home rising to over £775,000 for a four-bedroom home. Across all dwelling
types the analysis shows a lower quartile price of £450,000.
Lower quartile cost of housing to buy by size (March 2019)
Dwelling size Borough-wide
1-bedroom £330,000
2-bedrooms £470,000
3-bedrooms £570,000
4-bedrooms £775,000
All dwellings £450,000
Source: Land Registry and internet price search
8.10 A household is considered able to afford market rented housing in cases where the rent payable would
constitute no more than a particular percentage of gross income. The choice of an appropriate threshold
is an important aspect of the analysis, CLG guidance (of 2007) suggested that 25% of income is a
reasonable start point but also notes that a different figure could be used.

Wandsworth Local Housing Needs Assessment, December 2020
GL Hearn Page 49 of 176
Wandsworth LHNA
Official
8.11 Analysis of current letting practice suggests that letting agents typically work on a multiple of 40% gross
income. Government policy (through Housing Benefit payment thresholds) would also suggest a figure of
40%+ (depending on household characteristics).
8.12 The threshold of income to be spent on housing costs should be set by asking the question ‘what level of
income is expected to be required for a household to be able to access market housing without the need
for a subsidy (e.g. through Housing Benefit)?’
8.13 That said, the choice of an appropriate threshold will, to some degree, be arbitrary and will be linked to
the cost of housing rather than income. Income levels are only relevant in determining the number (or
proportion) of households who fail to meet the threshold.
8.14 It would be feasible to find an area with very low incomes and therefore conclude that no households can
afford housing, alternatively, an area with very high incomes might show the opposite output. The key
here is that local income levels are not setting the threshold but are simply being used to assess how
many households can or cannot afford market housing.
8.15 At £1,400 per calendar month, lower quartile rent levels in LBW are relatively high in comparison to those
seen nationally (a lower quartile rent of £520 per month across England). This would suggest that a
proportion of income to be spent on housing could be higher than locations with cheaper housing.
8.16 Across England, the lowest lower quartile rents are around £400 per month, and if these areas are
considered to be at the bottom end of the range (i.e. 25% of income to be spent on housing) then this
would leave a residual income of £1,200 per month24. With the same residual income applied to LBW as
a whole, the income required to afford a £1,400 rent would be £2,600 (£1,200 + £1,400) and so the
percentage spent on housing would be 54% (rounded).
8.17 However, it needs to be considered that the cost of living in LBW is likely to be higher than in cheaper
parts of England and so a pragmatic approach to determining a reasonable proportion of income has
should be adopted. We take a midpoint between the bottom (25%) and the equivalent residual income
figure (54%). It has therefore been estimated that a threshold of 39.4% would be appropriate, while this
is to some degree arbitrary, we considered it to be a reasonable given the range of evidence available.
8.18 On the basis of a rent of £1,400 per month, this would leave a residual income of £2,150 (rounded) and
a total household income of £42,615 per annum. Therefore, for the purposes of this assessment it is
estimated that any household with an income below £42,615 would not be able to afford a lower quartile
rent without some degree of subsidy.
24 If 25% equates to £400 then monthly income is £1,600. Once £400 rent is removed the residual income is
£1,200

Wandsworth Local Housing Needs Assessment, December 2020
GL Hearn Page 50 of 176
Wandsworth LHNA
Official
8.19 The 39.4% affordability threshold is specific to the analysis of access to private rented housing and to
rent levels in the Borough. If rent levels were lower, then a lower threshold would be recommended so as
to retain a reasonable balance between housing costs and residual income. Therefore, the same
threshold should not be applied in a blanket manner for all types of affordable housing (for example a
lower threshold is probably appropriate when looking at Social Rented housing).
8.20 Table 8 provides an indication of the affordability thresholds and income levels considered appropriate
based on different cost of housing. This shows for example that a housing cost of £800 per month might
be expected to take up no more than 32.5% of a household income, and that the income would need to
be in excess of around £29,500 per annum for this to be affordable.
Suggested income threshold for different levels of housing cost
Housing cost (£ per month)
% of income Income threshold (per
annum)
£400 25.00% £19,200
£600 29.20% £24,686
£800 32.50% £29,538
£1,000 35.20% £34,065
£1,200 37.50% £38,400
£1,400 39.40% £42,615
£1,467 40.00% £44,010
£1,842 42.00% £52,629
£2,500 50.00% £60,000
Source: GL Hearn
8.21 The table above does not provide information for thresholds above 40% and it is considered that this
should be the maximum proportion of income on housing that can be considered affordable. Therefore,
any housing cost above £1,467 per month should be judged against 40% (and the equivalent income)
when considering affordability.
8.22 Generally, the income required to access owner-occupied housing is higher than that required to rent; the
analysis to follow is therefore based solely on the ability to afford to access private rented housing.
However, the local house prices are important when looking at the extended definition of affordable
housing in NPPF2 and are returned to when looking at this new definition.
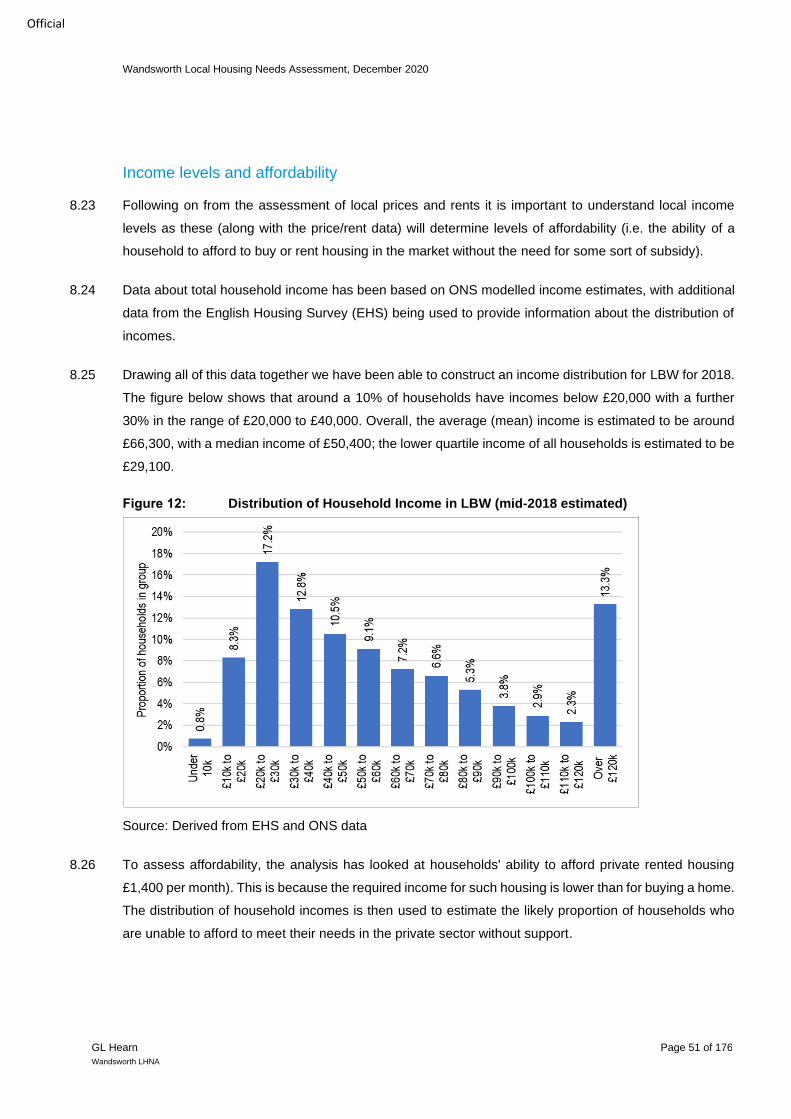
Wandsworth Local Housing Needs Assessment, December 2020
GL Hearn Page 51 of 176
Wandsworth LHNA
Official
Income levels and affordability
8.23 Following on from the assessment of local prices and rents it is important to understand local income
levels as these (along with the price/rent data) will determine levels of affordability (i.e. the ability of a
household to afford to buy or rent housing in the market without the need for some sort of subsidy).
8.24 Data about total household income has been based on ONS modelled income estimates, with additional
data from the English Housing Survey (EHS) being used to provide information about the distribution of
incomes.
8.25 Drawing all of this data together we have been able to construct an income distribution for LBW for 2018.
The figure below shows that around a 10% of households have incomes below £20,000 with a further
30% in the range of £20,000 to £40,000. Overall, the average (mean) income is estimated to be around
£66,300, with a median income of £50,400; the lower quartile income of all households is estimated to be
£29,100.
Figure 12: Distribution of Household Income in LBW (mid-2018 estimated)
Source: Derived from EHS and ONS data
8.26 To assess affordability, the analysis has looked at households' ability to afford private rented housing
£1,400 per month). This is because the required income for such housing is lower than for buying a home.
The distribution of household incomes is then used to estimate the likely proportion of households who
are unable to afford to meet their needs in the private sector without support.
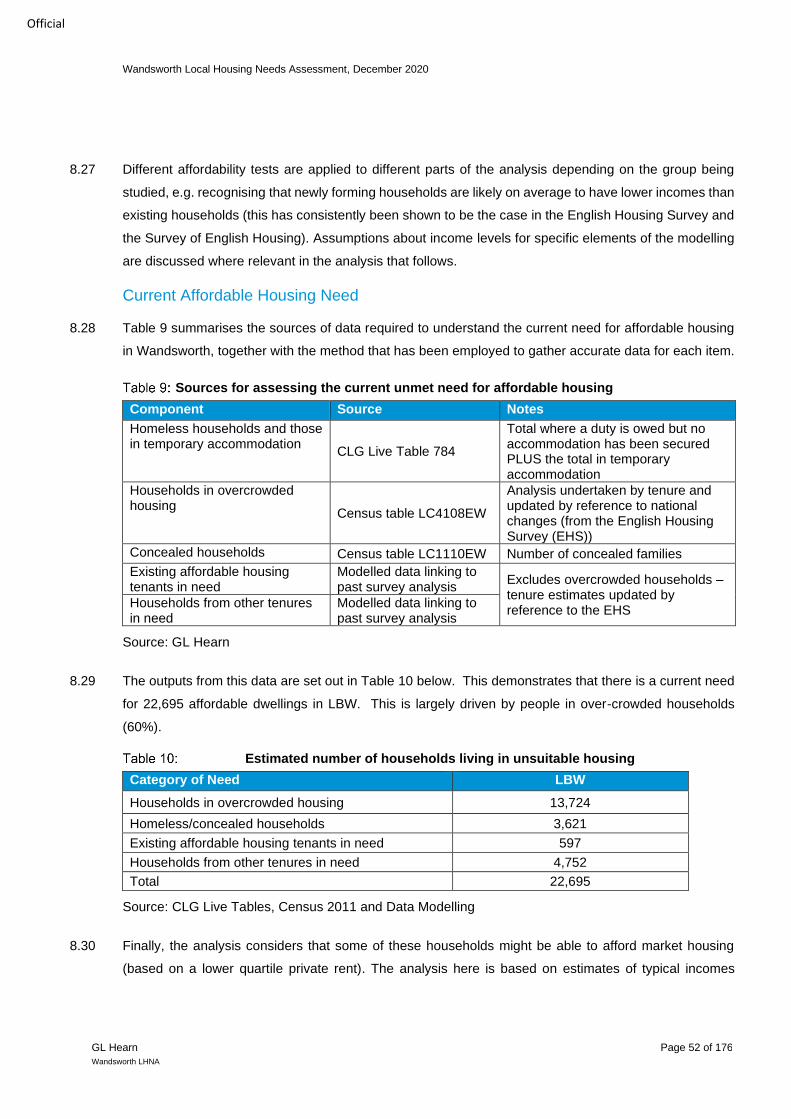
Wandsworth Local Housing Needs Assessment, December 2020
GL Hearn Page 52 of 176
Wandsworth LHNA
Official
8.27 Different affordability tests are applied to different parts of the analysis depending on the group being
studied, e.g. recognising that newly forming households are likely on average to have lower incomes than
existing households (this has consistently been shown to be the case in the English Housing Survey and
the Survey of English Housing). Assumptions about income levels for specific elements of the modelling
are discussed where relevant in the analysis that follows.
Current Affordable Housing Need
8.28 Table 9 summarises the sources of data required to understand the current need for affordable housing
in Wandsworth, together with the method that has been employed to gather accurate data for each item.
Sources for assessing the current unmet need for affordable housing
Component Source Notes
Homeless households and those in temporary accommodation
CLG Live Table 784
Total where a duty is owed but no accommodation has been secured PLUS the total in temporary accommodation
Households in overcrowded housing
Census table LC4108EW
Analysis undertaken by tenure and updated by reference to national changes (from the English Housing Survey (EHS))
Concealed households Census table LC1110EW Number of concealed families
Existing affordable housing tenants in need
Modelled data linking to past survey analysis
Excludes overcrowded households – tenure estimates updated by reference to the EHS
Households from other tenures in need
Modelled data linking to past survey analysis
Source: GL Hearn
8.29 The outputs from this data are set out in Table 10 below. This demonstrates that there is a current need
for 22,695 affordable dwellings in LBW. This is largely driven by people in over-crowded households
(60%).
Estimated number of households living in unsuitable housing
Category of Need LBW
Households in overcrowded housing 13,724
Homeless/concealed households 3,621
Existing affordable housing tenants in need 597
Households from other tenures in need 4,752
Total 22,695
Source: CLG Live Tables, Census 2011 and Data Modelling
8.30 Finally, the analysis considers that some of these households might be able to afford market housing
(based on a lower quartile private rent). The analysis here is based on estimates of typical incomes

Wandsworth Local Housing Needs Assessment, December 2020
GL Hearn Page 53 of 176
Wandsworth LHNA
Official
currently within the social rented sector. Table 11 presents the number to take forward in affordability
modelling by tenure type.
Estimated current affordable housing need for LBW
Unsuitable housing (taken forward for affordability test)
% Unable to afford market housing (without subsidy)
Revised Gross Need (including affordability)
14,698 56.90% 8,367
Source: CLG Live Tables, Census 2011 and Data Modelling
Newly-forming households
8.31 The number of newly-forming households has been estimated through demographic modelling with an
affordability test also being applied. This has been undertaken by considering the changes in households
in specific 5-year age bands relative to numbers in the age band below, 5 years previously, to provide an
estimate of gross household formation.
8.32 The numbers of newly-forming households are limited to households forming who are aged under 45 –
this is consistent with CLG guidance (from 2007) which notes after age 45 that headship (household
formation) rates ‘plateau’. There may be a small number of household formations beyond age 45 (e.g.
due to relationship breakdown) although the number is expected to be fairly small when compared with
formation of younger households.
8.33 In looking at the likely affordability of newly-forming households, data has been drawn from previous
surveys. This establishes that the average income of newly-forming households is around 84% of the
figure for all households. This figure is remarkably consistent across areas (and is also consistent with
analysis of English Housing Survey data at a national level).
8.34 The analysis has therefore adjusted the overall household income data to reflect the lower average
income for newly-forming households. The adjustments have been made by changing the distribution of
income by bands such that average income level is 84% of the all household average. In doing this it is
possible to calculate the proportion of newly forming households unable to afford market housing without
any form of subsidy (such as LHA/HB).
8.35 The assessment suggests that overall around half of newly-forming households (51%) will be unable to
afford market housing (to rent) and that a total of 2,068 new households will have a need on average in
each year to 2037. These findings are summarised in Table 12 below.

Wandsworth Local Housing Needs Assessment, December 2020
GL Hearn Page 54 of 176
Wandsworth LHNA
Official
Estimated affordable housing need from newly forming households (per
annum)
Number of new households (Aged Under 45)
% Unable to afford Annual newly-forming households unable to afford rent
4,054 51.0% 2,068
Source: Projected Modelling/ affordability analysis
Existing households falling into affordable housing need
8.36 The second element of newly arising need is existing households falling into need. To assess this,
information from CoRe has been used. This looked at households who have been housed over the past
three years – this group will represent the flow of households onto the Housing Register over this period.
8.37 From this newly forming households (e.g. those currently living with their family) have been discounted
as well as households who have transferred from another social/affordable rented property. An
affordability test has also been applied.
8.38 The numbers over this period or indeed in future could be influenced by changes to government policy or
if there is a substantial increase in unemployment resulting from the closure of a major employer, although
this is unlikely in Wandsworth.
8.39 This method for assessing existing households falling into need is consistent with the 2007 SHMA
guidance which on page 46 states
‘Partnerships should estimate the number of existing households falling into need each year by
looking at recent trends. This should include households who have entered the housing register
and been housed within the year as well as households housed outside of the register (such as
priority homeless household applicants)’.
8.40 Following this analysis through for Wandsworth suggests a need arising from 560 existing households
each year from 2019 to 2037, or a total of 10,076 over the period.
Supply of affordable housing
8.41 The future supply of affordable housing is the flow of affordable housing arising from the existing stock
that is available to meet future need. This focuses on the annual supply of social/affordable rent through
re-lets.
8.42 The Planning Practice Guidance suggests that the estimate of likely future relets from the social rented
stock should be based on past trend data which can be taken as a prediction for the future. Information

Wandsworth Local Housing Needs Assessment, December 2020
GL Hearn Page 55 of 176
Wandsworth LHNA
Official
from the CoRe system has been used to establish past patterns of social housing turnover, along with
data from the LBW about past lettings within social rented stock.
8.43 The figures include general needs and supported lettings25 but exclude lettings of new properties and also
exclude an estimate of the number of transfers from other social rented homes. These exclusions are
made to ensure that the figures presented reflect re-lets from the existing stock.
8.44 Table 13 below sets out these calculations. Of the 1,433 lettings in the three years (2015/16-2017/18),
1,281 were lettings from existing stock. Of these, 59.7%, were as a result of tenants quitting their home
and not transferring to another Social or Affordable Rented dwelling. This equates to a total supply of
affordable housing each year of 765 dwellings.
Past social/affordable rented housing re-let supply (per annum) (2015/16-
2017/18)
General Needs Supported Housing Total
Total Lettings 1,005 429 1,433
% as Non-New Build 89.80% 88.40% 89.40%
Lettings in Existing Stock 902 379 1,281
% Non-Transfers 59.80% 59.60% 59.70%
Lettings to New Tenants 539 226 765
Source: CoRe and LAHS
8.45 On the basis we have assumed that 765 units of social/affordable rented housing are likely to become
available each year in future.
8.46 The PPG model also includes the bringing back of vacant homes into use and the pipeline of affordable
housing as part of the supply calculation. These have however not been included within the modelling in
this report.
8.47 Firstly, there is no evidence of any substantial stock of vacant homes (over and above a level that might
be expected to allow movement in the stock) – as of 2018, CLG Council Tax Base data shows 173 long
term vacant general needs homes in the Borough.
8.48 Secondly, in relation to the pipeline supply, it is not considered appropriate to include this as to net off
new housing from the needs analysis would be to fail to show the full extent of the need for this
assessment. Although in monitoring it will be important to net off these dwellings as they are completed.
25 Housing targeted at a specific client group with a tangible property features or services associated designed or designated for a
particular client group.
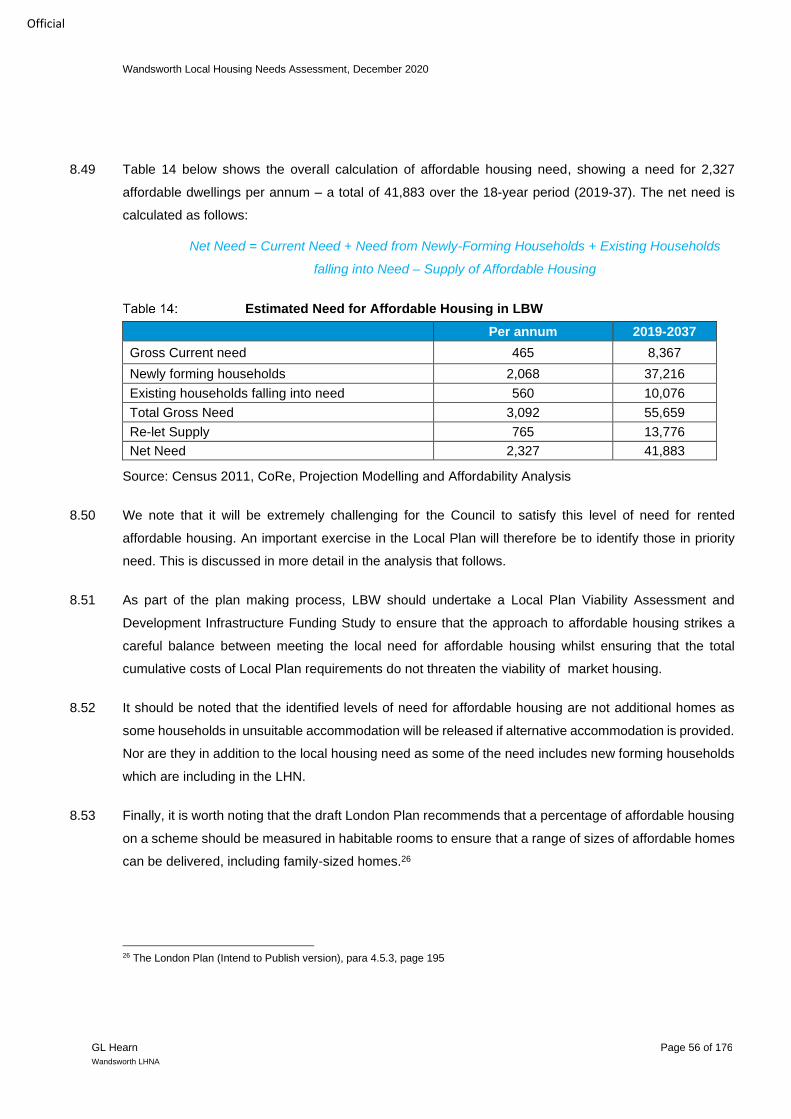
Wandsworth Local Housing Needs Assessment, December 2020
GL Hearn Page 56 of 176
Wandsworth LHNA
Official
8.49 Table 14 below shows the overall calculation of affordable housing need, showing a need for 2,327
affordable dwellings per annum – a total of 41,883 over the 18-year period (2019-37). The net need is
calculated as follows:
Net Need = Current Need + Need from Newly-Forming Households + Existing Households
falling into Need – Supply of Affordable Housing
Estimated Need for Affordable Housing in LBW
Per annum 2019-2037
Gross Current need 465 8,367
Newly forming households 2,068 37,216
Existing households falling into need 560 10,076
Total Gross Need 3,092 55,659
Re-let Supply 765 13,776
Net Need 2,327 41,883
Source: Census 2011, CoRe, Projection Modelling and Affordability Analysis
8.50 We note that it will be extremely challenging for the Council to satisfy this level of need for rented
affordable housing. An important exercise in the Local Plan will therefore be to identify those in priority
need. This is discussed in more detail in the analysis that follows.
8.51 As part of the plan making process, LBW should undertake a Local Plan Viability Assessment and
Development Infrastructure Funding Study to ensure that the approach to affordable housing strikes a
careful balance between meeting the local need for affordable housing whilst ensuring that the total
cumulative costs of Local Plan requirements do not threaten the viability of market housing.
8.52 It should be noted that the identified levels of need for affordable housing are not additional homes as
some households in unsuitable accommodation will be released if alternative accommodation is provided.
Nor are they in addition to the local housing need as some of the need includes new forming households
which are including in the LHN.
8.53 Finally, it is worth noting that the draft London Plan recommends that a percentage of affordable housing
on a scheme should be measured in habitable rooms to ensure that a range of sizes of affordable homes
can be delivered, including family-sized homes.26
26 The London Plan (Intend to Publish version), para 4.5.3, page 195

Wandsworth Local Housing Needs Assessment, December 2020
GL Hearn Page 57 of 176
Wandsworth LHNA
Official
How Much Should Affordable Rented Housing Cost?
8.54 Rents for properties let at ‘social rent’ (which constitute a majority of rented social housing properties) are
set centrally based on a formula set by government. This creates a ‘formula rent’ for each property, which
is calculated based on the relative value of the property, relative local income levels, and the size of the
property. An aim of this formula-based approach is to ensure that similar rents are charged for similar
social rent properties27.
8.55 The analysis above has studied the overall need for affordable housing using a well-established model.
This model focusses on households who cannot afford anything in the market (i.e. cannot rent or buy).
These households are most likely to have a need for rented housing and below is an analysis that sets
out the appropriate Affordable Rent for different sizes of accommodation based on local incomes and
housing costs.
8.56 It is worth noting that the rent charged for Social Rented dwellings is likely to be substantially less that
than for Affordable Rent (at 80% of market rents), calculated according to the rent formula28 described
above. We have calculated in the approximate rents levels for Social Rented homes of different sizes,
and these are set out in Table 15 below.
Rents for Social Rented dwellings
1-Bedroom 2-Bedroom 3-Bedroom
£566 £626 £679
Source: GL Hearn Calculations
8.57 The analysis essentially considers what might be a “Living Rent”. These calculations are based on
research by JRF/Savills29 and use the following methodology:
• Annual Survey of Hours and Earnings (ASHE) lower quartile earnings;
• Adjustment for property size by recognised equivalence model;
• Starting rent set at 28% of net earnings; and
• Rent set at Local Housing Allowance (LHA) limits where calculations show a higher figure.
8.58 The analysis shows rents starting at about £600 for a 1-bedroom home in Wandsworth, rising to £780 for
a 2-bedroom dwelling and £959 for homes with 3-bedrooms (the Living Rent method only goes up to 3-
bedrooms).
27 MHCLG, Policy statement on rents for social housing, page 4 28 Ibid, page 6 29http://pdf.savills.com/documents/Living%20Rents%20Final%20Report%20June%202015%20-%20with%20links%20-%2019%2
006%202015.pdf

Wandsworth Local Housing Needs Assessment, December 2020
GL Hearn Page 58 of 176
Wandsworth LHNA
Official
Living rents (per month) (2018 base)
Geography 1-Bedroom 2-Bedroom 3-Bedroom
LBW £600 £780 £959
Inner south West London £1,133 £1,390 £1,630
Outer South West London £964 £1,216 £1,460
Source: ASHE and Living Rents Methodology
8.59 These figures represent 48% of the lower quartile private rent for 1-bedroom homes and 52% of the rent
for both 2 and 3-bedroom homes. None of these figures have been capped by LHA as the maximum LHA
is higher than the Living Rent for all sizes and locations. The needs of households requiring homes at
Living Rents can therefore be met by the London Affordable Rent tenure, which is 52% higher than the
average 2017/18 council rent and 32% higher than the average 2018 housing association rents, but
approximately 50% lower than average market rent in London30. This is discussed in more detail in the
analysis that follows (8.102 – 8.133).
8.60 It is not recommended that the authority implement policies which restrict rents of all types of affordable
rented products to London Affordable Rent given that it would be unrealistic to do so. However, it is not
sensible to charge affordable rent above the LHA limits set for the Central London Broad Rental Market
Area (see table below). Any rents set in excess of LHA would mean households having to top up their
rent from other income sources.
8.61 As noted, there is a case for ensuring that rents are capped at the maximum amount of benefit able to be
claimed. The issue of LHA limits should be a key consideration when setting rent levels for any new
developments as should the BRMA in which any specific scheme sits.
Maximum Local Housing Allowance (Housing Benefit) by location and
property size (April 2018)
Central London BRMA
Room £629
1-bedroom £1,167
2-bedrooms £1,353
3-bedrooms £1,586
4-bedrooms £1,866
Source: Valuation Office Agency
30 https://www.london.gov.uk/sites/default/files/homesforlondoners-affordablehomesprogrammefundingguidance.pdf

Wandsworth Local Housing Needs Assessment, December 2020
GL Hearn Page 59 of 176
Wandsworth LHNA
Official
8.62 It is recognised that charging at living rent levels (or London Affordable Rent) will reduce the viability of
affordable housing delivery and therefore the number of affordable homes provided. Therefore, LBW
should employ an approach that strikes a balance between the viability of development and local housing
needs. This might be achieved by the provision of intermediate tenures (such as London Living Rent),
which have the potential to meet the needs of lower income households.
8.63 In terms of other rented tenures (such as Affordable Rent at 80% of market rents), the LBW should ensure
that rents do not exceed the LHA limits within the Broad Rental Market Area that the site falls. In
circumstances where this limit would be exceeded, greater discounts than 20% on Open Market Values
should be secured to ensure a larger number of households can afford intermediate rent tenures. When
intermediate rented tenures are proposed as part of development proposals, LBW should require
applicants to demonstrate that the rented products would meet the local housing need on a case by case
basis.
Affordable Housing (Expanded NPPF Definition)
8.64 As noted earlier, Annex 2 of the 2019 NPPF introduces a new category of household in affordable housing
need i.e. “housing that provides a subsidised route to home ownership”. It is considered that households
falling into the definition would be suitable for Starter Homes, Discounted Market Sales housing and Other
Affordable Routes to Home Ownership (such as shared ownership and rent to buy) might also be
appropriate.
8.65 This section considers the level of need for these types of dwellings in LBW. The NPPF states “Where
major development involving the provision of housing is proposed, planning policies and decisions should
expect at least 10% of the homes to be available for affordable home ownership, unless this would exceed
the level of affordable housing required in the area, or significantly prejudice the ability to meet the
identified affordable housing needs of specific groups.”31
8.66 The Planning Practice Guidance of February 2019 confirms a widening definition of those to be
considered as in affordable need; now including “households from other tenures in need and those that
cannot afford their own homes, either to rent, or to own, where that is their aspiration.”32 The accepted
understanding of this requirement is that plan-makers now need to quantify need for tenures that offer an
affordable route to home-ownership. However, at the time of writing, there is no guidance about how this
may be done.
31 National Planning Policy Framework, para 64 32 PPG Paragraph: 020 Reference ID: 2a-020-20190220
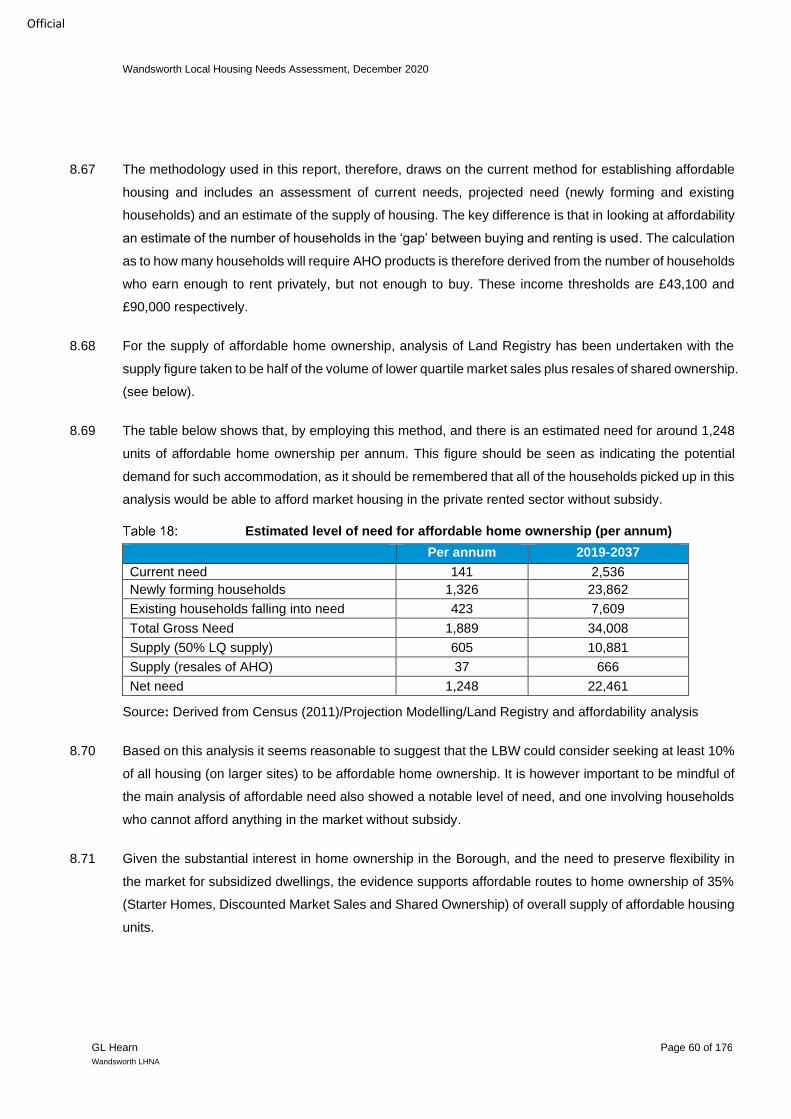
Wandsworth Local Housing Needs Assessment, December 2020
GL Hearn Page 60 of 176
Wandsworth LHNA
Official
8.67 The methodology used in this report, therefore, draws on the current method for establishing affordable
housing and includes an assessment of current needs, projected need (newly forming and existing
households) and an estimate of the supply of housing. The key difference is that in looking at affordability
an estimate of the number of households in the ‘gap’ between buying and renting is used. The calculation
as to how many households will require AHO products is therefore derived from the number of households
who earn enough to rent privately, but not enough to buy. These income thresholds are £43,100 and
£90,000 respectively.
8.68 For the supply of affordable home ownership, analysis of Land Registry has been undertaken with the
supply figure taken to be half of the volume of lower quartile market sales plus resales of shared ownership.
(see below).
8.69 The table below shows that, by employing this method, and there is an estimated need for around 1,248
units of affordable home ownership per annum. This figure should be seen as indicating the potential
demand for such accommodation, as it should be remembered that all of the households picked up in this
analysis would be able to afford market housing in the private rented sector without subsidy.
Estimated level of need for affordable home ownership (per annum)
Per annum 2019-2037
Current need 141 2,536
Newly forming households 1,326 23,862
Existing households falling into need 423 7,609
Total Gross Need 1,889 34,008
Supply (50% LQ supply) 605 10,881
Supply (resales of AHO) 37 666
Net need 1,248 22,461
Source: Derived from Census (2011)/Projection Modelling/Land Registry and affordability analysis
8.70 Based on this analysis it seems reasonable to suggest that the LBW could consider seeking at least 10%
of all housing (on larger sites) to be affordable home ownership. It is however important to be mindful of
the main analysis of affordable need also showed a notable level of need, and one involving households
who cannot afford anything in the market without subsidy.
8.71 Given the substantial interest in home ownership in the Borough, and the need to preserve flexibility in
the market for subsidized dwellings, the evidence supports affordable routes to home ownership of 35%
(Starter Homes, Discounted Market Sales and Shared Ownership) of overall supply of affordable housing
units.

Wandsworth Local Housing Needs Assessment, December 2020
GL Hearn Page 61 of 176
Wandsworth LHNA
Official
8.72 However, bearing in mind the substantial need for affordable rented dwellings, it might not be appropriate
to increase the provision of affordable home ownership products (Starter Homes, Discounted Market
Sales and Shared Ownership) substantially above the 35% figure as this would impact the delivery of
affordable housing for those on lower incomes. The 35% recommended figure, however, does not include
the London Living Rent tenure. Although the emerging London Plan classifies it as an intermediate tenure,
it provides a route to home ownership, and importantly it has the potential to meet the housing need of
households with income of £43,100 or less.
LBW’s Affordable Home Ownership register
8.73 LBW maintains a list that allows residents to notify the Council of their interest in home ownership. This
amounts to an alternative means of quantifying need for affordable home ownership (AHO) products. As
at 31st March 2019 there were 4,363 residents registered on the LBW’s Home Ownership listing interested
in acquiring low cost home ownership33.
8.74 Drawing on the data captured on the Council’s list, LBW has commented as follows:
“It should be noted that whilst some households on the home ownership list may have an aspiration
to own, they may not at the present be in a position to purchase. The average income for those on
the Home Ownership Team list is £37,700 per annum. Analysis of those registered indicates,
therefore, that the Council should continue to secure as far as possible the delivery of low-cost
homeownership housing affordable to a spread of incomes.”34
33 Ibid, page 12 (para 38) 34 LBW, Report on the Affordable Housing Development Programme 2018/19, Paper No. 19-167, page 39 (para 39)

Wandsworth Local Housing Needs Assessment, December 2020
GL Hearn Page 62 of 176
Wandsworth LHNA
Official
Figure 13: Housing affordability by tenure
Source: Various
8.75 It is therefore worth considering the affordability of homes for households on the average income of
£37,700 on LBW’s Home Ownership listing (HOL). The figure above suggests households with this level
of income would not be able to buy any size of home with a mortgage.
8.76 The tenures and sizes that would be available to them however are rooms, studio and 1 bed flats in the
PRS and any size of Social Rent dwelling. Assuming ineligibility for Social Rent dwellings, and in order to
avoid PRS, they can afford intermediate affordable housing options in the form of a 1 bed Shared
Ownership unit, and any size of London Living Rent unit. These provide a route to home ownership.
8.77 Taking into account that the income required to afford London Living Rent dwellings in LBW (£24,000) is
lower than the average income of those on the Wandsworth’s Home Ownership list, it may be appropriate
to increase the provision of affordable home ownership products over the recommended 35% figure. In
this case, LBW would need to ensure that the affordable home ownership tenures are focused on London
Living Rent dwellings to cater for the needs of lower income households.
Essential Local Workers
8.78 The NPPF defines Essential Local Workers (ELW) as “public sector employees who provide frontline
services in areas including health, education and community safety – such as NHS staff, teachers, police,
£0
£2,000
£4,000
£6,000
£8,000
£10,000
£12,000
£14,000
£16,000
£18,000F
lat
Te
rra
ce
Se
mi-
De
tache
d
De
tach
ed
Ro
om
On
ly
Stu
dio
1 B
ed
2 B
ed
s
3 B
ed
s
4+
Be
ds
1 B
ed
2 B
ed
s
3 B
ed
s
4+
Be
ds
1 B
ed
2 B
ed
s
3 B
ed
s
1 B
ed
2 B
ed
s
3 B
ed
s
For sale PRS Sharedownership
Socialrent
Affordablerent
Monthly Housing Cost
Income required
HOL (avg)

Wandsworth Local Housing Needs Assessment, December 2020
GL Hearn Page 63 of 176
Wandsworth LHNA
Official
firefighters and military personnel, social care and childcare workers.”35 The government, in arriving at a
definition of affordable housing, notes that these tenures enable local authorities to support the provision
of dwellings for such workers.
8.79 They are important economically in providing the social infrastructure which enables business to flourish.
Data on key workers can also act as a proxy for others in the private sector (often providing outsourced
public services) on lower wages or salaries, who will face the same challenges in managing household
finances.
8.80 The table below provides a rough guide to the pay for three types of essential local workers, nurses,
teachers and police officers. For each profession, two grades have been identified, a junior member with
around 3 years' experience and a more senior colleague.
8.81 Within this group, the salary range is between £26,970 per annum (pa) and £59,802 pa. The average
monthly salary for a junior member is £2,512 and for a senior £4,366. The Affordability Ratio (AR) is also
noted for these groups based on the purchase price in Wandsworth of a lower quartile dwelling valued at
£404,000.
8.82 The AR ranges from 14.98 for a nurse to 6.76 for a teacher who has achieved middling seniority. This
indicates that no essential local workers would be able to afford to buy a home in Wandsworth on the
strength of their salary alone, although the more senior category of staff would be able to buy a dwelling
valued at around £400,000 assuming they were able to raise a deposit worth 10% of the value of the
property.
35 National Planning Policy Framework, Glossary, page

Wandsworth Local Housing Needs Assessment, December 2020
GL Hearn Page 64 of 176
Wandsworth LHNA
Official
Essential local workers, pay and affordability of entry-level properties
Profession Type Assumptions Annual salary
AR
Nurse
Nurse Band 5 with 3-4 years'
experience £26,970 14.98
Advanced nurse Band 7 with 7-8 years'
experience £44,503 9.08
Teacher
Teacher 3-4 year's experience
working in London £36,000 11.22
Leading practitioner Middle seniority £59,802 6.76
Police officer
Constable Pay point 4 (3 years'
experience) £27,471 14.71
Inspector Pay point 1 £52,863 7.64
Source: Various36
8.83 The figure below provides a graphic representation as to the affordability of different homes by size and
tenure for essential local workers based on the average income for junior and senior members of the
three professions considered above. Where the horizontal lines (income at different points) is above the
orange bar (cost of housing) this is an affordable tenure and size for that particular income and vice versa.
8.84 This figure shows that junior members will be able to afford Social Rented dwellings (all sizes), Affordable
Rent dwellings (1 and 2 bed units) and a “room only” or (at a push) a studio in the PRS.
8.85 It is feasible, therefore, for junior colleagues to access London Living Rent as a route to home ownership
if they wish given the intention of the GLA that this tenure should be based on sub-market rents to allow
savings to go towards a deposit for a home ownership product.).
8.86 As noted earlier, relatively senior members of the profession are able to afford entry-level for sale
dwellings assuming they are able to raise a deposit. They are also able to afford most other tenures and
sizes of home, apart from 4 bedroom dwellings in the PRS and Shared Ownership tenures.
8.87 Essential local workers should therefore be able to either buy once they have reached a certain level of
seniority (with 7-10 years’ experience), although the size of home they may be able to buy with a mortgage
36 https://www.nurses.co.uk/careers-hub/nursing-pay-guide/#nhs-pay-table-agenda-for-change-2020-21 (visited 02/06/20)
https://getintoteaching.education.gov.uk/teachers-salary-and-teaching-benefits/teachers-pay-scale- salary#:~:text=Teachers'%20salaries,-When%20you%20choose&text=As%20a%20newly%20qualified%20teacher,a%20headteacher%2C%20in%20inner%20London (visited 02/06/20) https://www.policeoracle.com/pay_and_conditions/police_pay_scales.html (visited 02/06/20)
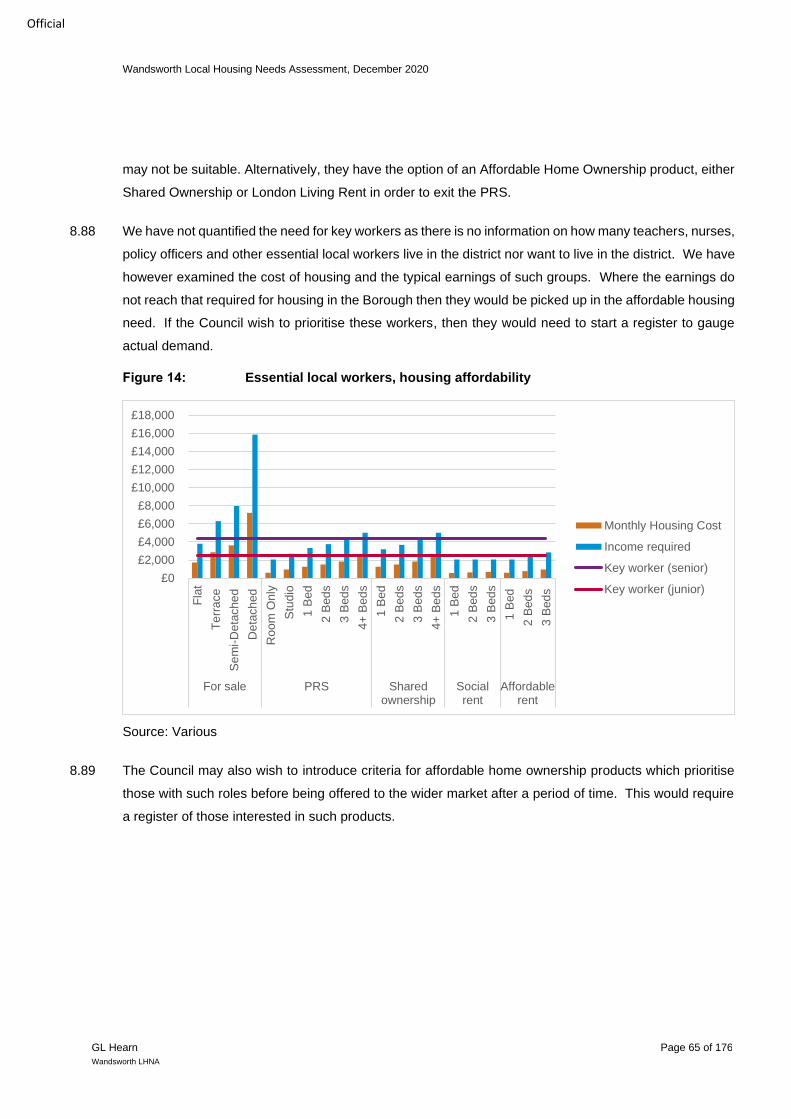
Wandsworth Local Housing Needs Assessment, December 2020
GL Hearn Page 65 of 176
Wandsworth LHNA
Official
may not be suitable. Alternatively, they have the option of an Affordable Home Ownership product, either
Shared Ownership or London Living Rent in order to exit the PRS.
8.88 We have not quantified the need for key workers as there is no information on how many teachers, nurses,
policy officers and other essential local workers live in the district nor want to live in the district. We have
however examined the cost of housing and the typical earnings of such groups. Where the earnings do
not reach that required for housing in the Borough then they would be picked up in the affordable housing
need. If the Council wish to prioritise these workers, then they would need to start a register to gauge
actual demand.
Figure 14: Essential local workers, housing affordability
Source: Various
8.89 The Council may also wish to introduce criteria for affordable home ownership products which prioritise
those with such roles before being offered to the wider market after a period of time. This would require
a register of those interested in such products.
£0
£2,000
£4,000
£6,000
£8,000
£10,000
£12,000
£14,000
£16,000
£18,000
Fla
t
Te
rra
ce
Se
mi-
Deta
che
d
Deta
ch
ed
Roo
m O
nly
Stu
dio
1 B
ed
2 B
ed
s
3 B
ed
s
4+
Be
ds
1 B
ed
2 B
ed
s
3 B
ed
s
4+
Be
ds
1 B
ed
2 B
ed
s
3 B
ed
s
1 B
ed
2 B
ed
s
3 B
ed
s
For sale PRS Sharedownership
Socialrent
Affordablerent
Monthly Housing Cost
Income required
Key worker (senior)
Key worker (junior)

Wandsworth Local Housing Needs Assessment, December 2020
GL Hearn Page 66 of 176
Wandsworth LHNA
Official
The Cost of Affordable Home Ownership Homes
8.90 As part of the LHNA, it is important to identify what the cost of affordable home ownership should be. In
this section we look at discounted market sales housing and Shared Ownership dwellings.
Discounted market sales housing
8.91 The Annex 2 definition suggests that such housing should be made available at a discount of at least 20%
from Open Market Value (OMV).
8.92 The problem with having a percentage discount is that it is possible in some locations or types of property
that such a discount still means housing is more expensive than that typically available in the open market.
Particularly if that discount is applied to new-build accommodation which itself already attracts a premium.
8.93 The principle purpose of AHO products is to provide a pathway to ownership from other tenures, in
particular PRS. It is therefore important that AHO products are priced at a level such that they are
competitive when compared with the cost of an equivalent product in the PRS.
8.94 The preferred approach in this report is therefore to set out a series of affordable purchase costs for
different sizes of accommodation. These are based on equivalising the lower quartile private rent figures
into a house price so that the sale price will meet the needs of all households in the gap between buying
and renting. Setting higher prices would mean that such housing would not be available to many
households for whom the Government is seeking to provide an ‘affordable’ option.
8.95 Table 19 sets out these figures and suggest that numbers are not set at any more than the midpoint of
the range. We also note that for 4+ bedroom homes that the income required may well be in excess of
the typical £90,000 suggested by the GLA. These figures can be monitored and updated every six months
by reference to VOA data37.
Affordable home ownership prices (2018 base)
1-Bedroom 2-Bedroom 3-Bedroom 4-Bedroom
Lower limit £190,000 £228,000 £280,000 £380,000
Upper limit £330,000 £470,000 £570,000 £775,000
Midpoint (maximum) £260,000 £349,000 £425,000 £577,500
Source: Derived from VOA and Land Registry data
37 https://www.ons.gov.uk/economy/inflationandpriceindices/bulletins/indexofprivatehousingrentalprices/march2018/relateddata.
Wandsworth Local Housing Needs Assessment, December 2020
GL Hearn Page 67 of 176
Wandsworth LHNA
Official
8.96 As demonstrated, we do not believe that 1-bedroom affordable home ownership products should exceed
£260,000 rising to £577,500 for a 4-bedroom unit.
Shared Ownership
8.97 The same can also be done for shared ownership scheme although by their nature this is a slightly more
complex approach. For example, the cost would be dependent on the percentage purchased or rent
being charged.
8.98 The calculations below present the maximum equity share for housing to be affordable (i.e. to achieve a
level of outgoings the same as accessing the bottom end of the private rented sector). For the purposes
of the modelling, the following have been assumed:
• OMV at LQ price plus 10% (reflecting likelihood that newbuild homes will have a premium
attached and that they may well be priced slightly above a LQ level);
• 10% deposit;
• Rent at 2.75% pa on unsold equity;
• Repayment mortgage over 25-years at 4%; and
• Service charge of £100 per month for flatted development (assumed to be 1- and 2-bedroom
homes)
8.99 The figures suggest that households will struggle to afford Shared Ownership across all sizes of dwelling
where the equity share is greater than 36%.
Estimate affordable equity share by size of dwelling
1-Bedroom 2-Bedroom 3-Bedroom 4-Bedroom
OMV £363,000 £517,000 £627,000 £852,500
Share 36% 17% 26% 26%
Equity bought £129,228 £87,373 £164,588 £222,076
Mortgage needed £116,305 £78,636 £148,129 £199,869
Monthly cost of mortgage £614 £415 £782 £1,055
Retained equity £233,772 £429,627 £462,413 £630,424
Monthly rent on retained equity £536 £985 £1,060 £1,445
Service charge £100 £100 £0 £0
Total cost £1,250 £1,500 £1,842 £2,500
Source: GLH Modelling
8.100 As noted, in order to meet the target market LBW could seek to engage with registered providers to
ensure shared ownership products are made available to those households earning more than that to
rent privately (>£42,615) but below the maximum shared ownership thresholds set out by the GLA above
Wandsworth Local Housing Needs Assessment, December 2020
GL Hearn Page 68 of 176
Wandsworth LHNA
Official
(£90,000). In such a way, AHO tenures will be effective in providing an alternative tenure to PRS for
those who seek it.
Other forms of affordable tenures
8.101 The GLA (including in the draft London Plan) sets out a range of different affordable tenures and the
eligibility for different types of home (often based on a maximum household income). Three tenures are
a ‘Mayor’s preferred affordable product’ and these are discussed below. The three tenures are:
• London Affordable Rent
• London Living Rent
• London Shared Ownership.
8.102 London Affordable Rent is a rental product for households on a low income with the rent level effectively
being equivalent to a social rent. This is a different definition to the NPPF which defines affordable rent
as up to 80 per cent of market rent. The Mayor recognises that to make sure rents in London are ‘genuinely
affordable’ the benchmarks need to be set substantially below this level (at approximately 50%).
8.103 The London Living Rent (LLR) is classed in the draft London Plan as an “intermediate” product, and offers
households on average incomes a lower rent with the aim of enabling them to save for a deposit as a
step towards home-ownership. LLR levels are set at a ward level with figures published by the GLA on
an annual basis. Where funded by the GLA, LLR is intended to be a Rent to Buy product, with sub-market
rents on time-limited tenancies. LLR is available to households with an income of up to £60,000.
8.104 London Shared Ownership, also an intermediate product, allows London households who would struggle
to buy on the open market the option to purchase a share in a new home and pay a low rent on the
remaining, unsold, share. London Shared Ownership is available to households with an income of up to
£90,000.
8.105 The emerging London Plan also allows for other affordable housing products as long as they meet a
broad definition of affordable housing and are ‘genuinely affordable’. For dwellings to be considered as
affordable, annual housing costs should be no more than 40% of a household’s net income. However,
for different areas with different incomes the threshold will be different.
8.106 In the context of the needs analysis in this report, it is suggested that both London Affordable Rent and
London Living Rent tenures would meet the needs identified in the affordable housing need (standard
definition) analysis above; the affordable rent product (due to lower rents) would, however, be potentially
available to a greater number of households. The London Shared Ownership tenure is considered to be

Wandsworth Local Housing Needs Assessment, December 2020
GL Hearn Page 69 of 176
Wandsworth LHNA
Official
within the widened definition of affordable housing and to some extent the LLR overlaps between the two
categories of need.
8.107 In terms of developing an affordable housing policy, Policy H6 of the Intend to Publish London Plan says
the following:
The following split of affordable products should be applied to development:
1) a minimum of 30 per cent low cost rented homes, as either London Affordable Rent or
Social Rent, allocated according to need and for Londoners on low incomes
2) a minimum of 30 per cent intermediate products which meet the definition of genuinely
affordable housing, including London Living Rent and London Shared ownership
3) the remaining 40 per cent to be determined by the borough as low cost rented homes
or intermediate products (defined in Part A1 and Part A2) based on identified need
8.108 Based on this, it will be necessary for the LBW to consider what form of housing the final 40% should
take. As an overarching principle, the Council should have regard to the evidence of need set out in this
report. However, the following guidance takes into account the distribution of income to show an
appropriate split of affordable tenures within the three types set out in Policy H6.
8.109 The distribution of household income is set out in the figure below. The median income is around £50,000,
this suggests that a substantial proportion of households in Wandsworth are eligible for some form of
affordable housing based on income criteria alone.
Figure 15: Distribution of Household Income (mid-2018 estimate
Source: Derived from EHS and ONS data
0
5000
10000
15000
20000
25000
30000
No h
ousehold
s
Income distribution
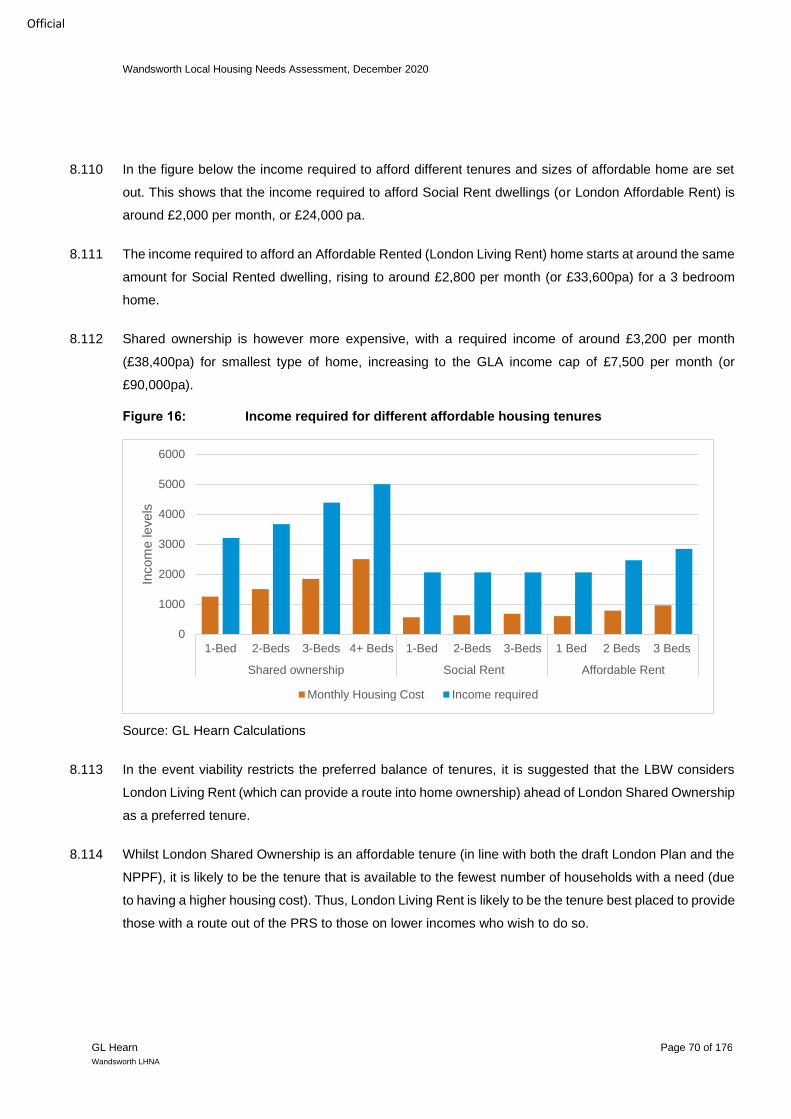
Wandsworth Local Housing Needs Assessment, December 2020
GL Hearn Page 70 of 176
Wandsworth LHNA
Official
8.110 In the figure below the income required to afford different tenures and sizes of affordable home are set
out. This shows that the income required to afford Social Rent dwellings (or London Affordable Rent) is
around £2,000 per month, or £24,000 pa.
8.111 The income required to afford an Affordable Rented (London Living Rent) home starts at around the same
amount for Social Rented dwelling, rising to around £2,800 per month (or £33,600pa) for a 3 bedroom
home.
8.112 Shared ownership is however more expensive, with a required income of around £3,200 per month
(£38,400pa) for smallest type of home, increasing to the GLA income cap of £7,500 per month (or
£90,000pa).
Figure 16: Income required for different affordable housing tenures
Source: GL Hearn Calculations
8.113 In the event viability restricts the preferred balance of tenures, it is suggested that the LBW considers
London Living Rent (which can provide a route into home ownership) ahead of London Shared Ownership
as a preferred tenure.
8.114 Whilst London Shared Ownership is an affordable tenure (in line with both the draft London Plan and the
NPPF), it is likely to be the tenure that is available to the fewest number of households with a need (due
to having a higher housing cost). Thus, London Living Rent is likely to be the tenure best placed to provide
those with a route out of the PRS to those on lower incomes who wish to do so.
0
1000
2000
3000
4000
5000
6000
1-Bed 2-Beds 3-Beds 4+ Beds 1-Bed 2-Beds 3-Beds 1 Bed 2 Beds 3 Beds
Shared ownership Social Rent Affordable Rent
Incom
e levels
Monthly Housing Cost Income required

Wandsworth Local Housing Needs Assessment, December 2020
GL Hearn Page 71 of 176
Wandsworth LHNA
Official
8.115 The Council does have the opportunity, however, to address the affordability of Shared Ownership
dwellings through policy. LWB’s current Intermediate Housing Policy has been in place since January
2011 with the aim of ensuring that Shared Ownership dwellings are developed and sold in the Borough
are targeted to local residents and those working in the Borough. It also ensures that homes are made
available to those on a spread of incomes (one bedroom units are affordable to households with an
income of £48,500, two bedroom units to those with an income of £58,500 and three bedroom homes to
those with an income of £65,000). 38
8.116 It has been observed that Housing Associations have been able to sell Shared Ownership dwellings at
prices consistent with LBW’s target incomes without breaching the GLA policy that housing costs
(including mortgage, rent and service charges) are expenditure equates to no more than 40% net income
or 70% of gross income.
8.117 If implemented in accordance with the existing adopted policy, Shared Ownership would meet the needs
of working households on low to middle incomes. These households do not have priority for social housing
and are unable to afford most forms of market housing.
8.118 The aim of the Council should be to support a broad range of tenures that responds to demographic
trends and helps maintain mixed and balanced communities.
8.119 The figure below provides a graphic representation of the affordability of different homes by size and
tenure. Where the horizontal lines (income at different points) is above the orange bar (cost of housing)
this is an affordable tenure and size for that particular income and vice versa.
38 LBW Housing and Regeneration overview and scrutiny committee, 24/06/19, page 12,15

Wandsworth Local Housing Needs Assessment, December 2020
GL Hearn Page 72 of 176
Wandsworth LHNA
Official
Figure 17: Cost of Housing Versus Incomes
Source: GL Hearn Calculations
8.120 The chart indicates that that the PRS requires a much lower income than for sale dwellings. PRS therefore
provides access to relatively affordable accommodation for households across the income distribution.
8.121 The median income line indicates that around 50% of all households can afford to rent a dwelling of 3
bedrooms or less the PRS, again indicating this is a suitable tenure for households on modest incomes
who are not in a position (or who do not wish) to buy.
8.122 For households on a median income of £4,200pcm seeking to buy, they are able to afford an entry level
for sale dwelling. Affordable Home Ownership dwellings (Shared Ownership and London Living Rent)
should also be affordable to households at this income level, providing a route out of PRS.
8.123 It is worth re-iterating that the cost of housing in the PRS is very close to the cost of Shared Ownership
dwellings. As a result, AHO products provide a realistic route out of PRS for those that wish to do so. In
particular, London Living Rent, which should be priced as an intermediate affordable product in line with
rents paid on Affordable Rented homes.
£0£2,000
£4,000
£6,000£8,000
£10,000
£12,000
£14,000£16,000
£18,000
Fla
t
Te
rra
ce
Se
mi-
De
tache
d
De
tach
ed
Ro
om
On
ly
Stu
dio
1 B
ed
2 B
ed
s
3 B
ed
s
4+
Be
ds
1-B
ed
s
2-B
ed
s
3-B
ed
s
4+
Be
ds
1 B
ed
2 B
ed
s
3 B
ed
s
For sale PRS Shared ownership Affordable Rent
Incom
e
Monthly Housing Cost Income required Mean
Median Key worker (senior) Key worker (junior)
Lower Quartile
Wandsworth Local Housing Needs Assessment, Affordable housing split
GL Hearn Page 73 of 176
Wandsworth LHNA
Official
8.124 As regards households on lower income levels (“junior” key workers and those on Lower Quartile
incomes) the role of Affordable Homes is clear, with those households likely to rely on Affordable Rented
homes to access dwellings suited to their needs.
8.125 We note that dwellings for Social Rent are also likely to be suitable for people on very low incomes and
in receipt of housing benefit.
8.126 We note that, as part of the process of developing the Local Plan, a Whole Plan Viability Assessment will
be undertaken following PPG39 to confirm that affordable housing policies are unlikely to threaten the
viability of development in the Borough.
Affordable housing split
8.127 The overall need for affordable homes (3,575dpa) exceeds the Borough’s housing target set out in the
draft London Plan (1,950dpa). We note that it will be extremely challenging for the Council to satisfy this
level of need for affordable housing. An important exercise is therefore to identify those in priority need.
8.128 The London Plan requires that a minimum of 30 per cent of affordable housing is provided as low cost
rented products, 30 per cent as intermediate products, with the remaining 40 per cent to be determined
by the Borough. There is a presumption that the 40 per cent to be decided by the Borough will focus on
Social Rent and London Affordable Rent given the level of need for this type of tenure across London.
8.129 There is a significant number of households on Wandsworth’s Housing Register (8,800 as of 31st March
2020), This indicates the high levels of need for social housing in the borough. The GLA’s Housing in
London (2019) report indicates that households moving into social housing (including Affordable Rent)
have by far the lowest incomes, with half of them on less than £13,000 a year and the vast majority
(approximately 90%) on less than £25,000 a year40. However, the acute need for these tenures and the
distribution of income among households moving into social housing also mean that low-cost rented
products will only be available to households on a relatively narrow range of incomes.
8.130 For this reason, the provision of Social Rent and London Affordable Rent must be balanced against the
need to provide intermediate housing for those households on low to middle incomes that do not have
priority for social housing and are unable to afford market housing. This generally relates to households
with incomes between £25,000 and £90,000 a year.
8.131 The analysis indicates that intermediate tenures, such as London Shared Ownership and London Living
Rent, are both viable options that can assist in fulfilling this aspiration. Other intermediate housing for rent
39 PPG Paragraph: 059 Reference ID: 61-059-20190315 40 https://www.london.gov.uk/sites/default/files/housing_in_london_2019.pdf, page 67

Wandsworth Local Housing Needs Assessment, Affordable housing split
GL Hearn Page 74 of 176
Wandsworth LHNA
Official
such as Affordable Rent at 80% market discount can also be appropriate in certain circumstances as long
as rents do not exceed the LHA limits within the Broad Rental Market Area that the site falls.
8.132 Although, the London Plan indicates that the 40 per cent proportion of affordable tenures to be decided
by the Borough should focus on Social Rent and London Affordable Rent, the analysis indicates that the
intermediate London Living Rent tenure also has the potential the meet the housing need of low-income
households in LBW. It might therefore be sensible to allocate up to 50 per cent (20 percentage points) of
the discretionary target to intermediate tenures as long as future policies prioritise London Living Rent
over Affordable Rent at 80% market discount dwellings, which are less affordable.

Wandsworth Local Housing Needs Assessment, Affordable housing split
GL Hearn Page 75 of 176
Wandsworth LHNA
Official
Summary of Affordable Housing Need
• Analysis has been undertaken to estimate the need for affordable housing by 2037. The analysis
is split between a ‘traditional’ need (which is mainly for social/affordable rented accommodation)
and is based on households unable to buy or rent in the market and the expanded definition of
need introduced by the revised NPPF/PPG (which includes housing for those who can afford to
rent privately but cannot afford to buy a home).
• The analysis has taken account of local housing costs (to both buy and rent) along with estimates
of household income. Additionally, consideration is given to household projections and estimates
of the supply of social/affordable rented housing.
• The analysis estimates a net need of 2,327 affordable rented dwellings per annum over the 2019
to 2037 period.
• Living rents provide an indication of the aspiration level of affordable rent might be pitched at on a
monthly basis. For LBW, rents at £600 for 1-bedroom, £780 for 2-bedroom and £959 for 3-bedroom
is suggested.
• However a more realistic indication of the maximum level for an affordable rented product, is that
these should be capped at the lower of 80% market rent or LHA limit. Living rents should also not
exceed LHA limits.
• In terms of affordable home ownership, the analysis estimates a net need of 1,248 per annum
between 2019 and 2037.
• The analysis has suggested purchase costs for different property sizes. These are based on
equivalising the lower quartile private rent figures into a house price so that the sale price will meet
the needs of all households in the gap between buying and renting. The midpoint suggested price
for a 1-bedroom is £260,000 rising to £577,500 for 4+ bedrooms.
• If the Council seeks to provide 10% of all housing on site as affordable home ownership, then it is
suggested that Shared Ownership is the most appropriate option, rather than discounted market
sales housing.
• In terms of other forms of affordable tenures, the GLA set out a range of seven different tenures
and the eligibility for different types of homes (based on maximum household income). The Mayors
preferred affordable products are London Affordable Rent, London Living Rent and London Shared
Ownership.
• It is important to note that this report does not provide an affordable housing target; the amount of
affordable housing delivered will be limited to the amount that can viably be provided.

Wandsworth Local Housing Needs Assessment, Affordable housing split
GL Hearn Page 76 of 176
Wandsworth LHNA
Official
9 PRIVATE RENTED SECTOR
Introduction
9.1 In this section, it is important to distinguish between the private rented sector (PRS) and Build to Rent
(BtR). The former is a loosely defined umbrella term that covers all dwellings available marketed for rent
by private landlords, be they individuals or organisations.
9.2 BtR are defined in the NPPF41 and typically comprise developments of multiple units (often in excess of
100), are institutionally owned and managed and should be subject to longer tenancies designed to offer
greater security and stability42. Moreover, they can contribute to the delivery of affordable housing in the
form of Affordable Private Rent. Because of this, and on account of the non-sale covenants BtR schemes
usually carry, the stipulation for 10% of new build dwellings to be AHO does not apply to BtR
development.43
9.3 In addition, since September 2018, a section of PPG has been provided that sets out the Government's
expectations of LPAs in planning for BtR. This should be considered as part of a LHNA taking ‘into account
the need for a range of housing types and tenures in their area including provisions for those who wish to
rent. The assessment will enable an evidence-based planning judgement to be made about the need for
build to rent homes in the area, and how it can meet the housing needs of different demographic and
social groups’.44
9.4 This section therefore looks at a range of statistics in relation to the PRS in Wandsworth. Where
reasonable, comparisons are made with other tenures (i.e. owner-occupied and social rented) as well as
contrasting data with other areas. The aim is to bring together a range of information to inform the need
for additional private rented housing in the study area.
9.5 This study has not attempted to estimate the need for additional private rented housing. It is likely that the
decision of households as to whether to buy or rent a home in the open market is dependent on a number
of factors which mean that demand can fluctuate over time.
9.6 These factors include: mortgage lending practices and the availability of Housing Benefit. A general
(national and local) shortage of housing which is likely to have driven some of the growth in the private
rented sector, including increases in the number of younger people in the sector, and increases in shared
accommodation.
41 NPPF, page 65 42 PPG, Paragraph: 010 Reference ID: 60-010-20180913 43 NPPF, para 64 44 PPG, Paragraph: 001 Reference ID: 60-001-20180913

Wandsworth Local Housing Needs Assessment, Affordable housing split
GL Hearn Page 77 of 176
Wandsworth LHNA
Official
9.7 If the overall supply of housing increases, then this potentially means that more households would be
able to buy, but who would otherwise be renting. It is therefore difficult to base anything on past trends
when a step change in delivery is expected.
Size of the Private Rented Sector
9.8 The analysis in Chapter 2 has identified the tenure split of housing from the 2011 Census for LBW in
comparison to London and England. This found a total of 41,317 households living in PRS in LBW – 30%
of all households. This proportion is higher than both the national average at 16% and London’s average
at 25.1%.
9.9 The vast majority of households in the PRS are living in housing rented from a private landlord or through
a letting agency, with fewer households living rent free (mainly households living in housing owned by a
relative or friend).
9.10 Between Census periods, the number of households in PRS has increased in LBW by 65%. This
proportional increase is less significant in the Borough compared to the trend in London (79%) and
England (89%).
9.11 In conjunction with the significant growth in the number of households living in PRS, there has been a
decline in the number of households living in social rented housing and households that own with a
mortgage.
9.12 Robust data on PRS trends following 2011 is not available. However, a national perspective can be drawn
from the English Housing Survey (EHS) which has data up to 2016.
9.13 As illustrated in the figure below, since 2011 there has been a 25% growth in the number of PRS
households nationally and a slight decrease in the number of owner occupiers. If this growth rate was
applied to Wandsworth, this would result in around 51,646 households now living in the PRS.

Wandsworth Local Housing Needs Assessment, Affordable housing split
GL Hearn Page 78 of 176
Wandsworth LHNA
Official
Figure 18: Trends in tenure, 1980 to 2015-16 – England
Source: English Housing Survey
Distribution of PRS in Wandsworth
9.14 Households which rent privately often live in some of the worst quality, poorly managed accommodation.
Furthermore, some private renters face arbitrary evictions and unjustified rent increases, which is
particularly damaging for households with children. There is also some evidence that concentrations of
PRS dwellings can result in negative socio-economic trends such as falling land values and unbalanced
communities in terms of household types and income levels.
9.15 This can make the provision of additional housing (particularly affordable housing) challenging with some
Housing Associations deciding not to invest on viability grounds. In some neighbourhoods in England
these factors have led to pockets of relative deprivation where poor quality PRS becomes the norm.
9.16 The LNHA has therefore gathered data that presents the distribution of PRS in the Borough at the Lower
Super Output Area (LSOA) level. This is set out in the figure below. This shows areas of relatively high
concentration along the river at Battersea Reach, In Putney and in the south eastern parts of Wandsworth
around Tooting and Balham. In some LSOAs the proportion of all dwellings that are in the PRS has
reached 50%.
0
2,000
4,000
6,000
8,000
10,000
12,000
14,000
16,00019
8019
8119
8219
8319
8419
8519
8619
8719
8819
8919
9019
9119
9219
9319
9419
9519
9619
9719
9819
9920
0020
0120
0220
0320
0420
0520
0620
0720
0820
08-0
920
09-1
020
10-1
120
11-1
220
12-1
320
13-1
420
14-1
520
15-1
6
Num
ber
of h
ouse
hold
s (t
hous
ands
)
Owner-occupied Private rented Social rented

Wandsworth Local Housing Needs Assessment, Affordable housing split
GL Hearn Page 79 of 176
Wandsworth LHNA
Official
Figure 19: Distribution of PRS in Wandsworth (LSOA level)
Source: ONS, Census 2011
9.17 The figure below illustrates Housing Benefit claimants who are living in PRS. The LSOAs that record both
high levels of PRS housing and a high count of households claiming housing benefit are in and around
Tooting and in Putney Vale. This reflects the difference in property values between river edge
development and in the urban core. Much of Wandsworth Riverside was built-out in the 90s and 00s as
relatively expensive accommodation and sold to owner occupiers and buy to let investors, leaving a
legacy of more expensive PRS dwellings along the river.

Wandsworth Local Housing Needs Assessment, Affordable housing split
GL Hearn Page 80 of 176
Wandsworth LHNA
Official
Figure 20: Distribution of housing benefit claimants in Wandsworth (LSOA level)
Source: DWP, 2020
9.18 On the basis of the evidence gathered, it is reasonable to recommend that the LBW should monitor the
growth of PRS in the south east of the Borough and consider taking steps to ensure a balance of tenures
is maintained. It is however important to emphasise that the issue of poor quality private rented housing
applies to existing private rented accommodation comprising of mainly older housing stock, and to existing
HMOs. Conversely, it does not apply to Build to Rent (BtR) housing, which is a relatively new type of
delivery model providing high quality, purpose-built homes which are collectively professionally managed
and with longer tenancies for those who want them.
9.19 It is also acknowledged that the balance of tenures among existing housing stock might be difficult to
control given that it is impossible to prevent homeowners from letting out their properties. The scope to
control the concentration of HMOs is also limited as it is permitted to change a Use Class C4 HMO
property to a Use Class C3 dwelling house without the need for planning permission, and vice versa.
Planning permission is however required for the use of land and buildings for larger HMOs which are

Wandsworth Local Housing Needs Assessment, Affordable housing split
GL Hearn Page 81 of 176
Wandsworth LHNA
Official
defined as being a ’sui generis’ use. Therefore, LBW should explore options to control the concentration
of larger HMOs in areas with substantial concentrations of such accommodation.
9.20 It may also be appropriate to site high quality affordable accommodation in this area (potentially using
commuted sums from developments in more affluent areas of the Borough). This would firstly enable the
Council secure more affordable housing than would be possible in areas of higher value, and secondly it
offers a means of increasing choice for people on lower incomes in the south east and, finally, support
the maintenance of mixed and balanced communities in these areas.
Co-living in Wandsworth
9.21 It has been noted that roughly a third of homes in the PRS are HMOs (see para 10.30). This has led to
an adjustment to our modelled outputs for the number of new homes that should be affordable home
ownership dwellings (slightly increasing the proportion of smaller homes).
9.22 An additional policy option could be to support co-living in the Borough. These are purpose built residential
blocks of non-self-contained units that offer an alternative to traditional HMO accommodation. The value
that co-living can create for the occupier, if properly designed and managed, can be one of convenience,
social interaction and a good quality living environment in terms of access to facilities and accommodation.
9.23 There is a direct parallel with the way the emerging BTR sector is “disrupting” the traditional PRS offer by
offering a higher quality purpose-designed alternative. The figure below shows the distribution of HMOs
in Wandsworth, disaggregated to the LSOA level. This suggests a preference for sharers for the North
Eastern parts of the Borough around Clapham Junction in Battersea, Putney and Balham.

Wandsworth Local Housing Needs Assessment, Affordable housing split
GL Hearn Page 82 of 176
Wandsworth LHNA
Official
Figure 21: Distribution of HMOs in Wandsworth (LSOA level)
Source: ONS, Census 2011
9.24 Co-living is a development type designed around the needs of single, younger people who cannot afford
to rent a self-contained home, and are looking for a more professionally managed, more aspirational
alternative to the traditional HMO. As a development type, it is in its infancy in London partly because of
its unorthodox character; its status as ‘sui generis’ (rather than within a residential use class for planning
purposes), and that it is seen to contravene national space standards.
9.25 Co-living is a sub-set of BTR and, like BTR, is offered at a rent that is more than the equivalent product
in an HMO. As noted earlier, the average monthly rent for a room only in Wandsworth is £600; for a studio,
it is £950. This is exclusive of other costs such as council and tax utility bills.
9.26 In co-living developments, the rent paid on a room is all inclusive of council tax and utility bills. In the table
below we set out costs for two developments offering a private space in a multi-unit block. In order to
compare with rents charged in traditional HMOs, it is necessary to identify the rent element within the
overall monthly costs. To do this, it is assumed these charges come to 10% of monthly charges, and this
is deducted to arrive at the “rent” figure.

Wandsworth Local Housing Needs Assessment, Affordable housing split
GL Hearn Page 83 of 176
Wandsworth LHNA
Official
9.27 At this rent, to arrive at an understanding of affordability, it is reasonable to assume housing costs should
constitute around 35% of income. This results in a required income of £33,228 pa to rent a room in the
Collective scheme in Old Oak and £36,174 in the Gravity development in Finsbury Park. This is a
substantially higher cost to a “room only” arrangement in an HMO, but slightly lower cost to a studio flat
in the PRS.
Development Local
Authority Room Rent
Monthly income required
Annual income
Collective Old Oak
Hammersmith & Fulham
Room 1 psn + en suite
£975 £2,769 £33,228
Gravity Finsbury Park
Islington Room 1 psn +
en suite £1,061 £3,014 £36,174
Source: web research
9.28 Co-living does not however provide an alternative route to affordable housing to people on lower quartile
incomes. Also, it is not a viable alternative to affordable housing firstly, given that it is substantially more
expensive, on a sqm basis, than affordable rented accommodation and, secondly, as the private space
of most developments consist solely of bedrooms.
9.29 Given its unsuitability for use as affordable housing, the new London Plan, under policy H16 (large-scale
purpose-built shared living) requires a cash in lieu contribution towards conventional C3 affordable
housing.
9.30 Whilst it is recognised that shared accommodation can be an increasingly valuable form of
accommodation, there is an acute need for self-contained residential dwellings, and in particular for
affordable rented and Affordable Home Ownership (AHO) dwellings. In the event housing capacity
restricts LBW to meet its objectively assessed housing need or affordable housing need, it is suggested
that LBW consider conventional forms of housing ahead of co-living developments.
9.31 It is also recognised that the private space provided by co-living schemes consists solely of bedrooms
meaning that it does not cater for the needs of residents who wish to continue to live within the borough,
but rather for a more transient occupier. Taking into account that LBW already has one of the most mobile
populations in England (see Table 23), there is a risk that the provision of co-living accommodation would
intensify this issue further. As such, it would not support the creation of mixed and balanced communities
in these areas.

Wandsworth Local Housing Needs Assessment, Affordable housing split
GL Hearn Page 84 of 176
Wandsworth LHNA
Official
Mid-2018 to Mid-2019
Area Name Mid-2019 Population
Long-Term International
Migration
Internal Migration (within UK)
Total migration inflows and outflows
as a percentage of population Inflow Outflow Inflow Outflow
City of London 9,721 1,232 388 1,116 971 38%
Cambridge 124,798 5,354 5,147 16,358 18,070 36%
Oxford 152,457 6,583 5,097 17,372 21,448 33%
Hammersmith and Fulham 185,143 4,995 4,881 21,264 22,943 29%
Lambeth 326,034 5,985 6,518 38,612 40,432 28%
Camden 270,029 16,514 7,265 24,141 27,036 28%
Wandsworth 329,677 5,818 5,395 39,363 39,761 27%
Islington 242,467 9,466 4,472 24,348 27,532 27%
Westminster 261,317 17,752 8,873 19,193 23,466 27%
Southwark 318,830 8,290 7,267 32,846 35,052 26%
Source: ONS, 202045
Profile of Private Renters
9.32 Drawing largely on Census data, this section profiles the types of households living in the PRS within
Wandsworth. Where possible, comparisons are made with households living in other tenures.
Age Profile of Households
9.33 The figure below splits housing tenure by age groups. The 25-34 age group is the second most populous
household group (following the 35-49 age group) and has the greatest absolute number of households
living in PRS.
9.34 Around 58% of households in the 25-34 age group are in PRS accommodation. However, as identified in
the figure below, households aged 24 and under in PRS account for the greatest proportion across all
ages at 63%, albeit that these are very few in number
9.35 The high percentage of these two age groups living in PRS is primarily attributed to the presence of
student houses and young working professionals. This reflects the locational context of the Borough in
45 https://www.ons.gov.uk/peoplepopulationandcommunity/populationandmigration/migrationwithintheuk/datasets/localareamigrationindicatorsunitedkingdom

Wandsworth Local Housing Needs Assessment, Affordable housing split
GL Hearn Page 85 of 176
Wandsworth LHNA
Official
accommodating households seeking access to jobs across London and the presence of the university of
Roehampton and St. George's University of London.
Figure 22: Tenure by age of household in LBW (2011)
Source: Census 2011
9.36 As the population ages, the number of households in PRS decreases. For instance, 12% of households
aged 50-64 are in PRS and 9% of households aged 65-74 and 75-84 are in PRS. These age groups are
more likely to own property outright or live in social rented accommodation. For the older age groups this
would include rental sheltered accommodation.
Young Person Households
9.37 Observing change in tenure type for a full range of age groups is difficult as the two Census (2001 and
2011) periods use different age bands. It is possible however to provide an indication of the change in
tenure by observing trends for households aged under 35 years.
9.38 As set out in Table 21 below, since 2001 young person households (under 35 years) have increased by
4% in Wandsworth. Over this same period, London also experienced growth of 4%, however nationally
this age group declined (-3%).
9.39 In addition, younger households in the social rented sector experienced the greatest proportional growth
(138%) over the 2001 to 2011 period. Despite this, households in the PRS still make up the highest
proportion (59%) of younger person households in LBW. This is higher than both London (54%) and
England (46%) equivalents.
5%
6%
11%
31%
49%
50%
46%
6%
26%
41%
30%
11%
7%
5%
26%
10%
20%
27%
31%
34%
38%
63%
58%
28%
12%
9%
9%
11%
0% 10% 20% 30% 40% 50% 60% 70% 80% 90% 100%
0-24
25-34
35-49
50-64
65-74
75-84
85 and over
Owned outright Owned with a mortgage Social rented Private rented

Wandsworth Local Housing Needs Assessment, Affordable housing split
GL Hearn Page 86 of 176
Wandsworth LHNA
Official
Change in tenure those aged under 35 in LBW (2001-2011)
2001 2011 % Change
Owned 17,712 12,859 -27%
Social rented 2,165 5,144 138%
Private rented 18,727 25,947 39%
Total Young Person Households 42,279 43,950 4%
Source: ONS, Census 2001 and 2011
Household Composition
9.40 The figure below illustrates the breakdown of household composition by housing tenure type. In LBW, the
PRS houses a disproportionately large number of other household types, cohabiting couples and lone
parent families compared to the wider housing stock. Conversely it has a low percentage of family
households and one-person households.
9.41 One family households predominately own property with a mortgage (33%). The proportion of one family
households in the PRS is 27% and this is followed by 20% in social rented accommodation.
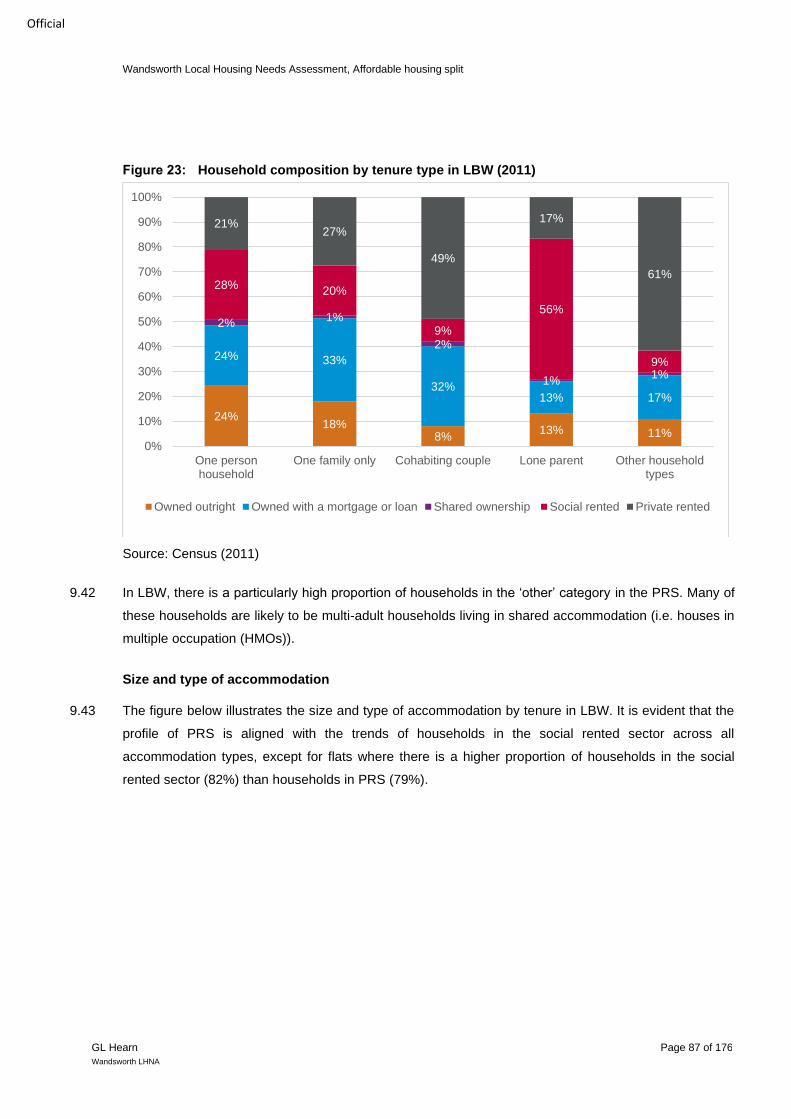
Wandsworth Local Housing Needs Assessment, Affordable housing split
GL Hearn Page 87 of 176
Wandsworth LHNA
Official
Figure 23: Household composition by tenure type in LBW (2011)
Source: Census (2011)
9.42 In LBW, there is a particularly high proportion of households in the ‘other’ category in the PRS. Many of
these households are likely to be multi-adult households living in shared accommodation (i.e. houses in
multiple occupation (HMOs)).
Size and type of accommodation
9.43 The figure below illustrates the size and type of accommodation by tenure in LBW. It is evident that the
profile of PRS is aligned with the trends of households in the social rented sector across all
accommodation types, except for flats where there is a higher proportion of households in the social
rented sector (82%) than households in PRS (79%).
24%18%
8%13% 11%
24% 33%
32%13% 17%
2%1%
2%
1%1%
28%20%
9%
56%
9%
21%27%
49%
17%
61%
0%
10%
20%
30%
40%
50%
60%
70%
80%
90%
100%
One personhousehold
One family only Cohabiting couple Lone parent Other householdtypes
Owned outright Owned with a mortgage or loan Shared ownership Social rented Private rented

Wandsworth Local Housing Needs Assessment, Affordable housing split
GL Hearn Page 88 of 176
Wandsworth LHNA
Official
Figure 24: Accommodation type by tenure (households) – LBW (2011)
Source: Census (2011)
9.44 Around 39% of households in detached dwellings are in either PRS and social rented accommodation. In
comparison, 61% of households in detached dwellings own property outright or in shared ownership.
9.45 For semi-detached dwellings, 22% of households are in PRS and 12% are in the social rented sector.
The proportion increases for terraced dwellings with 19% of households in this house-type in PRS. This
is compared to 71% of households in terraced dwellings that own property outright or in shared ownership.
9.46 The data in the figure below illustrates that the PRS is the dominant tenure type for smaller dwellings,
with 40% of 1-bedroom households and 36% of 2-bedroom households within the tenure. There is also a
high proportion of households living in smaller homes in the social rented tenure with 32% in 1-bedroom
and 20% in 2-bedroom dwellings. In contrast, only 27% of 3-bedroom and 23% of 4-bedroom homes are
privately rented.
61%66% 71%
35%
12%12%
10%
25%
26% 22% 19%
39%
0%
10%
20%
30%
40%
50%
60%
70%
80%
90%
100%
Detached Semi-detached Terraced Flat/Other
Owned-occupied Social rented Private rented

Wandsworth Local Housing Needs Assessment, Affordable housing split
GL Hearn Page 89 of 176
Wandsworth LHNA
Official
Figure 25: Accommodation size by tenure (households) – LBW (2011)
Source: Census (2011)
Economic activity
9.47 As illustrated in the figure below, data drawn from the 2011 Census shows that 41% of households
working full-time live in the PRS. In addition, a substantially greater proportion are unemployed than
among households that own their own home. At 15%, they also display the smallest proportion of
households who are economically in active. This suggests the younger, striving demographic associated
with PRS and that they live more precarious lives than those in owner-occupation.
8%15%
25%31%
20%
28%
29%
40%
32%
20%
19%
6%
40% 36%27%
23%
0%
10%
20%
30%
40%
50%
60%
70%
80%
90%
100%
1-Bedroom 2-Bedroom 3-Bedroom 4+ Bedroom
Onwed outright Owned with a mortgage Social rented Private rented

Wandsworth Local Housing Needs Assessment, Affordable housing split
GL Hearn Page 90 of 176
Wandsworth LHNA
Official
Figure 26: Profile of PRS by Economic Activity
Source: 2011 Census
Rental Value
9.48 An analysis has been undertaken reviewing the change of housing costs over time. This analysis draws
on data from the Valuation Office Agency (VOA) using a time series from March 2014. As detailed in the
figure below, median rents in LBW have remined fairly stable since 2016 at £1,650 per month.
9.49 However, median rents in Wandsworth are some £155 per month more than the median rental value for
London and £955 more than the national median. This illustrates the difficulty in accessing property in
the Borough even through renting.

Wandsworth Local Housing Needs Assessment, Affordable housing split
GL Hearn Page 91 of 176
Wandsworth LHNA
Official
Figure 27: Median private sector rent (per month) (2014 - 2019)
Source: Valuation Office Agency
9.50 Table 22 below reports change in rental value by number of bedrooms. The overall median rent in LBW
increased by £135 per month (a 9% increase). The largest percentage increases were seen in smaller
homes, again illustrating the difficulty for younger households in accessing accommodation.
Median private sector rent (per month) 2012 and 2019 – LBW
2014 2019 Change % Change
1-bedroom £1,257 £ 1352 £95 8%
2-bedrooms £1,560
£1,672
£112 7%
3-bedrooms £ 2,002
£2,150
£148 7%
4+-bedrooms £ 2,970
£3,000 £30 1%
All dwellings £ 1,515 £ 1,650 £135 9%
Source: Valuation Office Agency
9.51 The figure below indexes the change of private sector rents and average house price over the 2014-2019
period. The data illustrates that house prices have increased by around 35% in LBW, compared with a
9% change in the value of rents. This rate has been fairly consistent with the consumer price index
(housing and utilities).
0
200
400
600
800
1,000
1,200
1,400
1,600
1,800
2014 2015 2016 2017 2018 2019
Wandsworth London England

Wandsworth Local Housing Needs Assessment, Affordable housing split
GL Hearn Page 92 of 176
Wandsworth LHNA
Official
Figure 28: Change in median rental values and house prices (2014-19)
Source: Valuation Office Agency and Land Registry
Build-to-Rent
9.52 As noted, the PRS has been the main growth sector in the market at all geographic levels. This is partially
linked to an increased (national) interest from developers in “Build to Rent” housing, which is specifically
built not for open market sale but for the Private Rented Sector.
9.53 The sector provides the opportunity for good quality, well-managed rental accommodation that is purpose-
built. Additionally, it provides an opportunity to boost the rate of overall housing delivery, as it does not
compete directly with traditional housing development schemes which are built for sale.
9.54 The Government has been promoting Build-to-Rent housing and has set up a Private Rented Sector
Taskforce and supported delivery through other measures. These measures include a Build to Rent Fund
which provides Government-backed loans to support new development. The sector is currently relatively
small but is one with growth potential.
9.55 As earlier noted, the revised PPG now includes specific advice about affordable housing on Build to Rent
schemes.46
9.56 The British Property Federation (BPF) hosts an online mapping tool47 which plots build to rent schemes
across the UK aimed at the institutional investment market. This shows that 52% of units in the build to
rent pipeline are located in London.
46 PPG, Paragraph: 002 Reference ID: 60-002-20180913 47 https://www.bpf.org.uk/what-we-do/bpf-build-rent-map-uk
0.00
0.20
0.40
0.60
0.80
1.00
1.20
1.40
1.60
2014 2015 2016 2017 2018 2019
Rent Price Consumer Price Index - Housing & Utilities
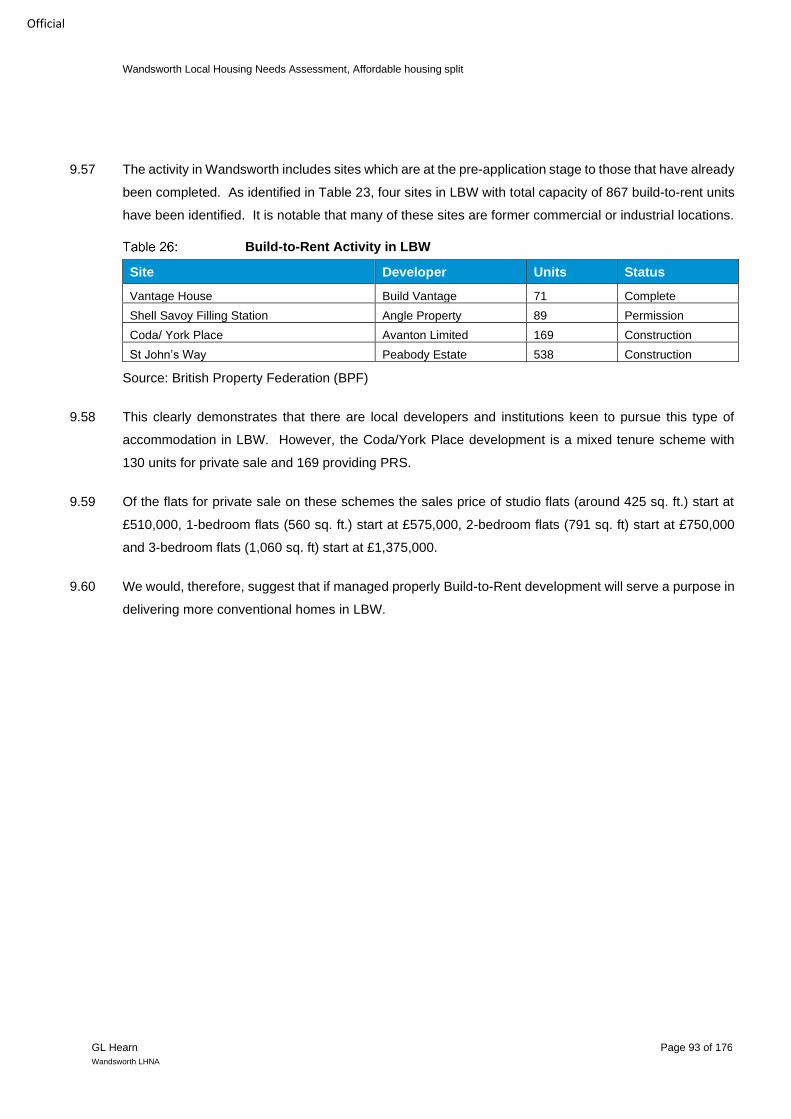
Wandsworth Local Housing Needs Assessment, Affordable housing split
GL Hearn Page 93 of 176
Wandsworth LHNA
Official
9.57 The activity in Wandsworth includes sites which are at the pre-application stage to those that have already
been completed. As identified in Table 23, four sites in LBW with total capacity of 867 build-to-rent units
have been identified. It is notable that many of these sites are former commercial or industrial locations.
Build-to-Rent Activity in LBW
Site Developer Units Status
Vantage House Build Vantage 71 Complete
Shell Savoy Filling Station Angle Property 89 Permission
Coda/ York Place Avanton Limited 169 Construction
St John’s Way Peabody Estate 538 Construction
Source: British Property Federation (BPF)
9.58 This clearly demonstrates that there are local developers and institutions keen to pursue this type of
accommodation in LBW. However, the Coda/York Place development is a mixed tenure scheme with
130 units for private sale and 169 providing PRS.
9.59 Of the flats for private sale on these schemes the sales price of studio flats (around 425 sq. ft.) start at
£510,000, 1-bedroom flats (560 sq. ft.) start at £575,000, 2-bedroom flats (791 sq. ft) start at £750,000
and 3-bedroom flats (1,060 sq. ft) start at £1,375,000.
9.60 We would, therefore, suggest that if managed properly Build-to-Rent development will serve a purpose in
delivering more conventional homes in LBW.

Wandsworth Local Housing Needs Assessment, Affordable housing split
GL Hearn Page 94 of 176
Wandsworth LHNA
Official
Summary of Private Rented Sector
• This study has not attempted to estimate the need for additional private rented housing. It is likely
that the decision of households as to whether to buy or rent a home in the open market is dependent
on a number of factors which mean that demand can fluctuate over time.
• Notably if the supply of housing increases, then this potentially means that more households would
be able to buy, but who would otherwise be renting. It is therefore difficult to draw ony conclusions
based on past trends.
• The private rented sector (PRS) accounts for around 30% of all households in Wandsworth (as of
2011), 5% higher than the London average, and notably higher than national rate. The number of
households in this sector has grown substantially (increasing by 65% in the 2001-11 period).
• The PRS has some distinct characteristics, including a much younger demographic profile and a
high proportion of multi-adult households (likely in most cases to be Houses in Multiple Occupation
(HMOs)) – levels of overcrowding are also relativity high.
• In terms of the size of dwellings in the sector, it can be noted that the PRS is closer to the social
rented sector than owner-occupied housing.
• Additional analysis suggest that rent levels have increased over time (by about 9% when looking at
the 2014-2019 period) - this would suggest that there may be a lack of supply of private rented homes.
However, house prices (to buy) have increased by a far more substantial amount- increasing by 35%
over the same period. During this time inflation inceased slightly.
• The British Property Foundaiton (BFF) identfies 35% of units in the build to rent pipeline across the
UK are in London. In Wandsworth, there are four sites in LBW with total capacity of 867 build-to-rent
units. The increased interest from buy to let inverstors will increase competion for market housing
for sale and may be causing upwards pressure on house prices.
• There has been some evidence of built to let locally and given the current Government push for such
schemes, the Council should consider any proposals on their merit, including taking account of any
affordable housing offer (such as rent levels and the security of tenure) and the quality of the
management and stock.

Wandsworth Local Housing Needs Assessment, Affordable housing split
GL Hearn Page 95 of 176
Wandsworth LHNA
Official
10 HOUSING MIX
Introduction
10.1 This section assesses the future need for different sizes of homes, modelling the implications of
demographic drivers on need/demand for different sizes of homes in different tenures. The analysis seeks
to use the information available about the size and structure of the future population and household
composition and consider what impact this may have on the sizes of housing units required in the future.
10.2 Essentially the model starts with the current profile of housing in terms of size (bedrooms) and tenure for
different age groups. This is then aligned to the demographic projections to see which age groups are
expected to change in number, and by how much. On the assumption that occupancy patterns for each
age group (within each tenure) remain the same, it is possible to work out what the profile of housing
should be at a point in time in the future.
10.3 The figures provided reflect the change in population associated with delivering 2,537dpa, in line with the
Standard Method.
Understanding how households occupy homes
10.4 Whilst the demographic projections provide a good indication of how the population and household
structure will develop, it is not a simple task to convert the net increase in the number of households into
a suggested profile for additional housing to be provided.
10.5 The main reason for this is that in the market sector, households are able to buy or rent any size of
property (subject to what they can afford) and therefore knowledge of the profile of households in an area
does not directly transfer into the sizes of property to be provided.
10.6 The size of housing which households occupy relates more to their wealth and age than the number of
people they contain. For example, there is no reason why a single person cannot buy (or choose to live
in) a four-bedroom home as long as they can afford it, and hence projecting an increase in single person
households does not automatically translate into a need for smaller units.
10.7 That said, issues of supply can also influence occupancy patterns, for example, it may be that a supply
of additional smaller bungalows (say 2-bedrooms) would encourage older people to downsize but in the
absence of such accommodation, these households remain living in their larger accommodation.

Wandsworth Local Housing Needs Assessment, Affordable housing split
GL Hearn Page 96 of 176
Wandsworth LHNA
Official
10.8 The issue of choice is less relevant in the affordable sector (particularly since the introduction of the social
sector size criteria) although there will still be some level of under-occupation moving forward with regard
to older person and working households.
10.9 The approach used is to interrogate information derived in the projections about the number of household
reference persons (HRPs) in each age group and apply this to the profile of housing within these groups.
The data for this analysis has been formed from a commissioned table by ONS (Table CT0621 which
provides relevant data for all local authorities in England and Wales from the 2011 Census).
10.10 The figure below shows an estimate of how the average number of bedrooms varies by different ages of
HRP and broad tenure group. In the owner-occupied sector, the average size of accommodation rises
over time to typically reach a peak around the age of 50; a similar pattern (but with smaller dwelling sizes)
is seen in the social and private rented sector. After peaking, the average dwelling size decreases – as
typically some households downsize as they get older.
Figure 29: Average bedroom by age and tenure in LBW
Source: Derived from ONS Commissioned Table CT0621
10.11 In terms of the analysis to follow, the outputs have been segmented into three broad categories. These
are market housing (which includes Private Rental), which is taken to follow the current occupancy profiles
by age in the owner-occupied sector (i.e. excludes Private Rental) but reflecting the changing age
structure within the demographic projections; affordable home ownership, which as a proxy is taken to
Wandsworth Local Housing Needs Assessment, Affordable housing split
GL Hearn Page 97 of 176
Wandsworth LHNA
Official
follow the occupancy profile in the private rented sector (this is seen as reasonable as the Government’s
desired growth in home ownership looks to be largely driven by a wish to see households move out of
private renting) and affordable (rented) housing, which is taken to follow the occupancy profile in the social
rented sector. The affordable sector in the analysis to follow would include affordable rented housing.
Current stock of housing by size and tenure
10.12 It should be noted that the current stock of housing (by size) can have a notable impact on the outputs of
the modelling and the table below shows a comparison of the size profile of accommodation in a range
of areas in three broad tenure groups. This reveals the following findings:
• There are a larger proportion of smaller homes of 1 and 2 bedrooms in Wandsworth than in London
(48% as against 36%);
• The distribution of Social Rented dwellings in broadly the same in Wandsworth as it is in London;
both geographies show a bias towards smaller dwellings of 1 and 2 bedrooms (72% and 69%
respectively);
• Notwithstanding, both Wandsworth and London have a substantial number of Social Rented
dwellings that are 3 bedrooms (23% and 26% respectively);
• It is notable that in England there are a smaller proportion of smaller Social Rented homes that are
1 and 2 bedroom (58%) and a larger proportion that are 3 bedrooms (38%);
• Only a small proportion of Social Rented homes are of 4+ bedrooms across all three geographies;
• Larger dwellings of 4 or more dwellings represent a substantial proportion of owner-occupied homes
in Wandsworth (28%); this is similar to England (29%) but exceeds London (25%);
• As regards Private Rented Sector (PRS) dwellings, a high proportion are smaller dwellings of 1 and
2 bedrooms in both Wandsworth and London (69% and 71% respectively); dwellings of three
bedrooms constitute a fifth of all PRS dwellings in both geographies.
• A different pattern is discernible in England where a smaller proportion of dwellings are of 1 and 2
bedrooms (60%) and a larger proportion are 3 bedrooms (28%); and
• The geographies have a similar proportion of larger PRS dwellings of 4 bedrooms + of between 10%
and 12%

Wandsworth Local Housing Needs Assessment, Affordable housing split
GL Hearn Page 98 of 176
Wandsworth LHNA
Official
Number of bedrooms by tenure (LBW, London and England)
Wandsworth London England
Owner-occupied
1 bedroom 15% 10% 4%
2 bedrooms 33% 26% 20%
3 bedrooms 24% 39% 47%
4 bedrooms 16% 17% 22%
5+ bedrooms 12% 8% 7%
Total 100% 100% 100%
Social rented
1 bedroom 32% 29% 21%
2 bedrooms 40% 40% 37%
3 bedrooms 23% 26% 38%
4 bedrooms 5% 5% 4%
5+ bedrooms 1% 1% 1%
Total 100% 100% 100%
Private rented
1 bedroom 29% 32% 21%
2 bedrooms 40% 38% 39%
3 bedrooms 19% 20% 28%
4 bedrooms 9% 7% 8%
5+ bedrooms 3% 3% 4%
Total 100% 100% 100%
Source: Census 2011
Tenure assumptions
10.13 The housing market model has been used to estimate the future need for different sizes of property over
the 18-year period from 2019 to 2037. The model works by looking at the types and sizes of
accommodation occupied by different ages of residents and attaching projected changes in the population
to the projected need and demand for different sizes of homes. However, the way households of different
ages occupy homes differs between the market and affordable sectors (as shown earlier).
10.14 It is therefore necessary on this basis to make some judgement for modelling purposes on what proportion
of net completions might be of market and affordable housing. For modelling purposes, the analysis
assumes that 35% of net completions are either affordable housing (rented) or affordable home ownership
and therefore that 65% are market housing (designed to be sold for owner-occupation). There is no
assumption about private rented housing, although it is possible that some of the market (owner-occupied)
housing will end up in this sector.
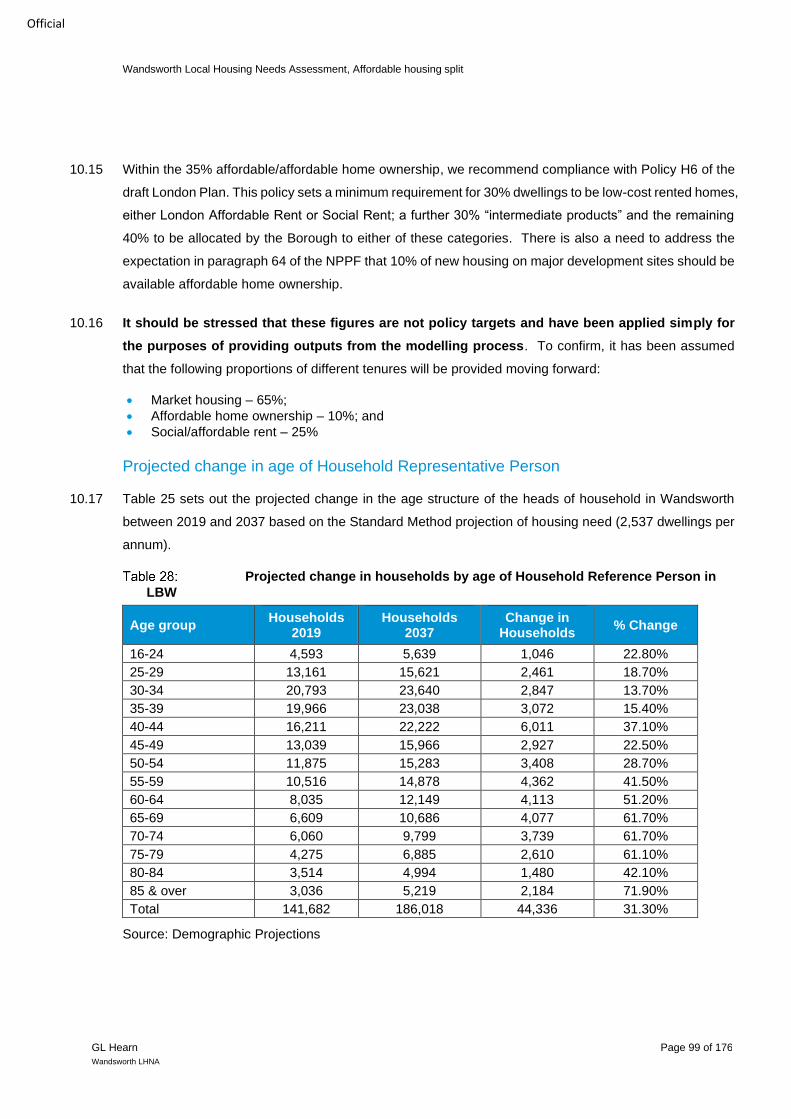
Wandsworth Local Housing Needs Assessment, Affordable housing split
GL Hearn Page 99 of 176
Wandsworth LHNA
Official
10.15 Within the 35% affordable/affordable home ownership, we recommend compliance with Policy H6 of the
draft London Plan. This policy sets a minimum requirement for 30% dwellings to be low-cost rented homes,
either London Affordable Rent or Social Rent; a further 30% “intermediate products” and the remaining
40% to be allocated by the Borough to either of these categories. There is also a need to address the
expectation in paragraph 64 of the NPPF that 10% of new housing on major development sites should be
available affordable home ownership.
10.16 It should be stressed that these figures are not policy targets and have been applied simply for
the purposes of providing outputs from the modelling process. To confirm, it has been assumed
that the following proportions of different tenures will be provided moving forward:
• Market housing – 65%;
• Affordable home ownership – 10%; and
• Social/affordable rent – 25%
Projected change in age of Household Representative Person
10.17 Table 25 sets out the projected change in the age structure of the heads of household in Wandsworth
between 2019 and 2037 based on the Standard Method projection of housing need (2,537 dwellings per
annum).
Projected change in households by age of Household Reference Person in
LBW
Age group Households
2019 Households
2037 Change in
Households % Change
16-24 4,593 5,639 1,046 22.80%
25-29 13,161 15,621 2,461 18.70%
30-34 20,793 23,640 2,847 13.70%
35-39 19,966 23,038 3,072 15.40%
40-44 16,211 22,222 6,011 37.10%
45-49 13,039 15,966 2,927 22.50%
50-54 11,875 15,283 3,408 28.70%
55-59 10,516 14,878 4,362 41.50%
60-64 8,035 12,149 4,113 51.20%
65-69 6,609 10,686 4,077 61.70%
70-74 6,060 9,799 3,739 61.70%
75-79 4,275 6,885 2,610 61.10%
80-84 3,514 4,994 1,480 42.10%
85 & over 3,036 5,219 2,184 71.90%
Total 141,682 186,018 44,336 31.30%
Source: Demographic Projections

Wandsworth Local Housing Needs Assessment, Affordable housing split
GL Hearn Page 100 of 176
Wandsworth LHNA
Official
10.18 While there is an increase in numbers of all age groups, the greatest uplift occurs at the older end of the
age spectrum. The increase in numbers of those aged 65 and above constitutes 32% of the growth in
HRPs.
10.19 While households headed by people in this age group tend to occupy larger dwellings, there is a policy
choice to increase the supply of smaller homes so as to facilitate the opportunity for down-sizing. This in
turn will promote transaction rates and enable younger age groups to access dwellings of an appropriate
size for families.
10.20 In Table 26, we set out estimated changes by broad household group by 2037. It is notable there is a
substantial uplift in households of all types, although again it is those age 65 and above (both as couples
and one-person house-holds) that are forecast to increase most rapidly.
Change in household types 2019-37 in LBW
Household 2019 2037 Change in
Households %
Change
One-person household (aged 65 and over) 12,663 19,417 6,754 53.3%
One-person household (aged under 65) 31,066 34,785 3,719 12.0%
Couple (aged 65 and over) 4,825 7,426 2,601 53.9%
Couple (aged under 65) 24,602 33,431 8,829 35.9%
A couple and one or more other adults: No dependent children
8,285 11,337 3,053 36.8%
Households with one dependent child 17,573 23,496 5,923 33.7%
Households with two dependent children 12,750 15,623 2,873 22.5%
Households with three dependent children 6,481 7,776 1,295 20.0%
Other households 23,438 32,727 9,289 39.6%
Total 141,682 186,018 44,336 31.3%
Total households with dependent children 36,804 46,895 10,090 27.4%
Source: Demographic Projections
10.21 Following this, smaller households will see a substantial uplift, couples without children aged under 65
are forecast to increase by 35.9%, and those with just one child, by 33.7%. This suggests the need for
smaller dwellings..
Estimate of Housing need by Size and Tenure
10.22 Working from the evidence assembled in this section, it is possible to generate an estimate of the sizes
of homes needed to meet need by 2037, and how these should be split into the three principle tenures.
This is summarised in the table below.

Wandsworth Local Housing Needs Assessment, Affordable housing split
GL Hearn Page 101 of 176
Wandsworth LHNA
Official
1-bedroom 2-bedrooms 3-bedrooms 4+-bedrooms
Market 12% 29% 30% 28%
Affordable home ownership
30% 38% 20% 12%
Affordable housing (rented)
40% 32% 22% 5%
Source: Housing Market Model
10.23 However, the mix analysis set out above should be treated with caution. Because the modelling to a
certain extent rolls forward the current profile of homes in an area, there are cases where a high current
stock (of a particular size) drives a high need for such stock in the future.
10.24 In addition, it is based on trends that do not necessarily reflect people’s requirements, but the limited
options they are faced with on account of the nature of the housing stock. For example, older people living
in larger dwellings on account of a shortage of smaller dwellings or, indeed, specialist housing for the
elderly.
10.25 For this reason, we have put forward a number of adjustments to underpin possible policy directions
designed to bring the housing stock and demand for dwellings into closer alignment. One such
consideration is the level of over and under occupation in the Borough.
The table below sets out the relationship between under-occupation and size of dwelling. Unsurprisingly,
there is a strong positive correlation between number of bedrooms and the occupancy rating, with those
households in homes of 3 bedrooms and above showing a substantial degree of under-occupation. There
is also evidence of over-crowding in the Borough, although to a much lesser degree.
Occupancy rating and number of bedrooms (owner-occupied sector)
Occupancy rating
Number of bedrooms
1-Bed 2-Bed 3-Bed 4+ Bed Total
+2 0 0 8,451 13,410 21,861
+1 0 14,043 5,164 2,130 21,337
0 8,206 5,208 2,124 526 16,064
-1 611 636 414 112 1,773
-2 66 88 76 39 269
Total 8,883 19,975 16,229 16,217 61,304
Source: Census 2011
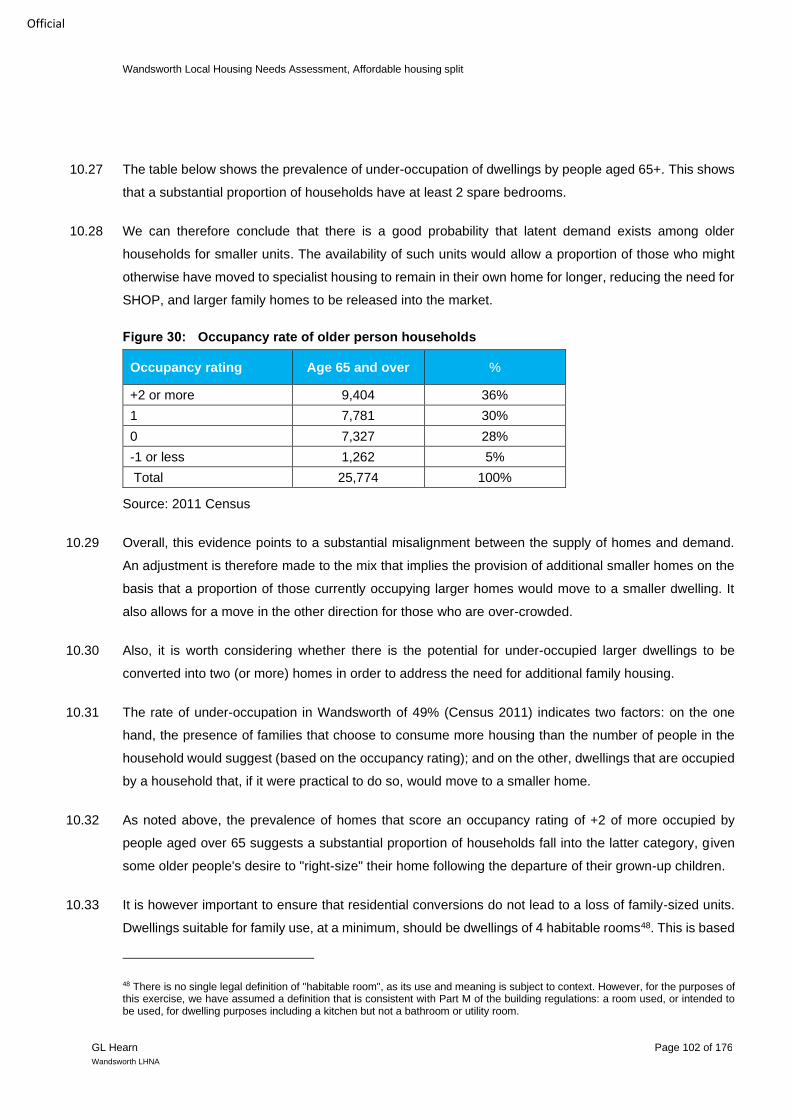
Wandsworth Local Housing Needs Assessment, Affordable housing split
GL Hearn Page 102 of 176
Wandsworth LHNA
Official
10.27 The table below shows the prevalence of under-occupation of dwellings by people aged 65+. This shows
that a substantial proportion of households have at least 2 spare bedrooms.
10.28 We can therefore conclude that there is a good probability that latent demand exists among older
households for smaller units. The availability of such units would allow a proportion of those who might
otherwise have moved to specialist housing to remain in their own home for longer, reducing the need for
SHOP, and larger family homes to be released into the market.
Figure 30: Occupancy rate of older person households
Occupancy rating Age 65 and over %
+2 or more 9,404 36%
1 7,781 30%
0 7,327 28%
-1 or less 1,262 5%
Total 25,774 100%
Source: 2011 Census
10.29 Overall, this evidence points to a substantial misalignment between the supply of homes and demand.
An adjustment is therefore made to the mix that implies the provision of additional smaller homes on the
basis that a proportion of those currently occupying larger homes would move to a smaller dwelling. It
also allows for a move in the other direction for those who are over-crowded.
10.30 Also, it is worth considering whether there is the potential for under-occupied larger dwellings to be
converted into two (or more) homes in order to address the need for additional family housing.
10.31 The rate of under-occupation in Wandsworth of 49% (Census 2011) indicates two factors: on the one
hand, the presence of families that choose to consume more housing than the number of people in the
household would suggest (based on the occupancy rating); and on the other, dwellings that are occupied
by a household that, if it were practical to do so, would move to a smaller home.
10.32 As noted above, the prevalence of homes that score an occupancy rating of +2 of more occupied by
people aged over 65 suggests a substantial proportion of households fall into the latter category, given
some older people's desire to "right-size" their home following the departure of their grown-up children.
10.33 It is however important to ensure that residential conversions do not lead to a loss of family-sized units.
Dwellings suitable for family use, at a minimum, should be dwellings of 4 habitable rooms48. This is based
48 There is no single legal definition of "habitable room", as its use and meaning is subject to context. However, for the purposes of this exercise, we have assumed a definition that is consistent with Part M of the building regulations: a room used, or intended to be used, for dwelling purposes including a kitchen but not a bathroom or utility room.

Wandsworth Local Housing Needs Assessment, Affordable housing split
GL Hearn Page 103 of 176
Wandsworth LHNA
Official
on the assumption that a dwelling with 4 habitable rooms comprises two bedrooms, a kitchen and living
room, suitable for a household consisting of three individuals, allowing some room for growth.
10.34 Therefore, for an existing dwelling to have development potential for two dwellings suitable for families,
we assume a minimum size of 6 habitable rooms.
10.35 The 9,404 dwellings occupied by people aged 65+ who have at least two spare rooms therefore provides
a rough estimate of the number of dwellings in Wandsworth that may be amenable to conversion to two
family homes, subject to the suitability of the site to development.
10.36 In order to protect family-sized dwellings from conversion, LBW has had a long-standing policy approach
of protecting houses, family-sized flats and maisonettes. The currently adopted Local Plan protects
dwellings below 150sqm from conversion into smaller dwellings. Taking into account that 84% of all new
dwellings in Wandsworth completed since 2011 having been 1- and 2-bedroom dwellings, it might be
appropriate to retain this policy. This protection contributes to a greater choice of sizes of dwelling at
different price points and helps maintain a balanced housing stock.
10.37 In the context of the delivery of smaller homes in the Borough (allowing older residents seeking to right-
size to move) it is reasonable to assume, given property values in the Borough, and the limited demand
for the largest size of home, that a small but steady number of 150sqm properties with 6 habitable rooms
or more could be converted to provide an additional supply of smaller or medium family accommodation.
10.38 It is, however, difficult to accurately predict the quantum of new homes from this source. As a result, no
adjustment has been made to the modelled outputs set out below as regards the distribution of market
homes by size required to meet demand.
10.39 That said, the recommended mix may be used as a monitoring tool and if many smaller or medium sized
homes are delivered then future housing mix can be adjusted as a response.
10.40 A further consideration is that figures for Affordable Home Ownership (AHO) have been based on the
profile of households in the Private Rented Sector (PRS). In Wandsworth, this is complicated by the fact
that a very high proportion of the PRS is HMOs (estimated to be around a third of all PRS) and therefore
a direct move from current occupancy to a suggested need is not appropriate (in basic terms because the
AHO would be product to help only part of the HMO (e.g. a single or couple) not all residents. Therefore,
the AHO size mix might be expected to reduce slightly.

Wandsworth Local Housing Needs Assessment, Affordable housing split
GL Hearn Page 104 of 176
Wandsworth LHNA
Official
10.41 In addition, it is worthwhile considering how the 12% of total additional market dwellings that the model
identifies should be 1 bedroom could be broken down to 1 bedroom, studio and “room only” household
spaces.
10.42 Firstly, it is important to note the effect on the housing market of delivering significant numbers of 1
bedroom units is to enable those in “room only” and studio dwellings to trade up if they are able to afford
to do so, releasing their smaller home back into the market for occupation by households with lower
household income. In this way, the provision of 1 bedroom flats should release studios and “room only”
household spaces into the market for occupation by less affluent households.
10.43 “Room only” and studios are household spaces that are not provided as affordable homes. The question
of their suitability in the Borough therefore solely relates to the market component of overall housing
supply.
10.44 Turning to “room only” household spaces, it is not possible to plan or forecast demand for this type of
home on account of the difficulty in predicting individual household choices in the marketplace, as with
BTR as a whole.
10.45 It is however possible to arrive at conclusions as to whether such a home is likely to address the housing
needs of a significant number of residents over the plan period on the basis of affordability. This is partly
considered in Chapter 9 in the examination of "co-living", as well as Chapter 8.
10.46 The affordability analysis in Chapter 8 identified that the average monthly cost of a studio flat is £950pcm,
as against £1,250pcm for a 1 bedroom dwelling. Based on the affordability of products of different prices
(See Table 8) this translates into a difference in the income required to afford these homes of £634 per
month or £7,614 per year (on the basis of a housing costs of £950 and £1,250pcm should take up no
more than 35.2% and 37.5% of household income respectively49). This is a significant difference.
10.47 On this basis, while the housing market modelling does not allow for a split in demand between studios
and 1 bedroom dwellings, policy should support the provision of studio flats. Policy DHM3 currently
supports the provision of 1 person/studio accommodation on major developments on condition it does not
exceed 5% of all market units.
10.48 Crucially, new homes should contribute to supporting the creation of stable local neighbourhoods and
cohesive communities. Preference should therefore be given to larger homes, because proposals which
provide more than a small proportion of studios are unlikely to achieve this objective. Although the
increasing proportion of single person households is forecast to continue, this does not necessarily result
49 To meet this condition, monthly household income will be at least £3,333 for households renting a 1 bedroom dwelling and £2,699 for a studio flat. The different is £634 per month or £7,614 per year.

Wandsworth Local Housing Needs Assessment, Affordable housing split
GL Hearn Page 105 of 176
Wandsworth LHNA
Official
in a proportionate increase in demand for small studios as many people would like a spare bedroom for
visitors or to use as a study/office.
10.49 Therefore, a realistic approach is to allow for a proportion of new developments to contain studios up to
a maximum limit.
10.50 The figure below we present the adjusted modelled outputs for housing mix in LBW. The mix is skewed
towards 1- and 2-bedroom categories particularly in the affordable sectors. There is still a need for larger
homes but these would principally be in the market sector.
Figure 31: Final modelled mix of housing by size and tenure in LBW
Source: GLH Modelling
Indicative targets by tenure
10.51 Whilst the output of the modelling provides estimates of the proportion of homes of different sizes that are
needed, there are a range of factors that should be taken into account in setting policies for provision.
Hence it is reasonable to reflect these outputs as a range.
10.52 This is particularly the case in the affordable sector where there are typically issues around the demand
for and turnover of one-bedroom homes (as well as allocations to older person households) – e.g. one
bedroom homes provide limited flexibility for households (e.g. a couple household expecting to start a
12%
36%
35%
17%
32%
46%
16%
6%
37%
34%
22%
6%
0% 5% 10% 15% 20% 25% 30% 35% 40% 45% 50%
1-bedroom
2-bedrooms
3-bedrooms
4+-bedrooms
Affordable housing (rented) Affordable home ownership Market

Wandsworth Local Housing Needs Assessment, Affordable housing split
GL Hearn Page 106 of 176
Wandsworth LHNA
Official
family) and as a result can see relatively high levels of turnover – therefore, it may not be appropriate to
provide as much one-bedroom stock as is suggested by the modelling exercise.
10.53 At the other end of the scale, we need to consider that the stock of 4-bedroom affordable housing is very
limited and tends to have a very low turnover. As a result, whilst the number of households coming forward
for 4+-bedroom homes is typically quite small, the ability for these needs to be met is even more limited.
10.54 The Housing Register data provided by the Council suggested that as of 1st April 2019, there was the
following need (this only includes those households highlighted as being in the “general needs queue”:
(1-bed: 45%, 2-bed: 28%, 3-bed: 19%, 4+-bed: 8%). This broadly aligns with the output above.
10.55 Finally, in order to sense-check these recommendations, it is worth considering the levels of over and
under-occupation of housing in the Borough. The most recent, available data is the Census 2011, and
this is set out in the table below. For the purposes of comparison, the London average is provided.
10.56 While there is a high level of under-occupation among those dwellings in owner-occupation (36% of
households in Wandsworth and 35% in London have at least 2 more bedrooms than they “need”), this
falls for Social and Private rented homes to 8% and 7% respectively.
Occupancy Rating for key tenures, London and Wandsworth
Occupancy Rating
Owned/Shared Ownership
Social rented Private rented
LBW London LBW London LBW London
2 36% 35% 8% 8% 7% 7%
1 35% 35% 20% 20% 25% 23%
0 26% 24% 56% 56% 56% 52%
-1 3% 5% 15% 17% 12% 18%
Source: Census 2011
10.57 Of particular note is the level of over-crowding in the social rental sector which exceeds in the PRS in
Wandsworth by 3% points, suggesting the provision of more larger social dwellings may be appropriate,
although there is also a level of under-occupied stock which could address this.
10.58 The Census does not record occupancy rating by size of dwelling (either habitable rooms or number of
bedrooms), it is therefore not possible to ascertain whether additional 3 or 4-bedroom homes are required
on this basis. However, in Chapter 5 it was identified that, since 2011/12, the delivery of 3 and 4 bedroom
affordable homes has averaged 13% and 3% (totalling 16%) respectively of total new affordable homes.

Wandsworth Local Housing Needs Assessment, Affordable housing split
GL Hearn Page 107 of 176
Wandsworth LHNA
Official
10.59 While there is no evidence to suggest these sizes of dwelling should be individually increased, the data
relating to over-crowding set out in the table above suggests the quantum of 3 and 4 bedroom homes
should be lifted from 16% of total new affordable homes to around 20%, with 3 bedroom homes continuing
to make up the majority.
10.60 There are thus a range of factors that are relevant in considering policies for the mix of affordable housing
(rented) sought through development schemes. At a Borough-wide level, the analysis would support
policies for the mix of social/affordable rented of:
• 1-bed properties: 40-45%
• 2-bed properties: 35-40%
• 3-bed properties: 15-20%
• 4-bed properties: 0-5%
10.61 The need for affordable housing of different sizes will vary by area and over time. In considering the mix
of homes to be provided within specific development schemes, the information herein should be brought
together with details of households currently on the Housing Register in the local area and the stock and
turnover of existing properties.
10.62 As regards Affordable Home Ownership (AHO), LBW has provided their Home Ownership Listing. This
provides evidence of the scale of demand for AHO products in Wandsworth. While this listing has entries
going back to 1995, a cut-off of based on only those entries added in the last 5 years (2014+) has been
used on the advice of LBW officers in order to arrive at an accurate expression of current demand.
10.63 In addition, in line with our recommendations in the affordable housing chapter that LBW should seek to
provide AHO dwellings valued at a price that is affordable to the average household income on the Home
Ownership Listing of £37,700, the list has been further filtered to exclude those on incomes beneath this
figure, as well as those earning above the London income threshold for Shared Ownership dwellings of
£90,000.
10.64 Having applied these filters, 1,068 entries appear. This group has been used to understand the need for
different sizes of AHO products in the Borough. It is important to note as an affordable housing product,
the number of bedrooms that appears on the list does not reflect the preference of the household, but
rather an appropriate size of dwelling based on occupancy ratings (a suitable size of home for a household
bearing in mind the number of individuals, their ages and the nature of their relationship one with another).
These findings reinforce the modelled outputs that dwellings of 1 and 2 bedrooms in size are most
appropriate, with 96.6% of households requiring dwellings of this size.

Wandsworth Local Housing Needs Assessment, Affordable housing split
GL Hearn Page 108 of 176
Wandsworth LHNA
Official
Entries on the home ownership list by number of bedrooms
Entries %
1-Bedroom 899 84.2%
2-Bedroom 132 12.4%
3-Bedroom 32 3.0%
+4-Bedroom 5 0.5%
Total 1,068 100%
Source: London Borough of Wandsworth
10.66 As a sensitivity to understand whether demand has changed over time, we have also examined the 197
entries on the Home Ownership list prior to 2014 (who also report an income of between £37,700pa and
£90,000pa). The results of this area set in the table below.
Entries on the home ownership list by number of bedrooms (pre 2014)
Entries %
1-Bedroom 154 78.2%
2-Bedroom 28 14.2%
3-Bedroom 9 4.6%
4-Bedroom 6 3.0%
Total 197 100%
Source: London Borough of Wandsworth
10.67 It is worth noting the slight shift towards larger dwellings compared with the previous table, with 9% of
households requiring dwellings of 3 bedrooms or more, compared with 3.5%. This suggests that the
delivery of a small number of larger AHO products should be provided to clear this apparent “backlog”.
10.68 On the basis of the evidence above, it is reasonable to put forward the following size distribution of AHO
dwellings:
• 1-bed properties: 30-35%
• 2-bed properties: 40%-45%
• 3-bed properties: 15%-20%
• 4-bed properties: 5%-10%
10.69 Finally, in the market sector, a balance of dwellings is suggested that takes account of both the demand
for homes and the changing demographic profile. We note market trends suggest strong demand for 1
and 2 bed properties, with 84% of all new dwellings completed since 2011 having been dwellings of this
size.

Wandsworth Local Housing Needs Assessment, Affordable housing split
GL Hearn Page 109 of 176
Wandsworth LHNA
Official
10.70 In addition, some consideration of the current stock profile is also relevant, particularly noting that the
proportion of 1- and 2-bedroom homes at the time of the last Census is substantially higher than the
London average (59% as against 54%). Overall, the following mix of market housing is suggested:
• Studio properties: 0-5%
• 1-bed properties: 30-40%
• 2-bed properties: 30-40%
• 3-bed properties: 15-25%
• 4-bed properties: 5-10%
10.71 Although the analysis has quantified this based on the market modelling and an understanding of the
current housing market. The ‘market’ is to some degree a better judge of what is the most appropriate
profile of homes to deliver at any point in time, and demand can change over time linked to macro-
economic factors and local supply.
10.72 Furthermore in heavily urbanised locations such as LBW density requirements will mean that the built
form will be skewed towards flatted development which tend to be more suitable for smaller homes. That
said when opportunity arrives for more family units this should be encouraged.
10.73 Ultimately the plan making process must include appropriate monitoring to ensure that future delivery is
not unbalanced when compared with the likely requirements as driven by the demographic change in the
area.
10.74 Crucially, the analysis was undertaken prior to the COVID-19 pandemic, and therefore does not
necessarily reflect potential changes in relation to out-migration and how this may affect the type and size
of home needed. Therefore, there is a need for the Council to maintain flexibility in its approach to the
provision of market housing in order to be able to be responsive to changing circumstances.
10.75 Development proposals should consider the relative propensity of different types of household to move,
and the effect a high churn rate has on communities, when considering the type and size of properties to
be provided.
Comparison with London SHMA
10.76 The analysis in this section follows a similar (but not identical) methodology to that used in the London
SHMA of 2017 (see Section 7 of the SHMA). The London SHMA starts out by projecting future
requirements based on the current mix and moves on to carry out a similar analysis based on household
growth (a similar method as above).

Wandsworth Local Housing Needs Assessment, Affordable housing split
GL Hearn Page 110 of 176
Wandsworth LHNA
Official
10.77 The London SHMA then adjusts these figures based on affordability and the backlog of need for housing
that has built-up in earlier years.
10.78 Overall, the core conclusions of the London SHMA are that 46% of all additional market homes should
have 1-bedroom, along with 37% of intermediate housing and 69% in the low-cost rent sector. It is noted
this does not necessarily reflect need in Wandsworth with 45% of the Housing Register (in a reasonable
preference category) having a need for a 1-bedroom home.
Ward Level analysis
10.79 This section examines ward level data to identify where there may be a case to diverge from the strategic
conclusions on housing size mix and specialist forms of housing. Although it should be stressed where it
is deemed appropriate to diverge in one area a converse diversion is required elsewhere i.e. a focus on
smaller homes in one area should be met with larger homes in another.
10.80 With this in mind, where a recommendation has been made for larger family dwellings in St. Mary’s Park,
West Hill and West Putney on the basis of demographic variations from the Borough average, there is a
case for more smaller (low cost) market homes in Northcote and Queenstown to respond to a relatively
high Median Affordability Ratio.
10.81 We have initially set out in the table below a number of key indicators for each ward in the Borough. This
includes the age and stock profile of each wards as well as selected market signals.
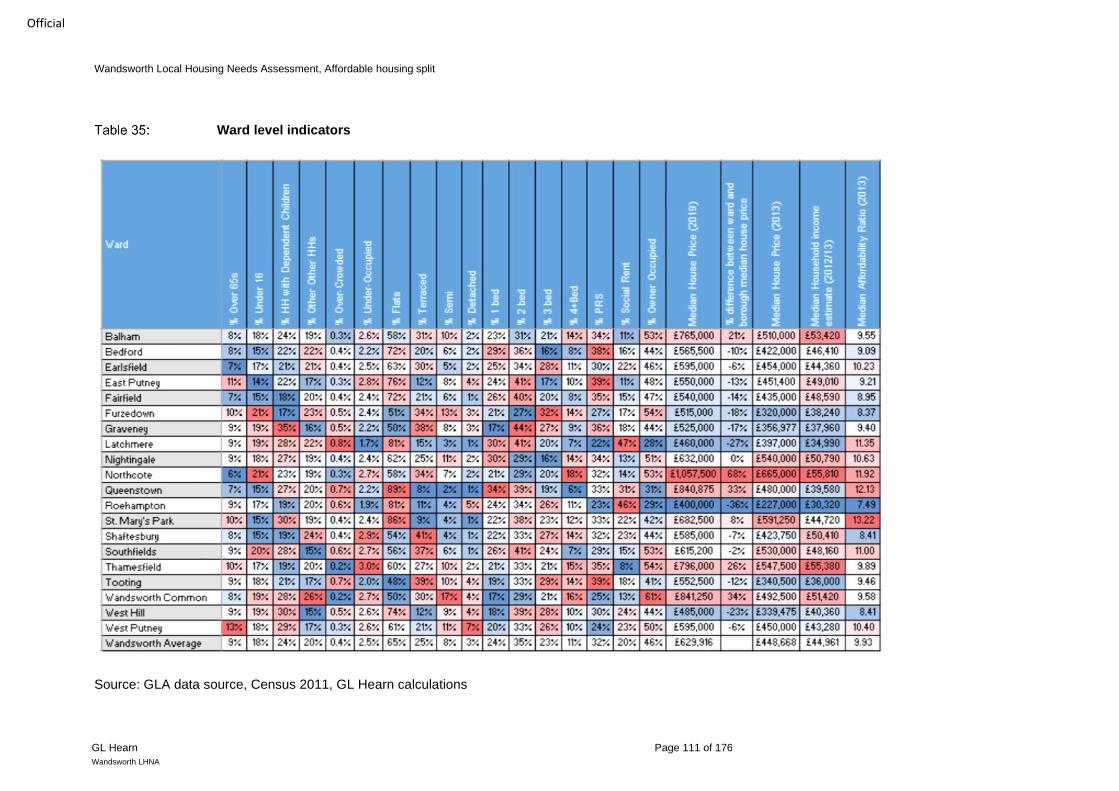
Wandsworth Local Housing Needs Assessment, Affordable housing split
GL Hearn Page 111 of 176
Wandsworth LHNA
Official
Ward level indicators
Source: GLA data source, Census 2011, GL Hearn calculations

Wandsworth Local Housing Needs Assessment, Affordable housing split
GL Hearn Page 112 of 176
Wandsworth LHNA
Official
Balham
10.82 Around 58% of units in Balham are flats, whereas in the Borough, the figure is 66%. The ward also has a
large proportion of terraced dwellings, at 31% compared with 25% in the Borough as a whole. This
translates into a smaller proportion of homes of 1 or 2 bedrooms (54%) than the Borough average (59%).
There is a substantial difference in the proportion of homes that are social rent, 20% in the Borough, as
against 11% in Balham.
10.83 In 2019, the median house price in Balham was 21% higher than the Borough average. There was little
difference in the MAR however, reflecting above average median incomes in the ward.
10.84 According to LBW’s monitoring data, between 2011 and 2019, 315 units were completed, of which 67
were affordable (17%). The table below shows the distribution in terms of size of home, with the majority
in both market and affordable sectors being 1 or 2 bedroom dwellings.
Net uplift in different sizes of home by tenure (Balham ward) 2011-19
Studio Units
1 Bed 2 Bed 3 Bed 4 Bed 5+ Bed
Affordable 0% 52% 40% 7% 0% 0%
Market 3% 35% 45% 7% 8% 2%
Source: LBW
10.85 Based on GLA data from 2015, the demographic profile of Balham is similar to the rest of the Borough.
Moreover, the variations detected in the data are not sufficiently extreme to warrant a different balance of
tenures and mix of homes from the strategic recommendations put forward in this chapter.
Bedford
10.86 A higher proportion of all units are flats (72%) when compared with the Borough (65%), and a smaller
proportion of terraced dwellings (20% against 25%). This translates into a higher proportion of 1 and 2
bedroom units (65%) compared with the Borough (59%). In terms of the split of tenure, there are a higher
proportion of PRS dwellings, and a smaller proportion of social rented homes.
10.87 The median house price in 2019 was 10% lower in Bedford than the Borough median, and dwellings were
slightly more affordable to residents.
10.88 Since 2011, Bedford has seen around 179 units built, of which 16 (9%) were affordable. The table below
sets out the distribution in terms of number of bedrooms, showing the majority of new development at the
smaller end of the scale. The majority of homes built over this period were flats.

Wandsworth Local Housing Needs Assessment, Affordable housing split
GL Hearn Page 113 of 176
Wandsworth LHNA
Official
Net uplift in different sizes of home by tenure (Bedford ward) 2011-19
Studio Units
1 Bed 2 Bed 3 Bed 4 Bed 5+ Bed
Affordable 0% 38% 56% 6% 0% 0%
Market 6% 36% 49% 12% -4% 2%
Source: LBW
10.89 In demographic terms, Bedford is close to the borough average. The variations detected in the data are
not sufficient to warrant a different balance of tenures and mix of homes from the recommendations at
Borough level.
Earlsfield
10.90 Earlsfield displays similar characteristics to the Borough average across all indicators, suggesting the
strategic recommendations as regards housing mix are appropriate.
10.91 Between 2011 and 2019, 393 units were built, of which 84 (21%) were affordable. The majority of these
units (both market and affordable) were 1 and 2 bedroom flats.
Net uplift in different sizes of home by tenure (Earlsfield ward) 2011-19
Studio Units
1 Bed 2 Bed 3 Bed 4 Bed 5+ Bed
Affordable 0% 50% 50% 0% 0% 0%
Market 4% 35% 47% 4% 10% 0%
Source: LBW
Putney East
10.92 According to GLA data from 2015, Putney East has an age structure that is slightly different from the rest
of the Borough. The population aged 65+ is 2% greater and there are 4% fewer people age under 16.
10.93 The evidence gathered suggests there is a significantly higher proportion of dwellings that are flats in the
ward (76% as against 65% in the borough), and a lower proportion that are terraced homes (12% as
against 25%). In part, this explains the higher overall proportion of 1 and 2 bedrooms in East Putney (65%
compared with 59% in the Borough).
10.94 There is also a marked variation in the proportion of PRS units in the ward compared with the Borough
(39% against 32%) and a lower proportion that are social rent (11% against 20%).

Wandsworth Local Housing Needs Assessment, Affordable housing split
GL Hearn Page 114 of 176
Wandsworth LHNA
Official
10.95 Median house prices are 13% lower in East Putney compared with Wandsworth, and homes are
marginally more affordable to residents. Again this can be linked to the smaller stock
10.96 Since 2011, the ward has seen a substantial amount of development, with around 867 new homes being
built. Of these, 147 (17%) were affordable. the overwhelming majority of these units were flats (98%), and
the focus was 1 and 2 bedroom properties. These constituted 93% of affordable units, and 97% of market
units.
Net uplift in different sizes of home by tenure (East Putney ward) 2011-19
Studio Units
1 Bed 2 Bed 3 Bed 4 Bed 5+ Bed
Affordable 0% 51% 42% 7% 0% 0%
Market -6% 27% 70% 8% 1% 1%
Source: LBW
10.97 While small demographic variations exist, they are not sufficient to warrant a different balance of tenures
and mix of homes from the recommendations at Borough level.
Fairfield
10.98 The Fairfield Ward shows significant variations in type of home compared with the Borough average, with
72% flats and 1% detached homes. These compare with the Borough at 65% and 3% respectively. In
part, this explains the higher overall proportion that are 1 and 2 bedroom in Fairfield (66% compared with
59% in the Borough).
10.99 Median house prices are 14% lower in Fairfield compared with Wandsworth, and homes are marginally
more affordable to residents. Again this can be linked to the smaller stock.
10.100 The ward saw 519 units delivered between 2011 and 2019, of which 15 (3%) were affordable. A large
minority of these units were medium sized (3 or 4 bedroom) homes, 27% of the affordable units, and 23%
of the market units. Despite this, 96% were flats.
Net uplift in different sizes of home by tenure (East Putney ward) 2011-19
Studio Units
1 Bed 2 Bed 3 Bed 4 Bed 5+ Bed
Affordable 0% 7% 67% 20% 7% 0%
Market 0% 37% 39% 21% 2% 0%
Source: LBW
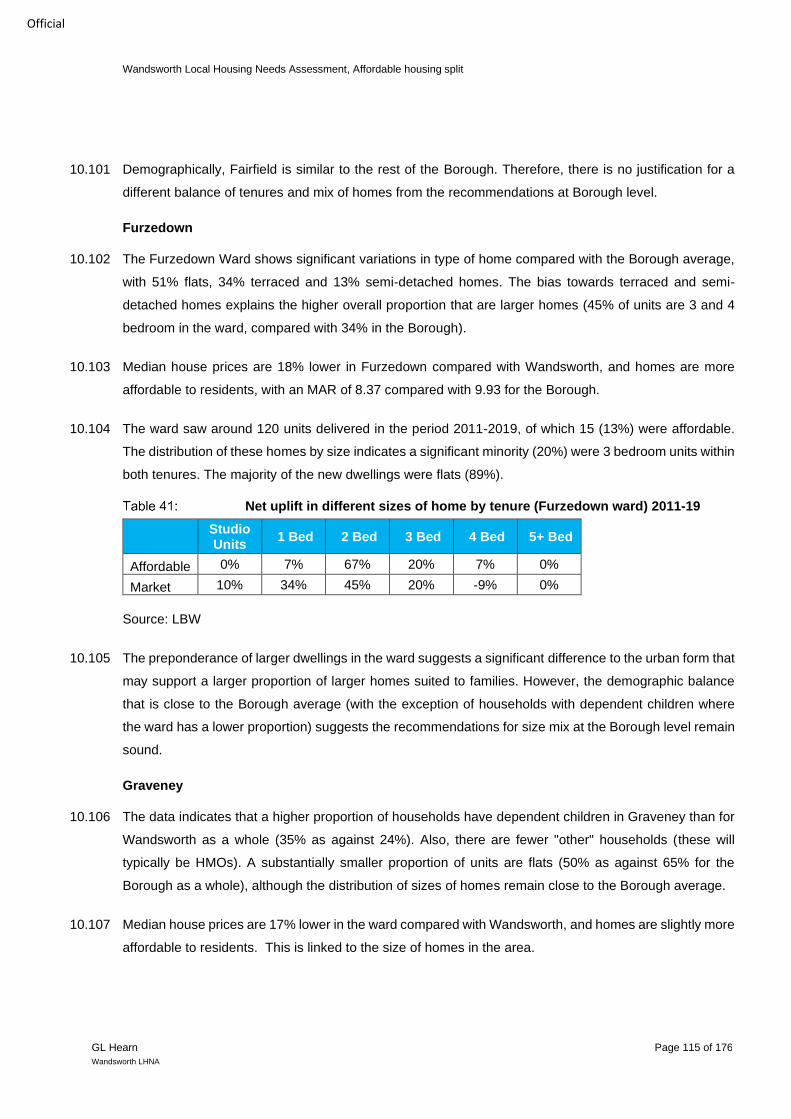
Wandsworth Local Housing Needs Assessment, Affordable housing split
GL Hearn Page 115 of 176
Wandsworth LHNA
Official
10.101 Demographically, Fairfield is similar to the rest of the Borough. Therefore, there is no justification for a
different balance of tenures and mix of homes from the recommendations at Borough level.
Furzedown
10.102 The Furzedown Ward shows significant variations in type of home compared with the Borough average,
with 51% flats, 34% terraced and 13% semi-detached homes. The bias towards terraced and semi-
detached homes explains the higher overall proportion that are larger homes (45% of units are 3 and 4
bedroom in the ward, compared with 34% in the Borough).
10.103 Median house prices are 18% lower in Furzedown compared with Wandsworth, and homes are more
affordable to residents, with an MAR of 8.37 compared with 9.93 for the Borough.
10.104 The ward saw around 120 units delivered in the period 2011-2019, of which 15 (13%) were affordable.
The distribution of these homes by size indicates a significant minority (20%) were 3 bedroom units within
both tenures. The majority of the new dwellings were flats (89%).
Net uplift in different sizes of home by tenure (Furzedown ward) 2011-19
Studio Units
1 Bed 2 Bed 3 Bed 4 Bed 5+ Bed
Affordable 0% 7% 67% 20% 7% 0%
Market 10% 34% 45% 20% -9% 0%
Source: LBW
10.105 The preponderance of larger dwellings in the ward suggests a significant difference to the urban form that
may support a larger proportion of larger homes suited to families. However, the demographic balance
that is close to the Borough average (with the exception of households with dependent children where
the ward has a lower proportion) suggests the recommendations for size mix at the Borough level remain
sound.
Graveney
10.106 The data indicates that a higher proportion of households have dependent children in Graveney than for
Wandsworth as a whole (35% as against 24%). Also, there are fewer "other" households (these will
typically be HMOs). A substantially smaller proportion of units are flats (50% as against 65% for the
Borough as a whole), although the distribution of sizes of homes remain close to the Borough average.
10.107 Median house prices are 17% lower in the ward compared with Wandsworth, and homes are slightly more
affordable to residents. This is linked to the size of homes in the area.

Wandsworth Local Housing Needs Assessment, Affordable housing split
GL Hearn Page 116 of 176
Wandsworth LHNA
Official
10.108 Between 2011 and 2019, Graveney saw around 370 units completed; of these 127 (34%) were affordable.
The new affordable units included 17% of 3 bedrooms in size. The market units were, however,
concentrated at the lower end of the size spectrum, with almost all units studios or 1 or 2 bedroom homes.
Only 6 units, or 2% of supply, were 3 bedroom market dwellings.
Net uplift in different sizes of home by tenure (Graveney ward) 2011-19
Studio Units
1 Bed 2 Bed 3 Bed 4 Bed 5+ Bed
Affordable 0% 25% 57% 17% 0% 0%
Market 9% 47% 46% 2% -3% -2%
Source: LBW
10.109 Given the significant demographic variation detected in Graveney, there is an argument to support a
slightly higher proportion of market housing suited to families (3 bedroom homes) than for the borough as
a whole.
Latchmere
10.110 Latchmere ward shows significant variations in type of home compared with the Borough average, with
81% flats, 15% terraced and 3% semi-detached homes, as against 65%, 25% and 8% for these dwelling
types in Wandsworth respectively.
10.111 This translates into a marked difference in the size of homes, with 71% of dwellings in the ward having 1
or 2 bedrooms, compared with 59% in the Borough. At the other end of the size spectrum, there are 27%
are units of 3 and 4 bedrooms, compared with 34% in the Borough.
10.112 In terms of tenures of home, there is a significant concentration of social rented homes in the Ward (47%
of all dwellings are of this tenure). Conversely, there are substantially fewer market dwellings.
10.113 Median house prices are 27% lower in Latchmere compared with Wandsworth. Homes are, however, less
affordable to residents, with an MAR of 11.35 compared with 9.93 for the Borough. This may in part
explain the proportion of households that are over-crowded in the ward which, at 0.81%, is almost twice
that of the Borough, at 44%.
10.114 Over the period 2011-2019, the ward saw around 412 new units delivered. Of these, 94 (23%) were
affordable. 12% of both new affordable and market homes were 3 bedroom, and the balance accounted
for by dwellings of 1 and 2 bedrooms. The overwhelming majority of these homes were flats (96%).

Wandsworth Local Housing Needs Assessment, Affordable housing split
GL Hearn Page 117 of 176
Wandsworth LHNA
Official
Net uplift in different sizes of home by tenure (Latchmere ward) 2011-19
Studio Units
1 Bed 2 Bed 3 Bed 4 Bed 5+ Bed
Affordable 1% 38% 49% 12% 0% 0%
Market 0% 33% 53% 12% 1% 0%
Source: LBW
10.115 The demographic evidence does not indicate a significant variation from Borough averages in Latchmere.
It is however worth noting the concentration social rented homes in the ward. This may support policy that
seeks to distribute affordable homes more evenly in the Borough in the interests of maintaining balanced
communities.
Nightingale
10.116 Nightingale ward displays similar characteristics to the Borough average across all indicators, suggesting
the strategic recommendations as regards housing mix are appropriate.
10.117 The ward saw around 290 units built between 2011 and 2019, of which 34 (12%) were affordable. The
majority of the units were 1 and 2 bedrooms in size.
Net uplift in different sizes of home by tenure (Latchmere ward) 2011-19
Studio Units
1 Bed 2 Bed 3 Bed 4 Bed 5+ Bed
Affordable 0% 24% 62% 15% 0% 0%
Market 3% 30% 51% 9% 4% 3%
Source: LBW
Northcote
10.118 The Northcote ward is similar to the Borough in indicators, although the ward shows a higher proportion
of 4 bedroom dwellings (18% as against 11%) compared with the Borough, and a substantially lower
proportion of social rent units (14% as against 20%).
10.119 The median house price is also the highest in the Borough, 68% higher than Borough average. Homes
are also less affordable to residents, with an MAR of 11.92 compared with 9.93 for the Borough.
10.120 The ward saw 189 units delivered between 2011 and 2019, of which 14 (7%) were affordable.

Wandsworth Local Housing Needs Assessment, Affordable housing split
GL Hearn Page 118 of 176
Wandsworth LHNA
Official
Net uplift in different sizes of home by tenure (Northcote ward) 2011-19
Studio Units
1 Bed 2 Bed 3 Bed 4 Bed 5+ Bed
Affordable -7% 21% 36% 0% 50% 0%
Market 13% 11% 56% 8% 10% 2%
Source: LBW
10.121 Demographically, Northcote is similar to the rest of the Borough. Moreover, the small variations detected
are not enough to warrant a different balance of tenures and mix of homes from the recommendations at
Borough level. Price signals however suggest additional smaller low cost market homes could be
delivered in Northcote to ease house prices, and bring the MAR closer to the Wandsworth average.
Queenstown
10.122 Demographically, the ward is similar to the Borough in most respects. There are, however, a higher
proportion of homes that are flats compared with the Borough (89% compared with 65%), and a lower
proportion of all other dwelling types. This translates into a higher proportion of small units (73% if homes
are 1 and 2 bedroom) and fewer larger dwellings. The ward also displays an above average proportion
of social rented units (31% as against 20%).
10.123 The median house price is also relatively high, 33% higher than the Borough average. Homes are also
less affordable to residents, with an MAR of 12.13 compared with 9.93 for the Borough. This is, however,
likely to be to do with the presence of high value dwellings in the same ward as a significant number of
households living in social rented accommodation.
10.124 The ward saw a large number of new units delivered over the period 2011-19 (around 4,000). These were
almost all flats (99%) and 15% were affordable.
Net uplift in different sizes of home by tenure (Queenstown ward) 2011-19
Studio Units
1 Bed 2 Bed 3 Bed 4 Bed 5+ Bed
Affordable 0% 37% 46% 14% 2% 0%
Market 0% 27% 58% 13% 1% 1%
Source: LBW
10.125 On account of the similarity between Queenstown ward and the Borough in demographic terms the
argument for a divergence from the strategic conclusions on housing size mix is weak. Price signals

Wandsworth Local Housing Needs Assessment, Affordable housing split
GL Hearn Page 119 of 176
Wandsworth LHNA
Official
however suggest additional smaller low cost market homes could be delivered in Queenstown to ease
house prices and bring the MAR closer to the Wandsworth average.
Roehampton
10.126 As with Queenstown Ward, Roehampton has a similar demographic profile to the Borough, and a large
proportion of flats (81% of all dwellings, with a correspondingly low proportion of other types of dwelling
compared with Wandsworth. Despite this, the distribution of sizes of home are close to the Borough
average. The area does have a substantial concentration of social rented homes (46% of all homes), with
a corresponding lower percentage of market dwellings.
10.127 Market homes are among the most affordable in the Borough, with prices 36% lower than the Borough
average, and a MAR of 7.49, compared with 9.93 for the Borough.
10.128 Roehampton saw 112 units delivered between 2011 and 2019, of which 21 (19%) were affordable.
Net uplift in different sizes of home by tenure (Queenstown ward) 2011-19
Studio Units
1 Bed 2 Bed 3 Bed 4 Bed 5+ Bed
Affordable 0% 71% 24% 5% 0% 0%
Market 3% 21% 45% 11% -2% 22%
Source: LBW
10.129 Given the demographic similarity with the Borough, the argument for any divergence from strategic
recommendations at the Borough level is weak. It is however worth noting the concentration of social
rented homes in the ward. This may support a policy that seeks to distribute affordable homes more
evenly in the borough in the interests of maintaining balanced communities.
St. Mary's Park
10.130 St Mary's displays a significantly higher proportion of households with dependant children, and has a
relative concentration of flats, and fewer other types of property. In other respects it is close to the Brough
average.
10.131 St. Mary’s is one of the least affordable parts of the borough, with an MAR of 13.22.
10.132 The ward saw a substantial amount of development between 2011 and 2019, around 1,900 homes, of
which 26% were affordable. The distribution of these homes by size focussed on one and two bedroom
homes, although 10% of affordable and 13% of market units were 3 bedroom dwellings. Flats constituted
98% of all homes delivered.

Wandsworth Local Housing Needs Assessment, Affordable housing split
GL Hearn Page 120 of 176
Wandsworth LHNA
Official
Net uplift in different sizes of home by tenure (St. Mary’s ward) 2011-19
Studio Units
1 Bed 2 Bed 3 Bed 4 Bed 5+ Bed
Affordable 2% 42% 46% 10% 0% 0%
Market 4% 26% 55% 13% 1% 1%
Source: LBW
10.133 The evidence gathered suggests a misalignment between the supply and demand for homes, with a
relatively large population of families with children, and a weak stock suited to their needs. There is,
therefore, some justification for a seeking a balance of supply towards the upper end of the range for 3
and 4 bedroom market homes in St Mary’s.
Shaftesbury
10.134 The demographic evidence gathered for Shaftesbury indicates similarity with the Borough average. The
area does however have a relative concentration of terraced dwellings.
10.135 Between 2011 and 2019, 225 units were delivered in the ward, of which 12 (5%) were affordable.
Net uplift in different sizes of home by tenure (Shaftesbury ward) 2011-19
Studio Units
1 Bed 2 Bed 3 Bed 4 Bed 5+ Bed
Affordable 0% 33% 67% 0% 0% 0%
Market 0% 39% 42% 17% 3% -1%
Source: LBW
10.136 Given the demographic similarity with the Borough, the argument for any divergence from strategic
recommendations at the Borough level is weak.
Southfields
10.137 Southfields displays similar characteristics to the Borough average across all indicators, suggesting the
strategic recommendations as regards housing mix are appropriate.
10.138 The ward saw a substantial number of units delivered between 2011 and 2019 (860) or which 20% were
affordable and 98% were flats.
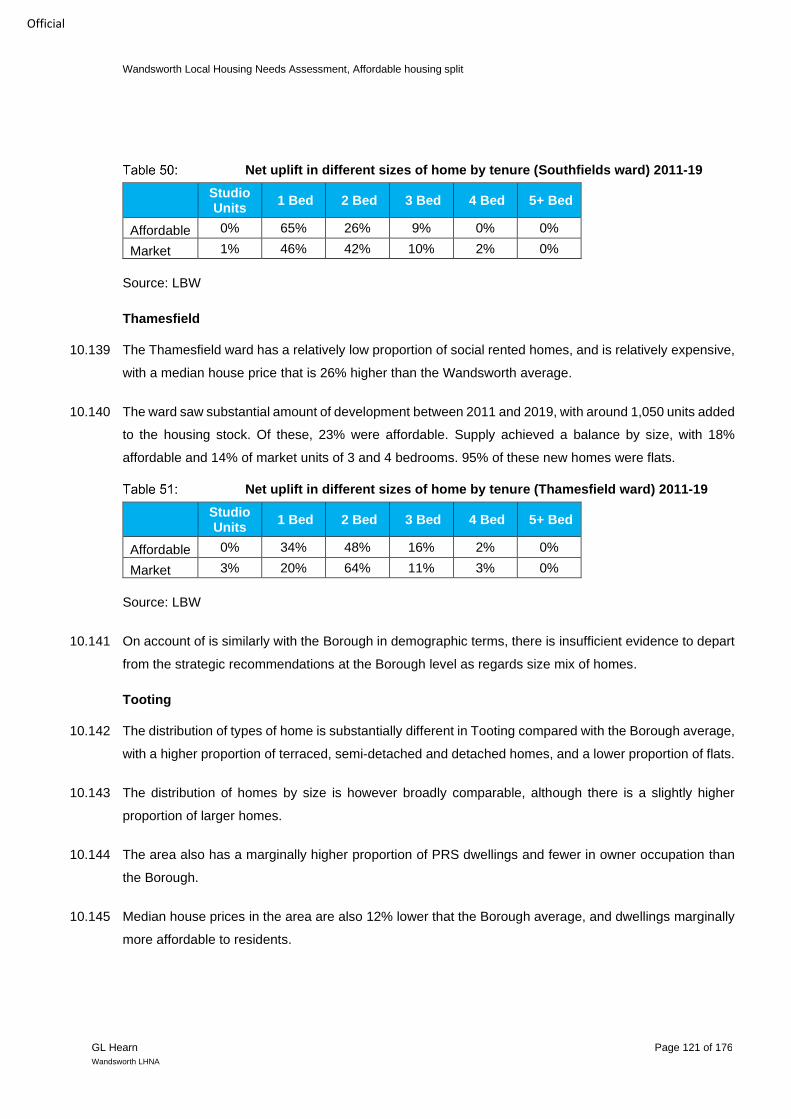
Wandsworth Local Housing Needs Assessment, Affordable housing split
GL Hearn Page 121 of 176
Wandsworth LHNA
Official
Net uplift in different sizes of home by tenure (Southfields ward) 2011-19
Studio Units
1 Bed 2 Bed 3 Bed 4 Bed 5+ Bed
Affordable 0% 65% 26% 9% 0% 0%
Market 1% 46% 42% 10% 2% 0%
Source: LBW
Thamesfield
10.139 The Thamesfield ward has a relatively low proportion of social rented homes, and is relatively expensive,
with a median house price that is 26% higher than the Wandsworth average.
10.140 The ward saw substantial amount of development between 2011 and 2019, with around 1,050 units added
to the housing stock. Of these, 23% were affordable. Supply achieved a balance by size, with 18%
affordable and 14% of market units of 3 and 4 bedrooms. 95% of these new homes were flats.
Net uplift in different sizes of home by tenure (Thamesfield ward) 2011-19
Studio Units
1 Bed 2 Bed 3 Bed 4 Bed 5+ Bed
Affordable 0% 34% 48% 16% 2% 0%
Market 3% 20% 64% 11% 3% 0%
Source: LBW
10.141 On account of is similarly with the Borough in demographic terms, there is insufficient evidence to depart
from the strategic recommendations at the Borough level as regards size mix of homes.
Tooting
10.142 The distribution of types of home is substantially different in Tooting compared with the Borough average,
with a higher proportion of terraced, semi-detached and detached homes, and a lower proportion of flats.
10.143 The distribution of homes by size is however broadly comparable, although there is a slightly higher
proportion of larger homes.
10.144 The area also has a marginally higher proportion of PRS dwellings and fewer in owner occupation than
the Borough.
10.145 Median house prices in the area are also 12% lower that the Borough average, and dwellings marginally
more affordable to residents.

Wandsworth Local Housing Needs Assessment, Affordable housing split
GL Hearn Page 122 of 176
Wandsworth LHNA
Official
10.146 Over the period 2011-2019, Tooting saw around 330 units added to the housing stock. Of these 14%
were affordable. Of the affordable and market units, 22% and 14% were 3 bedroom respectively. the
majority of the new homes were flats (94%).
Net uplift in different sizes of home by tenure (Tooting ward) 2011-19
Studio Units
1 Bed 2 Bed 3 Bed 4 Bed 5+ Bed
Affordable 0% 44% 33% 22% 0% 0%
Market 10% 29% 51% 14% -3% -2%
Source: LBW
10.147 While the demographic profile is similar, the area has one of the highest proportions of terraced housing
in the Borough. For this reason it may be an appropriate area for housing of a types and size suited to
families.
Wandsworth Common
10.148 Data for Wandsworth Common shows significant variation with the borough in terms of the distribution of
sizes of home, with a lower proportion of flats, and a higher proportion of terraced, semi-detached and
detached homes.
10.149 This translates into a lower proportion of 1 bed homes (17% as against 24%) and a greater proportion of
4 bedroom homes (16% as against 11%).
10.150 Median house prices are 34% higher in Wandsworth Common than the borough average. On account of
substantially higher median incomes, however, affordability is similar to the borough average.
10.151 The area saw the lowest number of net new homes delivered between 2011 and 2019 (90).
Net uplift in different sizes of home by tenure (Wandsworth Common ward)
2011-19
Studio Units
1 Bed 2 Bed 3 Bed 4 Bed 5+ Bed
Affordable 0% 44% 33% 22% 0% 0%
Market 0% -7% -18% 36% 51% 38%
Source: LBW
10.152 On account of is similarly with the borough in demographic terms, there is insufficient evidence to depart
from the strategic recommendations at the Borough level.

Wandsworth Local Housing Needs Assessment, Affordable housing split
GL Hearn Page 123 of 176
Wandsworth LHNA
Official
West Hill
10.153 The West Hill ward is close to the Borough in respect of demographics, with the exception of families with
dependent children where it is higher (30% of households as against 24%). The ward also departs from
the Borough average in respect of dwelling type. There are a higher proportion of flats, and a lower
proportion of terraced homes; despite this, the distribution of sizes of home is close to the Borough
average.
10.154 The median house price is 23% lower in the ward than the Borough, and dwellings correspondingly more
affordable.
10.155 Between 2011 and 2019, the area saw 160 new homes, of which 6 (4%) were affordable. Development
in West Hill shows a broader range of sizes of home than elsewhere in the Borough, with 46% of the new
stock being houses. This is reflected in the size of dwellings, with 48% of new market homes delivered
over the period of 3, 4 and 5+ bedrooms.
Net uplift in different sizes of home by tenure (West Hill ward) 2011-19
Studio Units
1 Bed 2 Bed 3 Bed 4 Bed 5+ Bed
Affordable 0% 50% 17% 33% 0% 0%
Market 0% 16% 36% 17% 29% 2%
Source: LBW
10.156 As with St. Mary's ward there may be an under-supply of family housing in West Hill, given the relatively
large population of families with dependent children, and a shortage of stock suited to their needs. There
is, therefore, some justification for a seeking a balance of supply towards the upper end of the range for
3 and 4 bedroom market homes.
West Putney
10.157 The West Putney ward has a slightly different demographic structure to the Borough, with a higher
proportion of over 65s (13% as against 9%) and households with dependant children (29% as against
24%). The area is, however, similar to the borough average in terms pf the types and sizes of home, as
well as house prices and affordability.
10.158 Over the 2011-2019 period, the area has seen a net increase of 505 units, of which 27 (5%) were
affordable. Market provision includes a substantial share of mid-size and larger homes (45% of this new
stock is of 3, 4, 5 bedrooms in size and 39% are houses).

Wandsworth Local Housing Needs Assessment, Size and tenure mix to 2037
GL Hearn Page 124 of 176
Wandsworth LHNA
Official
Net uplift in different sizes of home by tenure (West Putney ward) 2011-19
Studio Units
1 Bed 2 Bed 3 Bed 4 Bed 5+ Bed
Affordable 0% 48% 44% 7% 0% 0%
Market 0% 8% 47% 8% 30% 7%
Source: LWB
10.159 Given the differences identified in the demographic profile, there is some justification for seeking a
balance of 3 and 4 bedroom market family homes at the upper end of the strategic size mix
recommendations. In addition, given the relative popularity of the neighbourhood with older residents,
focussing the provision of homes suited to this group in West Putney.
Size and tenure mix to 2037
10.160 The table below set out the distribution of housing stock by size and tenure at 2011, 2019 and 2037. The
figures for 2037 assume the annual housing targets associated with the standard method are achieved,
and the size mix is in line with the strategic recommendations in this report.
10.161 The affordable housing numbers assume 35% of new build dwellings are affordable for sites with a
capacity of 10 or more units (major sites), in conformity with London Plan and National Planning Policy
Framework. To arrive at the proportion of sites that are small (and therefore will not attract affordable
housing), it is assumed 10% of LBW's land supply will fall into this category (this assumes LWB will identify
10% of their land supply from small sites, in line with NPPF paragraph 68 a)).
Size and tenure mix (LBW) 2037
Tenure Bedrooms 2011 2019 2037
Market
1 21,433 24,146 27,485
2 36,808 42,292 52,310
3 24,341 26,413 35,095
4 21,395 21,849 26,524
Affordable housing
1 10,042 11,056 16,582
2 9,471 10,480 15,252
3 5,668 5,974 8,982
4 1,335 1,402 2,481
Total 130,493 143,612 184,711
Source: GL Hearn calculations

Wandsworth Local Housing Needs Assessment, Size and tenure mix to 2037
GL Hearn Page 125 of 176
Wandsworth LHNA
Official
10.162 Our recommendations are based on a certain set of assumptions but that it is ultimately for the Council
to make final judgements for their policies based on range of other considerations including viability,
affordable housing funding and local objectives such as supporting downsizing or attracting families etc.
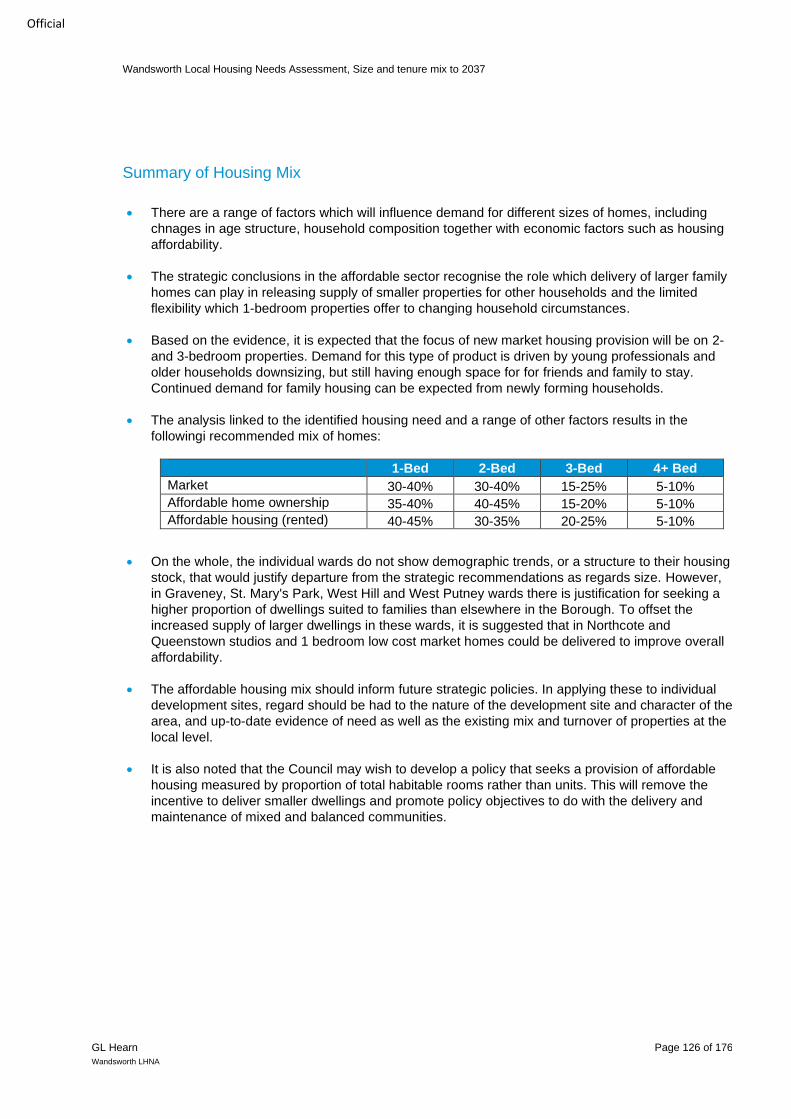
Wandsworth Local Housing Needs Assessment, Size and tenure mix to 2037
GL Hearn Page 126 of 176
Wandsworth LHNA
Official
Summary of Housing Mix
• There are a range of factors which will influence demand for different sizes of homes, including
chnages in age structure, household composition together with economic factors such as housing
affordability.
• The strategic conclusions in the affordable sector recognise the role which delivery of larger family
homes can play in releasing supply of smaller properties for other households and the limited
flexibility which 1-bedroom properties offer to changing household circumstances.
• Based on the evidence, it is expected that the focus of new market housing provision will be on 2-
and 3-bedroom properties. Demand for this type of product is driven by young professionals and
older households downsizing, but still having enough space for for friends and family to stay.
Continued demand for family housing can be expected from newly forming households.
• The analysis linked to the identified housing need and a range of other factors results in the
followingi recommended mix of homes:
1-Bed 2-Bed 3-Bed 4+ Bed
Market 30-40% 30-40% 15-25% 5-10%
Affordable home ownership 35-40% 40-45% 15-20% 5-10%
Affordable housing (rented) 40-45% 30-35% 20-25% 5-10%
• On the whole, the individual wards do not show demographic trends, or a structure to their housing
stock, that would justify departure from the strategic recommendations as regards size. However,
in Graveney, St. Mary's Park, West Hill and West Putney wards there is justification for seeking a
higher proportion of dwellings suited to families than elsewhere in the Borough. To offset the
increased supply of larger dwellings in these wards, it is suggested that in Northcote and
Queenstown studios and 1 bedroom low cost market homes could be delivered to improve overall
affordability.
• The affordable housing mix should inform future strategic policies. In applying these to individual
development sites, regard should be had to the nature of the development site and character of the
area, and up-to-date evidence of need as well as the existing mix and turnover of properties at the
local level.
• It is also noted that the Council may wish to develop a policy that seeks a provision of affordable
housing measured by proportion of total habitable rooms rather than units. This will remove the
incentive to deliver smaller dwellings and promote policy objectives to do with the delivery and
maintenance of mixed and balanced communities.

Wandsworth Local Housing Needs Assessment, Size and tenure mix to 2037
GL Hearn Page 127 of 176
Wandsworth LHNA
Official
11 HOUSING NEEDS OF SPECIFIC GROUPS
Introduction
11.1 As part of understanding the local housing need, an analysis has been undertaken on the housing needs
of specific groups in LBW. The analysis draws on a range of statistics, including the population projections
and those suggested in the PPG. The discussion below begins by looking at the housing needs of older
persons’ and those with disabilities.
Older persons’ and those with disabilities
11.2 Planning Practice Guidance relating housing for older and disabled people is spread over two sections of
the guidance, “Housing for older and disabled people” and “Housing: optional technical standards”, and
they should be considered in conjunction to understand the range of topics plan-making authorities should
address, together with sources of evidence likely to be relevant and proportionate.
11.3 The first establishes the principle that plan-making authorities should address the housing needs of older
and disabled people50. It puts forward the standards that may be applied to dwellings such they are
suitable for occupation by such a person51 (M4(2): Accessible and adaptable dwellings and M4(3):
Wheelchair user dwellings); and identifies suitable sources of evidence to identify need52.
11.4 The second sets out the topics that should be addressed such that the Local Planning Authority (LPA)
responds to need in a meaningful way; these are:
• the likely future need for housing for older and disabled people (including wheelchair user
dwellings);
• size, location, type and quality of dwellings needed to meet specifically evidenced needs (for
example retirement homes, sheltered homes or care homes);
• the accessibility and adaptability of existing housing stock;
• how needs vary across different housing tenures; and
• the overall impact on viability.53
Older persons
11.5 Across the country as a result of the improvements to life expectancy the population of elderly people is
increasing, and, LBW is no exception. For this reason, a priority for the LHNA will be to provide a robust
forecast of the needs of older residents.
11.6 For the purposes of this study, we divide these into two age cohorts, those aged between 65 and 74 years
of age, and those aged 75 and above. This is determined by likely prevalence of different degrees of
50 PPG Paragraph: 006 Reference ID: 63-006-20190626 51 PPG Paragraph: 009 Reference ID: 63-009-20190626 52 PPG Paragraph: 005 Reference ID: 63-005-20190626 53 PPG Paragraph: 007 Reference ID: 56-007-20150327
Wandsworth Local Housing Needs Assessment, Size and tenure mix to 2037
GL Hearn Page 128 of 176
Wandsworth LHNA
Official
severity of disability, and the existence of authoritative guidance on planning for the housing needs of
those aged 75+.
11.7 It also allows plan-makers to identify need for specialist housing for older people that maps onto the four
types of dwelling identified in PPG:
• age-restricted general market housing,
• retirement living or sheltered housing,
• extra care housing or housing-with-care,
• residential care homes and nursing homes.54
11.8 In arriving at an understanding of older people’s housing need, the PPG provides two important points.
Firstly, plan-makers should address the needs those approaching retirement through to the very frail
elderly.55 The demographic spread is therefore very wide, and a correspondingly wide variety of homes
of different types and sizes should be considered. However, it is reasonable to assume the needs of many
older people will be met through mainstream housing, particularly where policy actively supports lifetime
homes56, bungalows and adaptations.
11.9 Secondly, they should help people live in their own, or mainstream housing, home for as long as possible57
particularly given it may be adapted of designed specifically to meet their needs. Plan-makers will
therefore need to identify the role that general housing may play as part of their assessment.58 By so
doing, they will be able reduce the assessed need in the area for all forms of specialist housing for the
elderly and avoid over-provision.
11.10 The purpose of this section of the LHNA is therefore to arrive at an understanding of the number of older
persons households that will arise by 2037; what proportion of this group’s housing needs made be
addressed through mainstream housing (allowing for both lifetime homes and the scope for adaptations);
and what the residual need is likely to be for Specialist Housing for the Older People (SHOP).
Older Persons Population Growth
11.11 The table below provides baseline population data about older persons in Wandsworth and compares
this with the London and England geographies. The data for has been taken from the published ONS
mid-year population estimates and is provided for age groups from 65 and upwards. The data is for 2018
and reflects the latest published data for local authority areas and above.
11.12 The data shows, when compared with both the London and national positions that the Borough has a
lower proportion of older persons, although in the case of London is it only marginally so (2.4%).
54 PPG Paragraph: 010 Reference ID: 63-010-20190626 55 NPPF, glossary, page 69 56 See glossary 57 Planning Practice Guidance (Housing for older and disabled people) Paragraph: 012 Reference ID: 63-012-20190626 58 Planning Practice Guidance (Housing for older and disabled people) Paragraph: 012 Reference ID: 63-012-20190626
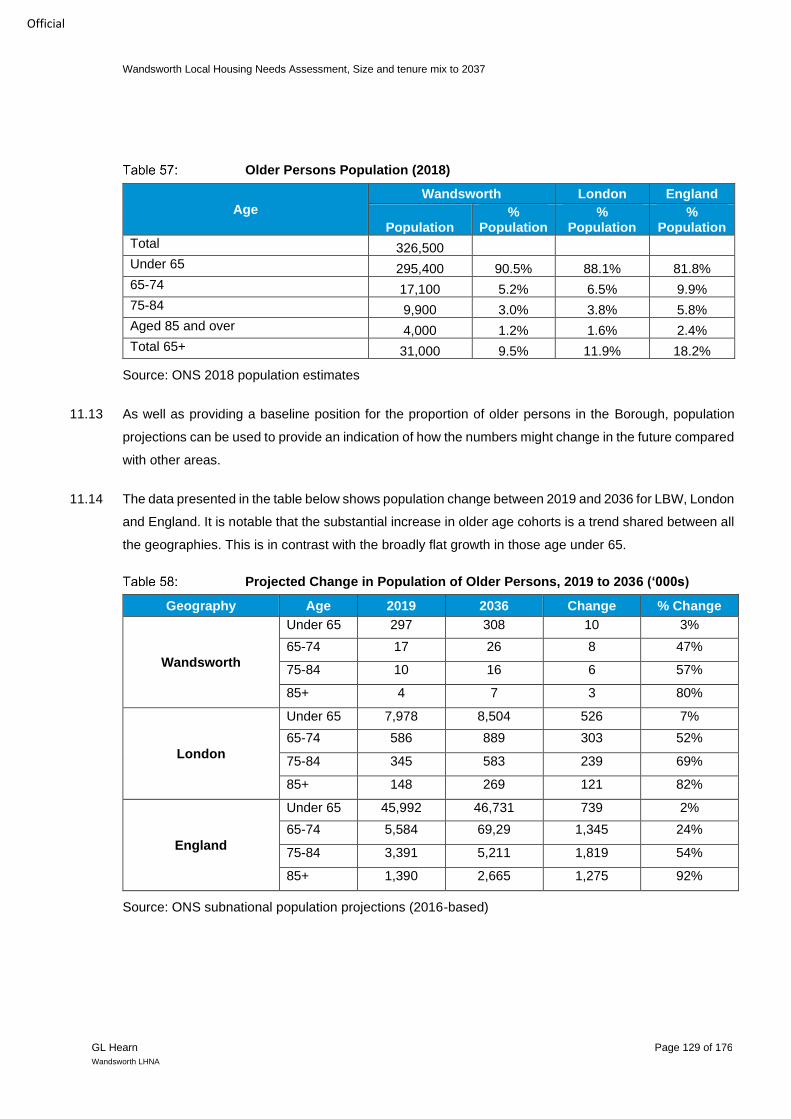
Wandsworth Local Housing Needs Assessment, Size and tenure mix to 2037
GL Hearn Page 129 of 176
Wandsworth LHNA
Official
Older Persons Population (2018)
Source: ONS 2018 population estimates
11.13 As well as providing a baseline position for the proportion of older persons in the Borough, population
projections can be used to provide an indication of how the numbers might change in the future compared
with other areas.
11.14 The data presented in the table below shows population change between 2019 and 2036 for LBW, London
and England. It is notable that the substantial increase in older age cohorts is a trend shared between all
the geographies. This is in contrast with the broadly flat growth in those age under 65.
Projected Change in Population of Older Persons, 2019 to 2036 (‘000s)
Geography Age 2019 2036 Change % Change
Wandsworth
Under 65 297 308 10 3%
65-74 17 26 8 47%
75-84 10 16 6 57%
85+ 4 7 3 80%
London
Under 65 7,978 8,504 526 7%
65-74 586 889 303 52%
75-84 345 583 239 69%
85+ 148 269 121 82%
England
Under 65 45,992 46,731 739 2%
65-74 5,584 69,29 1,345 24%
75-84 3,391 5,211 1,819 54%
85+ 1,390 2,665 1,275 92%
Source: ONS subnational population projections (2016-based)
Age
Wandsworth London England
Population %
Population %
Population %
Population
Total 326,500 Under 65 295,400 90.5% 88.1% 81.8% 65-74 17,100 5.2% 6.5% 9.9% 75-84 9,900 3.0% 3.8% 5.8% Aged 85 and over 4,000 1.2% 1.6% 2.4% Total 65+ 31,000 9.5% 11.9% 18.2%
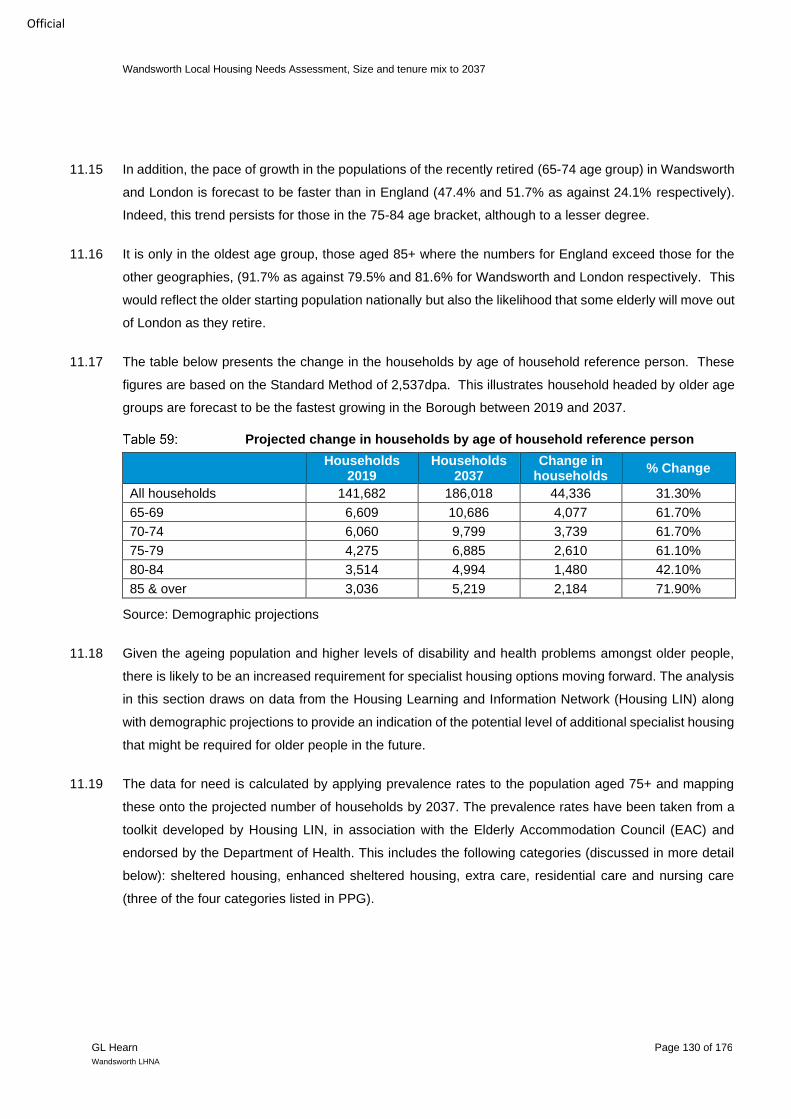
Wandsworth Local Housing Needs Assessment, Size and tenure mix to 2037
GL Hearn Page 130 of 176
Wandsworth LHNA
Official
11.15 In addition, the pace of growth in the populations of the recently retired (65-74 age group) in Wandsworth
and London is forecast to be faster than in England (47.4% and 51.7% as against 24.1% respectively).
Indeed, this trend persists for those in the 75-84 age bracket, although to a lesser degree.
11.16 It is only in the oldest age group, those aged 85+ where the numbers for England exceed those for the
other geographies, (91.7% as against 79.5% and 81.6% for Wandsworth and London respectively. This
would reflect the older starting population nationally but also the likelihood that some elderly will move out
of London as they retire.
11.17 The table below presents the change in the households by age of household reference person. These
figures are based on the Standard Method of 2,537dpa. This illustrates household headed by older age
groups are forecast to be the fastest growing in the Borough between 2019 and 2037.
Projected change in households by age of household reference person
Households 2019
Households 2037
Change in households
% Change
All households 141,682 186,018 44,336 31.30%
65-69 6,609 10,686 4,077 61.70%
70-74 6,060 9,799 3,739 61.70%
75-79 4,275 6,885 2,610 61.10%
80-84 3,514 4,994 1,480 42.10%
85 & over 3,036 5,219 2,184 71.90%
Source: Demographic projections
11.18 Given the ageing population and higher levels of disability and health problems amongst older people,
there is likely to be an increased requirement for specialist housing options moving forward. The analysis
in this section draws on data from the Housing Learning and Information Network (Housing LIN) along
with demographic projections to provide an indication of the potential level of additional specialist housing
that might be required for older people in the future.
11.19 The data for need is calculated by applying prevalence rates to the population aged 75+ and mapping
these onto the projected number of households by 2037. The prevalence rates have been taken from a
toolkit developed by Housing LIN, in association with the Elderly Accommodation Council (EAC) and
endorsed by the Department of Health. This includes the following categories (discussed in more detail
below): sheltered housing, enhanced sheltered housing, extra care, residential care and nursing care
(three of the four categories listed in PPG).

Wandsworth Local Housing Needs Assessment, Size and tenure mix to 2037
GL Hearn Page 131 of 176
Wandsworth LHNA
Official
Source: HOPSR
11.20 Additionally, the analysis draws on current supply estimates from HOPSR (Housing for Older People
Supply Recommendations) – a database developed by Sheffield Hallam University along with data from
the EAC which provides an indication of the current tenure mix of such accommodation.
Future Need
11.21 As well as setting out overall prevalence rates for different types of housing, the Housing LIN provides
some suggestions for the tenure split between rented and leasehold accommodation, this varies
depending on an area’s level of deprivation.
Definitions of Different Types of Older Persons’ Accommodation
Retirement/sheltered housing/age restricted general market housing:
A group of self-contained flats or bungalows typically reserved for people over the age of 55 or 60; some shared facilities lounge, garden, guest suite, laundry; plus on-site supportive management. A regularly visiting scheme manager as long as s/he is available to all residents when on site. An on-call-only service does not qualify a scheme to retirement/sheltered housing. Developments usually built for either owner occupation or renting on secure tenancies.
Enhanced sheltered housing:
Sheltered housing with additional services to enable older people to retain their independence in their own home possible. Typically, there may be 24/7 (non-registered) staffing cover, at least one daily meal will be provided additional shared facilities. Also called assisted living and very sheltered housing.
Extra care housing:
Schemes where a service registered to provide personal or nursing care is available on site 24/7. Typically, at will be provided and there will be additional shared facilities. Some schemes specialise in dementia care.
Care beds:
Care homes: Residential settings where a number of older people live, usually in single rooms, and have access to personal care services (such as help with washing and eating).
Care homes with nursing: These homes are similar to those without nursing care, but they also have to be registered to provide care for more complex health needs.

Wandsworth Local Housing Needs Assessment, Size and tenure mix to 2037
GL Hearn Page 132 of 176
Wandsworth LHNA
Official
11.22 Consideration has also been given to overall levels of disability in the older person population; given that
these are slightly lower in Wandsworth, a small downward adjustment has been made to the base
prevalence rates.
11.23 In the table below two categories of accommodation are used (in addition to care beds). These are a)
Housing with Support (which covers retirement/sheltered housing) and b) Housing with Care (which
includes the enhanced sheltered and extra-care housing). These are also split out by tenure. The table
sets out the need for specialist housing for people aged 75 and above in Wandsworth by 2037; this
indicates an overall need for 1,453 additional dwellings.
Older Persons’ Dwelling and Care Bedspace Requirements to 2037
Housing demand per 1,000
75+
Current supply
2019 demand
Current shortfall/ (surplus)
Additional demand to
2037
Shortfall/ (surplus) by 2037
Housing with support
Rented 52 1,953 731 -1,222 427 -795
Leasehold 71 45 994 949 581 1,530
Housing with care
Rented 22 156 310 154 181 335
Leasehold 22 109 311 202 182 384
Total (dwellings) 167 2,263 2,346 83 1,370 1,453
Care bed-spaces 108 1,146 1,518 372 887 1,258
Source: Derived from demographic projections and Housing LIN/HOPSR/EAC
11.24 The changes in provision are expressed in percentage terms in the table below. This makes clear the
very substantial uplift in leasehold dwellings within the “housing with support” type that is required over
the plan period if the Borough is to meet need.
11.25 The provision of rented homes for older people includes both private and affordable rented homes. For
the purposes of the LHNA, an assumption should be made however that the majority of these homes will
be for affordable housing.

Wandsworth Local Housing Needs Assessment, Size and tenure mix to 2037
GL Hearn Page 133 of 176
Wandsworth LHNA
Official
Older Persons’ Dwelling and Care Bedspace Requirements to 2037
(percentage uplift)
Type Tenure % change
Housing with support Rented -41%
Leasehold 3400%
Housing with care Rented 215%
Leasehold 352%
Total (dwellings) 64%
Care bedspaces 110%
Source: Derived from demographic projections and Housing LIN/HOPSR/EAC
11.26 It is worth noting that there currently exists an over-provision of housing with support for rent by some
1,222 units. This over-provision will however diminish by 2037 as demand picks up due to the ageing
population.
11.27 As regards "Housing with Care" an additional 719 dwellings are required by 2037, split roughly evenly
between dwellings for rent, and those for lease. Finally, as regards "care bed-spaces" an additional 1,258
spaces are required.
11.28 The estimated need for care bed-spaces is based on national prevalence rates. However, it should be
noted that in reality the proportion of people (aged 75 and over) in care home accommodation will also
be influenced by government policy and the potential promotion of health and social care service
interventions to prevent people needing to move into such accommodation.
11.29 In addition, it should be noted that the need/demand for housing with care and support is part of the overall
housing need (not additional to it). In meeting the need/demand there could be some changes to the mix
of housing required across the Borough.
Age group 65-74
11.30 As mentioned earlier, plan-makers are also required to address the needs of those reaching retirement
age by 2037. However, due to the published prevalence rates used above we have previously only
examined the need for those aged 75 and over. This is because the vast majority of those in specialist
accommodation are older than 75 with increasing percentages and prevalence rates the older the age
group.

Wandsworth Local Housing Needs Assessment, Size and tenure mix to 2037
GL Hearn Page 134 of 176
Wandsworth LHNA
Official
11.31 Although it should be noted that the Housing LIN prevalence rates are not saying that housing with care
and housing with support are only occupied by those aged over 75 but rather they are using this age
group as a way of estimating demand.
11.32 To understand the needs of those households falling into the 65-74 age bracket, we start with a
consideration of the change in older persons population to 2037. As shown in the table below, the number
of households headed by someone aged 65 and 74 years is projected to increase by around 7,800 (62%
(rounded) to 2037.
Change in households in 65-74 age cohort in LBW 2019-2037
Households
2019 Households
2037 Change in
households % Change
All households 141,682 186,018 44,336 31.30%
65-69 6,609 10,686 4,077 61.70%
70-74 6,060 9,799 3,739 61.70%
Total Aged 65-74 12,669 20,485 7,816 61.69%
Source: 2011 Census and demographic projections
We next consider how those in the age bracket occupy their dwellings. In the table below shows the split
of tenure by age group illustrating that around 49% of households in this age group in LBW own their
house outright and a small proportion are in the Private Rented Sector (PRS) (8%).
Tenure of households with HRR age 65-74
Tenure Age 65 to 69 Age 70 to 74 Total Aged
65-74 %
Own outright 2,422 2,216 4,638 49%
Owned with a mortgage or Shared ownership 670 400 1,070 11%
Social rented 1,457 1,523 2,980 31%
Private rented 430 325 755 8%
Living rent free 52 55 107 1%
Total 5,031 4,519 9,550 100%
Source: 2011 Census
11.34 We then apply the tenure percentage to the projection of the number of older households in 2037 to get
the tenure breakdown for the additional 7,816 households headed by someone aged between 65 and 74
age group in 2037. This is set out in the table below.

Wandsworth Local Housing Needs Assessment, Size and tenure mix to 2037
GL Hearn Page 135 of 176
Wandsworth LHNA
Official
Growth those aged 65-74 occupying different tenures to 2037
Total Household Headed by Someone Aged 65-74
Own outright
Owned with a mortgage or
shared ownership
Social rent
Private rent
Living rent free
7,816 3,830 860 2,423 625 78
Source: 2011 Census (numbers may not add up due to rounding)
11.35 The judgement as to what level of adaption may be determined by their degree of disability. The table
below sets out the prevalence of disability for the 50-64 age and 65+ age groups by different tenure types.
Residents aged 50-64 and 65+ whose activities are limited by disability by
tenure
Tenure
Age 50 to 64 Age 65 and over
All Day-to-day activities
limited a lot %
Day-to-day activities limited a
little %
All Day-to-day activities
limited a lot %
Day-to-day activities limited a
little
%
All categories: Tenure
35,587 3,637 10% 4,277 12% 25,774 6,508 25% 6,468 25%
Owned or shared ownership: Total
22,654 1,114 3% 2,022 6% 15,682 3,132 12% 3,736 14%
Owned outright 11,860 626 2% 1,143 3% 13,069 2,611 10% 3,178 12%
Owned with a mortgage or shared ownership
10,794 488 1% 879 2% 2,613 521 2% 558 2%
Rented or living rent free: Total
12,933 2,523 7% 2,255 6% 10,092 3,376 13% 2,732 11%
Social rented 8,765 2,100 6% 1,735 5% 7,726 2,728 11% 2,121 8%
Private rented or living rent free
4,168 423 1% 520 1% 2,366 648 3% 611 2%
Source: Census 2011
11.36 Data on the prevalence of disability within those residents aged between 65 and 74 is not available from
Census. Therefore, in order to arrive at percentages for those falling into this age group that belong to the
different categories of disability, we take the mean of those for the 50-64 and 65+ age groups. This is set
out in the table below.

Wandsworth Local Housing Needs Assessment, Size and tenure mix to 2037
GL Hearn Page 136 of 176
Wandsworth LHNA
Official
Residents aged 65-74 whose activities are limited by disability by tenure
Tenure
Age 65 to 74
Day-to-day activities limited a lot
Day-to-day activities limited a little
All categories: Tenure 18% 19%
Owned or shared ownership: Total 8% 10%
Owned outright 6% 8%
Owned with a mortgage or shared ownership 2% 2%
Rented or living rent free: Total 10% 8%
Social rented 8% 7%
Private rented or living rent free 2% 2%
Source: Census 2011
11.37 We are now in a position to establish the level of disability within this age group and what solutions are
available. This should be based on the assumption that many people of this age will wish to remain in
their own home, and that those whose day-to-day activities are only limited a little may need only light or
limited adaptations to their home and modest "in-situ" assistance from others (very often provided by
friend, family and neighbours) that help them remain in their home without the need for specialist housing.
11.38 Nevertheless, the LBW should be mindful about the substantial numbers of people with more serious
disabilities for whom more extensive adaptations would be required to enable them to remain in their
home and enjoy an acceptable standard of living.
11.39 In the table below the estimated number and scale of adaptions likely to be required are arrived at by
multiplying the numbers of residents falling into the relevant tenure categories by the percentages of those
whose day to day activities are limited a lot and a little.
Degree of adaptations required to general housing to enable those aged 65-
74 to remain in their own homes
Type Number of Households Number of Households Per Annum
Adaptations (extensive) 572 32
Adaptations (limited) 637 35
Total 1,209 67
Source: GL Hearn calculations
11.40 Taking this as a starting point, an assessment may then be made as to whether the Borough should plan
for greater than the current rate of provision or less. This should also take into account other factors such

Wandsworth Local Housing Needs Assessment, Size and tenure mix to 2037
GL Hearn Page 137 of 176
Wandsworth LHNA
Official
as resource issues as well as other evidence cited in PPG, such as Joint Strategic Needs Assessments
prepared by Health and Wellbeing Boards.
LBW analysis
11.41 We also note that LBW has produced an analysis that sets out their assessment of the need for affordable
housing for older people, rather than all tenures. This is divided between “residential or extra care” and
“nursing care” housing.
11.42 The understanding of need for affordable housing is established through a comparison of two projections,
each derived from the take up of services from the resident population. These are called “service use”
and “population/prevalence”. Based on these sources, the author identifies a need for 50-150 additional
affordable residential or extra care spaces and 200 affordable nursing care units by 2035.
Residential and extra-care
11.43 At present and for the period up to 2025 there is deemed to be sufficient supply of affordable extra care
accommodation. This calculation also takes into account a planned supply of 80 units in the Borough in
the interim period.
11.44 The projection derived from “service use” predicts a need for an additional 130 affordable extra units by
2035 while the “population / prevalence” derived need is for up to 240 additional affordable units. The
author has added these figures to the number of service users in 2018 to arrive at an estimated short-fall
in 2035 of between 50 and 150 affordable residential and extra-care dwellings.
11.45 As regards nursing care, there is an apparent sufficient supply at present. However, the author notes that
“both the two main projection models predict an increase in demand for affordable nursing care spaces
of over 50% by 2035.”
11.46 The study notes that this is the equivalent of a need for an extra 50 to 70 affordable units by 2025 and
190-210 units needed by 2035.”59 These ranges again reflect the difference between the two forecasting
methods.
11.47 The findings depart from those set out (the equivalent figure in this table to the number of additional
affordable residential and extra-care dwellings arrived at in the LBW method is 335 units, termed “housing
with care for rent”).
59 Wandsworth Older People’s Housing Care Needs, 5th April 2019, page 7

Wandsworth Local Housing Needs Assessment, Size and tenure mix to 2037
GL Hearn Page 138 of 176
Wandsworth LHNA
Official
11.48 In arriving at a final number, a range is therefore appropriate with 150 additional dwellings to be provided
by 2037 as the lower end of this range, and 335 units as the upper end.
11.49 The need for care bed-spaces set out the LBW study, citing a need for between 190 and 210 dwellings,
may however be treated as the affordable component of the need for 1,258 care bed-spaces set out in
Table 60.
Spatial arrangement of new specialist housing for older people
11.50 The table below shows the wards in LBW that have attracted the most development of self-contained
(SC) and non self-contained housing for older people between 2011 and 2019. The former corresponds
to "housing with support" and “housing with care" and the latter "care bed spaces".
11.51 The "guide" column reflects Housing LIN's recommended rates of provision per 1,000 people aged over
7560. The “actual” column shows provision at new or redeveloped sites between 2011 and 2019. “Variation”
is the difference between the two.
11.52 The table also shows the number of people aged 75+ in each ward based on ONS Ward-level population
estimates. These are “experimental statistics” and should only be used as an estimate of numbers, but
as an indicator of areas of relative concentration between the wards, they are likely to be broadly accurate.
60 This conforms with prevalence rates in Table 60, 167 self-contained units per 1000 residents aged 75+ and 108 non-self-
contained units per 1000 residents aged 75+.

Wandsworth Local Housing Needs Assessment, Size and tenure mix to 2037
GL Hearn Page 139 of 176
Wandsworth LHNA
Official
Specialist housing for older people, provision on new and re-developed sites
2011-19 (LBW)
Self-contained Non-self-contained
Ward 75+ % Guide Actual Variation Guide Actual Variation
Balham 574 4% 96 94 -2 62 25 -37
Bedford 518 4% 87 0 -87 56 0 -56
Earlsfield 538 4% 90 0 -90 58 37 -21
East Putney 852 6% 142 15 -127 92 0 -92
Fairfield 490 4% 82 0 -82 53 98 45
Furzedown 836 6% 140 0 -140 90 5 -85
Graveney 650 5% 109 0 -109 70 87 17
Latchmere 626 5% 105 0 -105 68 0 -68
Nightingale 833 6% 139 2 -137 90 327 237
Northcote 461 3% 77 54 -23 50 0 -50
Queenstown 640 5% 107 0 -107 69 168 99
Roehampton and Putney Heath 808 6% 135 0 -135 87 25 -62
St Mary's Park 1,024 7% 171 121 -50 111 18 -93
Shaftesbury 592 4% 99 0 -99 64 0 -64
Southfields 654 5% 109 0 -109 71 0 -71
Thamesfield 659 5% 110 0 -110 71 10 -61
Tooting 783 6% 131 0 -131 85 0 -85
Wandsworth Common 557 4% 93 46 -47 60 50 -10
West Hill 745 5% 124 0 -124 80 80 0
West Putney 1,062 8% 177 0 -177 115 14 -101
Total 13,902 100% 2,322 332 -1,990 1,501 944 -557
Average 695 116 17 -99 75 47 -28
Source: LBW
11.53 As regards self-contained units, those wards where development has concentrated are Balham,
Northcote and St. Mary's Park. It is worth noting that, based on provision at new and re-developed sites
between 2011 and 2019, it is only Northcote that is able to meet its own requirements.
11.54 Some wards where there is a significantly aged population such as East Putney, Nightingale and
Furzedown have not delivered any self-contained dwellings and the Council should therefore encourage
development in these areas to meet the identified need if the existing stock hasn’t already done so.
11.55 The spatial distribution of provision does not bear any relationship with wards that have a relative
concentration of residents aged 75 and above. As shown in the table, these are East Putney, Furzedown,

Wandsworth Local Housing Needs Assessment, Size and tenure mix to 2037
GL Hearn Page 140 of 176
Wandsworth LHNA
Official
Nightingale, Roehampton, St. Mary's Park, Tooting and West Putney, all of which have a prevalence of
people in this age cohort of 6% or above of all residents in this age group.
11.56 Of these, only Nightingale has a provision of specialist housing for older people that is significantly above
the ward average.
11.57 In the case of non-self contained units Fairfield, Graveney, Nightingale, Queenstown, Wandsworth
Common and West Hill have seen significant development. In the case of Fairfield, Graveney, Nightingale
and Queenstown this provision exceeds their requirements when compared with housing LIN's
recommended rates of provision.
11.58 It is important to note however that once supply at 2011 is taken into account, this shortfall is eliminated
(as shown in Table 60 presenting Older Persons’ Dwelling and Care Bedspace Requirements to 2037).
Persons with long-term health problem or disability
11.59 Planning Practice Guidance section 56 (Housing: optional technical standards) sets out how local
authorities can gather evidence to set requirements on a range of issues (including accessibility and
wheelchair housing standards, water efficiency standards and internal space standards).
11.60 The PPG sets out that the reason for the approach to setting standards is to ‘rationalise the many differing
existing standards into a simpler, streamlined system which will reduce burdens and help bring forward
much needed new homes’61 and that ‘local planning authorities will need to gather evidence to determine
whether there is a need for additional standards in their area’ (56-002).
11.61 The PPG sets out that local authorities should be using their assessment of housing need (and other
sources) to consider the need for M4(2) (accessible and adaptable dwellings), and/or M4(3) (wheelchair
user dwellings), of the Building Regulations. It sets out that there are a range of published statistics which
can be considered, including:
• the likely future need for housing for older and disabled people (including wheelchair user
dwellings);
• size, location, type and quality of dwellings needed to meet specifically evidenced needs (for
example retirement homes, sheltered homes or care homes);
• the accessibility and adaptability of existing housing stock;
• how needs vary across different housing tenures; and
• the overall impact on viability.
61 PPG, Paragraph: 001 Reference ID: 56-001-20150327

Wandsworth Local Housing Needs Assessment, Size and tenure mix to 2037
GL Hearn Page 141 of 176
Wandsworth LHNA
Official
11.62 As indicated in the PPG, the starting point to quantifying the “likely future need for housing for disabled
people” is Census data on people with a long-term health problem or disability (LTHPD). In contrast with
the section on the needs of the elderly, this takes account all age groups.
11.63 This provides a “starting point” figure, to which adjustments may be made that produce a more locally
specific number. As suggested in PPG, we draw in information from the following sources:
• applications for Disabled Facilities Grant to the Council;
• data from the Projecting Older People Information System (POPPI) website and the parallel
Projecting Adult Needs and Service Information (PANSI) model;
11.64 In drawing on the above sources, it is important to note the following advice from PPG:
“Whilst these data sources can provide an indication of the number of disabled people, not all of
the people included within these counts will require adaptations in the home. Applications for
Disabled Facilities Grant (DFG) will provide an indication of levels of expressed need, although
this will underestimate total need, as there may be a large number of people who would want or
need an adaptation, but would not have applied to the DFG.”62
11.65 Using these sources of data we will produce an adjusted “final” figure for the number of dwellings that
should be provided to meet the needs of the additional numbers of disabled people who will live in the
Borough by 2037.
11.66 The 2011 Census defines long-term health problem or disability (LTHPD) as “a long-term health problem
or disability that limits a person's day-to-day activities, and has lasted, or is expected to last, at least 12
months. This includes problems that are related to old age” [in the Census] “People were asked to assess
whether their daily activities were limited a lot or a little by such a health problem, or whether their daily
activities were not limited at all”.
11.67 For the purposes of understanding the needs of the disabled people (as opposed to retirees and the
elderly) we have filtered out of this analysis those aged over 65 as these cohorts have been considered
in previous sections, and it is important to avoid double-counting. To understand the needs of those
households with a long-term disability falling into the 16-64 age bracket, we start with a consideration of
how these households occupy their dwellings.
Tenure of households with HRR age 16-64
Tenure All 16+ Age 16 to 34
% Age 35 to 49
% Age 50 to 64
%
Owned or shared ownership 61,302 12,857 29% 22,922 53% 14,807 61%
Social rented 26,512 5,140 12% 8,570 20% 6,577 27%
Private rented 42,663 25,937 59% 12,047 28% 2,922 12%
Source: Census 2011
62 Planning Practice Guidance, Paragraph: 005 Reference ID: 63-005-20190626

Wandsworth Local Housing Needs Assessment, Size and tenure mix to 2037
GL Hearn Page 142 of 176
Wandsworth LHNA
Official
11.68 The table below sets out the increase in the number of households with a household reference person
under the age of 65.
Projected change in households by age of household reference person–
LBW (selected age groups)
Households 2019 Households 2037 Change in
households % change
16-34 38,547 44,900 6,354 16.48%
35-49 49,216 61,226 12,010 24.40%
50-64 30,426 42,310 11,883 39.06%
Source: Demographic projections
11.69 We then apply the tenure percentage to the projection of the number of people to get the tenure
breakdown for this age group in 2037. A key assumption here is that, for the purposes of arriving at the
proportion of households falling into different tenures the growth in the overall population number and
over may be used (rather than households).
Growth in the number of persons in selected age groups occupying different
tenures in LBW
Age Owned Social rent Private rent Living rent free
Age 16 to 34 1,859 743 3,517 234
Age 35 to 49 6,323 2,364 3,044 279
Age 50 to 64 7,239 3,215 1,204 225
Source: 2011 Census
The judgement as to which type of specialist housing a given household falls into may be determined by
whether they suffer from a long-term disability, and the degree of severity, the table below sets this out.
Residents in Wandsworth of selected age groups whose activities are limited
by disability
Age
All categories: Long-term health
problem or disability
Day-to-day activities
limited a lot %
Day-to-day
activities limited a
little
%
Day-to-day
activities not
limited
%
Age 16 to 34 120,075 1,260 1% 2,513 2% 116,302 97% Age 35 to 49 69,243 2,557 4% 3,433 5% 63,253 91% Age 50 to 64 35,587 3,637 10% 4,277 12% 27,673 78%
Source: Census 2011
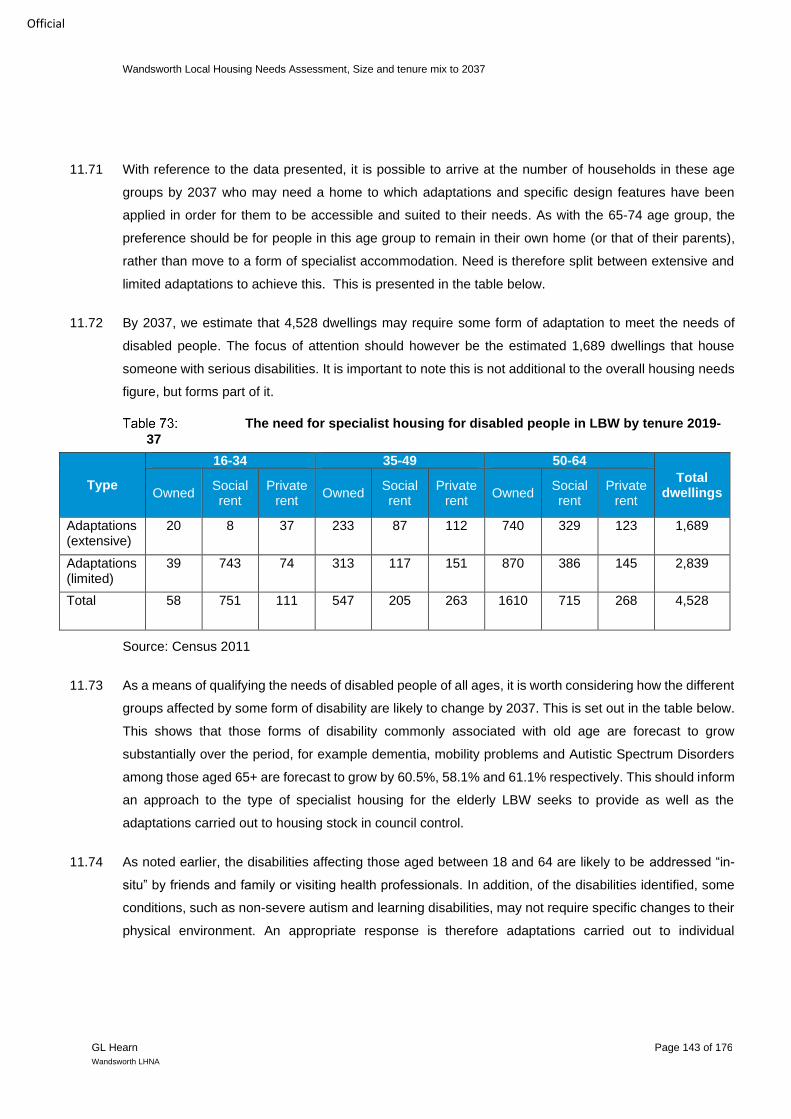
Wandsworth Local Housing Needs Assessment, Size and tenure mix to 2037
GL Hearn Page 143 of 176
Wandsworth LHNA
Official
11.71 With reference to the data presented, it is possible to arrive at the number of households in these age
groups by 2037 who may need a home to which adaptations and specific design features have been
applied in order for them to be accessible and suited to their needs. As with the 65-74 age group, the
preference should be for people in this age group to remain in their own home (or that of their parents),
rather than move to a form of specialist accommodation. Need is therefore split between extensive and
limited adaptations to achieve this. This is presented in the table below.
11.72 By 2037, we estimate that 4,528 dwellings may require some form of adaptation to meet the needs of
disabled people. The focus of attention should however be the estimated 1,689 dwellings that house
someone with serious disabilities. It is important to note this is not additional to the overall housing needs
figure, but forms part of it.
The need for specialist housing for disabled people in LBW by tenure 2019-
37
Type
16-34 35-49 50-64
Total dwellings Owned
Social rent
Private rent
Owned Social rent
Private rent
Owned Social rent
Private rent
Adaptations (extensive)
20 8 37 233 87 112 740 329 123 1,689
Adaptations (limited)
39 743 74 313 117 151 870 386 145 2,839
Total 58 751 111 547 205 263 1610 715 268 4,528
Source: Census 2011
11.73 As a means of qualifying the needs of disabled people of all ages, it is worth considering how the different
groups affected by some form of disability are likely to change by 2037. This is set out in the table below.
This shows that those forms of disability commonly associated with old age are forecast to grow
substantially over the period, for example dementia, mobility problems and Autistic Spectrum Disorders
among those aged 65+ are forecast to grow by 60.5%, 58.1% and 61.1% respectively. This should inform
an approach to the type of specialist housing for the elderly LBW seeks to provide as well as the
adaptations carried out to housing stock in council control.
11.74 As noted earlier, the disabilities affecting those aged between 18 and 64 are likely to be addressed “in-
situ” by friends and family or visiting health professionals. In addition, of the disabilities identified, some
conditions, such as non-severe autism and learning disabilities, may not require specific changes to their
physical environment. An appropriate response is therefore adaptations carried out to individual

Wandsworth Local Housing Needs Assessment, Size and tenure mix to 2037
GL Hearn Page 144 of 176
Wandsworth LHNA
Official
properties on a case-by-case basis, suited to the needs of the household. They do not of themselves
imply a requirement for additional specialist housing.
Projected changes to population with a range of disabilities – Wandsworth
Disability Age range 2019 2037 Change % Change
Dementia 65+ 2,124 3,410 1,286 60.50%
Mobility problems 65+ 5,677 8,975 3,298 58.10%
Autistic Spectrum Disorders 18-64 2,240 2,662 422 18.80%
65+ 282 454 172 61.10%
Learning Disabilities 15-64 5,913 7,103 1,190 20.10%
65+ 654 1,022 368 56.20%
Challenging behaviour 15-64 108 130 22 20.20%
Impaired mobility 16-64 9,712 12,262 2,549 26.20%
Source: POPPI/PANSI and demographic projections
11.75 While this does not directly translate into a need for specific levels of M4(2) properties it does justify the
Council seeking to increase the number of accessible homes as much as viably possible. Although we
recognise that some developments because of their built form and/topography may not be suitable for
this type of development.
Housing for Wheelchair users
11.76 Before concluding our consideration of the housing needs of disabled people, it is worth considering the
recommendations of an authoritative study, Mind the Step: An estimation of housing need among
wheelchair users in England produced by Habinteg Housing Association and London South Bank
University (Supported by the Homes and Communities Agency).
11.77 Information about the need for housing for wheelchair users is difficult to obtain (particularly at a local
level) and so some brief analysis has been carried out based on national data within the Habinteg study.
This report provides information at a national and regional level although there are some doubts about
the validity even of the regional figures, with the result that the study focuses on national data.
11.78 The report identifies that around 84% of homes in England do not allow someone using a wheelchair to
get to and through the front door without difficulty and that once inside, it gets even more restrictive.63
Furthermore, it is estimated (based on English House Condition Survey data) that just 0.5% of homes
meet criteria for ‘accessible and adaptable’, while 3.4% are ‘visitable’ by someone with mobility problems
63 Habinteg Housing Association and London South Bank University, Mind the Step: An estimation of housing need among
wheelchair users in England, page 5

Wandsworth Local Housing Needs Assessment, Size and tenure mix to 2037
GL Hearn Page 145 of 176
Wandsworth LHNA
Official
(data from the CLG Guide to available disability (taken from the English Housing Survey)) puts the
proportion of ‘visitable’ properties at a slightly higher 5.3%.
11.79 In order to arrive at an estimate of current unmet need for dwellings adapted to a wheelchair user's needs,
this report provides a simple method: to take the regional percentage of all households who are wheelchair
user households (in this study 2% for London) and multiply this by all households. Using this method, we
arrive at 141,725 households in the Borough in 2019, multiplied by 2% equals 2,835 (rounded).
11.80 To arrive at “unmet need”, we multiple the answer by the percentage of wheelchair users with unmet need
at the regional level (in this study 18% of the 2% for London). Using this formula, we arrive at 510
households.
11.81 In order to arrive at the number of wheelchair adapted dwellings to be provided by 2037, it is reasonable
to assume 2% of the additional households will have this need. If 2% is applied to the annual household
growth based on the Standard Method of 2,537 this would result in 76 (rounded) additional wheelchair
adapted homes per year, or 1,368 by 2037. This would suggest that the Council should seek to deliver
around 5-10% of all new homes as M4(3) properties
Older Persons Housing and Planning Use Classes
11.82 As per the recently update PPG (Paragraph: 014 Reference ID: 63-014-20190626 it will for the “Local
planning authority to consider into which use class a particular development may fall. When determining
whether a development for specialist housing for older people falls within C2 (Residential Institutions) or
C3 (Dwelling house) of the Use Classes Order, consideration could, for example, be given to the level of
care and scale of communal facilities provided”.
11.83 The housing with support and housing with care units form part of the standard method figure as these
are self-contained units and are those part of the household projections (C3). The care bed spaces (C2)
can also contribute towards housing need although as per the housing delivery test rulebook every 1.8
bed spaces contributing towards housing delivery.
Student Housing
11.84 Plan-making authorities are required to plan for “sufficient student accommodation whether it consists of
communal halls of residence or self-contained dwellings, and whether or not it is on campus”. In order to
do this they are advised “to engage with universities and other higher educational establishments to
ensure they understand their student accommodation requirements in their area”.64
64 PPG Paragraph: 004 Reference ID: 67-004-20190722

Wandsworth Local Housing Needs Assessment, Size and tenure mix to 2037
GL Hearn Page 146 of 176
Wandsworth LHNA
Official
Introduction
11.85 There are two Higher Education Institutes (HEI) in Wandsworth, University of Roehampton (UoR) and St.
George’s, University of London (SGUoL).
11.86 The University of Roehampton is a public university situated on three major sites in Roehampton, in the
London Borough of Wandsworth. The University consists of four colleges, around which accommodation
is centred: Digby Stuart College, Froebel College, Southlands College and Whitelands College.
11.87 St George's (St George's Hospital Medical School, informally St George's or SGUoL) is a medical school
located in Tooting in South London and is a constituent college of the University of London.
Baseline
11.88 There is no consistent longitudinal data available for student numbers year-on-year for all establishments.
However, it is possible to access data regarding trends in student numbers for the Roehampton and St.
George’s Universities from the Higher Education Statistics Agency (HESA).
11.89 The figure below shows a substantial uplift in student numbers between the financial years 2011/12 and
2017/18, notwithstanding a drop in overall numbers in 2014/15 chiefly due to a drop off in part-time
students (both post- and under-graduate). Overall, student numbers at Roehampton University increased
by 55% over the period, with the number of full-time students increasing by 66% and part-time by 11%.
Figure 32: Student numbers by type, 2011/12 – 2017/17, Roehampton University
Source: HESA
-
2,000
4,000
6,000
8,000
10,000
12,000
14,000
16,000
2011/12 2012/13 2013/14 2014/15 2015/16 2016/17 2017/18
Undergrad FT Postgrad FT Undergrad PT Postgrad PT

Wandsworth Local Housing Needs Assessment, Size and tenure mix to 2037
GL Hearn Page 147 of 176
Wandsworth LHNA
Official
11.90 In contrast to the trends for Roehampton University, St. George’s (a school of medicine attached to St.
George’s hospital) has seen an overall fall in student numbers in recent years. This is however the result
of a drop in part-time students, where, between 2011/12 and 2017/18 a reduction of 790 students was
recorded, or 31%. As regards full-time students, the period saw an increase of 25%, of 655 students. As
a result, the overall fall in student numbers amounts to 135, of 3%.
Figure 33: Student numbers by type, 2011/12 – 2017/17, St. George’s University
Source: HESA
11.91 The figure below sets out data from Census 2011 for student accommodation; this data is helpful in
providing a sense of how the 21,752 students were housed in the Borough at the time of the last Census.
This shows a large minority (8,849) remained with their parents, while 1,827 lived in University Halls of
Residence (8%), and 4,859 (22%) of all students lived either in student-only households or lived alone. It
is worth noting, therefore, that only 30% of all students are housed in a way that conforms with the PPG
definitions set out at the start of this chapter. The 6,217 students who live in other household types are
likely to live in a family household or in a house in multiple occupation (HMO) with non-students.
-
1,000
2,000
3,000
4,000
5,000
6,000
7,000
2011/12 2012/13 2013/14 2014/15 2015/16 2016/17 2017/18
Undergrad FT Postgrad FT Undergrad PT Postgrad PT

Wandsworth Local Housing Needs Assessment, Size and tenure mix to 2037
GL Hearn Page 148 of 176
Wandsworth LHNA
Official
Figure 34:
Source: Census 2011
11.92 In the figure below, this is further broken down by age cohort. It should come as no surprise that for those
aged between 16 and 19, the majority live with their parents (4,854 individuals, or 75% of all students of
this age). This proportion falls dramatically as they reach their twenties (to 24%, or 1,465 students for
those aged 20-25 and 7%, or 301 students for those aged 25 and above). Student Halls of Residence are
a small, but important, source of accommodation to those aged 16-24, and those in the age group 20-24,
who are able to leave their parents’ home, have a strong tendency to move into a house-share with other
students of their age. This remains a popular choice for older students (aged 25 and above), with some
19% selecting this option. For this age group however, they increasingly opt to live alone, or live in other
household types. This suggests a move to “main-stream” society as they start a family and seek to set up
their own independent household.
41%
9%
8%
1%
18%
4%
28%
Living with parents
Living in a communalestablishment: Total
University halls of residence
Other communalestablishment
All student household
Student living alone
Living in other householdtype
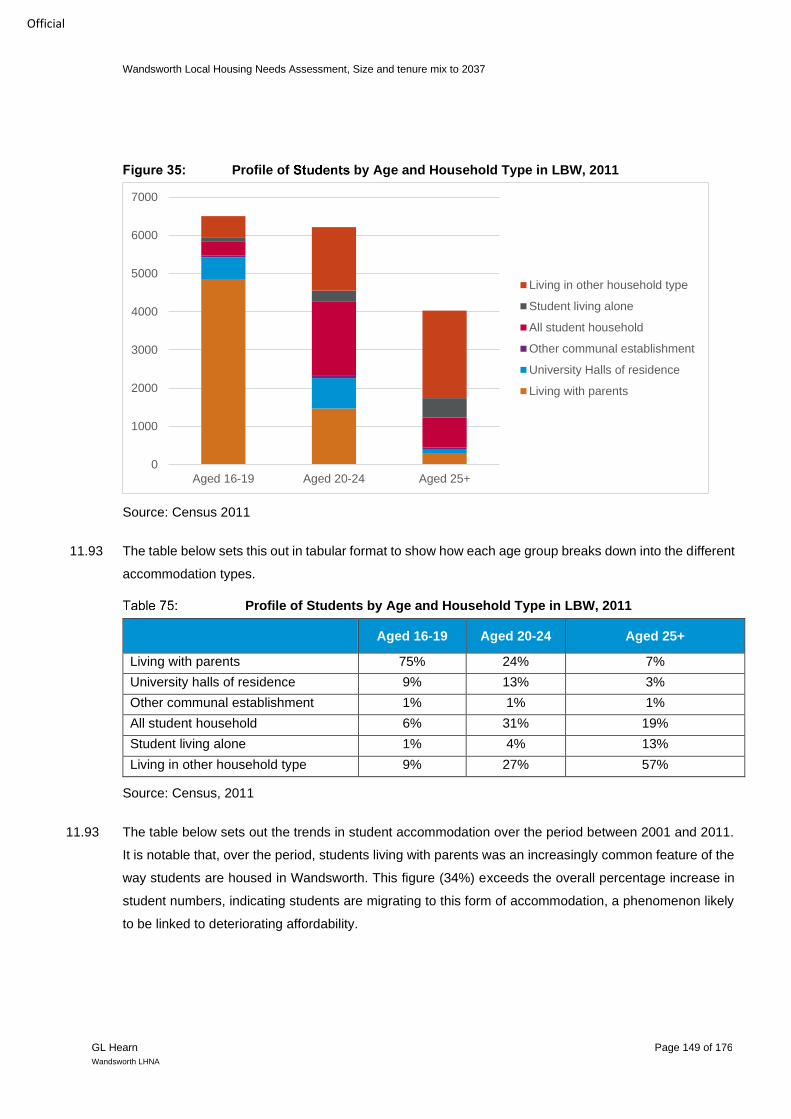
Wandsworth Local Housing Needs Assessment, Size and tenure mix to 2037
GL Hearn Page 149 of 176
Wandsworth LHNA
Official
Figure 35: Profile of by Age and Household Type in LBW, 2011
Source: Census 2011
11.93 The table below sets this out in tabular format to show how each age group breaks down into the different
accommodation types.
Profile of Students by Age and Household Type in LBW, 2011
Aged 16-19 Aged 20-24 Aged 25+
Living with parents 75% 24% 7%
University halls of residence 9% 13% 3%
Other communal establishment 1% 1% 1%
All student household 6% 31% 19%
Student living alone 1% 4% 13%
Living in other household type 9% 27% 57%
Source: Census, 2011
11.93 The table below sets out the trends in student accommodation over the period between 2001 and 2011.
It is notable that, over the period, students living with parents was an increasingly common feature of the
way students are housed in Wandsworth. This figure (34%) exceeds the overall percentage increase in
student numbers, indicating students are migrating to this form of accommodation, a phenomenon likely
to be linked to deteriorating affordability.
0
1000
2000
3000
4000
5000
6000
7000
Aged 16-19 Aged 20-24 Aged 25+
Living in other household type
Student living alone
All student household
Other communal establishment
University Halls of residence
Living with parents

Wandsworth Local Housing Needs Assessment, Size and tenure mix to 2037
GL Hearn Page 150 of 176
Wandsworth LHNA
Official
11.94 This is also true for those households living “in other household types”, where an increase of 35% was
seen over the period. Given the preference for this type of accommodation among students age 25 and
over, this is likely to be associated with an aging in the student population.
11.95 This was indeed the case over the period where the percentage growth in the student population aged
25 and over exceeded the proportional share for this age group in 2001. This indicates that the overall
proportion of the student population in this age group grew between 2001 and 2011. The reverse is the
case for the other two age groups, both of whom saw their proportional share fall.
11.96 The key groups of relevance to this study, University Halls of residence and all student households, while
increasing in absolute numbers with the overall increase in student numbers, saw a small fall in their
proportional share. This is also consistent with the phenomenon of the aging student population given
that these accommodation types are associated with the 16-19 age cohort for the former, and the 20-24
age cohort for the latter.
Changes in Students by Different Accommodation Types, 2001-11
Students (16+) by Household Type
2001 2011 2001 % 2011 % Change
No. %
Living with parents 6620 8,849 40% 41% 2,229 34%
University halls of residence
1472 1,827 9% 8% 355 24%
Other communal establishment
146 121 1% 1% -25 -17%
All student household 3109 3,941 19% 18% 832 27%
Student living alone 873 918 5% 4% 45 5%
Living in other household type
4525 6,096 27% 28% 1,571 35%
Total 16745 21,752 5,007 30%
Source: Census, 2001-11

Wandsworth Local Housing Needs Assessment, Size and tenure mix to 2037
GL Hearn Page 151 of 176
Wandsworth LHNA
Official
Student Age Structure 2001-11, LBW
% Total student pop
2001
% change 2001-11
% Total student pop
2001
% change 2001-11
% Total student pop
2001
% change 2001-11
Aged 16-19 Aged 20-24 Aged 25+
39% 28% 37% 23% 24% 43%
Source: Census 2001 and 2011
Growth in student numbers
11.97 As noted in the PPG, to arrive at an understanding of the growth in student numbers, it is necessary to
engage with HEIs. For this reason, information has been sought from both UoR and SGUoL.
University of Roehampton
11.98 The UoR provided data that describes their future growth plans. They indicated that growing their intake
of domestic students would be “very challenging”. As a result their expectation is they will be able to
maintain the current numbers of UK students in the coming years.
11.99 By contrast they are looking to grow their body of international students (from both EU and non-EU
countries) by around 50% in the period upto 2025. While it is envisaged this growth would be split equally
between under-graduate and post-graduate students, it is unlikely to divide equally between EU and non-
EU students. The changes are summarised in the table below which shows that international students
will increase in number by some 588 individuals.

Wandsworth Local Housing Needs Assessment, Size and tenure mix to 2037
GL Hearn Page 152 of 176
Wandsworth LHNA
Official
Growth in student numbers, 2019/20 - 2024/5
FT/PT 2018/19 Growth 2024/25
Non-EU EU UK Non-EU EU UK Non-EU EU UK
50% 50% 0%
Postgrad FT 240 100 785 120 50 0 360 150 785
PT 60 65 690 30 33 0 90 98 690
Undergrad FT 380 305 5,450 190 153 0 570 458 5,450
PT 15 10 310 8 5 0 23 15 310
Totals 695 480 7,235 348 240 0 1,043 720 7,235
Source: University of Roehampton
11.100 The UoR has indicated that the current student body is adequately housed. Their housing arrangements
are split according to the percentages recorded in the pie chart below. It is notable that a substantial
proportion of students live in the PRS. According to the UoR around 1,000 students live on the Alton
Estate, a housing estate close to UoR. This estate is likely to be redeveloped within the next five years.
11.101 The University estimates that it will lose 200 bed spaces as a result of these changes. The University
therefore estimates that it will require around 800 (588 + 200) additional bed-spaces to the year 2024/5.
Figure 36: Student housing arrangements
Source: University of Roehampton
11.102 The interview conducted with the UoR then sought to understand where this additional capacity will come
from. The university explained they are in talks with Urbanest (see uk.urbanest.com/), a specialist
41%
35%
23%
1%
Living with parents PRS Halls of residence External sites (Vauxhall)
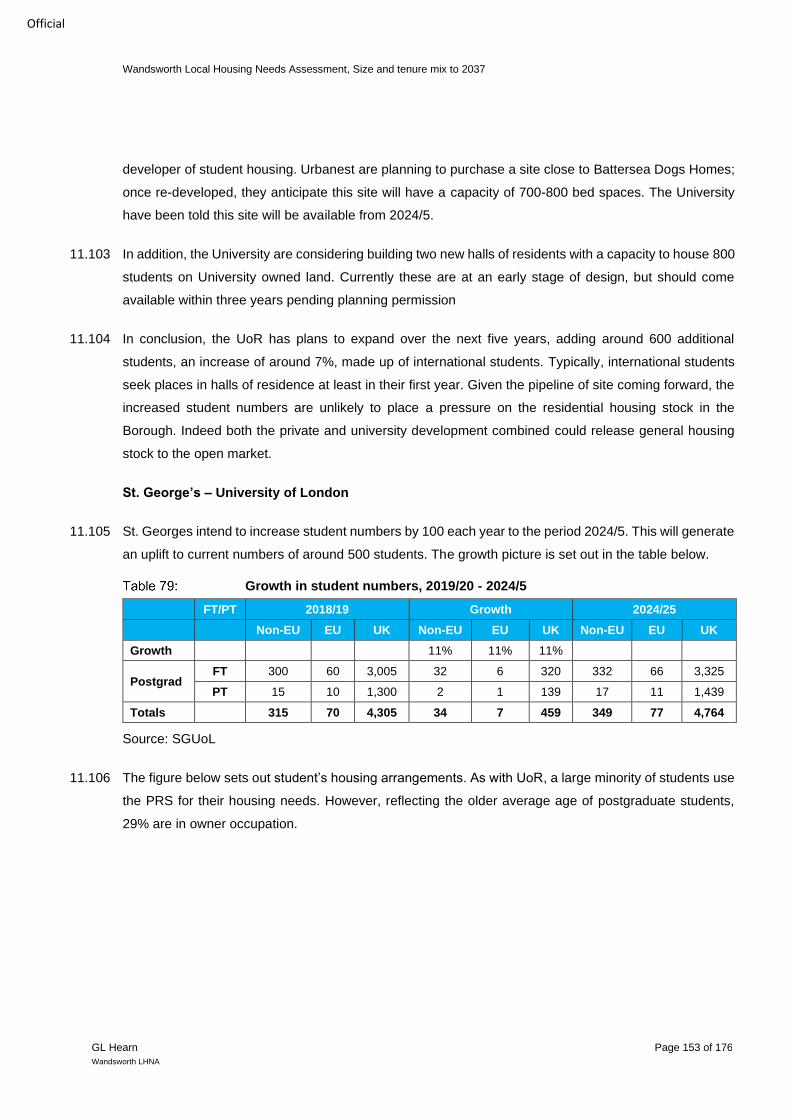
Wandsworth Local Housing Needs Assessment, Size and tenure mix to 2037
GL Hearn Page 153 of 176
Wandsworth LHNA
Official
developer of student housing. Urbanest are planning to purchase a site close to Battersea Dogs Homes;
once re-developed, they anticipate this site will have a capacity of 700-800 bed spaces. The University
have been told this site will be available from 2024/5.
11.103 In addition, the University are considering building two new halls of residents with a capacity to house 800
students on University owned land. Currently these are at an early stage of design, but should come
available within three years pending planning permission
11.104 In conclusion, the UoR has plans to expand over the next five years, adding around 600 additional
students, an increase of around 7%, made up of international students. Typically, international students
seek places in halls of residence at least in their first year. Given the pipeline of site coming forward, the
increased student numbers are unlikely to place a pressure on the residential housing stock in the
Borough. Indeed both the private and university development combined could release general housing
stock to the open market.
St. George’s – University of London
11.105 St. Georges intend to increase student numbers by 100 each year to the period 2024/5. This will generate
an uplift to current numbers of around 500 students. The growth picture is set out in the table below.
Growth in student numbers, 2019/20 - 2024/5
FT/PT 2018/19 Growth 2024/25
Non-EU EU UK Non-EU EU UK Non-EU EU UK
Growth 11% 11% 11%
Postgrad FT 300 60 3,005 32 6 320 332 66 3,325
PT 15 10 1,300 2 1 139 17 11 1,439
Totals 315 70 4,305 34 7 459 349 77 4,764
Source: SGUoL
11.106 The figure below sets out student’s housing arrangements. As with UoR, a large minority of students use
the PRS for their housing needs. However, reflecting the older average age of postgraduate students,
29% are in owner occupation.
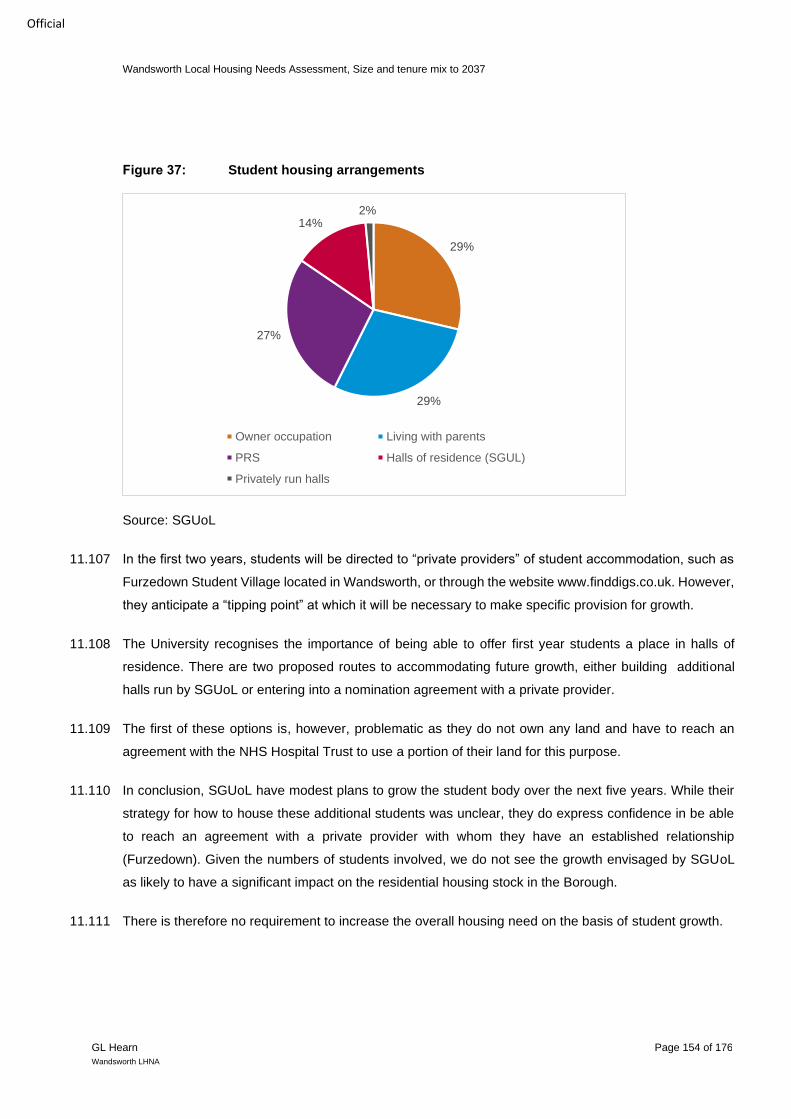
Wandsworth Local Housing Needs Assessment, Size and tenure mix to 2037
GL Hearn Page 154 of 176
Wandsworth LHNA
Official
Figure 37: Student housing arrangements
Source: SGUoL
11.107 In the first two years, students will be directed to “private providers” of student accommodation, such as
Furzedown Student Village located in Wandsworth, or through the website www.finddigs.co.uk. However,
they anticipate a “tipping point” at which it will be necessary to make specific provision for growth.
11.108 The University recognises the importance of being able to offer first year students a place in halls of
residence. There are two proposed routes to accommodating future growth, either building additional
halls run by SGUoL or entering into a nomination agreement with a private provider.
11.109 The first of these options is, however, problematic as they do not own any land and have to reach an
agreement with the NHS Hospital Trust to use a portion of their land for this purpose.
11.110 In conclusion, SGUoL have modest plans to grow the student body over the next five years. While their
strategy for how to house these additional students was unclear, they do express confidence in be able
to reach an agreement with a private provider with whom they have an established relationship
(Furzedown). Given the numbers of students involved, we do not see the growth envisaged by SGUoL
as likely to have a significant impact on the residential housing stock in the Borough.
11.111 There is therefore no requirement to increase the overall housing need on the basis of student growth.
29%
29%
27%
14%2%
Owner occupation Living with parents
PRS Halls of residence (SGUL)
Privately run halls

Wandsworth Local Housing Needs Assessment, Size and tenure mix to 2037
GL Hearn Page 155 of 176
Wandsworth LHNA
Official
Short-term lets
11.112 The brief requires the LHNA to quantify the proportion of all dwellings that are used for short-term letting
and form a judgement as to whether this is having a detrimental effect on the ability of Wandsworth
residents from accessing the dwellings to suit their needs.
11.113 Before considering the proportion of homes in LBW area used either on an occasional basis or for short
term letting, it is helpful to understand the background context and key definitions relating to this type of
activity.
11.114 The following introductory paragraph provides a brief description of emerging models of short let
accommodation, focusing on so called “home sharing” via online platforms such as Airbnb, which has
seen an exponential growth in recent years. It investigates the impact of this new trend on the housing
market using a range of academic sources mainly focused on London itself.
The rise of home sharing
11.115 With the advent of the ‘sharing economy’, new online platforms allow residents to supplement their
incomes by offering their homes, or part of their homes, as short stay accommodation to visitors. Currently,
Airbnb is the biggest of these home sharing platforms in the UK. As such, we treat Airbnb as a proxy for
the home sharing market as whole, although there are other home sharing online platforms such as Windu,
9flats and Roomorama.
11.116 The speed of Airbnb’s exponential growth has been well documented. For example, a recent report on
Home-sharing in London’s Housing Market showed that by 2015, the number of homes booked via Airbnb
in London was 42 times higher than it was in 2011.65
Legal context
11.117 Outside of the traditional B&B, hotels and commercial self-catering industries, there is no specific
definition of a short let and no single source of data on the supply of short lets in the context of the
emerging informal tourist accommodation sector. Nonetheless, regulations in London seem to have been
adjusted to favour home sharing activity.
11.118 The Deregulation Act 2015 S44 allows casual lets of up to 90 days in a given year but requires planning
permission to be granted for a change of use for those let for more than 90 days per year. Additionally,
the Treasury’s Rent a Room Scheme, a tax deduction, lets people earn up to a threshold of £7,500 per
year tax free from letting out furnished accommodation in their homes.
65 IPPR, Homesharing & London's Housing Market, page 3
Wandsworth Local Housing Needs Assessment, Size and tenure mix to 2037
GL Hearn Page 156 of 176
Wandsworth LHNA
Official
The professionalisation of the sharing economy
11.119 Alongside owners renting out a spare room, or letting their flats out while themselves on holiday, research
carried out by the Residential Landlords Association (RLA) has documented a shift from more ‘casual’ to
more ‘commercial’ short term lets, as some individuals and even corporations are increasingly letting
several properties other than their primary residence for most of the year via Airbnb.
11.120 One indicator for determining the likelihood of a property being a commercial let is the proportion of the
year for which it is let, as well as whether it is listed on Airbnb as a whole property (as opposed to a single
room).
11.121 Alongside the sharp rise in total short lets overall, the RLA found that the number of properties and rooms
advertised on Airbnb in London available for more than 90 nights a year increased by 23% between
February 2016 and March 2017.
11.122 However, it should be noted that in most cases Airbnb still operates on a casual basis, with 53% of entire
homes booked between one and 30 nights in 2015. The number of entire home listings above 90 days,
which would be deemed commercial, is equivalent to 0.2% of private housing stock in London.66
11.123 As Airbnb is set to continue growing, and entire homes let for more than 90 days a year growing within
that, the issue revolves around enforcement of the 90 days regulation.
Impact on housing supply
11.124 There are growing concerns that by removing some homes from the potential supply from the private
rented sector in order to offer them for short term lets, home sharing platforms could exacerbate London’s
housing shortage. The sources we have consulted have identified the two following threats to London’s
housing shortage:
11.125 First of all, the letting of entire homes is more likely to be a direct threat to residential supply as it could
divert available homes from long term residential lets to more expensive and less secure short term lets.
There has already been a shift away from private rooms towards more entire homes listings being
booked.67
11.126 However, findings from the same report suggest that the impact on housing supply is currently negligible
across London. The proportion that Airbnb entire homes represent of London’s private housing stocks
take up around 0.2% of the stock, although in some high-pressure markets, the risks it poses to housing
66 Ibid 67 Ibid

Wandsworth Local Housing Needs Assessment, Size and tenure mix to 2037
GL Hearn Page 157 of 176
Wandsworth LHNA
Official
supply and the potential contribution to rent inflation are more significant. For example, in Westminster,
Airbnb takes up almost 4% of the stock (Airbnb data; MHCLG 2016b).
11.127 Secondly, it is conceivable the potential to earn much higher nightly rates via Airbnb could prompt some
landlords to make their properties available for home sharing rather than a long term let. However, the
commercial home share lets are more likely to be a threat only if landlords are moving away from the PRS
in sufficient numbers to have a material impact on the supply of homes.
Short term letting in Wandsworth
11.128 An important source of data relating to short-term letting in Wandsworth is Inside Airbnb, an “independent,
non-commercial set of tools and data that allows you to explore how Airbnb is being used in cities around
the world”.
11.129 For this study listings of properties made available through the Airbnb website dated 14th September 2019
has been downloaded (is drawn from actual data which has been extracted from the Airbnb’s website
itself). The “last review” data, while not a wholly accurate record of the number of properties that have
been advertised on Airbnb in this year, provides a reliable indicator of activity.
11.130 Of the different categories of use, “entire homes” has the potential to have the greatest impact on the
market for dwellings in Wandsworth. Nevertheless, it is worth noting that Houses in Multiple Occupation
constitute an important way that people access affordable market accommodation. Indeed, for those
under the age of 35 housing benefit is restricted to the Shared Accommodation Rate based on an
assumption that shared dwellings constitute a common (and therefore acceptable) dwelling type people
of that age.
11.131 We found 2,243 entries for which a “last review” was recorded in 2019. These divide into “entire home”,
“hotel,” “private” and “shared rooms”. The great majority of these are either “entire homes” (1,222) or
“private rooms” (973). There are also 16 “shared room” entries. This indicates that around 2,211 dwellings
in Wandsworth are to some degree affected by Airbnb, either in whole or in part. This is 1.46% of the
current stock of homes in the Borough.68
The figure below we present the growth in Airbnb activity based on the “last review” data for the years
2014-2019 in London and Wandsworth relating to “entire homes”. The growth has been indexed to show
relative growth from a fixed starting position (2014) for both geographies. The development of Airbnb
68 The number of dwellings in Wandsworth can be estimated by taking the number recorded in Census of 135,900, and adding to this the 15,415 completed dwellings that have been built since the Census, as reported in LBW's Annual Monitoring Reports. This produces a total of 151,315 dwellings.

Wandsworth Local Housing Needs Assessment, Size and tenure mix to 2037
GL Hearn Page 158 of 176
Wandsworth LHNA
Official
over the last five years in Wandsworth and London has been substantial. It is also worth noting that over-
all growth in the Borough has however exceeded that of London.
Figure 38: Growth in Airbnb activity, 2014 to 2019 (indexed to 2014)
Source: Inside Airbnb
11.132 It is also worth noting the development of the number of “private rooms” listed with Airbnb has followed a
similar trajectory to “entire homes”, with a steady growth between 2014 and 2019, before a rapid increase
during 2019.
Figure 39: Number of private rooms listed with Airbnb 2014 to 2019 (indexed to 2014)
Source: Inside Airbnb
0
100
200
300
400
500
600
700
2014 2015 2016 2017 2018 2019
Wandsworth London
0
50
100
150
200
250
2014 2015 2016 2017 2018 2019
Wandsworth London

Wandsworth Local Housing Needs Assessment, Size and tenure mix to 2037
GL Hearn Page 159 of 176
Wandsworth LHNA
Official
11.133 The current level of activity does not pose a significant threat to residents seeking properties to rent in
Wandsworth. Indeed, a small percentage of dwellings used in this way may promote economic activity,
with visitors to the Borough more likely to visit local attractions during the day.
11.134 Having said this, the sharp upward trend in activity observed during 2019 is a cause for concern, and this
should be monitored moving forward. The fact this is a London-wide phenomenon suggests solutions
may best be developed at the regional scale.
Self-build and Custom-build
11.135 In accordance with the Self-build and Custom Housebuilding (Register) Regulations (2016), since April
2016, each local authority is required to keep a register of individuals and associations of individuals
seeking to acquire serviced plots of land in their area for the construction of self or custom build homes.
11.136 The Self-build and Custom Housebuilding Act (2015) (as amended) places a duty on relevant bodies to
have regard to the register when carrying out their planning, housing, land disposal and regeneration
functions and to give planning permission to enough serviced plots of land to meet demand. An update
to PPG in July 2019 expressed this requirement as follows,
“To obtain a robust assessment of demand for this type of housing in their area, local planning
authorities should assess and review the data held on registers. This assessment can be
supplemented with the use of existing secondary data sources such as building plot search
websites, ‘Need-a-Plot’ information available from the Self Build Portal and enquiries for
building plots from local estate agents.”69
11.137 Wandsworth had 356 entries on the register during base period one. The Council also had 108
registrations for Base Period two giving a total of 464 entries for the first two base periods.
11.138 With this set to increase year on year, the Council decided Regulation 5 (local eligibility conditions) of the
Self-build and Custom Housebuilding Regulations (2016), which enables authorities to set additional
eligibility criteria for entry on their register. The implementation of additional criteria enabled a re-
assessment of individuals and groups who are interested in developing their own home in the Borough.
11.139 On the 3rd of July 2017 Wandsworth Council’s Executive adopted a local connections test and one-off
charge of £150 to cover administration for entry on the Wandsworth Register, although note that on the
24th of June 2019 the Council’s Executive agreed the discontinuation of the registration fee.
11.140 As of the 1st of December 2019 Wandsworth has 17 entrants on the register in total.
69 PPG Paragraph: 003 Reference ID: 67-003-20190722
Wandsworth Local Housing Needs Assessment, Size and tenure mix to 2037
GL Hearn Page 160 of 176
Wandsworth LHNA
Official
11.141 As of the 31st of October (2019) the Council has granted sufficient planning permissions to have met the
requirements set out in the Self-build and Custom Housebuilding Act 2015 (as amended by the Housing
and Planning Act 2016).
11.142 This is demonstrated by the 64 permissions that have been granted self-build exemption from CIL since
the beginning of base period one. It is important to note this is in excess of the total number of entrants
on the register (i.e. 17 as of the 1st of December 2019).

Wandsworth Local Housing Needs Assessment, Size and tenure mix to 2037
GL Hearn Page 161 of 176
Wandsworth LHNA
Official
12 CONCLUSIONS AND RECOMMENDATIONS
12.1 The London Borough of Wandsworth Local Housing Needs Assessment follows the approach to housing
need using the standard methodology as set out by the Government in the NPPF, and PPG associated
with capturing the need for affordable, specialist and Build to Rent housing as appropriate.
12.2 While we have applied the standard method, this should be viewed as the minimum housing need to be
planned for with local authorities encouraged to exceed this figure.
Standard Method
12.3 The standard method seeks to simplify the approach to housing need and has three components:
• Baseline;
• Affordability Adjustment; and
• Capping the increase.
12.4 The starting point household projections show over the period 2020-30a household growth of 14,062
(1,406 households per annum). This equates to a 9.8% increase in households over the same period.
The methodology also suggests that the calculations should be based on the 10-year period starting with
the current year.
12.5 The methodology seeks to adjust the demographic baseline on the affordability ratio. The adjustment
increases the housing need where house prices are high relative to workplace incomes. Specifically, the
adjustment increases the housing need derived from the household projections by 0.25% for every
percentage point the workplace based median affordability ratio is above four (4.0).
12.6 This is justified on the basis that four is the typical multiple used by mortgage providers to gauge
affordability. The equation is as follows:
Adjustment factor = (Local affordability ratio – 4)/4 X 0.25
12.7 In 2019, the workplace affordability ratio in Wandsworth was 18.44; i.e. median house prices were 18.44
times the median earnings of those working in the Borough. This means that the adjustment factor for
Wandsworth is 0.903 or 90.3%. This is calculated as follows: (18.44 - 4) / 4 × 0.25).
12.8 To this point, the housing need in Wandsworth would be 90.3% above the demographic baseline of
1,406households per annum. This uplifted figure would therefore be 2,675 dwellings per annum.
12.9 The final step in the standard method is to consider whether a cap is applicable to the market signals
uplift.

Wandsworth Local Housing Needs Assessment, Size and tenure mix to 2037
GL Hearn Page 162 of 176
Wandsworth LHNA
Official
12.10 There are two situations where a cap is applied. The first is where an authority has reviewed their plan
(including developing an assessment of housing need) or adopted a plan within the last five years. In this
instance, the need may be capped at 40% above the requirement figure set out in the plan.
12.11 The second situation is where plans and evidence are more than five years old. In such circumstances,
a cap may be applied at 40% of the higher of the projected household growth or the housing requirement
in the most recent plan (where this exists).
12.12 In Wandsworth, given that the most recent plan is the current London Plan70 which was adopted in March
2015 i.e. more than 5 years ago, the capping means that the housing need would be set at 40% above
the Borough target (1,812 dpa) in the London Plan given that this exceeds projected household growth
(1,406).
12.13 A cap of 40% above the current target (i.e. 1,812 × 1.4) would lead to a figure of 2,537 dwellings per
annum for the 2020-30 period. The cap applies given the capped figure (2,537 dpa) is less than the figure
arrived at in step 2 (2,675 dwellings). Therefore 2,537 dpa would be classed as the local housing need
figure (LHNF) for the Borough under the Standard Method.
12.14 Recommendation: The Council should consider its objectively assessed need for housing to be
2,537 dwellings per annum and seek to meet this as much as possible.
Affordable Housing Need
12.15 The report has considered the need for affordable housing in accordance with PPG. Using the available
information, it identifies a need for 2,327 affordable homes per annum across the Borough for the 2019-
37 period based on delivery of 2,537 dpa.
12.16 Recommendation: Given the analysis above, LBW should seek to provide as much affordable
housing as viably possible.
12.17 It is also apparent that there many households in Wandsworth who are being excluded from the owner-
occupied sector. Our assessment identifies a need for affordable home ownership (AHO) products
amounting to 1,248 per annum between 2019 and 2037.
70 The London Plan is used for this calculation on account of the primacy of the London Plan over Wandsworth’s Local Plan

Wandsworth Local Housing Needs Assessment, Size and tenure mix to 2037
GL Hearn Page 163 of 176
Wandsworth LHNA
Official
12.18 It seems likely in Wandsworth that access to owner-occupation is being restricted by access to capital
(e.g. for deposits, stamp duty, legal costs) as well as potentially some mortgage restrictions (e.g. where
employment is temporary) rather than being due to the actual cost of housing.
12.19 It may, therefore, be the case that providing some ‘affordable home ownership’ properties would assist in
getting some households out of the private rented sector.
12.20 If this could be achieved then it would be reasonable for up to 10% of new homes to fall into the affordable
home-ownership category (10% being the Government expectation moving forward).
12.21 Recommendation: LBW should seek to achieve 10% of housing (or 35% of total affordable housing
requirement) within the affordable home-ownership tenures. The recommended figure however
does not however include the London Living Rent tenure. Although, the emerging London Plan
classifies it as an intermediate tenure, it has the potential to meet the housing need of households
on lower incomes.
12.22 It will also be important to set these at a price point where there is a likelihood that a reasonable number
of households will be able to afford (subject to issues around access to capital for example).
12.23 This study has set out a suggested purchase price for affordable home ownership in LBW. The figures
are based on calculating a sales value that equates to the rent paid in the PRS, derived from assumptions
as to what proportion of household income should be spent on housing costs. This shows a 1-bedroom
home ‘affordable’ price of £260,000 rising to £577,500 for 4+ bedrooms.
Need for Different Types and Sizes of Homes
12.24 The modelling outputs set out in this report provide an estimate of the proportion of homes of different
sizes that are needed. The mix of affordable rented housing sought through development at a Borough-
wide level should be as follows:
• 1-bed properties: 40-45%
• 2-bed properties: 30-35%
• 3-bed properties: 20-25%
• 4-bed properties: 5-10%
12.25 The strategic conclusions recognise the role which delivery of larger family homes can play in releasing
a supply of smaller properties for other households. They also acknowledge the limited flexibility which
one-bed properties offer to changing household circumstances which can feed through into higher
turnover and management issues.

Wandsworth Local Housing Needs Assessment, Size and tenure mix to 2037
GL Hearn Page 164 of 176
Wandsworth LHNA
Official
12.26 The provision of affordable home ownership dwellings should be more explicitly focused on delivering
smaller family housing for younger households. On this basis the following mix of low-cost home
ownership housing is suggested:
• 1-bed properties: 30-35%
• 2-bed properties: 40-45%
• 3-bed properties: 15-20%
• 4-bed properties: 5%-10%
12.27 In the market sector, a balance of dwellings is suggested that takes account of both the demand for homes
and the changing demographic profile. The following mix of market housing is suggested:
• Studio properties: 0-5%
• 1-bed properties: 30-40%
• 2-bed properties: 30-40%
• 3-bed properties: 15-25%
• 4-bed properties: 5-10%
12.28 The figures may be used as a monitoring tool to ensure that future delivery is not unbalanced when
compared with the likely requirements as indicated by forecast demographic change in the area or linked
to macro-economic factors and local supply.
12.29 The mix identified above should inform strategic planning and housing policies. In applying recommended
housing mix to individual development sites, regard should be had to the nature of the development site
and character of the area, and to up-to-date evidence of need as well as the existing mix and turnover of
properties at the local level.
12.30 Recommendations: any plan or policy making based upon the above mix at strategic level over
the plan period should have regard to the evidence of need set out above, and where possible
should include appropriate monitoring mechanism to ensure that future delivery is not
unbalanced when compared with the likely requirement as driven by the demographic change in
the area.
12.31 Drawing the need and mix analysis in the report together we can provide an indicative mix of housing for
LBW, although it should be stressed this is only indicative and other decisions may be taken to move
away from this mix e.g. to change the mix of affordable housing.
12.32 It is important to emphasise that the analysis was undertaken prior to the COVID-19 pandemic, and
therefore does not necessarily reflect potential changes in relation to out-migration and how this may
affect the type and size of home needed. Therefore, there is a need for the Council to maintain flexibility

Wandsworth Local Housing Needs Assessment, Size and tenure mix to 2037
GL Hearn Page 165 of 176
Wandsworth LHNA
Official
in its approach to the provision of market housing in order to be able to be responsive to changing
circumstances.
12.33 The analysis linked to the identified housing need and a range of other factors results in the following
recommended mix of homes:
Studio 1-Bed 2-Bed 3-Bed 4+ Bed
Market 5% 30-40% 30-40% 15-25% 5-10%
Affordable home ownership 0% 35-40% 40-45% 15-20% 5-10%
Affordable housing (rented) 0% 40-45% 30-35% 20-25% 5-10%
12.34 Within these broad tenures, it is not suggested that the Council has any specific target for market homes,
whereas it might be appropriate to set targets for other tenures such as affordable home ownership and
rented dwellings.
Older Persons Housing Need
75+
12.35 The Housing Needs Assessment indicates that the number of households over 75 across Borough is
projected to increase by 58% over the period to 2037 based on 2,537 dwellings per annum.
12.36 Based principally on the expected growth in the population of older persons (over 75), the report estimates
an additional need for 1,453 specialist dwellings for older people. These dwellings will contribute to the
fulfilment of LBW’s overall housing needs figure.
12.37 In addition, the evidence gathered indicates demand for an additional 1,258 care beds.
12.38 LBW's own projections offer an alternative method for arriving at need; this reflects a “policy-on” approach
and arrives at a substantially lower figure than that used by GL Hearn.
Pre-Retirement
12.39 An estimated 664 people aged 65-74 with more serious disabilities are likely to require extensive
adaptations to their homes by 2037 to enable them to remain in their home and enjoy an acceptable
standard of living.
16-64
12.40 For those aged between 16 and 64, this study estimates that 1,689 dwellings should be prioritised for
adaptation to meet the needs of people with a serious disability.

Wandsworth Local Housing Needs Assessment, Size and tenure mix to 2037
GL Hearn Page 166 of 176
Wandsworth LHNA
Official
Wheelchair users
12.41 Across all age groups, a need is identified for 76 wheel cheer adapted homes per year, or 1,258 by 2037,
equivalent to 3.0% of new housing provision based on 2,537 dpa. The forms a subset of the need for
specialist housing and adaptations for those older and disabled persons aged 16-75+ set out in earlier
paragraphs, but may provide some guidance as to resourcing and design.
12.42 Decisions about the appropriate mix of specialist housing should take account of the current stock, other
local needs evidence as appropriate, and policies regarding accommodation and care for older persons.
12.43 Recommendation: The Council should give consideration to how best to deliver the identified
specialist housing need, including, for instance, the potential to identify sites in accessible
locations for specialist housing (transport hubs and near town centres) or to require provision of
specialist housing for older people as part of larger strategic development schemes or master-
planning sites.
Student Housing
12.44 There is no requirement to increase the overall housing need on the basis of Student growth.
Custom and Self Build
12.45 As of the 1st of December 2019 Wandsworth has 17 entrants on the Council’s self-build register in total.
Given that the Council has granted planning permission for 64 CIL exempt dwellings since the start of the
plan period, no further provision is required to sought in policy.
Short-term Lets
12.46 The current level of activity identified in this study does not pose a significant threat to residents seeking
properties to rent in Wandsworth.
12.47 The sharp upward trend in activity observed during 2019 is a cause for concern however, and this should
be monitored moving forward.

Wandsworth Local Housing Needs Assessment, Size and tenure mix to 2037
GL Hearn Page 167 of 176
Wandsworth LHNA
Official
APPENDIX A: HOUSING NEEDS ASSESSMENT GLOSSARY
Adoption
The final confirmation of a local plan by a local planning authority
Affordability71
The terms ‘affordability’ and ‘affordable housing’ have different meanings. ‘Affordability’ is a measure of
whether housing may be afforded by certain groups of households. ‘Affordable housing’ refers to
particular products outside the main housing market.
Affordability Ratio
Assessing affordability involves comparing house costs against the ability to pay. The ratio between
lower quartile house prices and the lower quartile income or earnings can be used to assess the relative
affordability of housing. The Ministry for Housing, Community and Local Governments publishes
quarterly the ratio of lower quartile house price to lower quartile earnings by local authority (LQAR) as
well as median house price to median earnings by local authority (MAR) e.g. income = £25,000, house
price = £200,000. House price: income ratio = £200,000/£25,000 = 8, (the house price is 8 times
income).
Affordable Housing
The latest definition of affordable housing can be found in Annex 2: Glossary on page 64 of NPPF2. The
full text is set out below.
Affordable housing for sale or rent, for those whose needs are not met by the market (including housing
that provides a subsidised route to home ownership and/or is for essential local workers); and which
complies with one or more of the following definitions:
a) Affordable housing for rent: meets all of the following conditions: (a) the rent is set in accordance with
the Government’s rent policy for Social Rent or Affordable Rent, or is at least 20% below local market
rents (including service charges where applicable); (b) the landlord is a registered provider, except
where it is included as part of a Build to Rent scheme (in which case the landlord need not be a
registered provider); and (c) it includes provisions to remain at an affordable price for future eligible
households, or for the subsidy to be recycled for alternative affordable housing provision. For Build to
Rent schemes affordable housing for rent is expected to be the normal form of affordable housing
provision (and, in this context, is known as Affordable Private Rent).
b) Starter homes: is as specified in Sections 2 and 3 of the Housing and Planning Act 2016 and any
secondary legislation made under these sections. The definition of a starter home should reflect the
meaning set out in statute and any such secondary legislation at the time of plan-preparation or
decision-making. Where secondary legislation has the effect of limiting a household’s eligibility to
purchase a starter home to those with a particular maximum level of household income, those
restrictions should be used.
c) Discounted market sales housing: is that sold at a discount of at least 20% below local market value.
Eligibility is determined with regard to local incomes and local house prices. Provisions should be in
place to ensure housing remains at a discount for future eligible households.
71http://www.communities.gov.uk/documents/planningandbuilding/pdf/1918430.pdf
Wandsworth Local Housing Needs Assessment, Size and tenure mix to 2037
GL Hearn Page 168 of 176
Wandsworth LHNA
Official
d) Other affordable routes to home ownership: is housing provided for sale that provides a route to
ownership for those who could not achieve home ownership through the market. It includes shared
ownership, relevant equity loans, other low cost homes for sale (at a price equivalent to at least 20%
below local market value) and rent to buy (which includes a period of intermediate rent). Where public
grant funding is provided, there should be provisions for the homes to remain at an affordable price for
future eligible households, or for any receipts to be recycled for alternative affordable housing provision,
or refunded to Government or the relevant authority specified in the funding agreement.
In addition, the Greater London Authority has developed a number of housing products that fall within
the NPPF definitions but are tailored to the needs of the city. Definitions of these, drawn from the
Homes for Londoners, Affordable Homes Programme 2016-21, are set out below.
London Affordable Rent are low cost rented homes that are similar to "Social Rent" in the NPPF
targeted at low-income households who are unable to secure or sustain housing on the open market.
Rents are set at levels substantially below that for affordable rent products, such as London Living Rent
or the NPPF definition of Affordable Rent (set out in this glossary). The starting point for setting rents for
London Affordable Rent are benchmarks that reflect the formula rent cap figures for social rents uprated
by the Consumer Price Index (CPI) plus 1%. These benchmarks are updated by the GLA annually.
London Living Rent is an intermediate affordable housing product with locally specified rents. It is a
“Rent to Buy” product with sub-market rents on time-limited tenancies. The product is designed to help
households on average income levels to save for a deposit to buy their own home. The GLA calculates
ward-specific rents based on one third of median gross household income for the local borough. The
rent also varies with house prices for the ward and the number of bedrooms in the home.
London Shared Ownership allows a home buyer to purchase a share in a new home, and pay a
regulated rent on the remaining, unsold share. London Shared Ownership purchasers should have
household incomes that can support an initial purchase of between 25 per cent and 75 per cent of the
value of a property, and usually a mortgage deposit of around 10 per cent of the share to be purchased.
Initial rents on the unsold equity of London Shared Ownership properties can be no more than 2.75 per
cent of the value of the unsold equity at the point of initial sale.
Annual Monitoring Report
A report submitted to the Government by local planning authorities assessing progress with and the
effectiveness of a Local Development Framework.
Bedroom Standard72
A measure of occupancy (whether a property is overcrowded or under‐occupied, based on the number
of bedrooms in a property and the type of household in residence. The Census overcrowding data is
based on occupancy rating (overcrowding by number of rooms not including bathrooms and hallways).
72 https://www.gov.uk/government/publications/english‐housing‐survey‐ 2011‐to‐2012‐headline‐report

Wandsworth Local Housing Needs Assessment, Size and tenure mix to 2037
GL Hearn Page 169 of 176
Wandsworth LHNA
Official
This tends to produce higher levels of overcrowding/ under occupation. A detailed definition of the
standard is given in the Glossary of the EHS Household Report.
Co-living
Co-living denotes people who do not have family ties sharing either a self-contained dwelling (i.e., a
'house share') or new development akin to student housing in which people have a bedroom and
bathroom to themselves, but share living and kitchen space with others. In co-living schemes each
individual represents a separate 'household'.
Community Led Housing/Community Land Trust
Housing development, provision and management that is led by the community is very often driven by a
need to secure affordable housing for local people in the belief that housing that comes through the
planning system may be neither the right tenure or price-point to be attractive or affordable to local
people. The principle forms of community-led models include cooperatives, co-housing communities,
self-help housing, community self-build housing, collective custom-build housing, and community land
trusts. By bringing forward development which is owned by the community, the community is able to set
rents and/or mortgage payments at a rate that it feels is appropriate. The Government has a range of
support programmes for people interested in bringing forward community led housing. Concealed Families (Census Definition)73 The 2011 Census defined a concealed family as one with young adults living with a partner and/or
child/children in the same household as their parents, older couples living with an adult child and their
family or unrelated families sharing a household. A single person cannot be a concealed family;
therefore one elderly parent living with their adult child and family or an adult child returning to the
parental home is not a concealed family; the latter are reported in an ONS analysis on increasing
numbers of young adults living with parents.
Equity Loans/Shared Equity An equity loan which acts as a second charge on a property. For example, a household buys a £200,000
property with a 10% equity loan (£20,000). They pay a small amount for the loan and when the property
is sold e.g. for £250,000 the lender receives 10% of the sale cost (£25,000). Some equity loans were
available for the purchase of existing stock. The current scheme is to assist people to buy new build.
Extra Care Housing74 New forms of sheltered housing and retirement housing have been pioneered in recent years, to cater for
older people who are becoming frailer and less able to do everything for themselves. Extra Care Housing
is housing designed with the needs of frailer older people in mind and with varying levels of care and
support available on site. People who live in Extra Care Housing have their own self-contained homes,
their own front doors and a legal right to occupy the property. Extra Care Housing is also known as very
73 http://webarchive.nationalarchives.gov.uk/20160107160832/http://www.ons.gov.uk/ons/dcp171776_350282.pdf 74 http://www.housingcare.org/jargon-extra-care-housing.aspx

Wandsworth Local Housing Needs Assessment, Size and tenure mix to 2037
GL Hearn Page 170 of 176
Wandsworth LHNA
Official
or enhanced sheltered housing, assisted living, or simply as 'housing with care'. It comes in many built
forms, including blocks of flats, bungalow estates and retirement villages. It is a popular choice among
older people because it can sometimes provide an alternative to a care home. In addition to the communal
facilities often found in sheltered housing (residents' lounge, guest suite, laundry), Extra Care often
includes a restaurant or dining room, health & fitness facilities, hobby rooms and even computer rooms.
Domestic support and personal care are available, usually provided by on-site staff. Properties can be
rented, owned or part owned/part rented. There is a limited (though increasing) amount of Extra Care
Housing in most areas and most providers set eligibility criteria which prospective residents have to meet.
Household Reference Person (HRP) The concept of a Household Reference Person (HRP) was introduced in the 2001 Census (in common
with other government surveys in 2001/2) to replace the traditional concept of the head of the household.
HRPs provide an individual person within a household to act as a reference point for producing further
derived statistics and for characterising a whole household according to characteristics of the chosen
reference person.

Wandsworth Local Housing Needs Assessment, Size and tenure mix to 2037
GL Hearn Page 171 of 176
Wandsworth LHNA
Official
Housing Size (Census Definition) Housing size can be referred to either in terms of the number of bedrooms in a home (a bedroom is
defined as any room that was intended to be used as a bedroom when the property was built, any rooms
permanently converted for use as bedrooms); or in terms of the number of rooms, excluding bathrooms,
toilets halls or landings, or rooms that can only be used for storage. All other rooms, for example, kitchens,
living rooms, bedrooms, utility rooms, studies and conservatories are counted. If two rooms have been
converted into one, they are counted as one room. Rooms shared between a number of households, for
example a shared kitchen, are not counted.
Housing Type (Census Definition) This refers to the type of accommodation used or available for use by an individual household, including
detached, semi-detached, terraced including end of terraced, and flats. Flats are broken down into those
in a purpose-built block of flats, in parts of a converted or shared house, or in a commercial building.
Housing Tenure (Census Definition) Tenure provides information about whether a household rents or owns the accommodation that it
occupies and, if rented, combines this with information about the type of landlord who owns or manages
the accommodation.
Income Threshold (income required to rent) Income thresholds are derived as a result of the annualisation of the monthly rental cost and then
asserting this cost should not exceed 35% of annual household income.
Life Time Homes Dwellings constructed to make them more flexible, convenient adaptable and accessible than most
‘normal’ houses, usually according to the Lifetime Homes Standard, 16 design criteria that can be applied
to new homes at minimal cost: http://www.lifetimehomes.org.uk/.
Local Planning Authority The public authority whose duty it is to carry out specific planning functions for a particular area. All
references to local planning authority apply to the District council, London Borough council, county council,
Broads Authority, National Park Authority and the Greater London Authority, to the extent appropriate to
their responsibilities.
Local Plan The plan for the future development of the local area, drawn up by the local planning authority in
consultation with the community. In law this is described as the development plan documents adopted
under the Planning and Compulsory Purchase Act 2004. Current core strategies or other planning policies,
Wandsworth Local Housing Needs Assessment, Size and tenure mix to 2037
GL Hearn Page 172 of 176
Wandsworth LHNA
Official
which under the regulations would be considered to be development plan documents, form part of the
Local Plan. The term includes old policies which have been saved under the 2004 Act.
Lower Quartile The bottom 25% value, i.e. of all the properties sold, 25% were cheaper than this value and 75% were
more expensive. The lower quartile price is used as an entry level price and is the recommended level
used to evaluate affordability; for example for first time buyers.
Lower Quartile Affordability Ratio The Lower Quartile Affordability Ratio reflects the relationship between Lower Quartile Household
Incomes and Lower Quartile House Prices, and is a key indicator of affordability of market housing for
people on relatively low incomes.
Market Housing (PPG Definition) Market housing is housing which is built by developers (which may be private companies or housing
associations, or Private Registered Providers), for the purposes of sale (or rent) on the open market. It is
the opposite of affordable housing.
Mean (Average) The sum of all values divided by the number of values. The more commonly used “average” measure as
it includes all values, unlike the median
Median The middle value, i.e. of all the properties sold, half were cheaper and half were more expensive. This is
sometimes used instead of the mean average as it is not subject to skew by very large or very small
statistical outliers.
Mortgage Ratio
The mortgage ratio is the ratio of mortgage value to income which is typically deemed acceptable by
banks. Approximately 75% of all mortgage lending ratios fell below 4 in recent years75, i.e. the total value
of the mortgage was less than 4 times the annual income of the person who was granted the mortgage.
Older People People over retirement age, including the active, newly-retired through to the very frail elderly, whose
housing needs can encompass accessible, adaptable general needs housing for those looking to
downsize from family housing and the full range of retirement and specialised housing for those with
support or care needs.
Output Area/Lower Super Output Area/Middle Super Output Area
75 https://www.which.co.uk/news/2017/08/how-your-income-affects-your-mortgage-chances/

Wandsworth Local Housing Needs Assessment, Size and tenure mix to 2037
GL Hearn Page 173 of 176
Wandsworth LHNA
Official
An output area is the lowest level of geography for publishing statistics, and is the core geography from
which statistics for other geographies are built. Output areas were created for England and Wales from
the 2001 Census data, by grouping a number of households and populations together so that each output
area's population is roughly the same. 175,434 output areas were created from the 2001 Census data,
each containing a minimum of 100 persons with an average of 300 persons. Lower Super Output Areas
consist of higher geographies of between 1,000-1,500 persons (made up of a number of individual Output
Areas) and Middle Super Output Areas are higher than this, containing between 5,000 and 7,200 people,
and made up of individual Lower Layer Super Output Areas. Some statistics are only available down to
Middle Layer Super Output Area level, meaning that they are not available for individual Output Areas or
parishes.
Overcrowding There is no one agreed definition of overcrowding, however, utilising the Government’s bedroom standard,
overcrowding is deemed to be in households where there is more than one person in the household per
room (excluding kitchens, bathrooms, halls and storage areas). As such, a home with one bedroom and
one living room and one kitchen would be deemed overcrowded if three adults were living there.
Planning Condition A condition imposed on a grant of planning permission (in accordance with the Town and Country
Planning Act 1990) or a condition included in a Local Development Order or Neighbourhood Development
Order.
Planning Obligation A legally enforceable obligation entered into under section 106 of the Town and Country Planning Act
1990 to mitigate the impacts of a development proposal.
Purchase Threshold (Income required to buy) Purchase thresholds are calculated by netting 10% off the entry house price to reflect purchase deposit.
The resulting cost is divided by 4 to reflect the standard household income requirement to access
mortgage products.
Private Rented The Census tenure private rented includes a range of different living situations in practice, such as private
rented/ other including households living “rent free”. Around 20% of the private rented sector are in this
category, which will have included some benefit claimants whose housing benefit at the time was paid
directly to their landlord. This could mean people whose rent is paid by their employer, including some
people in the armed forces. Some housing association tenants may also have been counted as living in
the private rented sector because of confusion about what a housing association is.

Wandsworth Local Housing Needs Assessment, Size and tenure mix to 2037
GL Hearn Page 174 of 176
Wandsworth LHNA
Official
Rural Exception Sites Small sites used for affordable housing in perpetuity where sites would not normally be used for housing.
Rural exception sites seek to address the needs of the local community by accommodating households
who are either current residents or have an existing family or employment connection. Small numbers of
market homes may be allowed at the local authority’s discretion, for example where essential to enable
the delivery of affordable units without grant funding.
Self-containment
The degree of self-containment refers to the extent to which a given indicator or variable can be said to
exist within the boundaries of a given geography. For example, if a housing market area (HMA) is said to
have a domestic house-moves self-containment rate of 70% it indicates that 70% of all house-moves take
place within the boundaries of the HMA.
Shared Ownership Housing where a purchaser part buys and part rents from a housing association or local authority. Typical
purchase share is between 25% and 75%, and buyers are encouraged to buy the largest share they can
afford. Generally applies to new build properties, but re‐sales occasionally become available. There may
be an opportunity to rent at intermediate rent level before purchasing a share in order to save/increase
the deposit level.
Sheltered Housing76
Sheltered housing (also known as retirement housing) means having your own flat or bungalow in a block,
or on a small estate, where all the other residents are older people (usually over 55). With a few exceptions,
all developments (or 'schemes') provide independent, self-contained homes with their own front doors.
There are many different types of scheme, both to rent and to buy. They usually contain between 15 and
40 properties, and range in size from studio flats (or 'bedsits') through to 2 and 3 bedrooms. Properties in
most schemes are designed to make life a little easier for older people -with features like raised electric
sockets, lowered worktops, walk-in showers, and so on. Some will usually be designed to accommodate
wheelchair users. And they are usually linked to an emergency alarm service (sometimes called
'community alarm service') to call help if needed. Many schemes also have their own 'manager' or 'warden',
either living on-site or nearby, whose job is to manage the scheme and help arrange any services
residents need. Managed schemes will also usually have some shared or communal facilities such as a
lounge for residents to meet, a laundry, a guest flat and a garden.
Specialist Housing for the Elderly
76 http://www.housingcare.org/jargon-sheltered-housing.aspx

Wandsworth Local Housing Needs Assessment, Size and tenure mix to 2037
GL Hearn Page 175 of 176
Wandsworth LHNA
Official
Specialist housing for the elderly, sometimes known as specialist accommodation for the elderly,
encompasses a wide range of housing types specifically aimed at older people, which may often be
restricted to those in certain older age groups (usually 55+ or 65+). This could include residential
institutions, sometimes known as care homes, sheltered housing, extra care housing, retirement housing
and a range of other potential types of housing which has been designed and built to serve the needs of
older people, including often providing care or other additional services. This housing can be provided in
a range of tenures (often on a rented or leasehold basis).
Social Rented Housing Social rented housing is owned by local authorities and private registered providers (as defined in Section
80 of the Housing and Regeneration Act 2008) for which guideline target rents are determined through
the national rent regime. It may also be owned by other persons and provided under equivalent rental
arrangements to the above, as agreed with the local authority or with Homes England77.
Supported housing
Supported housing brings together a range of dwelling types (and associated services) that enable a
range of people to access suitable housing as well as live safely and securely in their own home. While
older people are a prominent user group in the form of extra-care and sheltered housing, other groups
include victims of domestic violence, the homeless, people with mental health needs and those with
people with learning disabilities
77 http://www.communities.gov.uk/documents/planningandbuilding/doc/1980960.doc#Housing

Wandsworth Local Housing Needs Assessment, Size and tenure mix to 2037
GL Hearn Page 176 of 176
Wandsworth LHNA
Official
General Disclaimer This report has been prepared by GL Hearn Limited (GL Hearn) in favour OF London Borough of Wandsworth and is for the sole use and benefit of the Client in accordance with the agreement between the Client and GL Hearn dated 1st August 2019 under which GL Hearn’s services were performed. GL Hearn accepts no liability to any other party in respect of the contents of this report. This report is confidential and may not be disclosed by the Client or relied on by any other party without the express prior written consent of GL Hearn. Whilst care has been taken in the construction of this report, the conclusions and recommendations which it contains are based upon information provided by third parties (“Third Party Information”). GL Hearn has for the purposes of this report relied upon and assumed that the Third Party Information is accurate and complete and has not independently verified such information for the purposes of this report. GL Hearn makes no representation, warranty or undertaking (express or implied) in the context of the Third Party Information and no responsibility is taken or accepted by GL Hearn for the adequacy, completeness or accuracy of the report in the context of the Third Party Information on which it is based. Freedom of Information GL Hearn understands and acknowledges the Authority’s legal obligations and responsibilities under the Freedom of Information Act 2000 (the “Act”) and fully appreciates that the Authority may be required under the terms of the Act to disclose any information which it holds. GL Hearn maintains that the report contains commercially sensitive information that could be prejudicial to the commercial interests of the parties. On this basis GL Hearn believes that the report should attract exemption from disclosure, at least in the first instance, under Sections 41 and/or 43 of the Act. GL Hearn accepts that the damage which it would suffer in the event of disclosure of certain of the confidential information would, to some extent, reduce with the passage of time and therefore proposes that any disclosure (pursuant to the Act) of the confidential information contained in the report should be restricted until after the expiry of 24 months from the date of the report.