Embed Size (px)
Citation preview
2013 Housing Needs of Homeless Families and Individuals in Florida
April 7, 2013
Prepared for Florida Housing Finance Corporation 227 N. Bronough St., Suite 5000
Tallahassee, Florida 32301-1329
Prepared by Shimberg Center for Housing Studies
University of Florida P. O. Box 115703
Gainesville, Florida 32611-5703

i
Contents
1. Introduction and Summary of Findings........................................................................................ 1
2. Methodology .................................................................................................................................... 2
Need: Counts for Families and Individuals ............................................................................................... 4
Supply: Housing Inventory Counts ........................................................................................................... 5
3. Homeless Individuals and Families ............................................................................................... 6
Table 3.1. Homeless Individuals and Families by Region, 2012 ............................................................................................... 7 Figure 3.1. Homeless Individuals by Region, 2012 .................................................................................................................. 9 Figure 3.2. Homeless Families by Region, 2012 .................................................................................................................... 10
Subpopulations ....................................................................................................................................... 11
Table 3.2. Homeless Persons by Subpopulation, Florida, 2012 ............................................................................................. 11
4. Transitional and Permanent Housing Supply ............................................................................ 12
Table 4.1. Transitional and Permanent Housing Supply by Region, 2012 ............................................................................. 13
5. Data Limitations ............................................................................................................................. 15
Appendix 1. Estimates of Family Households and Unaccompanied Youth from FDOE Homeless
Student Data ............................................................................................................................................ 16
1
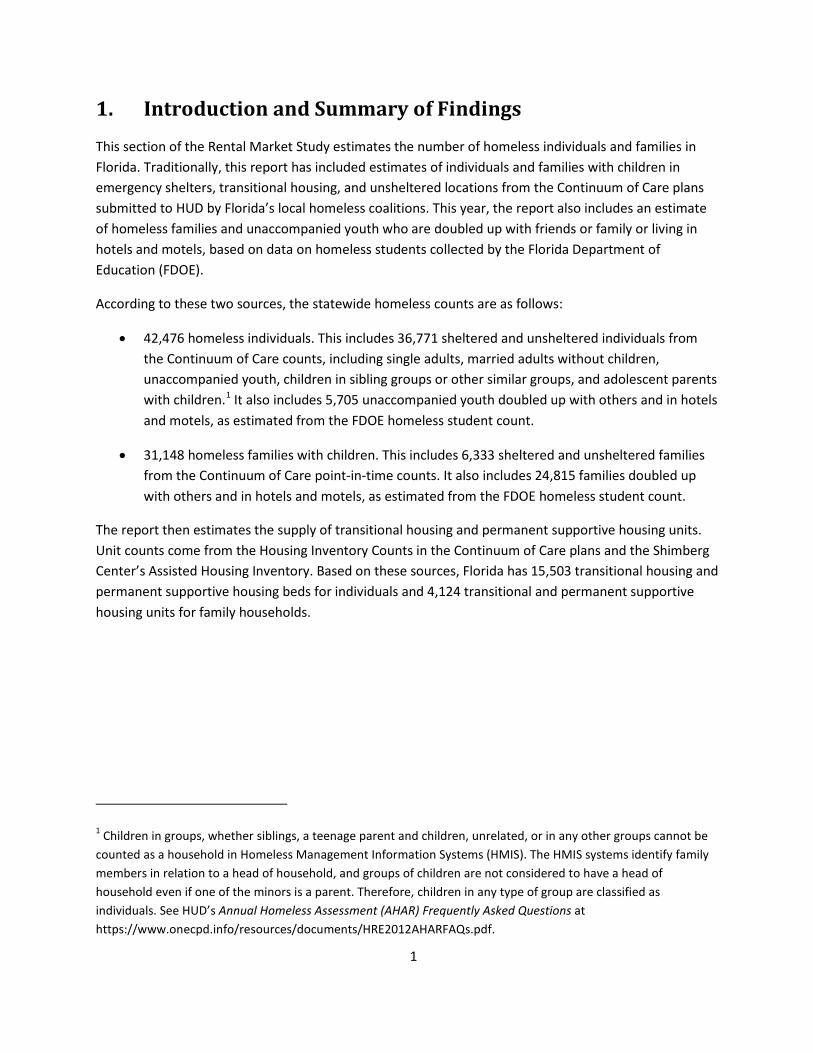
1. Introduction and Summary of Findings
This section of the Rental Market Study estimates the number of homeless individuals and families in Florida. Traditionally, this report has included estimates of individuals and families with children in emergency shelters, transitional housing, and unsheltered locations from the Continuum of Care plans submitted to HUD by Florida’s local homeless coalitions. This year, the report also includes an estimate of homeless families and unaccompanied youth who are doubled up with friends or family or living in hotels and motels, based on data on homeless students collected by the Florida Department of Education (FDOE).
According to these two sources, the statewide homeless counts are as follows:
• 42,476 homeless individuals. This includes 36,771 sheltered and unsheltered individuals from the Continuum of Care counts, including single adults, married adults without children, unaccompanied youth, children in sibling groups or other similar groups, and adolescent parents with children.1 It also includes 5,705 unaccompanied youth doubled up with others and in hotels and motels, as estimated from the FDOE homeless student count.
• 31,148 homeless families with children. This includes 6,333 sheltered and unsheltered families from the Continuum of Care point-in-time counts. It also includes 24,815 families doubled up with others and in hotels and motels, as estimated from the FDOE homeless student count.
The report then estimates the supply of transitional housing and permanent supportive housing units. Unit counts come from the Housing Inventory Counts in the Continuum of Care plans and the Shimberg Center’s Assisted Housing Inventory. Based on these sources, Florida has 15,503 transitional housing and permanent supportive housing beds for individuals and 4,124 transitional and permanent supportive housing units for family households.
1 Children in groups, whether siblings, a teenage parent and children, unrelated, or in any other groups cannot be counted as a household in Homeless Management Information Systems (HMIS). The HMIS systems identify family members in relation to a head of household, and groups of children are not considered to have a head of household even if one of the minors is a parent. Therefore, children in any type of group are classified as individuals. See HUD’s Annual Homeless Assessment (AHAR) Frequently Asked Questions at https://www.onecpd.info/resources/documents/HRE2012AHARFAQs.pdf.
2
2. Methodology
The counts of homeless households and housing supply are based on four data sources:
• 2012 Point-In-Time counts of homeless individuals and families submitted by Florida’s local homeless coalitions to the U.S. Department of Housing and Urban Development (HUD) as part of the annual Continuum of Care plan. Each coalition represents a county or a group of counties in Florida.2 Sixty-four of Florida’s 67 counties are represented by homeless coalitions. Baker, Union, and Dixie Counties were unrepresented in the 2012 Continuum of Care plans. The plans are required by HUD as part of the coalitions’ applications for McKinney-Vento Act homeless assistance funds. The point-in-time count is a one-day census of homeless persons in each Continuum of Care region during the last 10 days of January. HUD does not allow the use of multipliers or other estimating methods to produce a population number.
• Florida Department of Education’s (FDOE) 2011-2012 Homeless Students Count, which is based on data submitted by homeless liaisons from all Florida school districts. Data are available at http://www.fldoe.org/bsa/title1/titlex.asp. The counts include students identified as homeless at any point during the 2011-2012 school year. For each county, students are categorized by place of nighttime residence (shelters, unsheltered locations, doubled up, hotels/motels, etc.) and accompaniment status (unaccompanied youth vs. living with family). The students are counted once per school year the first time they are identified as homeless, regardless if they have more than one instance of homelessness.
• 2012 Housing Inventory Counts of transitional and permanent supportive housing units, also submitted by local homeless coalitions as part of the Continuum of Care plans.
• The Shimberg Center’s Assisted Housing Inventory, which identifies subsidized rental housing developments reserved for homeless individuals and families.
The use of the FDOE count of homeless students as a supplement to the point-in-time count data is new to the Rental Market Study. By combining a portion of the estimates of homeless individuals and families derived from student data and the point-in-time counts, this report attempts to provide a broader picture of homelessness than in previous Rental Market Studies. In particular, we seek to count the “hidden homeless” among families with children and unaccompanied youth who are doubled up other family and friends or in hotels and motels. By limiting the FDOE data to these categories, we avoid double-counting those already included in the point-in-time counts. Note that the FDOE data include only students enrolled in school. It excludes babies and young children, as well as school-age children not attending school. This limitation is discussed in more detail in Section 5 below.
2 Polk County is represented by two separate Continuum of Care plans, one representing Lakeland and the other representing the rest of Polk County. The Polk County data used in this report represent the summation of the two plans.

3
In 2009, the State of Florida adopted a definition of homelessness that is more expansive than the federal definition used in the Continuum of Care plans. The federal definition includes persons living in shelters, transitional housing, temporary institutional settings, or in public or private places not designed for regular sleeping accommodations. The state definition includes these persons but also those who are doubled up with others due to economic hardship; those living in motels, hotels, trailer parks, or campgrounds; and those leaving settings such as prison, mental health facilities, or foster care settings who do not have subsequent housing.
Under guidelines from the U.S. Department of Education, Florida DOE uses a similarly expansive definition to identify homeless students. FDOE classifies homeless students in five categories according to their place of nighttime residence:
• Living in emergency or transitional shelters, FEMA Trailers, abandoned in hospitals.
• Sharing the housing of other persons due to loss of housing, economic hardship or a similar reason; doubled-up.
• Living in cars, parks, temporary trailer parks or campgrounds due to lack of alternative adequate accommodations, public spaces, abandoned buildings, substandard housing, bus or train stations, public or private place not designed for or ordinarily used as a regular sleeping accommodation for human beings or similar settings.
• Living in hotels or motels.
• Awaiting foster care.3
The student data can help fill in some gaps in the Continuum of Care plans, at least for households including school-age children. We use the student data to add families with children and unaccompanied youth who are doubled up with others or living in hotels or motels (second and fourth bullets above) to the homeless estimates. These are common circumstances for homeless children and families, but they are excluded from the point-in-time counts for the Continuum of Care plans. Student data for the other categories are not used in the report; the point-in-time counts should already include persons described in the first and third categories, and the last category, “awaiting foster care,” is not part of the state homeless definition that went into effect in 2009.
As the results in the Summary of Findings show, excluding the DOE data would greatly reduce the number of families counted. The estimated number of families who are doubled up or in hotels/motels based on the student data is nearly four times higher than the number of sheltered/unsheltered families identified in the point-in-time counts.
3 Florida Department of Education, DOE Information Database Requirements Volume I: Automated Student Information System, http://www.fldoe.org/eias/dataweb/database_1213/129525.pdf.
4
Need: Counts for Families and Individuals
The need estimates divide homeless persons into two groups: 1) families with dependent children, referred to as “family households” in this report, and 2) persons in households without dependent children, including single individuals, unaccompanied youth, and other adults such as a married couple without children. The latter group is generally referred to as “individuals” in this report.
The estimate of family households is the sum of two components:
1) The total number of sheltered and unsheltered families with dependent children reported in the Continuum of Care plans for each region.
2) An estimate of families with school-age children who are doubled up and in hotels and motels based on the FDOE student count. The student counts are classified by place of nighttime residence, with doubled up and hotels/motels as two of the categories. We summed these categories to obtain the total number of students of interest. Two additional steps were necessary to translate the number of students who are doubled up or in hotels/motels into a number of families. First, public data from FDOE indicate that 89 percent of all homeless students are identified as living in families. The remaining 11 percent are unaccompanied youth.4 Therefore, we multiplied the sum of homeless students with place of residence as doubled up and hotels/motels by .89 to find the number of students living with their families in these locations for each county. Second, a household may have more than one student; nationwide, HUD statistics show that sheltered homeless families include an average of 1.86 children per family.5 We divided the number of students in families by 1.86 to derive an estimate of the number of families. In short, for each county, Families = (Students * Percentage of students in families)/(Students per family) = (Students * .89)/1.86
Finally, we aggregated the county-level estimates into Continuum of Care region estimates. A table showing the county-level student data and their conversion to estimates for families and unaccompanied youth are included as Appendix 1.
4 Florida Department of Education, Bureau of Student Assistance, Homeless Students Identified in Florida, 2011-2012, http://www.fldoe.org/bsa/title1/pdf/1112HomelessStudentsCount.pdf. Detailed data on accompaniment status by place of nighttime residence is not included in the report.
5 U.S. Department of Housing and Urban Development. The 2011 Annual Homeless Assessment Report to Congress. November 2012. Available at https://www.onecpd.info/resources/documents/2011AHAR_FinalReport.pdf. The 1.86 children per family figure is derived by dividing the estimate of 321,548 children in families by 172,767 families (p. 40).
5
Similarly, the estimates of individuals consist of two components:
1) The total number of individuals reported in the Continuum of Care plans for each region. This is a count of persons, not households.
2) An estimate of unaccompanied youth who are doubled up and in hotels and motels based on the FDOE student count. As noted above, DOE data indicate that 11 percent of homeless students in the state are unaccompanied. We multiplied the number of homeless students with place of residence as doubled up and hotels/motels by .11 to estimate the number of individuals who are unaccompanied youth living in these locations. Again, county-level figures were then aggregated into totals for the Continuum of Care regions.
Supply: Housing Inventory Counts
Estimates of transitional and permanent supportive housing come from the 2012 Housing Inventory Counts (HIC) created for each Continuum of Care plan and from the Assisted Housing Inventory (AHI), which includes 25 developments with funding from Florida Housing Finance Corporation with “homeless” as the target demographic. In most cases, the AHI homeless units were also included in the Continuum of Care plans. AHI homeless units that did not appear in the Continuum of Care plans were added to the county totals; most were in properties that are still under development.6
The report counts units for families with children and beds for persons in other households. The transitional and permanent housing units for families in the HIC have the capacity for an average of 2.9 family members. An individual bed, whether in its own housing unit or in a shared facility, by definition houses one person.
The report does not include emergency shelter beds as part of the housing supply. HUD and Florida Housing Finance Corporation consider shelter beds to be temporary housing. Persons residing in emergency shelters are counted in the homeless population.
6 Developments receiving funding from the Florida Housing Link Initiative, which may serve homeless residents, were not included.

6
3. Homeless Individuals and Families
According to the point-in-time and student counts, 42,476 individuals were homeless in Florida in 2012. This includes 36,771 sheltered and unsheltered individuals from the Continuum of Care point-in-time counts, including single adults, married adults without children, unaccompanied youth, children in sibling groups or other similar groups, and adolescent parents with children. It also includes an estimated 5,705 unaccompanied youth doubled up with others and in hotels and motels identified in the FDOE homeless student count.
Seven counties or multi-county regions included more than 2,000 homeless individuals: Hillsborough, Orange-Osceola-Seminole, Duval-Clay-Nassau, and Volusia-Flagler.
Among families with children, 31,148 households were homeless in 2012. This includes 6,333 sheltered and unsheltered families from the Continuum of Care point-in-time counts. It also includes 24,815 families doubled up with others and in hotels and motels, as estimated from the FDOE homeless student count.
Eleven counties or multi-county regions included more than 1,000 homeless families: Orange-Osceola-Seminole, Hillsborough, Citrus-Hernando-Lake-Sumter, Miami-Dade, Pinellas, Escambia-Santa Rosa, Pasco, Volusia-Flagler, Duval-Clay-Nassau, Manatee-Sarasota, and Desoto-Glades-Hardee-Hendry-Highlands-Okeechobee.
Table 3.1 and Figures 3.1 and 3.2 on the following pages show the number of homeless individuals and families by county or multi-county region.

7
Table 3.1. Homeless Individuals and Families by Region, 2012
Coalition Counties
Individuals: Sheltered & Unsheltered from Point in Time Count
Individuals: Unaccompanied Youth Doubled
Up & Hotels/Motels from Student
Data
Total Individuals
(PIT + Student)
Family Households: Sheltered & Unsheltered from Point in Time Count
Family Households: Est. Families
Doubled Up & Hotels/Motels from Student
Data
Total Family Households
(PIT + Student)
Big Bend Leon, Franklin, Gadsden, Liberty, Madison, Taylor, Jefferson, Wakulla 634 145 779 58 630 688
Brevard Brevard 1,386 133 1,519 317 578 895 Broward Broward 2,627 143 2,770 172 624 796 Central Florida Orange, Osceola, Seminole 2,330 966 3,296 446 4,201 4,647 Charlotte Charlotte 584 48 632 39 211 250 Collier Collier 300 121 421 43 527 570 EscaRosa Escambia, Santa Rosa 667 311 978 42 1,353 1,395
Heartland Desoto, Glades, Hardee, Hendry, Highlands, Okeechobee 559 153 712 376 664 1,040
Hillsborough Hillsborough 4,515 358 4,873 832 1,557 2,389 Jacksonville Duval, Clay, Nassau 2,294 216 2,510 202 938 1,140 Lee Lee 637 112 749 40 487 527 Marion Marion 787 216 1,003 48 939 987 Miami-Dade Miami-Dade 2,517 385 2,902 427 1,676 2,103 Mid-Florida Citrus, Hernando, Lake, Sumter 1,227 446 1,673 223 1,941 2,164 Monroe Monroe 793 25 818 47 107 154 North Central Alachua, Putnam, Bradford, Levy, Gilchrist 1,476 177 1,653 85 768 853
NW Florida Bay, Calhoun, Gulf, Holmes, Jackson, Washington 244 188 432 28 819 847
Okaloosa/Walton Okaloosa, Walton 975 66 1,041 562 286 848 Palm Beach Palm Beach 1,667 103 1,770 129 448 577

8
Coalition Counties
Individuals: Sheltered & Unsheltered from Point in Time Count
Individuals: Unaccompanied Youth Doubled
Up & Hotels/Motels from Student
Data
Total Individuals
(PIT + Student)
Family Households: Sheltered & Unsheltered from Point in Time Count
Family Households: Est. Families
Doubled Up & Hotels/Motels from Student
Data
Total Family Households
(PIT + Student) Pasco Pasco 1,308 -6 1,485 1,2227 -6 1,222 Pinellas Pinellas 2,922 285 3,207 279 1,239 1,518 Polk and Tri-County Polk 750 210 960 41 913 954 St. Johns St. Johns 996 51 1,047 107 222 329 Suncoast Manatee, Sarasota 733 227 960 67 988 1,055 Suwannee Columbia, Hamilton, Lafayette, Suwannee 803 138 941 149 602 751 Treasure Coast Indian River, Martin, St. Lucie 917 50 967 272 219 491 Volusia/Flagler Volusia, Flagler 2,123 256 2,379 80 1,112 1,192 Total 36,771 5,705 42,476 6,333 24,815 31,148
Sources: U.S. Department of Housing and Urban Development, 2012 Point-in-Time Estimates of Homelessness: Volume I of the 2012 Annual Homeless Assessment Report, December 2012, https://www.onecpd.info/resource/2753/2012-pit-estimates-of-homelessness-volume-1-2012-ahar. Florida Department of Education, Bureau of Student Assistance, Homeless Students Identified in Florida, 2011-2012, http://www.fldoe.org/bsa/title1/pdf/1112HomelessStudentsCount.pdf.
7 The local homeless coalition for Pasco County used methods other than the point-in-time count to identify homeless families, such as counts from the local school district and service providers. This resulted in a count of unsheltered families that appears to be out of proportion to the county’s population compared to other coalitions using only the point-in-time data. Therefore, we do not include estimates for families and individuals (unaccompanied youth) from the DOE student data for Pasco County. The Okaloosa/Walton County coalition may have used similar methods, given that the coalition also reported an unusually high number of unsheltered families.

9
Figure 3.1. Homeless Individuals by Region, 2012
Sources: U.S. Department of Housing and Urban Development, 2012 Point-in-Time Estimates of Homelessness: Volume I of the 2012 Annual Homeless Assessment Report, December 2012, https://www.onecpd.info/resource/2753/2012-pit-estimates-of-homelessness-volume-1-2012-ahar. Florida Department of Education, Bureau of Student Assistance, Homeless Students Identified in Florida, 2011-2012, http://www.fldoe.org/bsa/title1/pdf/1112HomelessStudentsCount.pdf.

10
Figure 3.2. Homeless Families by Region, 2012
Sources: U.S. Department of Housing and Urban Development, 2012 Point-in-Time Estimates of Homelessness: Volume I of the 2012 Annual Homeless Assessment Report, December 2012, https://www.onecpd.info/resource/2753/2012-pit-estimates-of-homelessness-volume-1-2012-ahar. Florida Department of Education, Bureau of Student Assistance, Homeless Students Identified in Florida, 2011-2012, http://www.fldoe.org/bsa/title1/pdf/1112HomelessStudentsCount.pdf.

11
Subpopulations
HUD’s Annual Homeless Assessment Report also includes counts of homeless persons by subpopulation. These come only from the point-in-time counts, and do not distinguish between individuals and persons in families with children. Table 3.2 lists the statewide subpopulation counts for 2012. Not all homeless persons are included in the list of subpopulations, and a person may appear in more than one category.
Table 3.2. Homeless Persons by Subpopulation, Florida, 2012
Subpopulation Persons Chronically Homeless 8,682 Severely Mentally Ill 7,750 Chronic Substance Abuse 7,929 Veterans 5,331 Persons with HIV/AIDS 874 Victims of Domestic Violence 3,522 Unaccompanied Youth (Under 18) 856
Source: U.S. Department of Housing and Urban Development, CoC Maps, Contacts, Reports, and Awards, 2012, http://www.hudhre.info/index.cfm?do=viewHomelessRpts.

12
4. Transitional and Permanent Housing Supply
Florida has 15,503 transitional housing and permanent supportive housing beds for individuals. For families with children, there are 4,124 transitional and permanent supportive housing units statewide. These include beds and units listed in the Housing Inventory Counts submitted to HUD by local Continuum of Care coalitions plus units existing or under development for homeless households with funding from Florida Housing Finance Corporation and other public sources that are not already counted in the Continuum of Care plans.
Table 4.1 below shows the supply of transitional housing and permanent supportive housing beds for individuals, and the supply of transitional and permanent supportive housing units for families. Note that some of this supply is reserved for specific subpopulations, so not all beds and units can serve all people and households counted in the demand tables.
The table also calculates each region’s “level of effort” in providing permanent supportive housing compared to the homeless population. The level of effort equals the number of permanent supportive housing units divided by the number of individuals or families who are currently homeless from Table 1. A level of effort ratio below 1.0 indicates that there are more individuals or families currently homeless than there are permanent supportive housing beds or units. A ratio greater than 1.0 would indicate that the region has more permanent supportive housing beds or units than individuals or families who are currently homeless.
Statewide, the level of effort ratio is 0.19 for housing for individuals and 0.07 for housing for families. This means that Florida has 19 permanent supportive housing individual beds for every 100 homeless individuals and seven permanent supportive housing family units for every 100 homeless families.

13
Table 4.1. Transitional and Permanent Housing Supply by Region, 2012
Coalition Counties
Individuals Families
Transitional Housing
Beds
Permanent Supportive
Housing Beds
Permanent Supportive
Housing Level of Effort
Transitional Housing
Units
Permanent Supportive
Housing Units
Permanent Supportive
Housing Level of Effort
Big Bend
Leon, Franklin, Gadsden, Liberty, Madison, Taylor, Jefferson, Wakulla 279 236 0.30 46 79 0.11
Brevard Brevard 250 57 0.04 115 57 0.06 Broward Broward 1,007 743 0.27 125 342 0.43
Central Florida
Orange, Osceola, Seminole 789 814 0.25 246 29 0.01
Charlotte Charlotte 94 75 0.12 40 1 0.00 Collier Collier 73 48 0.11 13 10 0.02
EscaRosa Escambia, Santa Rosa 403 347 0.35 38 0 0.00
Heartland
Desoto, Glades, Hardee, Hendry, Highlands, Okeechobee 23 46 0.06 38 8 0.01
Hillsborough Hillsborough 455 539 0.11 103 135 0.06
Jacksonville Duval, Clay, Nassau 418 735 0.29 192 232 0.20
Lee Lee 248 96 0.13 4 200 0.38 Marion Marion 68 13 0.01 21 36 0.04 Miami-Dade Miami-Dade 911 2,016 0.69 241 784 0.37
Mid-Florida
Citrus, Hernando, Lake, Sumter 166 57 0.03 24 16 0.01
Monroe Monroe 142 162 0.20 14 14 0.09
North Central
Alachua, Putnam, Bradford, Levy, Gilchrist 136 365 0.22 51 31 0.04
NW Florida
Bay, Calhoun, Gulf, Holmes, Jackson, Washington 94 59 0.14 41 0 0.00
Okaloosa/ Walton
Okaloosa, Walton 139 75 0.07 52 0 0.00
Palm Beach Palm Beach 271 433 0.24 49 170 0.29

14
Coalition Counties
Individuals Families
Transitional Housing
Beds
Permanent Supportive
Housing Beds
Permanent Supportive
Housing Level of Effort
Transitional Housing
Units
Permanent Supportive
Housing Units
Permanent Supportive
Housing Level of Effort
Pasco Pasco 44 34 0.03 0 53 0.04 Pinellas Pinellas 667 641 0.20 83 16 0.01 Polk and Tri-County Polk 117 96 0.10 26 31 0.03 St. Johns St. Johns 18 41 0.04 62 0 0.00
Suncoast Manatee, Sarasota 186 191 0.20 50 1 0.00
Suwannee
Columbia, Hamilton, Lafayette, Suwannee 43 11 0.01 2 0 0.00
Treasure Coast
Indian River, Martin, St. Lucie 12 183 0.19 38 69 0.14
Volusia/ Flagler
Volusia, Flagler 180 157 0.07 75 21 0.02
Total 7,233 8,270 0.19 1,789 2,335 0.07 Sources: U.S. Department of Housing and Urban Development, 2012 Point-in-Time Estimates of Homelessness: Volume I of the 2012 Annual Homeless Assessment Report, December 2012. https://www.onecpd.info/resource/2753/2012-pit-estimates-of-homelessness-volume-1-2012-ahar. Shimberg Center for Housing Studies, Assisted Housing Inventory.

15
5. Data Limitations
Both sources of data on homeless individuals and families contain uncertainty. The point-in-time counts are difficult to perform accurately, particularly as coalitions attempt to identify unsheltered populations. Factors such as the weather on the day of the count and the coalitions’ familiarity with the locations most likely occupied by unsheltered persons affect the accuracy of the count.
For the FDOE data, only students whose homeless status is known by school districts’ homeless liaisons are included. Many students and their parents may not report their status because they are unaware of the services that could be available to them or because of the stigma attached to homelessness. Moreover, the student data include only children enrolled in school. This excludes children who are too young to attend school, as well as school age children who have dropped out or otherwise stopped attending school. The exclusion of young children and others not in school will result in underestimates of families with children for two reasons. First, households with only young children or others not enrolled in school are not counted at all. Second, the national average of 1.86 children per family includes both school age and younger children; a separate average for school age children is not available. Therefore, the average number of students per family is likely lower. That is, in the Families= (Students * Percentage of students in families)/(Students per family) equation, reducing the denominator (students per family) would result in higher family counts.
Because they are based on counts of actual beds provided by local agencies, the supply estimates in the Continuum of Care plans are more precise. It is likely that Table 4.1 above includes most if not all of the state’s supply of transitional housing and permanent supportive housing. However, the supply data does not include housing for homeless persons other than the transitional and permanent supportive housing beds reserved specifically for them, such as the state’s general supply of public and assisted housing. Units funded by Florida Housing’s Link Initiative for special needs households are not included unless the development also is listed in the Assisted Housing Inventory with “homeless” as a target demographic.
Finally, housing facilities serving homeless persons often are directed toward a specific population. These facilities and their services may not be appropriate for other populations. For example, a supportive housing facility for single adults with HIV/AIDS is not interchangeable with a facility for youth aging out of foster care, but both would be counted in the general supply of housing for homeless individuals. Therefore, the aggregate supply numbers mask the need for a number of types of facilities matching the different types of services needed by homeless individuals and families.
16
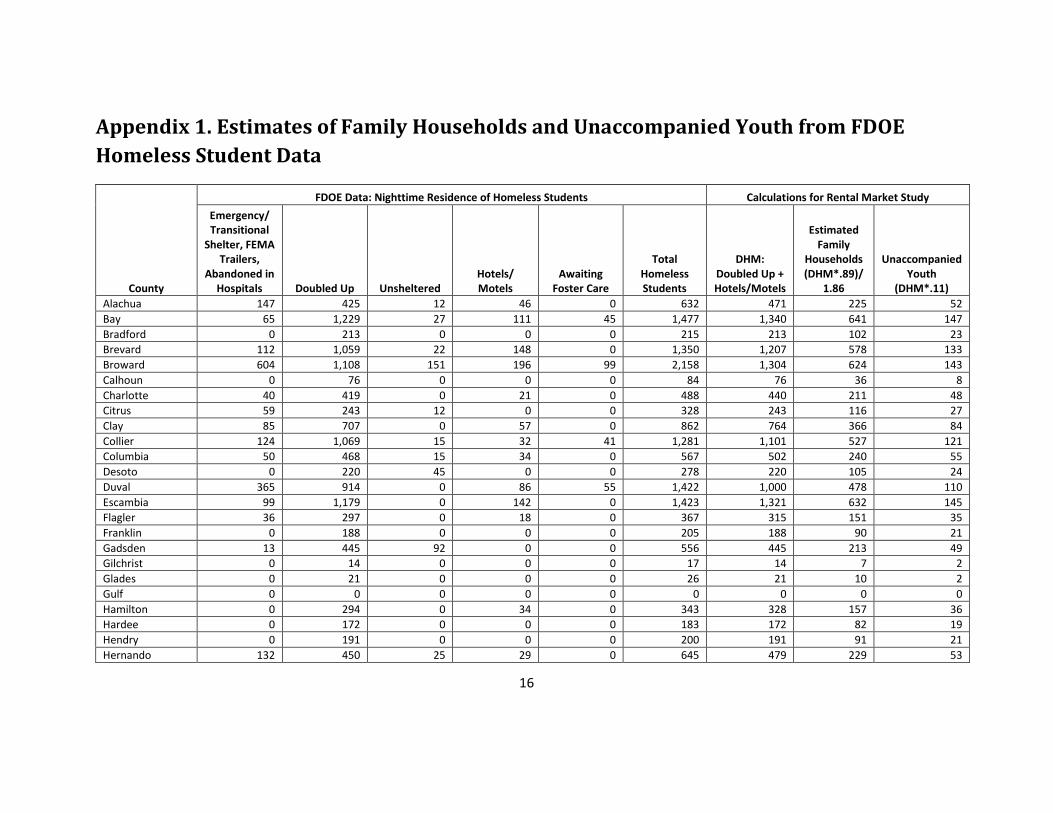
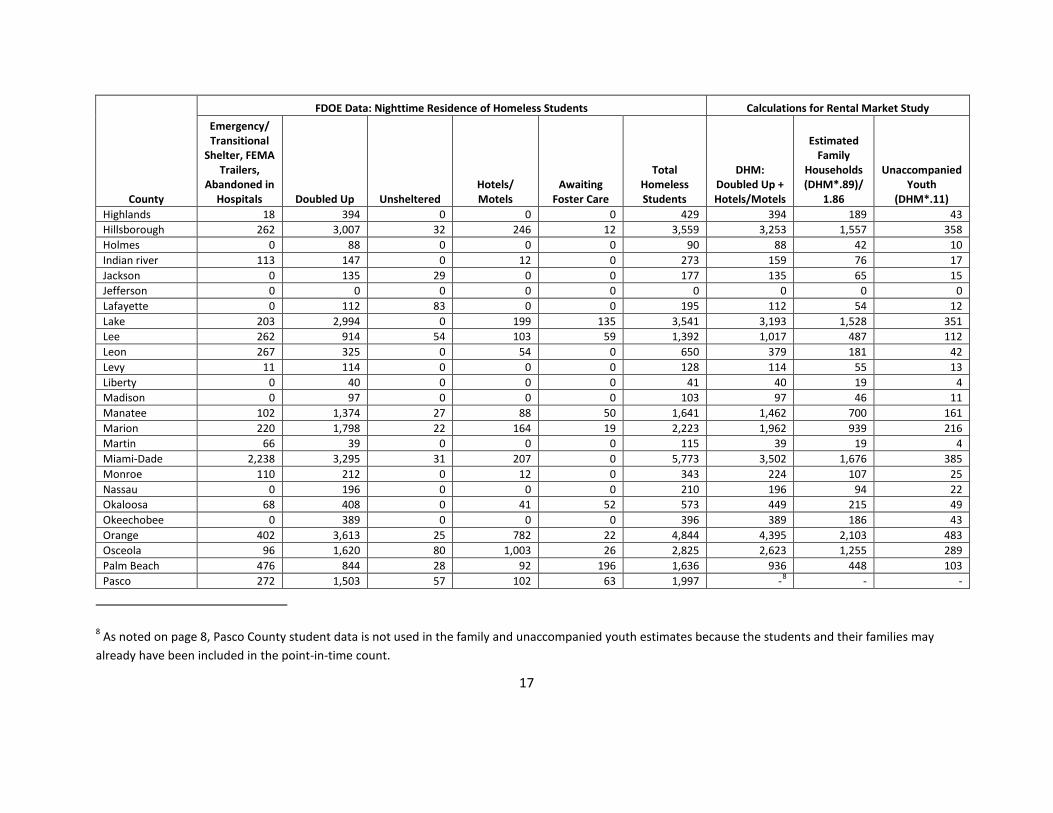
Appendix 1. Estimates of Family Households and Unaccompanied Youth from FDOE Homeless Student Data
County
FDOE Data: Nighttime Residence of Homeless Students Calculations for Rental Market Study Emergency/ Transitional
Shelter, FEMA Trailers,
Abandoned in Hospitals Doubled Up Unsheltered
Hotels/ Motels
Awaiting Foster Care
Total Homeless Students
DHM: Doubled Up + Hotels/Motels
Estimated Family
Households (DHM*.89)/
1.86
Unaccompanied Youth
(DHM*.11) Alachua 147 425 12 46 0 632 471 225 52 Bay 65 1,229 27 111 45 1,477 1,340 641 147 Bradford 0 213 0 0 0 215 213 102 23 Brevard 112 1,059 22 148 0 1,350 1,207 578 133 Broward 604 1,108 151 196 99 2,158 1,304 624 143 Calhoun 0 76 0 0 0 84 76 36 8 Charlotte 40 419 0 21 0 488 440 211 48 Citrus 59 243 12 0 0 328 243 116 27 Clay 85 707 0 57 0 862 764 366 84 Collier 124 1,069 15 32 41 1,281 1,101 527 121 Columbia 50 468 15 34 0 567 502 240 55 Desoto 0 220 45 0 0 278 220 105 24 Duval 365 914 0 86 55 1,422 1,000 478 110 Escambia 99 1,179 0 142 0 1,423 1,321 632 145 Flagler 36 297 0 18 0 367 315 151 35 Franklin 0 188 0 0 0 205 188 90 21 Gadsden 13 445 92 0 0 556 445 213 49 Gilchrist 0 14 0 0 0 17 14 7 2 Glades 0 21 0 0 0 26 21 10 2 Gulf 0 0 0 0 0 0 0 0 0 Hamilton 0 294 0 34 0 343 328 157 36 Hardee 0 172 0 0 0 183 172 82 19 Hendry 0 191 0 0 0 200 191 91 21 Hernando 132 450 25 29 0 645 479 229 53
17
County
FDOE Data: Nighttime Residence of Homeless Students Calculations for Rental Market Study Emergency/ Transitional
Shelter, FEMA Trailers,
Abandoned in Hospitals Doubled Up Unsheltered
Hotels/ Motels
Awaiting Foster Care
Total Homeless Students
DHM: Doubled Up + Hotels/Motels
Estimated Family
Households (DHM*.89)/
1.86
Unaccompanied Youth
(DHM*.11) Highlands 18 394 0 0 0 429 394 189 43 Hillsborough 262 3,007 32 246 12 3,559 3,253 1,557 358 Holmes 0 88 0 0 0 90 88 42 10 Indian river 113 147 0 12 0 273 159 76 17 Jackson 0 135 29 0 0 177 135 65 15 Jefferson 0 0 0 0 0 0 0 0 0 Lafayette 0 112 83 0 0 195 112 54 12 Lake 203 2,994 0 199 135 3,541 3,193 1,528 351 Lee 262 914 54 103 59 1,392 1,017 487 112 Leon 267 325 0 54 0 650 379 181 42 Levy 11 114 0 0 0 128 114 55 13 Liberty 0 40 0 0 0 41 40 19 4 Madison 0 97 0 0 0 103 97 46 11 Manatee 102 1,374 27 88 50 1,641 1,462 700 161 Marion 220 1,798 22 164 19 2,223 1,962 939 216 Martin 66 39 0 0 0 115 39 19 4 Miami-Dade 2,238 3,295 31 207 0 5,773 3,502 1,676 385 Monroe 110 212 0 12 0 343 224 107 25 Nassau 0 196 0 0 0 210 196 94 22 Okaloosa 68 408 0 41 52 573 449 215 49 Okeechobee 0 389 0 0 0 396 389 186 43 Orange 402 3,613 25 782 22 4,844 4,395 2,103 483 Osceola 96 1,620 80 1,003 26 2,825 2,623 1,255 289 Palm Beach 476 844 28 92 196 1,636 936 448 103 Pasco 272 1,503 57 102 63 1,997 -8 - -
8 As noted on page 8, Pasco County student data is not used in the family and unaccompanied youth estimates because the students and their families may already have been included in the point-in-time count.

18
County
FDOE Data: Nighttime Residence of Homeless Students Calculations for Rental Market Study Emergency/ Transitional
Shelter, FEMA Trailers,
Abandoned in Hospitals Doubled Up Unsheltered
Hotels/ Motels
Awaiting Foster Care
Total Homeless Students
DHM: Doubled Up + Hotels/Motels
Estimated Family
Households (DHM*.89)/
1.86
Unaccompanied Youth
(DHM*.11) Pinellas 410 2,277 43 313 42 3,085 2,590 1,239 285 Polk 258 1,608 212 205 21 2,304 1,813 868 199 Lake Wales Charter (Polk) 13 96 12 0 0 136 96 46 11 Putnam 56 771 34 23 0 885 794 380 87 St. Johns 69 413 49 51 0 584 464 222 51 St. Lucie 48 227 14 32 0 324 259 124 28 Santa Rosa 52 1,484 33 22 60 1,651 1,506 721 166 Sarasota 151 546 0 56 121 877 602 288 66 Seminole 77 1,527 20 235 0 1,865 1,762 843 194 Sumter 0 141 0 0 0 155 141 67 16 Suwannee 11 317 0 0 0 346 317 152 35 Taylor 0 80 0 0 0 96 80 38 9 Volusia 173 1,830 23 179 23 2,228 2,009 961 221 Wakulla 0 88 0 0 0 99 88 42 10 Walton 0 149 16 0 0 175 149 71 16 Washington 0 73 0 0 0 79 73 35 8 Total 8,435 46,686 1,340 5,175 1,141 63,150 51,861 24,815 5,705
Source: Florida Department of Education, Bureau of Student Assistance, Homeless Students Identified in Florida, 2011-2012, http://www.fldoe.org/bsa/title1/pdf/1112HomelessStudentsCount.pdf. A small number of students from Baker, Dixie and Union Counties are excluded because these counties are not part of Continuum of Care plan regions. Cell values below 11 were suppressed in the original DOE data.