Embed Size (px)
Citation preview

LOCAL GOVERNMENT ENERGY AUDIT PROGRAM: ENERGY AUDIT REPORT
PREPARED FOR: EAST ORANGE SCHOOL DISTRICT
199 FOURTH AVENUE EAST ORANGE, NJ 07017 ATTN: CRAIG SMITH ACTING ASSISTANT BUSINESS
ADMINISTRATOR
PREPARED BY: CONCORD ENGINEERING GROUP
520 S. BURNT MILL ROAD
VOORHEES, NJ 08043 TELEPHONE: (856) 427-0200
FACSIMILE: (856) 427-6529 WWW.CONCORD-ENGINEERING.COM
CEG CONTACT: KEVIN BLANKENBUEHLER, CEM
DIRECTOR, ENERGY SERVICES EMAIL: [email protected]
REPORT ISSUANCE: FINAL, AUGUST 31, 2015
PROJECT NO: 1C15143

East Orange School District Executive Energy Report
Concord Engineering 1C15143 August 31, 2015 – FINAL Page 1 of 53
TABLE OF CONTENTS
I. EXECUTIVE SUMMARY ................................................................................................. 4
II. INTRODUCTION ............................................................................................................... 9
III. METHOD OF ANALYSIS................................................................................................ 12
IV. HISTORIC ENERGY CONSUMPTION/COST ............................................................... 14
A. ENERGY USAGE ...................................................................................................................................... 14
B. ENERGY USE INDEX (EUI) ...................................................................................................................... 20
C. EPA ENERGY BENCHMARKING SYSTEM ................................................................................................. 23
V. RENEWABLE/DISTRIBUTED ENERGY MEASURES ................................................ 26
VI. ENERGY PURCHASING AND PROCUREMENT STRATEGY .................................. 33
VII. INSTALLATION FUNDING OPTIONS.......................................................................... 45
A. INCENTIVE PROGRAMS:........................................................................................................................... 45
B. FINANCING OPTIONS: .............................................................................................................................. 50
VIII. ENERGY AUDIT ASSUMPTIONS ................................................................................. 53
Enclosures:
Document 1 – Hart Complex Energy Report
Document 2 – Cicely Tyson Middle & High School Energy Report
Document 3 – Langston Hughes Elementary School Energy Report
Document 4 – Dionne Warwick Institute Energy Report
Document 5 – STEM Academy Energy Report
Document 6 – Robeson Stadium Energy Report
Document 7 – Whitney Houston Academy Energy Report
Document 8 – Ecole T. Louverture School Energy Report
Document 9 – Gordon Parks Academy Energy Report
Document 10 – Edmonson High School Energy Report
Document 11 – Carver Annex Energy Report
Document 12 – Althea Gibson Academy Energy Report

East Orange School District Executive Energy Report
Concord Engineering 1C15143 August 31, 2015 – FINAL Page 2 of 53
Document 13 – Mildred Barry Garvin School Energy Report
Document 14 – Edward Bowser Elementary School Energy Report
Document 15 – Benjamin Banneker Academy Energy Report
Document 16 – EOSD Central Office Energy Report
Document 17 – East Orange Campus High School Energy Report
Document 18 – Johnnie Cochran Academy Energy Report
Document 19 – Carver Institute Energy Report
Document 20 – Jackson Academy Energy Report
Document 21 – Cicely Tyson Elementary School Energy Report
Document 22 – Wahlstrom Academy Energy Report

East Orange School District Executive Energy Report
Concord Engineering 1C15143 August 31, 2015 – FINAL Page 3 of 53
REPORT DISCLAIMER
The information contained within this report, including any attachment(s), is intended solely for use by the named addressee(s). If you are not the intended recipient, or a person designated as responsible for delivering such messages to the intended recipient, you are not authorized to disclose, copy, distribute or retain this report, in whole or in part, without written authorization from Concord Engineering Group, Inc., 520 S. Burnt Mill Road, Voorhees, NJ 08043.
This report may contain proprietary, confidential or privileged information. If you have received this report in error, please notify the sender immediately. Thank you for your anticipated cooperation.

East Orange School District Executive Energy Report
Concord Engineering 1C15143 August 31, 2015 – FINAL Page 4 of 53
I. EXECUTIVE SUMMARY
This report presents the findings of the energy audit conducted for:
Entity: East Orange School District
Facilities: 22 District Facilities 2,104,289 square-feet
Contact Person: Mr. Craig Smith
Acting Assistant School Business Administrator
This audit is performed in connection with the New Jersey Clean Energy - Local Government Energy Audit Program for the East Orange School District. The purpose of this analysis is to provide the owner insight into the energy savings potential that exists within the facilities. Energy Efficiency changes and upgrades require support from the building occupants, operations personnel, and the administrators of the building in order to maximize the savings and overall benefit. The efficiency improvement of public buildings provides a benefit for the environment and the residents of New Jersey. The Energy Conservation Measures (ECMs) identified within the reports represent the potential annual savings at each facility. It is recommended the owner consider all ECMs as part of an initiative to save energy, reduce emissions, and lower operating costs. The owner should review and be familiar with all measures presented in the reports prior to making a decision on which projects to move forward with.

East Orange School District Executive Energy Report
Concord Engineering 1C15143 August 31, 2015 – FINAL Page 5 of 53
Overall Assessment: Overall, the District’s many facilities vary in overall building energy efficiency from excellent to below average. The District’s overall cost per square-foot for energy is $2.31 above industry standard typical costs of $2.00 per square-foot, and while this is not a definitive metric of energy inefficiency it does provide guidance on facilities that are more energy cost intensive and likely have energy efficiency opportunities. The report outlines many recommendations across the District facilities audited, which in totality could result in an energy cost reduction of nearly 25%. It is recommended the District take a hard look at the facilities with aging systems that are in need of replacement as priorities in developing an overall energy project strategy. Facilities in this type of condition are usually the most energy intensive and the implementation of energy improvements will provide the most benefit over the long term. On the whole, Concord Engineering recommends the District review and be familiar with all measures presented in each facility report prior to making a decision on which projects to move forward with. This will enable the District to effectively align report recommendations with those outlined in their mid/long range facility plans and financial plans. The District should also review all conventional and unconventional funding options, along with all NJCEP funding opportunities for these projects and determine which options fit their budget most positively in the short and long term. The combination of this information will enable the District to put together an effective Energy Savings Improvement Strategy that maximizes the received benefits of the selected projects. The Installation and Funding Options Section further outlines what programs are potentially available to the District for funding the project. Concord has outlined below a combined project summary summing up all of the proposed projects for all audited facilities for consideration by the District.

East Orange School District Executive Energy Report
Concord Engineering 1C15143 August 31, 2015 – FINAL Page 6 of 53
Table 1 Combined Energy Conservation Project Summary
COMBINED POTENTIAL ENERGY EFFICIENCY PROJECT
FACILITY ENERGY
EFFICIENCY PROJECTS
ANNUAL ENERGY SAVINGS
($)
PROJECT COST ($)
SMART START
INCENTIVES
CUSTOMER COST
SIMPLE PAYBACK
Hart Complex $182,963 $3,521,076 $109,420 $3,411,656 18.6
Cicely L. Tyson Middle & High School
$26,713 $307,140 $32,995 $274,145 10.3
Langston Hughes Elementary
$22,557 $282,809 $17,915 $264,894 11.7
Dionne Warwick Institute
$105,112 $1,160,761 $16,705 $1,144,056 10.9
STEM Academy $48,554 $761,444 $98,722 $662,722 13.6
Robeson Stadium $4,693 $88,619 $4,558 $84,061 17.9
Whitney Houston Academy
$75,764 $714,445 $8,820 $705,625 9.3
Ecole T. Louverture School
$39,955 $116,720 $7,650 $109,070 2.7
Gordon Parks Academy
$118,498 $540,923 $9,875 $531,048 4.5
Edmonson High School
$13,714 $220,946 $9,287 $211,659 15.4
Carver Annex $4,166 $47,363 $2,325 $45,038 10.8
Althea Gibson Academy
$15,459 $301,515 $9,098 $292,417 18.9
Mildred Barry Garvin School
$14,735 $145,197 $19,405 $125,792 8.5
Edward Bowser Elementary School
$71,707 $1,223,988 $72,395 $1,151,593 16.1
Benjamin Banneker Academy
$21,449 $215,483 $17,690 $197,793 9.2
EOSD Central Office $7,828 $54,434 $6,735 $47,699 6.1

East Orange School District Executive Energy Report
Concord Engineering 1C15143 August 31, 2015 – FINAL Page 7 of 53
COMBINED POTENTIAL ENERGY EFFICIENCY PROJECT
FACILITY ENERGY
EFFICIENCY PROJECTS
ANNUAL ENERGY SAVINGS
($)
PROJECT COST ($)
SMART START
INCENTIVES
CUSTOMER COST
SIMPLE PAYBACK
East Orange Campus High School
$76,670 $2,442,850 $111,582 $2,331,268 30.4
Johnnie Cochran Academy
$10,332 $172,121 $6,945 $165,176 16.0
Carver Institute $93,865 $988,485 $31,670 $956,815 10.2
Jackson Academy $16,792 $690,460 $16,960 $673,500 40.1
Cicely Tyson Elementary
$12,186 $173,303 $13,285 $160,018 13.1
Wahlstrom Academy $13,700 $283,760 $12,840 $270,920 19.8
Total Entity Project $997,414 $14,453,837 $636,877 $13,816,960 13.9
Total Entity Energy Costs: $4,332,837
Est. Total Entity Energy Savings: $997,414
Overall Percent Cost Reduction: 23.0%
Other Considerations: Renewable Energy Conservation Measures: Renewable Energy Measures (REMs) were also reviewed for implementation at East Orange School District Facilities. The District has potential for solar installations at some of its facilities with a total estimated capacity of 1,348 kWDC. Further details regarding the District’s solar potential is outlined in the Renewable Energy section and each facility report. The potential for wind generation was also reviewed for the District; however based on historical wind speed data, make it not a viable option. Energy Procurement Recommendations: The District is currently contracted with a third party supplier for electric and natural gas through the ACES Agreement, Concord Engineering recommends they continue to purchase their electric and natural gas commodity through a third party supplier once the current contract has expired.

East Orange School District Executive Energy Report
Concord Engineering 1C15143 August 31, 2015 – FINAL Page 8 of 53
Furthermore Concord strongly recommends the district look into a 3rd party utility bill auditing consultant that can review both electric, gas, fuel oil, water, sewer, telephone, cable, and other services for missed, incorrect, and/or incomplete billings. These services can typically be performed on a shared savings payment structure, meaning no out of pocket costs for the District. Maintenance and Operational Recommendations: In addition to the ECMs and REMs, there are maintenance and operational measures that can provide significant energy savings and provide immediate benefit, many of which the owner are already performing. The ECMs listed above represent investments that can be made to the facility which are justified by the savings seen over time. However, the maintenance items and small operational improvements below are typically achievable with on-site staff or maintenance contractors and in turn have the potential to provide substantial operational savings compared to the costs associated. The following are recommendations which should be considered a priority in achieving energy efficient buildings since they are low cost/no cost energy conservation measures that include good operation & maintenance practices. Further recommendations per building are provided in the individual building reports:
1. Chemically clean the condenser and evaporator coils periodically to optimize efficiency. Poorly maintained heat transfer surfaces can reduce efficiency 5-10%.
2. Maintain all weather stripping on windows and doors. 3. Clean all light fixtures to maximize light output. 4. Provide more frequent air filter changes to decrease overall system power usage and
maintain better IAQ. 5. Verify all control systems are utilizing setback and scheduling capabilities. 6. Replacement of older CRT style monitors with newer LCD/LED style monitors. Older
CRT style monitors use up to four times more energy than LCD/LED monitor types. 7. Educate staff and students on awareness of wasteful energy practices such as leaving
lights on unnecessarily, leaving on of non-essential computer and/or equipment at the end of the day, leaving of outside doors/windows open as a means to control room temperature, etc.

East Orange School District Executive Energy Report
Concord Engineering 1C15143 August 31, 2015 – FINAL Page 9 of 53
II. INTRODUCTION The comprehensive energy audit covers the following buildings in East Orange School District:
ENERGY AUDIT FACILITY SUMMARY
FACILITY AREA
(SQ-FT) ADDRESS
Hart Complex 320,888 Hamilton & N. Clinton Street
East Orange, NJ 07017
Cicely L. Tyson Middle & High School 287,000 35 Winans Street
East Orange, NJ 07017
Langston Hughes Elementary 101,805 160 Rhode Island Avenue
East Orange, NJ 07017
Dionne Warwick Institute 99,000 120 Central avenue
East orange, NJ 07017
STEM Academy 149,000 129 Renshaw Avenue East orange, NJ 07017
Robeson Stadium 17,461 215 N. Clinton Avenue East Orange, NJ 07017
Whitney Houston Academy 103,000 215 Dodd Street
East Orange, NJ 07017
Ecole T. Louverture School 60,000 290 Central Avenue
East Orange, NJ 07017
Gordon Parks Academy 50,000 99 Greenwood Avenue East Orange, NJ 07017
Edmonson High School 17,500 74 Halstead Street
East Orange, NJ 07017
Carver Annex 40,618 139 Glenwood Avenue East Orange, NJ 07017
Althea Gibson Academy 20,670 490 William Street
East Orange, NJ 07017
Mildred Barry Garvin School 75,853 1 Grove place
East Orange, NJ 07017
Edward Bowser Elementary School 100,000 180 Lincoln Street
East Orange, NJ 07017
Benjamin Banneker Academy 91,505 500 S. Clinton Street
East Orange, NJ 07017
EOSD Central Office 24,585 199 4th Avenue
East Orange, NJ 07017

East Orange School District Executive Energy Report
Concord Engineering 1C15143 August 31, 2015 – FINAL Page 10 of 53
ENERGY AUDIT FACILITY SUMMARY
FACILITY AREA
(SQ-FT) ADDRESS
East Orange Campus High School 231,664 344 Prospect Street
East Orange, NJ 07017
Johnnie Cochran Academy 50,000 190 Midland Avenue
East Orange, NJ 07017
Carver Institute 102,800 135 Glenwood Avenue East Orange, NJ 07017
Jackson Academy 35,300 106 Prospect Street
East Orange, NJ 07017
Cicely Tyson Elementary 85,640 45 N. Arlington Avenue East Orange, NJ 07017
Wahlstrom Academy 40,000 340 Propsect Street
East Orange, NJ 07017
This audit is performed in connection with the New Jersey Clean Energy - Local Government Energy Audit Program. The energy audit is conducted to promote the mission of the office of Clean Energy, which is to use innovation and technology to solve energy and environmental problems in a way that improves the State’s economy. This can be achieved through the wiser and more efficient use of energy. Electrical and natural gas utility information is collected and analyzed for one full year’s energy use of each building. The utility information allows for analysis of the building’s operational characteristics; calculate energy benchmarks for comparison to industry averages, estimated savings potential, and baseline usage/cost to monitor the effectiveness of implemented measures. A computer spreadsheet is used to calculate benchmarks and to graph utility information (see the utility profiles below). The Energy Use Index (EUI) is established for the building. Energy Use Index (EUI) is expressed in British Thermal Units/square foot/year (BTU/ft2/yr), which is used to compare energy consumption to similar building types or to track consumption from year to year in the same building. The EUI is calculated by converting the annual consumption of all energy sources to BTU’s and dividing by the area (gross square footage) of the building. Blueprints (where available) are utilized to verify the gross area of the facility. The EUI is a good indicator of the relative potential for energy savings. A low EUI indicates less potential for energy savings, while a high EUI indicates poor building performance therefore a high potential for energy savings. Existing building architectural and engineering drawings (where available) are utilized for additional background information. The building envelope, lighting systems, HVAC equipment,

East Orange School District Executive Energy Report
Concord Engineering 1C15143 August 31, 2015 – FINAL Page 11 of 53
and controls information gathered from building drawings allow for a more accurate and detailed review of the building. The information is compared to the energy usage profiles developed from utility data. Through the review of the architectural and engineering drawings a building profile can be defined that documents building age, type, usage, major energy consuming equipment or systems, etc. The preliminary audit information is gathered in preparation for the site survey. The site survey provides critical information in deciphering where energy is spent and opportunities exist within a facility. The entire site is surveyed to inventory the following to gain an understanding of how each facility operates:
Building envelope (roof, windows, etc.) Heating, ventilation, and air conditioning equipment (HVAC) Lighting systems and controls Facility-specific equipment
The building site visit is performed to survey all major building components and systems. The site visit includes detailed inspection of energy consuming components. Summary of building occupancy schedules, operating and maintenance practices, and energy management programs provided by the building manager are collected along with the system and components to determine a more accurate impact on energy consumption.

East Orange School District Executive Energy Report
Concord Engineering 1C15143 August 31, 2015 – FINAL Page 12 of 53
III. METHOD OF ANALYSIS
This audit is consistent with an ASHRAE level 2 audit. The cost and savings for each measure is ± 20%. The evaluations are based on engineering estimations and industry standard calculation methods. More detailed analyses would require engineering simulation models, hard equipment specifications, and contractor bid pricing. Post site visit work includes evaluation of the information gathered, researching possible conservation opportunities, organizing the audit into a comprehensive report, and making recommendations on HVAC, lighting and building envelope improvements. Data collected is processed using energy engineering calculations to anticipate energy usage for each of the proposed energy conservation measures (ECMs). The actual building’s energy usage is entered directly from the utility bills provided by the owner. The anticipated energy usage is compared to the historical data to determine energy savings for the proposed ECMs. It is pertinent to note, that the savings noted in this report are not additive. The savings for each recommendation is calculated as standalone energy conservation measures. Implementation of more than one ECM may in some cases affect the savings of each ECM. The savings may in some cases be relatively higher if an individual ECM is implemented in lieu of multiple recommended ECMs. For example implementing reduced operating schedules for inefficient lighting will result in a greater relative savings. Implementing reduced operating schedules for newly installed efficient lighting will result in a lower relative savings, because there is less energy to be saved. The project / Entity summary tables are based on the implementation of multiple measures. The analysis is reviewed and determined if the nature of the ECMs will cause a major conflict of the overall savings. When additive measures do not cause a major effect on the overall savings the ECMs are included. Where a major conflict is identified, the combined savings is evaluated appropriately to ensure the overall estimates are ± 20%. ECMs are determined by identifying the building’s unique properties and deciphering the most beneficial energy saving measures available that meet the specific needs of the facility. The building construction type, function, operational schedule, existing conditions, and foreseen future plans are critical in the evaluation and final recommendations. Energy savings are calculated based on industry standard methods and engineering estimations. Energy consumption is calculated based on manufacturer’s cataloged information when new equipment is proposed. Cost savings are calculated based on the actual historical energy costs for the facility. Installation costs include labor and equipment costs to estimate the full up-front investment required to implement a change. Costs are derived from Means Cost Data, industry publications, and local contractors and equipment suppliers. The NJ Smart Start Building® program incentives savings (where applicable) are included for the appropriate ECM’s and subtracted from the installed cost. Maintenance savings are calculated where applicable and added to the energy savings for each ECM. The life-time for each ECM is estimated based on the typical life of the equipment being replaced or altered. The costs and savings are applied and a simple payback, simple lifetime savings, and simple return on investment are calculated. See below for calculation methods:

East Orange School District Executive Energy Report
Concord Engineering 1C15143 August 31, 2015 – FINAL Page 13 of 53
ECM Calculation Equations:
SimplePaybackNetCost
YearlySavings
SimpleLifetimeSavings YearlySavings ECMLifetime
SimpleLifetimeReturnonInvestment ROI SimpleLifetimeSavings NetCost
NetCost
LifetimeMaintenanceSavings YearlyMaintenanceSavings ECMLifetime
NetPresentValue CashFlowofPeriod
1 DR
InternalRateofReturn IRR → NetPresentValue 0 CashFlowofPeriod
1 IRR
Net Present Value calculations are based on Discount Rate (DR) of 3%.

East Orange School District Executive Energy Report
Concord Engineering 1C15143 August 31, 2015 – FINAL Page 14 of 53
IV. HISTORIC ENERGY CONSUMPTION/COST A. Energy Usage The energy usage for the facilities is tabulated and plotted in graph form as depicted within each facility report (see the individual facility energy audit reports for details). Each energy source has been identified and monthly consumption and cost noted per the information provided by the Owner. The electric, natural gas, and fuel oil utilities are shown below in Table 2, 3, & 4 for all facilities:
Table 2 Electric Utility Summary
ELECTRIC UTILITY USAGE PER FACILITY
FACILITY ANNUAL ELECTRIC UTILITY
DESCRIPTION USAGE (KWH)
COST ($) AVE RATE
($/KWH)
Hart Complex 3,899,704 $513,116 $0.132
Cicely L. Tyson Middle & High School 2,667,981 $428,997 $0.161
Langston Hughes Elementary 1,248,340 $191,088 $0.153
Dionne Warwick Institute 310,154 $51,048 $0.165
STEM Academy 933,457 $142,942 $0.153
Robeson Stadium 326,889 $55,307 $0.169
Whitney Houston Academy 116,010 $19,311 $0.166
Ecole T. Louverture School 224,400 $37,379 $0.167
Gordon Parks Academy 219,690 $35,040 $0.159
Edmonson High School 215,940 $34,135 $0.158
Carver Annex 35,886 $6,196 $0.173

East Orange School District Executive Energy Report
Concord Engineering 1C15143 August 31, 2015 – FINAL Page 15 of 53
ELECTRIC UTILITY USAGE PER FACILITY
FACILITY ANNUAL ELECTRIC UTILITY
DESCRIPTION USAGE (KWH)
COST ($) AVE RATE
($/KWH)
Althea Gibson Academy 245,170 $41,615 $0.170
Mildred Barry Garvin School 1,084,800 $165,840 $0.153
Edward Bowser Elementary School 1,278,176 $182,192 $0.143
Benjamin Banneker Academy 1,136,400 $166,571 $0.147
EOSD Central Office 497,448 $68,611 $0.138
East Orange Campus High School 3,346,958 $487,507 $0.146
Johnnie Cochran Academy 177,760 $30,423 $0.171
Carver Institute 614,118 $98,855 $0.161
Jackson Academy 368,010 $57,074 $0.155
Cicely Tyson Elementary - - -
Wahlstrom Academy 406,560 $67,753 $0.167
Total 19,353,851 $2,881,002 $0.149
Note: Cicely Tyson Elementary School and Cicely Tyson Middle & High School share a single electric account.

East Orange School District Executive Energy Report
Concord Engineering 1C15143 August 31, 2015 – FINAL Page 16 of 53
Table 3 Natural Gas Summary
NATURAL GAS UTILTY USAGE PER FACILITY
FACILITY ANNUAL NATURAL GAS UTILITY
DESCRIPTION USAGE
(THERMS) COST ($)
AVE RATE ($/THERM)
Hart Complex 124,814 $103,734 $0.83
Cicely L. Tyson Middle & High School 120,389 $96,105 $0.80
Langston Hughes Elementary 63,618 $57,096 $0.90
Dionne Warwick Institute 1,977 $1,712 $0.87
STEM Academy 165,329 $149,965 $0.91
Robeson Stadium 15,594 $13,928 $0.89
Whitney Houston Academy 1,128 $1,196 $1.06
Ecole T. Louverture School 762 $788 $1.03
Gordon Parks Academy 1,531 $1,424 $0.93
Edmonson High School 12,086 $10,419 $0.86
Carver Annex 253 $331 $1.31
Althea Gibson Academy 15,753 $15,612 $0.99
Mildred Barry Garvin School 17,947 $16,239 $0.90
Edward Bowser Elementary School 42,691 $34,608 $0.81
Benjamin Banneker Academy 77,258 $62,311 $0.81

East Orange School District Executive Energy Report
Concord Engineering 1C15143 August 31, 2015 – FINAL Page 17 of 53
NATURAL GAS UTILTY USAGE PER FACILITY
FACILITY ANNUAL NATURAL GAS UTILITY
DESCRIPTION USAGE
(THERMS) COST ($)
AVE RATE ($/THERM)
EOSD Central Office 21,019 $17,676 $0.84
East Orange Campus High School 97,623 $77,993 $0.80
Johnnie Cochran Academy 29,042 $24,560 $0.85
Carver Institute 10,790 $10,258 $0.95
Jackson Academy 16,039 $14,360 $0.90
Cicely Tyson Elementary 46,509 $38,961 $0.84
Wahlstrom Academy 89,878 $73,539 $0.82
Total 972,032 $822,817 $0.85

East Orange School District Executive Energy Report
Concord Engineering 1C15143 August 31, 2015 – FINAL Page 18 of 53
Table 4 Fuel Oil Summary
#2 FUEL OIL UTILTY USAGE PER FACILITY
FACILITY ANNUAL #2 FUEL OIL UTILITY
DESCRIPTION USAGE
(GALLONS) COST ($)
AVE RATE ($/GALLON)
Hart Complex 0 $0 -
Cicely L. Tyson Middle & High School 0 $0 -
Langston Hughes Elementary 0 $0 -
Dionne Warwick Institute 47,692 $118,843 $2.49
STEM Academy 0 $0 -
Robeson Stadium 0 $0 -
Whitney Houston Academy 54,620 $124,803 $2.28
Ecole T. Louverture School 36,124 $82,554 $2.29
Gordon Parks Academy 47,716 $129,665 $2.72
Edmonson High School 0 $0 -
Carver Annex 0 $0 -
Althea Gibson Academy 0 $0 -
Mildred Barry Garvin School 0 $0 -
Edward Bowser Elementary School 25,887 $57,945 $2.24
Benjamin Banneker Academy 0 $0 -

East Orange School District Executive Energy Report
Concord Engineering 1C15143 August 31, 2015 – FINAL Page 19 of 53
#2 FUEL OIL UTILTY USAGE PER FACILITY
FACILITY ANNUAL #2 FUEL OIL UTILITY
DESCRIPTION USAGE
(GALLONS) COST ($)
AVE RATE ($/GALLON)
EOSD Central Office 0 $0 -
East Orange Campus High School 0 $0 -
Johnnie Cochran Academy 0 $0 -
Carver Institute 49,904 $115,209 $2.31
Jackson Academy 0 $0 -
Cicely Tyson Elementary 0 $0 -
Wahlstrom Academy 0 $0 -
Total 261,942 $629,018 $2.40

East Orange School District Executive Energy Report
Concord Engineering 1C15143 August 31, 2015 – FINAL Page 20 of 53
B. Energy Use Index (EUI) Energy Use Index (EUI) is a measure of a building’s annual energy utilization per square foot of building. This calculation is completed by converting all utility usage consumed by a building for one year, to British Thermal Units (BTU) and dividing this number by the building square footage. EUI is a good measure of a building’s energy use and is utilized regularly for comparison of energy performance for similar building types. The Oak Ridge National Laboratory (ORNL) Buildings Technology Center under a contract with the U.S. Department of Energy maintains a Benchmarking Building Energy Performance Program. The ORNL website determines how a building’s energy use compares with similar facilities throughout the U.S. and in a specific region or state. Source use differs from site usage when comparing a building’s energy consumption with the national average. Site energy use is the energy consumed by the building at the building site only. Source energy use includes the site energy use as well as all of the losses to create and distribute the energy to the building. Source energy represents the total amount of raw fuel that is required to operate the building. It incorporates all transmission, delivery, and production losses, which allows for a complete assessment of energy efficiency in a building. The type of utility purchased has a substantial impact on the source energy use of a building. The EPA has determined that source energy is the most comparable unit for evaluation purposes and overall global impact. Both the site and source EUI ratings for the building are provided to understand and compare the differences in energy use. The Energy Cost Index (ECI) can be used as another metric to assist in benchmarking a building’s energy performance. In instances where entities own multiply buildings the ECI can allow them to quickly compare energy costs between buildings based on a common unit. Facility’s with high costs per square-foot can alert the owner to the potential for energy efficiency improvements and/or warrant further investigation to determine why the costs are higher. The site and source EUI, and ECI for each facility is calculated as follows:
BuildingSiteEUIElectricUsageinkBtu FuelUsageinkBtu
BuildingSquareFootage
BuildingSourceEUIElectricUsageinkBtu SSRatio FuelUsageinkBtu SSRatio
BuildingSqaureFootage
BuildingECIElectricCost NaturalGasCost FuelOilCost PropaneCost
BuildingSquareFootage

East Orange School District Executive Energy Report
Concord Engineering 1C15143 August 31, 2015 – FINAL Page 21 of 53
Table 5 Energy Use Index Summary
ENERGY USE INDEX PER FACILITY
FACILITY BUILDING
AREA ENERGY USE INDEX
ENERGY COST
INDEX
DESCRIPTION (SF) SITE
(KBTU/SF /YR)
SOURCE (KBTU/SF
/YR) $/SF/YR
Hart Complex 320,888 80.4 171.0 $1.92
Cicely L. Tyson Middle & High School
278,000 76.1 148.3 $1.89
Langston Hughes Elementary 101,805 104.3 197.0 $2.44
Dionne Warwick Institute 99,000 80.1 103.8 $1.73
STEM Academy 149,000 132.3 183.6 $1.97
Robeson Stadium 17,461 153.2 294.3 $3.97
Whitney Houston Academy 103,000 79.2 88.2 $1.41
Ecole T. Louverture School 60,000 98.3 126.5 $2.01
Gordon Parks Academy 50,000 151.7 185.2 $3.32
Edmonson High School 17,500 111.2 204.7 $2.55
Carver Annex 40,618 3.6 10.1 $0.16
Althea Gibson Academy 20,670 116.7 207.1 $2.77
Mildred Barry Garvin School 75,853 72.5 178.1 $2.40
Edward Bowser Elementary School 100,000 122.5 218.4 $2.75
Benjamin Banneker Academy 91,505 126.8 221.7 $2.50

East Orange School District Executive Energy Report
Concord Engineering 1C15143 August 31, 2015 – FINAL Page 22 of 53
ENERGY USE INDEX PER FACILITY
FACILITY BUILDING
AREA ENERGY USE INDEX
ENERGY COST
INDEX
DESCRIPTION (SF) SITE
(KBTU/SF /YR)
SOURCE (KBTU/SF
/YR) $/SF/YR
EOSD Central Office 24,585 154.5 306.6 $3.51
East Orange Campus High School 231,664 91.4 199.0 $2.44
Johnnie Cochran Academy 50,000 70.2 99.1 $1.10
Carver Institute 102,800 98.8 143.7 $2.18
Jackson Academy 35,300 81.0 159.4 $2.02
Cicely Tyson Elementary 85,640 - - -
Wahlstrom Academy 40,000 259.4 344.8 $3.53
Total 2,095,289 107.8 180.5 $2.31
See the Appendix C - Statement of Energy Performance for comparison to other facilities Note: A further comparison of Site and Source EUI to Peer Group Comparison building data published by the Energy and Information Administration is provided in each individual building report. It should be cautioned that not all buildings perfectly match a Peer Group Comparison Type.

East Orange School District Executive Energy Report
Concord Engineering 1C15143 August 31, 2015 – FINAL Page 23 of 53
C. EPA Energy Benchmarking System The United States Environmental Protection Agency (EPA) in an effort to promote energy management has created a system for benchmarking energy use amongst various end users. The benchmarking tool utilized for this analysis is entitled Portfolio Manager. The Portfolio Manager tool allows tracking and assessment of energy consumption via the template forms located on the ENERGY STAR website (www.energystar.gov). The importance of benchmarking for local government municipalities is becoming more important as utility costs continue to increase and emphasis is being placed on carbon reduction, greenhouse gas emissions and other environmental impacts. Based on information gathered from the ENERGY STAR website, Government agencies spend more than $10 billion a year on energy to provide public services and meet constituent needs. Furthermore, energy use in commercial buildings and industrial facilities is responsible for more than 50 percent of U.S. carbon dioxide emissions. It is vital that local government municipalities assess facility energy usage, benchmark energy usage utilizing Portfolio Manager, set priorities and goals to lessen energy usage and move forward with priorities and goals. In accordance with the Local Government Energy Audit Program, CEG has created an ENERGY STAR account for the owner to access and monitoring the facility’s yearly energy usage as it compares to facilities of similar type. The login page for the account can be accessed at the following web address; the username and password are also listed below:
https://www.energystar.gov/istar/pmpam/index.cfm?fuseaction=login.login
Note: It is recommended the owner change the account password once the audit process is complete. The utility bills and other information gathered during the energy audit process are entered into the Portfolio Manager. The following is a summary of the results for the facility:
East Orange School District Executive Energy Report
Concord Engineering 1C15143 August 31, 2015 – FINAL Page 24 of 53
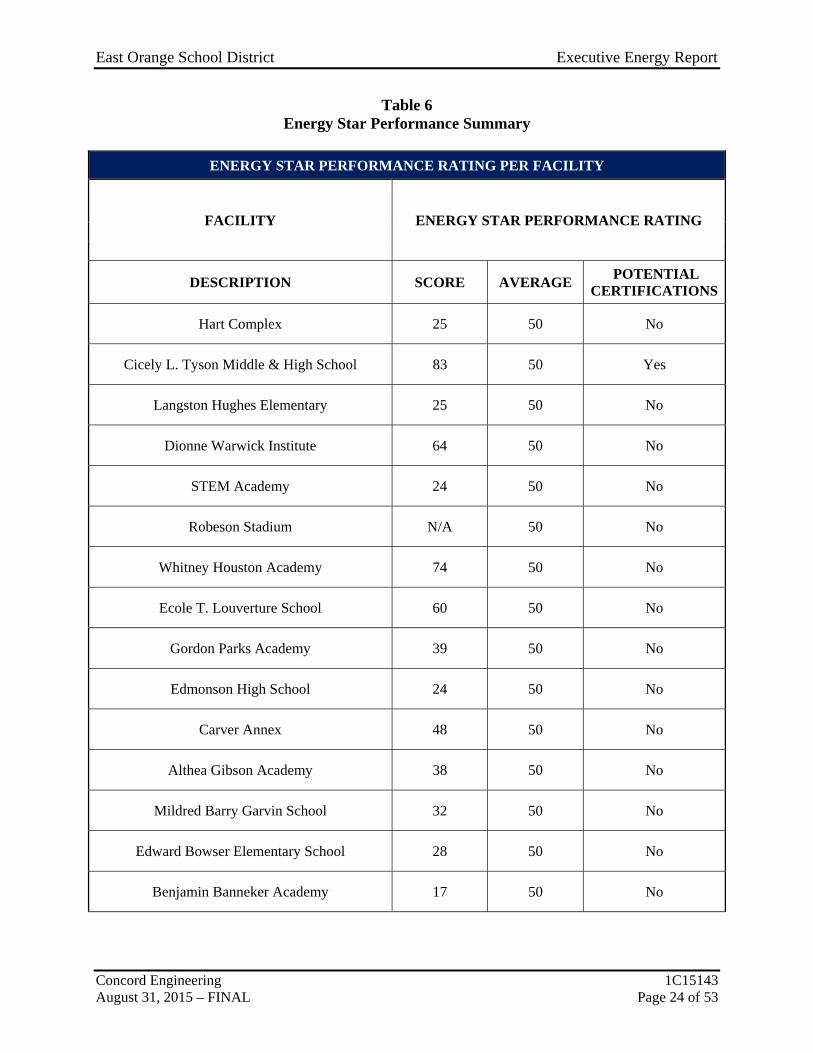
Table 6 Energy Star Performance Summary
ENERGY STAR PERFORMANCE RATING PER FACILITY
FACILITY ENERGY STAR PERFORMANCE RATING
DESCRIPTION SCORE AVERAGE POTENTIAL
CERTIFICATIONS
Hart Complex 25 50 No
Cicely L. Tyson Middle & High School 83 50 Yes
Langston Hughes Elementary 25 50 No
Dionne Warwick Institute 64 50 No
STEM Academy 24 50 No
Robeson Stadium N/A 50 No
Whitney Houston Academy 74 50 No
Ecole T. Louverture School 60 50 No
Gordon Parks Academy 39 50 No
Edmonson High School 24 50 No
Carver Annex 48 50 No
Althea Gibson Academy 38 50 No
Mildred Barry Garvin School 32 50 No
Edward Bowser Elementary School 28 50 No
Benjamin Banneker Academy 17 50 No

East Orange School District Executive Energy Report
Concord Engineering 1C15143 August 31, 2015 – FINAL Page 25 of 53
ENERGY STAR PERFORMANCE RATING PER FACILITY
FACILITY ENERGY STAR PERFORMANCE RATING
DESCRIPTION SCORE AVERAGE POTENTIAL
CERTIFICATIONS
EOSD Central Office 9 50 No
East Orange Campus High School 18 50 No
Johnnie Cochran Academy 78 50 Yes
Carver Institute 48 50 No
Jackson Academy 55 50 No
Cicely Tyson Elementary 83 50 Yes
Wahlstrom Academy 1 50 No
See the Appendix C - Statement of Energy Performance for comparative facilities Score: "N/A" represents facility that could not receive a rating. See Energy Star website for details.
Note: Cicely Tyson Elementary School and Cicely Tyson Middle & High School share a single electric account. Because of this, an individual Energy Star score could not be awarded. The score given to both facilities is based on a 2-building K-12 school with the combined total electric and gas usage of both facilities. Refer to Statement of Energy Performance Appendix for the detailed energy summary for each facility.

East Orange School District Executive Energy Report
Concord Engineering 1C15143 August 31, 2015 – FINAL Page 26 of 53
V. RENEWABLE/DISTRIBUTED ENERGY MEASURES Globally, renewable energy has become a priority affecting international and domestic energy policy. The State of New Jersey has taken a proactive approach, and has recently adopted in its Energy Master Plan a goal of 30% renewable energy by 2020. To help reach this goal New Jersey created the Office of Clean Energy under the direction of the Board of Public Utilities and instituted a Renewable Energy Incentive Program to provide additional funding to private and public entities for installing qualified renewable technologies. A renewable energy source can greatly reduce a building’s operating expenses while producing clean environmentally friendly energy. Solar Generation Solar energy produces clean energy and reduces a building’s carbon footprint. This is accomplished via photovoltaic panels which are mounted on all south and southwestern facades of the building. Flat roof, as well as sloped areas can be utilized; flat areas will have the panels turned to an optimum solar absorbing angle. (A structural survey of the roof would be necessary before the installation of PV panels is considered). Parking lots can also be utilized for the installation of a solar array. A truss system can be installed that is high enough to park vehicles under the array and no parking lot area is lost. The State of NJ has instituted a program in which one Solar Renewable Energy Certificate (SREC) is given to the Owner for every 1000 kWh of generation. SREC’s can be sold anytime on the market at their current market value. The value of the credit varies upon the current need of the power companies. The average value per credit used in our financial calculations is $191 per MWH. This equates to $0.191 per kWh generated. CEG has reviewed the existing roof, ground, and parking lot area potential of the facilities being audited for the purposes of determining a potential for a photovoltaic system. The facilities were evaluated for the most economical and feasible areas for the installation of solar arrays. It should be noted a structural analysis was not performed on the areas where roof systems were recommended. A depiction of the areas utilized at each facility is shown in Renewable / Distributed Energy Measures Calculation Appendix. The system sizes are shown below for each building where installation of a solar PV system is feasible. The total KWH production for all facilities combined is 1,586,947 kWh annually, reducing the overall utility bill for the District by approximately 8.2% percent. A detailed financial analysis can be found in the Renewable / Distributed Energy Measures Calculation Appendix within each facility report. This analysis illustrates the payback of the system over a 15 year period. The eventual degradation of the solar panels and the price of accumulated SREC’s are factored into the payback. Most of the facilities that were audited are good candidates for new solar PV systems (see Table 7 below).

East Orange School District Executive Energy Report
Concord Engineering 1C15143 August 31, 2015 – FINAL Page 27 of 53
Table 7 Renewable Energy Summary
POWER PRODUCTION SUMMARY - PHOTOVOLTAIC SYSTEM PER FACILITY
FACILITY PRODUCTION SUMMARY
DESCRIPTION SYSTEM
SIZE (KWDC)
ELECTRIC PRODUCTION
(KWH)
% REDUCTION
Hart Complex 415.20 486,879 12.5%
Cicely L. Tyson Middle & High School 117.84 138,183 5.2%
Langston Hughes Elementary 16.56 20,227 1.6%
Dionne Warwick Institute 53.28 62,478 20.1%
STEM Academy 111.60 130,512 14.0%
Robeson Stadium 0.00 0 0.0%
Whitney Houston Academy 25.20 29,640 25.5%
Ecole T. Louverture School 0.00 0 0.0%
Gordon Parks Academy 28.08 33,760 15.4%
Edmonson High School 41.04 48,125 22.3%
Carver Annex 0.00 0 0.0%
Althea Gibson Academy 0.00 0 0.0%
Mildred Barry Garvin School 135.36 162,740 15.0%
Edward Bowser Elementary School 82.32 96,531 7.6%
Benjamin Banneker Academy 0.00 0 0.0%

East Orange School District Executive Energy Report
Concord Engineering 1C15143 August 31, 2015 – FINAL Page 28 of 53
POWER PRODUCTION SUMMARY - PHOTOVOLTAIC SYSTEM PER FACILITY
FACILITY PRODUCTION SUMMARY
DESCRIPTION SYSTEM
SIZE (KWDC)
ELECTRIC PRODUCTION
(KWH)
% REDUCTION
EOSD Central Office 34.08 39,963 8.0%
East Orange Campus High School 0.00 0 0.0%
Johnnie Cochran Academy 15.84 19,044 10.7%
Carver Institute 154.08 180,680 29.4%
Jackson Academy 23.52 27,580 7.5%
Cicely Tyson Elementary 63.36 74,298 -
Wahlstrom Academy 30.96 36,305 8.9%
Total 1,348 1,586,947 8.2%
The proposed photovoltaic array layout is designed based on the specifications for the Sharp Model ND-240QCJ panel. This panel has a “DC” rated full load output of 240 watts, and has a total panel conversion efficiency of 14.4%. Although panels rated at higher wattages are available through Sharp and other various manufacturers, in general most manufacturers who produce commercially available solar panels produce a similar panel in the 200 to 250 watt range. This provides more manufacturer options to the public entity if they wish to pursue the proposed solar recommendation without losing significant system capacity. The array system capacity was sized based on available roof space, ground area, or parking canopy style system area available at each existing facility. Estimated solar array generation is calculated based on the National Renewable Energy Laboratory PVWatts Version 1.0 Calculator. In order to calculate the array generation an appropriate location with solar data on file must be selected. In addition the system DC rated kilowatt (kW) capacity must be inputted, a DC to AC de-rate factor, panel tilt angle, and array azimuth angle. The DC to AC de-rate factor is based on the panel nameplate DC rating, inverter and transformer efficiencies (95%), mismatch factor (98%), diodes and connections (100%), dc and ac wiring(98%, 99%), soiling, (95%), system availability (95%), shading (if applicable), and age(new/100%). The overall DC to AC de-rate factor has been calculated at an overall rating of 86%. The PVWatts Calculator program then

East Orange School District Executive Energy Report
Concord Engineering 1C15143 August 31, 2015 – FINAL Page 29 of 53
calculates estimated system generation based on average monthly solar irradiance and user provided inputs. The monthly energy generation and offset electric costs from the PVWatts calculator is shown in the Renewable/Distributed Energy Measures Calculation Appendix. The proposed solar array for each facility is qualified by the New Jersey Board of Public Utilities Net Metering Guidelines as a Class I Renewable Energy Source. These guidelines allow onsite customer generation using renewable energy sources such as solar and wind with a capacity of 2 megawatts (MW) or less. This limits a customer system design capacity to being a net user and not a net generator of electricity on an annual basis. Although these guidelines state that if a customer does net generate (produce more electricity than they use), the customer will be credited those kilowatt-hours generated to be carried over for future usage on a month to month basis. Then, on an annual basis if the customer is a net generator the customer will then be compensated by the utility the average annual PJM Grid LMP price per kilowatt-hour for the over generation. The PJM Interconnection uses a system called Locational Marginal Pricing (LMP) to establish the price of energy purchases or sales to the PJM wholesale electricity market. LMP takes into account the effect of actual operating conditions on the transmission system in determining the price of electricity at different locations in the PJM region. Due to the aforementioned legislation, the customer is at limited risk if they generate more than they use at times throughout the year. With the inefficiency of today’s energy storage systems, such as batteries, the added cost of storage systems is not warranted and was not considered in the proposed design. Direct purchase involves the District paying for 100% of the total project cost upfront in lieu of one of the methods noted in the Installation Funding Options section below. Calculations include a utility inflation rate as well as the degradation of the solar panels over time. The financial summary per facility is as follows: Total Savings from photovoltaic projects at the District facilities as calculated in the table above is defined as the first year’s kWh reduction by the system generating its own electricity plus the revenue from the “SREC”. This value obviously declines each year as the amount of electricity generated by the photovoltaic system declines and the value of the “SREC” also is assumed to decline. Internal Rate of Return (IRR) calculations are commonly used to evaluate the desirability of investments or energy projects. The higher an energy project’s IRR, the more desirable it is to undertake the project. The District should, in theory, undertake all energy projects or investments available with IRRs that exceed the cost of capital.

East Orange School District Executive Energy Report
Concord Engineering 1C15143 August 31, 2015 – FINAL Page 30 of 53
Table 8 Renewable Financial Summary
FINANCIAL SUMMARY - PHOTOVOLTAIC SYSTEM PER FACILITY
FACILITY DIRECT PURCHASE FINANCIAL SUMMARY
DESCRIPTION INSTALATION
COST ($)
TOTAL SAVINGS
($)
INTERNAL RATE OF RETURN
Hart Complex $1,746,268 $138,032 2.2%
Cicely L. Tyson Middle & High School $522,013 $43,183 2.8%
Langston Hughes Elementary $69,554 $6,159 3.8%
Dionne Warwick Institute $243,868 $19,775 6.4%
STEM Academy $552,039 $39,741 1.0%
Robeson Stadium $0 $0 0.0%
Whitney Houston Academy $118,957 $9,411 6.1%
Ecole T. Louverture School $7,680 $331 -5.0%
Gordon Parks Academy $131,962 $10,483 2.3%
Edmonson High School $189,875 $13,066 0.4%
Carver Annex $0 $0 0.0%
Althea Gibson Academy $0 $0 0.0%
Mildred Barry Garvin School $596,209 $49,067 2.8%
Edward Bowser Elementary School $370,094 $28,429 1.8%
Benjamin Banneker Academy $0 $0 0.0%

East Orange School District Executive Energy Report
Concord Engineering 1C15143 August 31, 2015 – FINAL Page 31 of 53
FINANCIAL SUMMARY - PHOTOVOLTAIC SYSTEM PER FACILITY
FACILITY DIRECT PURCHASE FINANCIAL SUMMARY
DESCRIPTION INSTALATION
COST ($)
TOTAL SAVINGS
($)
INTERNAL RATE OF RETURN
EOSD Central Office $158,886 $11,570 1.1%
East Orange Campus High School $0 $0 0.0%
Johnnie Cochran Academy $76,217 $6,142 2.5%
Carver Institute $675,051 $56,463 3.0%
Jackson Academy $111,342 $8,453 1.7%
Cicely Tyson Elementary $287,943 $23,144 2.4%
Wahlstrom Academy $144,912 $11,563 2.3%
Total $6,002,872 $475,011
Concord Engineering recommends the District review all options available for installation of new or expanded solar PV systems at their facilities including a Power Purchase Agreement (PPA). This option utilizes providers who will own, operate, and maintain the system for a period of 15 years. During this time the PPA Provider would sell all of the electric generated by Solar Array to the District at a reduced rate compared to their existing electric rate. It should be noted that current SREC pricing has significantly impacted the PPA market for public entities in addition to the end of the 30% grant in lieu of the investment tax credit. These recent market changes have made it more difficult for public entities to secure low cost power purchase price options.

East Orange School District Executive Energy Report
Concord Engineering 1C15143 August 31, 2015 – FINAL Page 32 of 53
Wind Generation In addition to evaluating solar, Concord also conducted a review of the applicability of wind energy for the District. Wind energy production is another option available through the Renewable Energy Incentive Program. Wind turbines of various types can be utilized to produce clean energy on a per building basis. Cash incentives are available per kWh of electric usage. Concord investigated the potential for smaller building mountable wind turbines, and horizontal turbines to maximize the available free space. In order to be economically viable a site requires a minimum average wind speed of 6 meters per second (13.5 mph). Based on the obtained wind data shown in Figure 3 for Freehold the annual average wind speed is 10.1 mph with a peak of 12.0 mph, making this area unattractive for wind development. Therefore, wind energy is not a viable option to implement.
Figure 3: Monthly Wind Speed
(East Orange, New Jersey)

East Orange School District Executive Energy Report
Concord Engineering 1C15143 August 31, 2015 – FINAL Page 33 of 53
VI. ENERGY PURCHASING AND PROCUREMENT STRATEGY Load Profile: Load Profile analysis was performed to determine the seasonal energy usage of the facilities. Irregularities in the load profile will indicate potential problems within the facilities. Consequently based on the profile a recommendation will be made to remedy the irregularity in energy usage. For this report, the facilities energy consumption data was gathered in table format and plotted in graph form to create the load profile. Refer to The Electric, Natural Gas, and Fuel Oil Usage Profiles included within this report to reference the respective load profiles. Electricity: The electricity usage profile demonstrates a cooling dominated load profile from winter to summer. As depicted in the table below you can see the average monthly consumption and demand profiles for each season for the district facilities as a whole.
The historical usage profile is unfavorable as typically summer commodity rates are higher due to increased demand on the grid, compared with winter. Natural Gas: The Natural Gas Usage Profile demonstrates a heating load dominated profile, with significant consumption drop off during the summer months. The table below shows the monthly average consumption for gas during the winter and summer seasons for the district facilities as a whole.
This load profile will yield less than favorable natural gas prices due to the heating dominated profile. Higher winter month consumption will yield higher pricing which will not be offset by the summer month consumption. NYMEX commodity pricing is generally higher in the winter months of November – March and lower in the summer months of April – October.
DESCRIPTIONKWH PER MONTH
KW PER MONTH
KWH PER MONTH
KW PER MONTH
All District Facilities 1,487,788 3,807.37 1,787,867 4,823.82
ELECTRIC UTILITY SEASONAL LOAD PROFILE
FACILITYSEASONAL AVERAGES
WINTER (OCT - APR) SUMMER (MAY - SEP)
DESCRIPTION THERM PER MONTH THERM PER MONTHAll District Facilities 128,440 14,591
NATURAL GAS UTILITY SEASONAL LOAD PROFILE
FACILITYSEASONAL AVERAGES
WINTER (OCT - APR) SUMMER (MAY - SEP)

East Orange School District Executive Energy Report
Concord Engineering 1C15143 August 31, 2015 – FINAL Page 34 of 53
Fuel Oil: The Fuel Oil Profile demonstrated a heating dominated load profile, with fuel use in the summer attributed to the swing heating season periods in May and September. The average summer (May – September) consumption is 98% less than the average winter (October- April) consumption. The follow table outlines the seasonal average monthly consumption for the district facilities that use fuel oil.
Tariff Analysis: Electricity: The District receives electrical service from Public Service Electric and Gas under commercial rate Large Power and Lighting Service (LPLS), and General Power and Lighting Service (GLP). The facility has contracted a Third Party Supplier (TPS), through the ACES agreement to provide electric commodity service. Direct Energy is the current contract holder however; the contract particulars such as product structure, price, term and conditions were not available for review or comments. For electric supply (generation) service, the client has a choice to either use PSE&G’s default service rate BGS or contract with a Third Party Supplier (TPS) to supply electricity. Each year since 2002, the four New Jersey Electric Distribution Companies (EDCs) - Public Service Gas & Electric Company (PSE&G), Atlantic City Electric Company (ACE), Jersey Central Power & Light Company (JCP&L), and Rockland Electric Company (RECO) - have procured several billion dollars of electric supply to serve their Basic Generation Service (BGS) customers through a statewide auction process held in February. BGS refers to the service of customers who are not served by a third party supplier or competitive retailer. This service is sometimes known as Standard Offer Service, Default Service, or Provider of Last Resort Service. The Auction Process has consisted of two auctions that are held concurrently, one for larger customers on an hourly price plan (BGS-CIEP) and one for smaller commercial and residential customers on a fixed-price plan (BGS-FP). This facility’s rate structure is based on the fixed-price plan (BGS-FP). The utility will continue to be responsible for maintaining the existing network of wires, pipes and poles that make up the delivery system, which will serve all consumers, regardless of whom
DESCRIPTIONGALLONS PER
MONTHGALLONS PER
MONTHAll District Facilities (5) 37,001 587
#2 FUEL OIL UTILITY SEASONAL LOAD PROFILE
FACILITYSEASONAL AVERAGES
WINTER (OCT - APR) SUMMER (MAY - SEP)

East Orange School District Executive Energy Report
Concord Engineering 1C15143 August 31, 2015 – FINAL Page 35 of 53
they choose to purchase their electricity or natural gas from. PSEG’s delivery service rate includes the following charges: Customer Service Charge, Distribution Charge (kWh and Demand), Societal Benefits Charge (SBC), and Securitization Transition Charge. Natural Gas: The facilities currently receive natural gas distribution service from Public Service Electric & Gas (PSEG) under rate schedules General Service Gas (GSG), and Large Volume Service (LVG). The facility has contracted with a Third Party Supplier (TPS) under the ACES Agreement, with a current provider of South Jersey Industries, however, the contract particulars such as product structure, price, term and conditions were not available for review or comments. For natural gas supply service, the client has a choice to either use the utility’s default service rate BGSS or contract with a Third Party Supplier (TPS) to supply natural gas commodity service. The utility provides basic gas supply service (BGSS) to customers who choose not to shop from a Third Party Supplier (TPS) for natural gas commodity. The option is essential to protect the reliability of service to consumers as well as protecting consumers if a third party supplier defaults or fails to provide commodity service. The utilities are responsible for maintaining the existing network of wires, pipes and poles that make up the delivery system, which will serve all consumers, regardless of whom they choose to purchase their electricity or natural gas from the utility’s delivery service rate includes the following charges: Customer Service Charge, Distribution Charge, & Societal Benefits Charge (SBC).
Fuel Oil:
Fuel Oil is typically purchased on a time of delivery price basis, meaning with every delivery the cost per gallon fluctuates. Some fuel oil providers do offer fixed price structures for yearlong contracts that vary dependent on the client’s consumption rate. While these structures can be beneficial for the owner on a fixed budget, they do not typically offer savings back to the owner if oil prices drastically dip below the agreed on price.
Electric and Natural Gas Commodities Market Overview:
In our region, electricity is produced by natural gas, nuclear, coal and renewables. Much of the recent electricity price fluctuations can be attributed to the spot natural gas pricing variations on generation that produces electricity and the retirement of coal plants that result in increased production demand from other sources of generation.
It is important to note that both natural gas and electric commodity market prices are moved by supply and demand, political conditions, market technicals and trader sentiment. The market is continuously changing Energy commodity pricing is also correlated to weather forecasts. Because weather forecasts are dependable only in the short-term, prolonged temperature extremes can really cause extreme price swings.

East Orange School District Executive Energy Report
Concord Engineering 1C15143 August 31, 2015 – FINAL Page 36 of 53
Short Term Energy Outlook - US Energy Information Administration (June 2015):
U.S. Natural Gas Prices. Natural gas spot prices averaged $2.78/MMBtu at the Henry Hub in June, an decrease of $0.07/MMBtu from May. The monthly average natural gas price is expected to reamain lower than $3/MMBtu, and will remain below $4/MMBtu throughout the forecast period. Projected Henry Hub natural gas price averages $2.97/MMBtu in 2015 and $3.31/MMBtu in 2016.
Natural gas futures prices for October 2015 delivery (for the five-day period ending July 1, 2015) averaged $2.85/MMBtu. Current options and futures prices imply that market participants place the lower and upper bounds for the 95% confidence interval for September 2015 contracts at around $1.79/MMBtu and $4.03/MMBtu, respectively.
U.S. Electricity Retail Prices. EIA expects the U.S. residential price of electricity to raise an average 2.5% more than in 2014, with pricing in June 2015 of 13.264 cents per kilowatt-hour. Residential electricity prices are expected to increase 2.4% during 2016.

East Orange School District Executive Energy Report
Concord Engineering 1C15143 August 31, 2015 – FINAL Page 37 of 53
U.S. Petroleum Product Prices. EIA expected even with the recent cold weather that heating oil prices will be lower than last winter, due to lower projected crude oil prices compared to last winter. Compared to last winter retail heating oil prices are expected to average $3.00/Gal this winter.

East Orange School District Executive Energy Report
Concord Engineering 1C15143 August 31, 2015 – FINAL Page 38 of 53
Contracting with Third Party Suppliers and BGS Bidding Options Cooperative Purchasing: Cooperative Purchasing agreements allow multiple parties to come together under the premise of using purchasing power in order to reduce the price for goods and services. In this instance the Cooperative is under the unified goal of reducing energy prices for its members. As such members of the cooperative pool their respective energy consumption together into a single bid to obtain low cost energy pricing. Many Cooperatives have a formal bidding process and insure all suppliers provide the required documentation and paperwork necessary per New Jersey Administrative Code and Procurement Law. In addition, a Master Agreement is incorporated into the bid specifications with terms and conditions for the energy supply award protecting Local Government Entities. Concord does not recommend signing any Third Party Supplier contract or agreement unless it has been heavily vetted by an attorney that understands commodity law and regulation. Many government clients that have signed third party supplier contracts are now experiencing regulatory pass-thru charges due to vague or inadvertently agreed terms and conditions. Important information can be found on DCA’s website regarding Cooperative Purchasing. Please visit web link: http://www.state.nj.us/dca/divisions/dlgs/programs/lpcl_docs/Procuring_Power_Supply_through_a_Cooperative_Purchasing_System.pdf
It is important with any commodity procurement undertaking that you incorporate a rational, defensible strategy for purchasing commodity in volatile markets based upon the following:
Budgets that reflect sound market intelligence An understanding of historical prices and trends Awareness of seasonal opportunities (e.g. shoulder months) Negotiation of fair contractual terms An aggressive, market based price
Bidding Practices and Processes:
Different bid processes and methodologies can create different objectives, but transparency is always a primary goal. Closed bid competitive purchase RFBs, online bid receipt or online reverse auctions can be utilized. Firms which can provide online bidding and reverse auctions are approved by the New Jersey Division of Local Government Services pursuant to the Local Unit Electronic Technology Program, (P.L.2001, c. 30). Approved firms can be found on the website at: http://www.state.nj.us/dca/divisions/dlgs/programs/lpcl.html. The Board of Public Utilities also offers a list of energy suppliers available for each service territory that can be found on the website at: http://www.bpu.state.nj.us/bpu/commercial/shopping.html#nbr1 Over the last decade, Concord Engineering has been involved with numerous approaches to bidding including the Traditional Sealed Bid format and Online Reverse Auction methods. In our experience, Online Reverse Auctions do not always produce optimum results for retail

East Orange School District Executive Energy Report
Concord Engineering 1C15143 August 31, 2015 – FINAL Page 39 of 53
commodity purchases. The procurement consultant with the Client should determine a bidding practice that will yield optimum results and create a robust competitive environment. Many factors will come into consideration to determine whether the Online Bidding and/or Reverse Auction method is appropriate. Factors such as annual consumption, number and complexity of accounts, potential supplier participation as well as rate tariffs must be taken into consideration. LGE’s Purchasing Options:
Per DCA’s paper entitled “Taking Advantage of Lower Electric Rates for your Government Agency” they state, “First, it is important to emphasize that procurement of power supply must be consistent with the Local Public Contracts Law (LPCL) or for boards of education, the Public School Contracts Law (PSCL). Bottom line: When the estimated amount of spending for power supply is above the contracting unit’s bid threshold, power supply must be publicly bid or purchased subject to an exception to the bid law. “Full text can be found via web link: http://www.state.nj.us/dca/divisions/dlgs/programs/lpcl_docs/Taking_Advantage_of_Lower_Electric_Rates_for_your_Government_Agency.pdf
1. Cooperative Purchasing
“When local governments put aside provincial interests in exchange for the broader benefits to be achieved through Cooperative Purchasing, they can secure the provision and performance of goods and services at a lower cost. Cooperative Purchasing has demonstrated a strong ability to serve as an effective tool to assist local officials save taxpayer dollars. Cooperative Purchasing represents viable alternatives to the conventional “go-it-alone” bidding process. “ Many Cooperatives in the state utilize online bidding to secure attractive electricity and natural gas supply service. Utilizing a Cooperative is highly recommended. Benefits can include:
• Increase staff effectiveness • Reduce duplication of bidding and contract processing • Reduce time, effort and costs associated with developing and managing the bid process • Leverage established and large volume pricing of contracted products • Great alternative contract option to save time, money and ensure quality products &
services
2. Online Reverse Auctions and Online Sealed Bids
“For local government entities, the requirement to bid does not mean the solicitation of quotes; it means a formal process where there is a bid specification, notice to bidders, and a level playing field for all potential bidders. The Division’s E-Procurement Pilot program (authorized under P.L. 2001, c. 30) allows local units to purchase commodities and services, including energy supply, through online bidding and reverse auctions programs approved by the Division. Any online organization participating in the online pilot program must be approved by the Division. Once the Division has approved an online service, any local unit can take advantage of the service. When conducted through an online service, however, the local unit is responsible to

East Orange School District Executive Energy Report
Concord Engineering 1C15143 August 31, 2015 – FINAL Page 40 of 53
ensure that the online service is operating consistent with procurement laws for an individual procurement.”
Both online reverse auctions and online sealed bids can produce significant cost savings results. The process is transparent and seamless. Many platforms are very flexible allowing for full customization to meet the Client’s needs.
All providers of online reverse auction and online bidding charge a fee indirectly to LGE’s. The fee is included in the bid pricing shown by suppliers as a $/kWh or $/therm charge and paid directly by the supplier to the vendor. Although LGE’s do not have to formally bid for this type of service should they utilize a DCA pre-approved vendor, we would recommend that any and all fees paid by the supplier to the vendor be disclosed prior to any engagement of services. An overview of both the Online Reverse Auction vs Sealed bid format was published in the NJBIZ Spring of 2007. To view this article, please go to web link: http://www.nbizmag.com/magarticles/sealedbidvsreverseauction.pdf Benefits can include:
• Provides full transparency during the procurement process with unbiased decision making
• Drives prices down through real-time competition • Allows client to actively participate during the entire auction or online bidding process • Execution of contracts are completed within hours of the auction’s close • Places the focus for suppliers solely on price, since all other factors and related
contracting documentation is received and pre-qualified before the final auction bid due date
• Full audit and archival capabilities to substantiate award decisions • Improves knowledge capture, transfer and re-use capabilities
3. Traditional Sealed Bid Format
This type of bid format is not endorsed by the Division of Local Government Services for the bidding of power supply. However, in a recent review of bidding methodologies and which methodology would likely to produce lower cost results, a NJ Government Agency allowed suppliers to choose the bidding format. The bidding options allowed were either via an Online Reverse Auction or via a Traditional Sealed Bid. The Agency understood that many suppliers will not participate in an online auction format or methodology and wanted to allow all NJBPU suppliers to participate. The Agency is the 2nd largest Cooperative in the state which includes participants from five Counties and over 200 municipalities. After the online reverse auction bid was closed and the traditional sealed bids opened and reviewed, the Agency awarded the electricity contract to a bidder that was the lowest price and submitted their bid via the Traditional Sealed Bid Format.

East Orange School District Executive Energy Report
Concord Engineering 1C15143 August 31, 2015 – FINAL Page 41 of 53
The below recommendations presented by Concord Engineering are based on current information provided by the owner for their facilities historical energy usage. Any savings presented with these recommendations are estimates only based on that information. It is recommended that further analysis and review of more recent utility data and actual TPS electricity and natural gas supply contracts and historical billings be performed prior to performing any of the presented recommendations. Recommendations: 1. Concord Engineering recommends that the District continue its aggregation approach for 3rd
party commodity supply procurement strategies for the purchase of electricity and natural gas. Aggregating the usage of all facilities for both electricity and natural gas supply service, allows the District to continue to achieve lower prices in commodity supply costs over the utility default service programs. Energy commodities are among the most volatile of all commodities, however at this point and time, energy is extremely competitive and contract terms longer than 12 months are desirable. Contracts due to expire in the near term would continue to yield very favorable pricing. It is important to aggregate usage where available and take advantage of these current market prices quickly, before energy increases.
2. Concord Engineering also recommends that the District consider utilizing a third party utility billing-auditing service to further analyze historical utility invoices such as water, sewer, natural gas, electricity and fuel oil for incorrect billings and rate tariff optimization services. This service can be based on a shared savings model with no direct cost. The service could provide refunds on potential incorrect billings that may have been passed through by the utilities and paid by the School District. *This is highly recommended given Concord’s review of the utility billing there are several facilities with estimated, canceled, and accrued bills for electric and natural gas. Rectifying these billing could net substantial savings to the district.

East Orange School District Executive Energy Report
Concord Engineering 1C15143 August 31, 2015 – FINAL Page 42 of 53
PJM Demand Response Programs Demand response programs may not fit or be applicable to all clients, however if there is an opportunity to shed load, typically above 100 kilowatts, while not having significant impacts on operations and comfort conditions it could warrant consideration. Several facilities within the district could be candidates for Demand Response, especially the larger newer facilities with central building management controls. Concord recommends the owner review the program description below from PJM to see if there is a potential fit, as it can become a substantial revenue source dependent on your ability to curtail. What is PJM? PJM Interconnection is a regional transmission organization that coordinates the movement of wholesale electricity in all parts of 13 states and the District of Columbia. As an independent party, PJM operates a competitive wholesale electricity market and manages the high-voltage electricity grid to ensure reliability for more than 51 million people. PJM’s long-term planning process take a broad, interstate perspective that identifies the most effective and cost efficient improvements to the grid to ensure reliability and economic benefits on the system as a whole. PJM’s “Wholesale” market is focused on entities that buy and sell the electricity, but are not the end consumers of the electricity. The retail market is focused on entities that buy electricity from the wholesale market or produce the electricity, and then sell the electricity to a customer that physically consumes it. PJM does not interact directly with the electricity consumers, but with the companies (or Utility) that provides the electricity to consumers. What is Demand Response? Demand Response is a consumer’s ability to reduce electricity consumption at their location when wholesale prices are high or the reliability of the electric grid is threatened. Common examples of demand response include: raising the temperature of the thermostat so the air conditioner does not run as frequently, slowing down or stopping production at an industrial operation or dimming/shutting off lights, basically any explicit action taken to reduce load in response to short-term high prices or a signal from PJM. Demand Response does not include the reduction of electricity consumption based on normal operating practice or behavior. For example, if a company’s normal schedule is to close for a holiday, the reduction of electricity due to this closure or scaled-back operation is not considered a demand response activity in most situations. Retail Customer Program Offerings: PJM’s demand response opportunities enables retail electricity consumers to earn a revenue stream for reducing electricity consumption when either wholesale prices are high or the reliability of the electric grid is threatened. Demand response participation is broken in two broad classifications, Economic and Emergency. An electricity consumer may participate in either or both depending on the circumstances.

East Orange School District Executive Energy Report
Concord Engineering 1C15143 August 31, 2015 – FINAL Page 43 of 53
Emergency Demand Response primarily represents a mandatory commitment to reduce load or only consume electricity up to a certain level when PJM needs assistance to maintain reliability under supply shortage or expected emergency operation conditions. This is considered a mandatory commitment to which penalties will be applied for non-compliance. The consumer’s resources must be available to respond to PJM’s request to reduce load where the availability depends on the product selected, as follows: Limited DR – resource is available for up to 10 weekdays from June through September,
where each request may be up to six hours in duration. Extended Summer DR – resources is available for all days from May through October,
where each request may be up to ten hours in duration Annual DR - resources is available for all days from June through May of following year,
where each request may be up to ten hours in duration PJM considers these resources similar to a generator and fully expects them to perform at the time when the grid most needs it to avoid brownouts and/or rolling blackouts within the PJM service territory. The revenue stream derived from participation is largely driven by the “Capacity” market as defined under the Reliability Pricing Model (RPM). The revenue earned is a function of the relevant RPM price and the load reduction commitment. The resource is paid to be “available” during expected emergency conditions on a monthly basis for a commitment that is made for one year, which starts on June 1 and ends on May 31 of the following year. Emergency demand response also has the opportunity to participate on a voluntary basis. Under this option, the resources have the option to participate when an emergency is called and will be compensated based on the amount of energy reduced during the emergency. Such resources will not receive revenue from the capacity market. Economic Demand Response primarily represents a voluntary commitment to reduce load in the energy market when the wholesale price is higher than the published monthly PJM net benefits price. The net benefit price represents the price at which the benefits incurred by a reduction in wholesale prices from the economic demand response will exceed the cost to pay for the economic demand response. The economic demand response will be used to displace a generation resource and PJM expect the resource to perform and will assess deviation charges if the amount of load reductions realized is significantly different than the amount of load reductions dispatched by PJM. An economic demand response resource may also provide Ancillary Services to the wholesale market with the appropriate infrastructure and qualification by PJM. There are three Ancillary Services markets in which economic demand response resources may participate: Synchronized Reserves (the ability to reduce electricity consumption within 10 minutes of PJM dispatch), Day Ahead Scheduling Reserves (the ability to reduce electricity consumption within 30 minutes of

East Orange School District Executive Energy Report
Concord Engineering 1C15143 August 31, 2015 – FINAL Page 44 of 53
PJM dispatch) and Regulation (the ability to follow PJM’s regulation and frequency response signal). Participation in the market is voluntary; however, if a resource clears, performance is mandatory. How to Participate? The first step for a consumer interested in demand response is to contact a Curtailment Service Provider(s) to get a more in-depth understanding of the opportunities and determine whether you have the capability to participate. A list of Curtailment Service Providers is available on PJM’s Web site at Markets & Operations > Demand Response > Curtailment Service Providers (www.pjm.com/markets-and-operations/demand-response/csps.aspx). The list includes contact names at the firms; it also indicates in what states the firms do business. PJM also posts on its website the training materials developed for its members who are interested in the rules and requirements for demand response activity at http://www.pjm.com/training/training-material.aspx, along with a variety of demand response information at http://www.pjm.com/markets-and-operations/demand-response.aspx.

East Orange School District Executive Energy Report
Concord Engineering 1C15143 August 31, 2015 – FINAL Page 45 of 53
VII. INSTALLATION FUNDING OPTIONS CEG has reviewed various funding options for the facility owner to utilize in subsidizing the costs for installing the energy conservation measures noted within this report. Below are a few alternative funding methods: A. Incentive Programs: Pay For Performance (www.njcleanenergy.com/commercial-industrial/programs/pay-performance) The New Jersey Smart Start Pay for Performance Program includes incentives based on savings resulted from implemented ECMs. The program is available for all buildings that were audited as part of the NJ Clean Energy’s Local Government Energy Audit Program. The facility’s participation in the program is assisted by an approved program partner. An “Energy Reduction Plan” is created with the facility and approved partner to shown at least 15% reduction in the building’s current energy use. Multiple energy conservation measures implemented together are applicable toward the total savings of at least 15%. No more than 50% of the total energy savings can result from lighting upgrades / changes. Total incentive is capped at 50% of the project cost. The program savings is broken down into three benchmarks; Energy Reduction Plan, Project Implementation, and Measurement and Verification. Each step provides additional incentives as the energy reduction project continues. The benchmark incentives are as follows:
1. Energy Reduction Plan – Upon completion of an energy reduction plan by an
approved program partner, the incentive will grant $0.10 per square foot between $5,000 and $50,000, and not to exceed 50% of the facility’s annual energy expense. (Benchmark #1 is not provided in addition to the local government energy audit program incentive.)
2. Project Implementation – Upon installation of the recommended measures along
with the “Substantial Completion Construction Report,” the incentive will grant savings per KWH or Therm based on the program’s rates. Minimum saving must be 15%. (Example $0.09 / kWh for 15% savings, $0.10/ kWh for 17% savings, … and $0.90 / Therm for 15% savings, $1.00 / Therm for 17% saving, …) Increased incentives result from projected savings above 15%.
3. Measurement and Verification – Upon verification 12 months after
implementation of all recommended measures, that actual savings have been achieved, based on a completed verification report, the incentive will grant additional savings per kWh or Therm based on the program’s rates. Minimum savings must be 15%. (Example $0.09 / kWh for 15% savings, $0.10/ kWh for 17% savings, … and $0.90 / Therm for 15% savings, $1.00 / Therm for 17% saving, …) Increased incentives result from verified savings above 15%.

East Orange School District Executive Energy Report
Concord Engineering 1C15143 August 31, 2015 – FINAL Page 46 of 53
Based on the provided data within each facility report and the estimated energy savings of each measure, the following facilities are believed to qualify for the Pay for Performance Program; and using each Facility Project Summary program incentives were estimated.
DESCRIPTION QUALIFYINCENTIVE
#1 INCENTIVE
#2INCENTIVE
#3TOTAL
INCENTIVES
Hart Complex Yes $16,044 $158,450 $158,450 $332,944
Cicely L. Tyson Middle & High School No - - - $0
Langston Hughes Elementary No - - - $0
Dionne Warwick Institute No - - - $0
STEM Academy No - - - $0
Robeson Stadium No $0
Whitney Houston Academy No - - - $0
Ecole T. Louverture School No - - - $0
Gordon Parks Academy No - - - $0
Edmonson High School No - - - $0
Carver Annex No - - - $0
Althea Gibson Academy No - - - $0
Mildred Barry Garvin School No - - - $0
Edward Bowser Elementary School Yes $5,000 $3,977 $3,977 $12,954
Benjamin Banneker Academy No - - - $0
EOSD Central Office No - - - $0
East Orange Campus High School No - - - $0
Johnnie Cochran Academy No - - - $0
Carver Institute No - - - $0
Jackson Academy No - - - $0
Cicely Tyson Elementary No - - - $0
Wahlstrom Academy No - - - $0
Total 2 $345,898
POTENTIAL FACILITY PAY FOR PERFORMANCE INCENTIVES

East Orange School District Executive Energy Report
Concord Engineering 1C15143 August 31, 2015 – FINAL Page 47 of 53
Disclaimer: The Pay for Performance incentives outlined above have been estimated based on the current calculated energy savings for the measures outlined in each facility report. Qualification for the program has been based on meeting the minimum demand threshold of 100 kilowatts and overall project meeting the minimum 15% source energy reduction requirement. This preliminary qualification analysis does not guarantee program incentives or acceptance into the program. The owner will be required to retain a Program Partner and formally apply to the program to determine final project incentives. Direct Install Program (www.njcleanenergy.com/commercial-industrial/programs/direct-install) The New Jersey Clean Energy’s Direct Install Program is a state funded program that targets small commercial and industrial facilities with peak demand of less than 200 kW. This turnkey program is aimed at providing owners a seamless, comprehensive process for analysis, equipment replacement and financial incentives to reduce consumption, lower utility costs and improve profitability. The program covers up to 70% of the cost for eligible upgrades including lighting, lighting controls, refrigeration, HVAC, motors, variable speed drives, natural gas and food service. Participating contractors (refer to www.njcleanenergy.com) conduct energy assessments in addition to your standard local government energy audit and install the cost-effective measures. The following facilities qualify to apply for the Direct Install Program based on current program criteria:
DIRECT INSTALL PROGRAM DESCRIPTION QUALIFY
Hart Complex No
Cicely L. Tyson Middle & High School No
Langston Hughes Elementary No
Dionne Warwick Institute Yes
STEM Academy No
Robeson Stadium Yes
Whitney Houston Academy Yes
Ecole T. Louverture School Yes
Gordon Parks Academy Yes
Edmonson High School Yes
Carver Annex Yes
Althea Gibson Academy Yes

East Orange School District Executive Energy Report
Concord Engineering 1C15143 August 31, 2015 – FINAL Page 48 of 53
DIRECT INSTALL PROGRAM DESCRIPTION QUALIFY
Mildred Barry Garvin School No
Edward Bowser Elementary School No
Benjamin Banneker Academy No
EOSD Central Office Yes
East Orange Campus High School No
Johnnie Cochran Academy Yes
Carver Institute No
Jackson Academy Yes
Cicely Tyson Elementary Yes
Wahlstrom Academy Yes
Total 13
Smart Start Program (www.njcleanenergy.com/commercial-industrial/programs/nj-smartstart-buildings/nj-smartstart-buildings) Prescriptive Measures - The New Jersey Clean Energy’s Smart Start prescriptive measures incentives include unit pricing incentives for installation of energy efficient equipment and controls. Proposed equipment and controls must meet the minimum efficiency requirements as well as other application requirements. The Smart Start prescriptive incentives applicable for new construction, renovations, remodeling and equipment replacements, for a wide range of equipment including:
Electric Chillers Gas Cooling Electric Unitary HVAC Ground Source Heat Pumps Gas Heating Variable Frequency Drives Gas Water Heating Premium Motors Prescriptive Lighting Lighting Controls Commercial Kitchen Equipment Technical Studies

East Orange School District Executive Energy Report
Concord Engineering 1C15143 August 31, 2015 – FINAL Page 49 of 53
Custom Measures - The New Jersey Clean Energy’s Smart Start prescriptive measures incentives include all measures not identified in the prescriptive measures category or measures that must have savings verified through additional analysis such as energy model simulations. Custom measures are intended to include savings as a result of unique energy efficiency measures, which are typically facility specific such as waste heat recovery. Custom incentives are provided based on the amount of energy saved and minimum internal rate of return in order to be eligible. The owner should refer to the Clean Energy Program website for further details on specific incentives available. (www.njcleanenergy.com) Concord Engineering recommends the Owner review the use of the above-listed funding options in addition to utilizing their standard method of financing for facilities upgrades in order to fund the proposed energy conservation measures.

East Orange School District Executive Energy Report
Concord Engineering 1C15143 August 31, 2015 – FINAL Page 50 of 53
B. Financing Options: The following section outlines various funding mechanisms available to fund energy efficiency projects. It is the local government unit’s responsibility to verify these funding sources adhere to all required federal, state, and local finance laws. Municipal Bonds Municipal bonds are a bond issued by a city or other local government, or their agencies. Potential issuers of municipal bonds include cities, counties, redevelopment agencies, school districts, publicly owned airports and seaports, and any other governmental entity (or group of governments) below the state level. Municipal bonds may be general obligations of the issuer or secured by specified revenues. Interest income received by holders of municipal bonds is often exempt from the federal income tax and from the income tax of the state in which they are issued, although municipal bonds issued for certain purposes may not be tax exempt. Municipal Lease Purchase (Long-term Municipal Lease Agreements) A Municipal Lease is a contract that has many of the characteristics of a standard commercial lease, with three primary differences. In a Municipal Lease, the intent of the lessee is to purchase and take title to the equipment. The financing is a full payout contract with no significant residual or balloon payments at the end of the lease term. The lease payments include the return of principal and interest, with the interest being exempt from Federal income taxation to the recipient. Typically, a tax-exempt interest transaction will be financed at interest rates lower than equivalent commercial financing. The Municipal Lease provides for termination for non-appropriation of funds by the Government Agency. A Municipal Lease offers several advantages over alternative methods of financing such as simplicity, speed of delivery, non-appropriation, buyout terms, and cost. Under most state statutes, municipal contracts with terms of over one year require significant investments in time and money in order to comply with municipal debt restrictions. Since a Municipal Lease is, in effect, a year-to-year obligation, many of these requirements do not apply. The ease of executing a Municipal Lease minimizes the elapsed time and the expenses associated with issuing any kind of certificate of indebtedness or bond. Lease to Own (Leaseback) A lease to own arrangement is where the seller of an asset (i.e. building, equipment, etc.) leases back the same asset from the purchaser. In a leaseback arrangement, the specifics of the arrangement are made immediately after the sale of the asset, with the amount of the payments and the time period specified. Essentially, the seller of the asset becomes the lessee and the purchaser becomes the lessor in this arrangement. A leaseback arrangement is useful when entities need to un-tie the cash invested in an asset for other investments, but the asset is still needed in order to operate. Leaseback deals can also provide the seller with additional tax deductions. The lessor benefits in that they will receive stable payments for a specified period of time.

East Orange School District Executive Energy Report
Concord Engineering 1C15143 August 31, 2015 – FINAL Page 51 of 53
Power Purchase Agreement Public Law 2008, Chapter 3 authorizes contracts of up to fifteen (15) years for energy purchase contracts commonly known as “power purchase agreements.” These are programs where the contracting unit (Owner) procures a contract for, in most cases, a third party to install, maintain, and own a renewable energy system. These renewable energy systems are typically solar panels, windmills or other systems that create renewable energy. In exchange for the third party’s work of installing, maintaining and owning the renewable energy system, the contracting unit (Owner) agrees to purchase the power generated by the renewable energy system from the third party at agreed upon energy rates. On-Bill Financing On-bill financing allows a loan for energy efficiency measures to be repaid over time via an additional line item on the recipient’s utility bill, which decreases repayment risk for the lender. The lender in “classic” utility on-bill financing has traditionally been the utility itself. Hybrid models have also emerged in which public and private funds are pooled to offer low-interest loans, with repayment similarly attached to the utility bill. The utility then collects the payment and returns it to the lender, which lowers the lender’s administrative costs. The utility customer benefits from lower energy costs after retrofits, and typically pays loans back over a period of about 2–5 years. This model has also recently become available with Third Party Commodity Suppliers allowing for energy efficiency project funding to be rolled into their bill for the customer. If the owner is interested in this funding mechanism they should contact their local utility or third party supplier if any such program is offered. Alternatively if the owner’s current third party supply contract is expiring this could be included as an option when bidding for new suppliers. Public-Private Partnerships A public-private partnership is a business relationship between a public entity and a private-sector company for the purpose of completing a project that will serve the public. These types of partnerships can be used to finance, build, and operate various types of projects such as public transportation networks, new buildings, parks, and convention centers. In lieu the traditional path of a public entity funding the project, a private enterprise would fund it in exchange for receiving some type of financial benefit from the project once complete. Energy Savings Improvement Program (ESIP): Public Law 2009, Chapter 4 authorizes government entities to make energy related improvements to their facilities and pay for the costs using the value of energy savings that result from the improvements. The “Energy Savings Improvement Program (ESIP)” law provides a flexible approach that can allow all government agencies in New Jersey to improve and reduce energy usage with minimal expenditure of new financial resources. This program provides public entities to make valuable facility infrastructure improvements that are associated with energy savings. All energy savings projects are eligible as long as the financing period does not extend beyond 15 years. The financing can be utilized for all aspects of energy efficiency project

East Orange School District Executive Energy Report
Concord Engineering 1C15143 August 31, 2015 – FINAL Page 52 of 53
implementation including, energy savings plan development, engineering, construction management, construction management, commissioning, and measurement and verification. This program provides the much needed financing for energy efficiency projects without the burden of increased debt. The program allows for procurement of financing without voter approval or extending existing debt. The program requires evaluation to ensure a positive cash-flow through the entire 15 year financing period. The first phase of implementing an ESIP is the development of an Energy Savings Plan (ESP) to verify the energy savings, construction costs, and overall financial model.

East Orange School District Executive Energy Report
Concord Engineering 1C15143 August 31, 2015 – FINAL Page 53 of 53
VIII. ENERGY AUDIT ASSUMPTIONS The assumptions utilized in this energy audit include but are not limited to following:
A. Cost Estimates noted within this report are based on industry accepted costing data such as RS MeansTM Cost Data, contractor pricing and engineering estimates. All cost estimates for this level of auditing are +/- 20%. Prevailing wage rates for the specified region has been utilized to calculate installation costs. The cost estimates indicated within this audit should be utilized by the District for prioritizing further project development post the energy audit. Project development would include investment grade auditing and detailed engineering.
B. Energy savings noted within this audit are calculated utilizing industry standard procedures and accepted engineering assumptions. For this level of auditing, energy savings are not guaranteed.
C. Information gathering for each facility is strongly based on interviews with operations personnel. Information dependent on verbal feedback is used for calculation assumptions including but not limited to the Operating Hours, Equipment Type, Control Strategies, and Scheduling.
D. Information contained within the major equipment list is based on the existing District documentation where available (drawings, O&M manuals, etc.). If existing District documentation is not available, catalog information is utilized to populate the required information.
E. Equipment incentives and energy credits are based on current pricing and status of rebate programs. Rebate availability is dependent on the individual program funding and applicability. It is the District’s responsibility to ensure installed measure equipment meets NJOCE program rules and requirements to receive these incentives.
F. Equipment (HVAC, Plumbing, Electrical, & Lighting) noted within an ECM recommendation is strictly noted as a basis for calculation of energy savings. The District should use this equipment information as a benchmark when pursuing further investment grade project development and detailed engineering for specific energy conservation measures.
G. Utility bill annual averages are utilized for calculation of all energy costs unless otherwise noted. Accuracy of the utility energy usage and costs are based on the information provided by the District. Utility information including usage and costs is estimated where incomplete data is provided.
H. Greenhouse Gas Emissions are calculated for each ECM, the basis for these emissions reductions are NJCEP published standard emissions factors, which are the following:.
a. Electric Savings: 1. CO2: 1.52 lbs/kWh 2. NOX: 0.0028 lbs/kWh 3. SO2: 0.0065 lbs/kWh
b. Natural Gas Savings: 1. CO2: 11.7 lbs/therm 2. NOX: 0.0092 lbs/therm