Embed Size (px)
Citation preview

Lecture Materials
LOAN PORTFOLIO MANAGEMENT – YEAR 1
Thomas A. Farin Chairman of the Board
FARIN Financial Risk Management Fitchburg, Wisconsin
[email protected] 608-661-4219
August 10, 2016


CREATE SYNERGY. DRIVE PROFITABILITY1
GSB Credit TrackEffective Loan Pricing
Thomas FarinPresident

CREATE SYNERGY. DRIVE PROFITABILITY
Effective Loan Pricing• At school
– Whatweneedtoknowtopricealoan
– Fourdifferentmodelsformakingloanpricingdecisions
• Second two parts when you are working on your intersession project– Session2‐ Pricingindividualloans
– Session3– Pricingdealsandrelationships
2

CREATE SYNERGY. DRIVE PROFITABILITY
Challenges in Asset Selection• Common fear of available
assets– Fixedrate,longerterm
• Interestraterisk– Cappedearnings– Variablefundingcosts
• Creditquality– Borrowerstability migration
• Liquidity
• Concerns with current market– Balloons
• Creditriskatrenewal– Variablerates
• Interestraterisk floors,caps• Creditrisk paymentshock• Prepaymentrisk refinancerisk• Caps?
• Role of Loan Pricing tool in ALCO– Dowesettherateorevaluatetheabilitytooffertheproductatall?
– Attheloanofficerleveltakeallowedassetsandensuresprofitability.
• Loan Pricing options in this section– 1‐4Family– CRE– Ag– Consumer
• Funding options– Funding“gap”– Coredepositvalueinassetselection
– Useofwholesalein“efficientfrontier” model
3

CREATE SYNERGY. DRIVE PROFITABILITY
Optimal Earning Asset Matrix• Every balance
sheet mix carries maximum return\volatility combinations
• Finding your optimal earnings frontier is key to strategic\capital plan– Whatstrategyhashigherearningspotentialandless“risk”
4
Where is your current and projected performance vs. actual?Given your “risk appetite” what is your “domain” of optimal return?
Volatilityofearnings
ROE

CREATE SYNERGY. DRIVE PROFITABILITY
Funds Transfer Pricing Curve• Requires a cost curve for funding costs
• Penalizeslendingfunctionifinefficientatpricingfunds,maycauseoutofmarketratesetting
• Doesnotrewardfundingprovidersforgatheringwellpricedfunding
• FHLB,Jumbo/Brokered/Internet/CDARS/SWAP• Pickclosestmatchtocurveyouwoulduse,andallowedforbyliquidity/fundingpolicies&strategies
5
CREATE SYNERGY. DRIVE PROFITABILITY
6
Non-Rate SettersUse of Pricing Models
• Given others set market rates– Identifywellpricedloans
– Identifypoorlypricedloans
– Aggressivelycompeteforwellpricedloans
– Donotaggressivelycompeteforpoorlypricedloans
• Loan pricing models– MarketView
• Investmentbenchmarks
• Valuation– Balancesheetview
• RAROC– RiskAdjustedReturnonCapital
• ROA‐ Netincomeproduced

CREATE SYNERGY. DRIVE PROFITABILITY
Factors in Pricing Loans• Cash flows, not
maturity– DoyouviewaMortgageBackedsecuritythesamewayasaMunicipalbond?
• Funding costs– Doesyourcurrentcostoffundsmatter?
– Isthatwhatkeepsyoufrommakinglongertermloanswhenratesarelow?
– Potentialfundingcostsarewhatmatters
• Risks to consider– Interestraterisk– cashflows– Creditrisk ALLLandlosses– Servicingcosts
• Origination• Incrementalcostofadditionalservicing
• Directorgeneraloverheadallocations?
– Optionrisk– cashflowvolatility• Prepayment• Caps/floors
– Marketrates?• Competitorsthataremakingbaddecisionsshouldnotbefollowedoverthecliff! 7

CREATE SYNERGY. DRIVE PROFITABILITY
8
Cash Flow and Repricing Characteristics
• Fixed or Variable– OriginationRate– FirstReprice– RepricingRate– RepricingFrequency
• Term or Revolving– Amortizing?– Term– Balloon?
• AmortizationTerm– PrepaymentSpeed
60MonthBulletLoan

CREATE SYNERGY. DRIVE PROFITABILITY9
Loan Pricing – Cash Flows
0
0.5
1
1.5
2
2.5
3
3.5
1 2 3 4 5
Funding Cost
Rates
Match
60 Month Bullet
$0
$20,000
$40,000
$60,000
$80,000
$100,000
$120,000
1 6 11 16 21 26 31 36 41 46 51 56
Cum Prin CF
Series1Series2
Considers Interest Cash Flows
60 Month Bullet Loan

CREATE SYNERGY. DRIVE PROFITABILITY10
Loan Pricing – Cash Flows
Match
Considers Interest Cash Flows
60 Month New Car - 20% PP
$0
$20,000
$40,000
$60,000
$80,000
$100,000
$120,000
1 6 11 16 21 26 31 36 41 46 51 56
Cum Prin CF
60 Month Amortizing Loanwith 25% annual prepayments

CREATE SYNERGY. DRIVE PROFITABILITY11
Loan Pricing – Cash Flows
Match
Considers Interest Cash Flows& Repricin
5 Year Ballon Mtg - 8% PP
$0$5,000
$10,000$15,000$20,000$25,000$30,000$35,000$40,000$45,000$50,000
1 6 11 16 21 26 31 36 41 46 51 56
Cum Prin CF
0.84

CREATE SYNERGY. DRIVE PROFITABILITY
12
Loan Pricing – Interest Rate Risk
• Interest Rate Risk– Whenyouarepricingloansyouarepricingcashflowsnotmaturities.
– Withfixed‐rateloans,piecesrepriceascashflowscomein.Fewrepriceatmaturity.
– Principalcashflowsareoftenuncertain• Prepaymentoptions
– Variablerateloansreprice• Whencashflowpiecescomein• Whencontractualrepricingoccurs,but…• Variablerateloansmaynotrespondimmediatelyorcompletelyatresetpoints
• Resetfrequency• Restrictionsonadjustments caps
• To manage interest rate risk, institutions need to match funding to the repricing of the loans of loans. Two approaches:– Simplistic– matchbasedonduration– Morecomplex– Matchfundindividualrepricingflows.
– Whileintherealworldyoumaynotmatch,inmakingpricingdecision,weshouldassumematching.x
x
X– Approachtakeninthiscourse

CREATE SYNERGY. DRIVE PROFITABILITY
13
Market Curve UsageCurveNo CurveName
1 US Treasury5 Prime6 Fed Funds9 Balloon MBS
10 Libor14 FHLMC FR MBS16 UST Strip20 FNMA FR MBS21 GNMA FR MBS29 Interest Rate Swap37 Indexed AAA Corporate Bon40 AAA Auto Index66 11th District COFI84 Average FHLB ADV87 Cost of Savings Index90 Indexed AAA MUNI Bond91 Indexed Agency Bond95 National COFI98 REPO (Overnight)99 Retail CD Avg
100 US CMT (H.15)119 AAA Commercial Equipmen126 Indexed A Corporate Bond127 Indexed B Corporate Bond128 Indexed A- MUNI Bond134 FR MBS137 Balloon MBS Synthetic138 GNMA II ARMS
• Curves Used for– RiskFreeCurves– InvestmentBenchmarks– WholesaleFundingCurves
• Requirements– Broadrangeofbenchmarks.– Updatedveryfrequently

CREATE SYNERGY. DRIVE PROFITABILITY14
Cash Flow Matching Example
60 Month Auto loan – 1st 12 months of amortization
Weighted averageinvestment benchmarksand funding costs arecalculated from thesematches.

CREATE SYNERGY. DRIVE PROFITABILITY15
Loan Pricing – The Basics
Interest Rate Risk – Conclusions• Interest rate risk driven by the cash flow and repricing
characteristics of the loan rather than the term of the loan• To model most accurately, each cash flow and repricing
point is matched• The loan can be matched up to an appropriate point of:
– Afundingcurvewhenmatchingfunding• FundsTransferPricing FTP
– Aninvestmentcurvewhenlookingatinvestmentalternatives.• Pricingloansoffinvestmentalternatives• Valuingloans

CREATE SYNERGY. DRIVE PROFITABILITY
Which History to Use?• Was history from 2005-2007 a legitimate predictor
of recent credit losses?• Are 2008-2010 losses a legitimate predictor of
losses of newly originated loans in 2011?• Do we even have legitimate loss history for loans
originated today?– Changesincollateralcoverage– Changesinunderwritingstandards– Changesinkindsofloansoriginated
16

CREATE SYNERGY. DRIVE PROFITABILITY
17
Loan Pricing – ServicingServicing Cost
– MarginalOriginationCost• Costoforiginatingthenextloan
– MarginalServicingCost• Costofservicingthenextloan
– DirectOverheadAllocation• Fixedcostsdirectlyrelatedtoloanproduction
– GeneralOverheadAllocation• President’ssalary,humanresources,etc.
Arguments– Economist– Continuetoproducewidgetsuntilmarginalrevenueequalsmarginalcost.
– Accountant– Withoutoverheadallocation,youendupwithprofitableloansandanunprofitableinstitution.
OTS Cost Assumptions– 0.20%‐ FRMortgages– 0.38%‐ ARMs– 0.20%‐ Multi&Non‐Res– 0.20%‐ Const&Land– 0.20%‐ SecondMtg.– 0.20%‐ Commercial– 0.20%‐ Consumer– 1.00%‐ CreditCard
• Is there a better source for generic servicing costs

CREATE SYNERGY. DRIVE PROFITABILITY18
Servicing Example
• Differential pricing on A, B, C credits should reflect both additional charge offs, and additional servicing costs due to legal and collection fees.

CREATE SYNERGY. DRIVE PROFITABILITY19
Loan Pricing – The BasicsOption Risk – Dealing with uncertain cash flows• We imbed options in loan contracts that allow
customers to modify cash flow characteristics of loans when they consider it to their advantage to do so.– Prepayments
• Basicprepaymentlevels– death,divorce,transfer,upgrades,etc.
• Incentivedrivenprepayments– Customerprepaystorefinanceatalowerrate– Customercan’taffordtomoveorupgradebecauseofinterestratejump.
– Uptothecustomertoexecutetheoption– Insomecases,subjecttopenalty– primarilycommercialcontracts
– Adjustableratemortgagecaps• Annualcaps,lifetimecaps• Automaticallyexecutedbytheinstitution.• Loanfloors
• Ideally the institution is compensated with rate for making the option available.

CREATE SYNERGY. DRIVE PROFITABILITY
20
Option Risk – What Is It• 15 year FRM example showing remaining principal under different
rate environments– Falling– 25%CPR– 2.75yearduration– Flat– 8%CPR– 4.64Yearduration– Rising– 5%CPR– 5.21YearDuration
15 Year FRM
-
20,000.00
40,000.00
60,000.00
80,000.00
100,000.00
120,000.00
1 14 27 40 53 66 79 92 105 118 131 144 157 170
Month
Rem
aini
ng P
rinci
pal
5% CPR8% CPR25% CPR

CREATE SYNERGY. DRIVE PROFITABILITY
21
Consider Option Risk in Pricing Loans?
• Against– Notatruecostlikechargeoffs,servicingcosts,orcostsofmatchingfunding.
– Consideringoptionriskwillcauseloanstobeunprofitable.
– Nottheloanofficer’sproblem.– Verydifficulttocalculate– Maybeinherentlyhedgedinbalancesheetofretailfinancialinstitution.
• For– Optionriskcandamagetheperformanceofun‐hedgedinstitutions.Itcostsmoneytohedgeoptionrisk
– Price/yieldofsecuritiesreflectsoptionrisk.Securitiesaresecuritizedloans
– Ifloanofficersarenot‘charged’foroptions,theywillgiveawayoptionsinexchangeforrate
– Canbederivedfromsecuritiesmarket.
• Source– SecuritiesMarkets

CREATE SYNERGY. DRIVE PROFITABILITY22
Sample Loan – 5/20 Balloon
•Cash Flows•Pricing•Expenses•Risk Assum

CREATE SYNERGY. DRIVE PROFITABILITY
23
Investment Benchmark• Market rather than internal
benchmark• Compares performance of loan to
closest investment benchmark after adjusting for risk and cost differences.
• Most relevant when– Youaretryingtodecidehowtoinvestcashalreadyraised.
– Anytimeinvestinginasecurityisanalternativetomakingaloan
– Youaretryingtoderivemarketadjustmentsfor• Interestraterisk• Optionrisk
• Required inputs– Cashflowcharacteristics– Riskfreecurve– Investmentbenchmarkcurve– Pricing– Ratesandfees– Operatingexpenses– Creditriskadjustment– Additionaloptionriskadjustments
• Calculated adjustments– Interestrateriskadjustment– Optionriskadjustment– Loan’sspreadtoinvestmentbenchmarkafteradjustments
– Test– Isspreadpositive good ornegative bad ?
• Not considered– Fundingcostcurve– Capitalrequirement– RAROCGoal– InstitutionTaxRate
CREATE SYNERGY. DRIVE PROFITABILITY
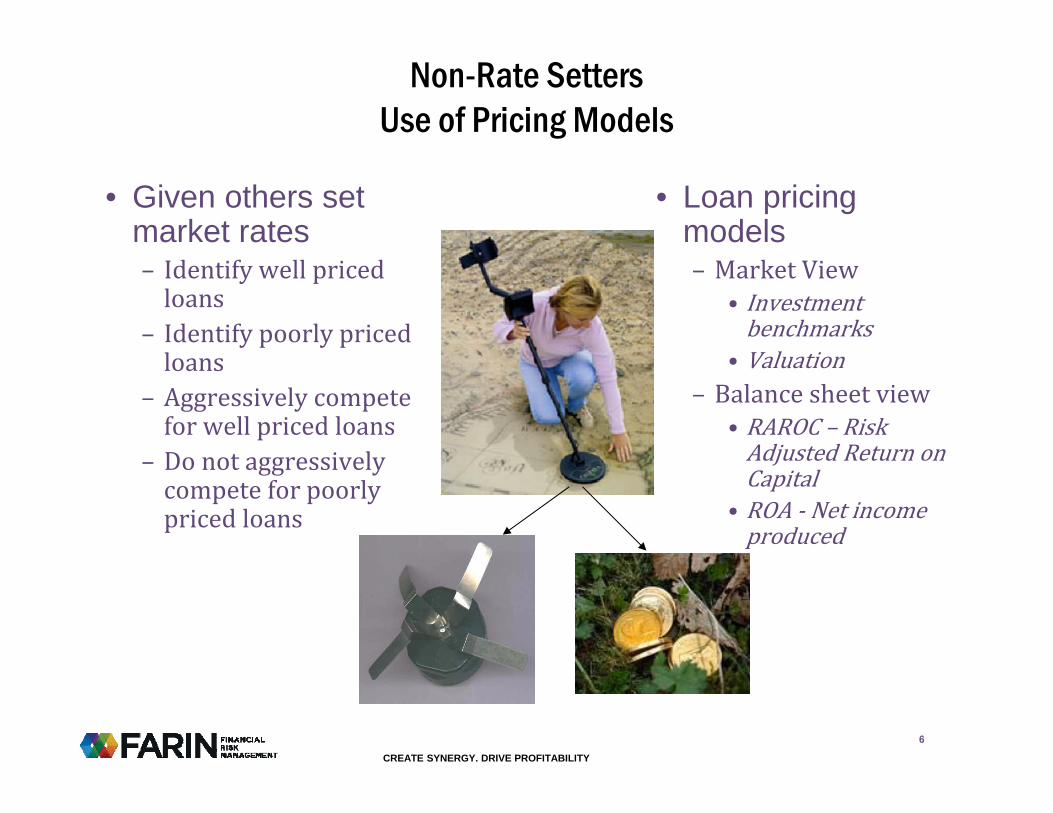
Investment Benchmark Comparison - CRE • 20 Yr FR amortizing
loan only 6 bp less profitable than 5/20 balloon
• Longer cash flows requires more IRR coverage
• Can a 50bp premium be collected from customer in exchange for certainty?
• Duration extends < 2 years
24
Investment Benchmarks 5/20 Balloon CRE20 Yr FR CRE
@4.5%Risk Free Rate 0.460% 0.460%
+ Int Rate Risk Adjust 0.937% 1.518%= Risk Free Match 1.397% 1.978%
+ Option Risk Adjust 0.750% 0.750%= Investment Benchmark 2.147% 2.728%
+ Credit Risk Adjust 0.250% 0.250%+ Expense Adjust 0.795% 0.775%
= Retail Equiv Benchmark 3.192% 3.753%Wtd Loan Yield 4.000% 4.500%
Spread to Benchmark 0.808% 0.747%-0.060%
Duration 3.42 5.31
Conclusion: 20 Yr FR fully amortizing CRE loan can be a profitable loan when compared
to investment alternatives. Covers the inherent risks and costs!
CREATE SYNERGY. DRIVE PROFITABILITY
25
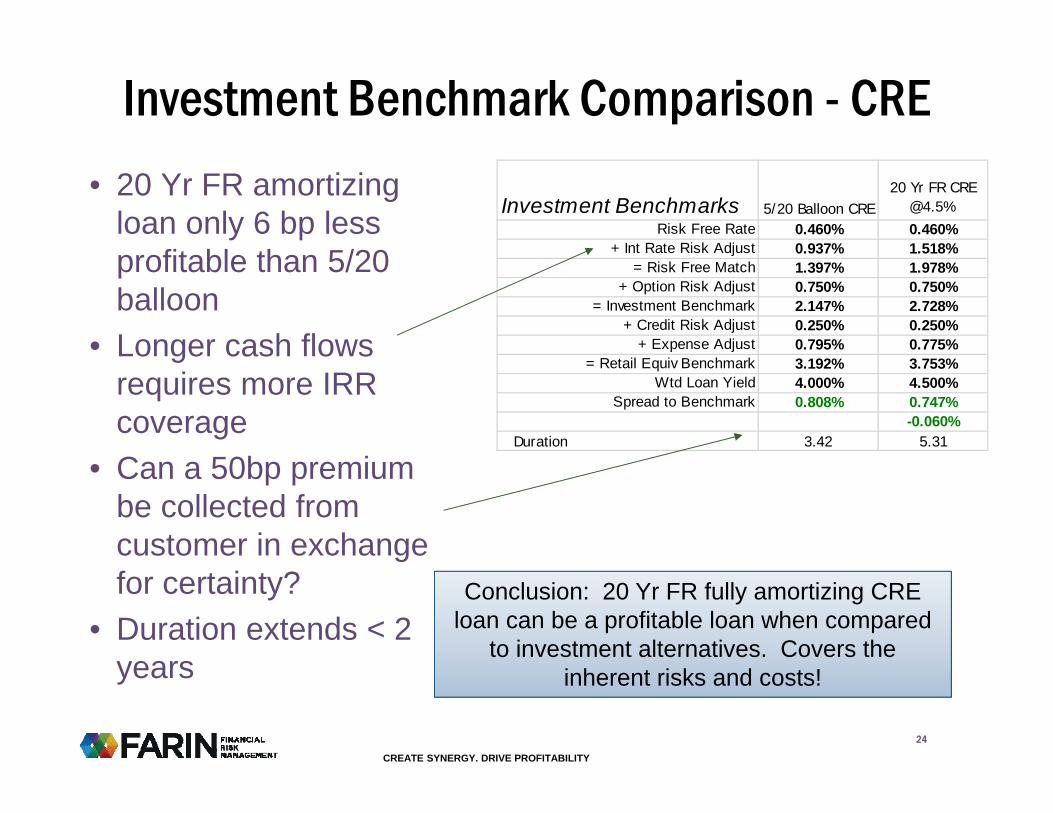
Valuation• Market rather than internal
benchmark• Compares market value of loan as
compared to book at time of origination.
• Most relevant when– Youaregoingtosellloanafterorigination.
– Whenyouaretryingtoimprovethefranchisevalueofyourinstitutionbyholdingwellpricedloans
• Required inputs– Cashflowcharacteristics– Riskfreecurve– Investmentbenchmarkcurve– Discountratecurve– Pricing– Ratesandfees– Operatingexpenses– Creditriskadjustment– Additionaloptionriskadjustments
• Calculated outputs– Marketvaluevsbookvalueofloan– Price– Withandwithoutoriginationfees– Test– Ispriceatorabove100 good orbelow100 bad ?
• Not considered– Fundingcostcurve– Capitalrequirement– RAROCGoal– InstitutionTaxRate
CREATE SYNERGY. DRIVE PROFITABILITY26
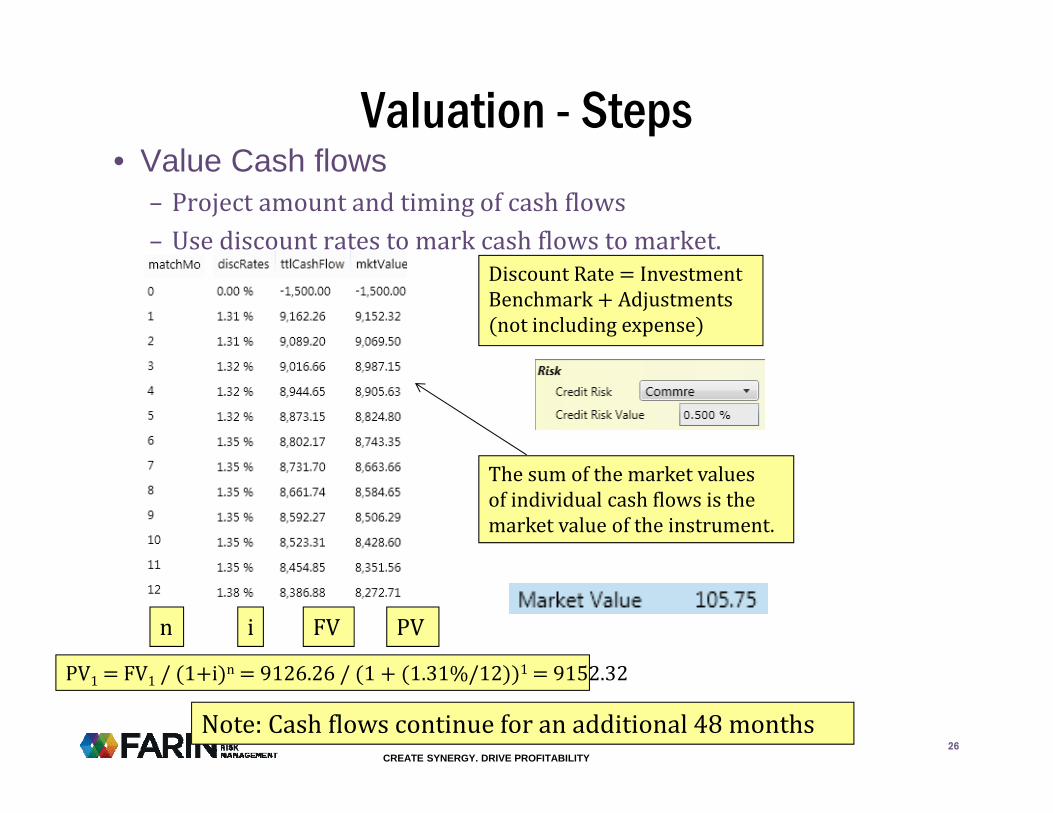
Valuation - Steps• Value Cash flows
– Projectamountandtimingofcashflows– Usediscountratestomarkcashflowstomarket.
n PVFVi
PV1 FV1 / 1 i n 9126.26/ 1 1.31%/12 1 9152.32
Note:Cashflowscontinueforanadditional48months
DiscountRate InvestmentBenchmark Adjustmentsnotincludingexpense
Thesumofthemarketvaluesofindividualcashflowsisthemarketvalueoftheinstrument.

CREATE SYNERGY. DRIVE PROFITABILITY27
Valuation - Steps
Book Amount of LoanWith FeesSum of Cash Flow Market Values100 * MV / BVWithout FeesSum of Cash Flow Market Values100 * MV / BV
Note: By Valuation standards, this is a well priced loan as its market value exceeds book at the time of origination.

CREATE SYNERGY. DRIVE PROFITABILITY
28
Internal Profitability Measures• How institutions make
money– LoanYield 6.0%– FundingCost 2.0%– Spread 4.0%
• Who owns the spread?– LoanOfficer?– FundingProvider?– TreasuryFunction?

CREATE SYNERGY. DRIVE PROFITABILITY
29
Funds Transfer Pricing• Internal profitability benchmark• Evaluates whether a loan is profitable
within context of balance sheet• Most relevant when
– Youaretryingtodecidewhetheryoucanmakemoneyoriginatingaloan
– Anytimeyouaretryingtoassestheprofitabilityofarelationship,productorprofitcenter
• Can focus on:– Dollarcontributiontoprofit ROA– Returnonrequiredcapital RAROC
• Required inputs– Cashflowcharacteristics– CostCurve– Pricing– Ratesandfees– Operatingexpenses– Creditriskadjustment– Additionaloptionriskadjustments– CapitalRequirement RAROC– CapitalGoal RAROC– InstitutionTaxRate
• Calculated adjustments– PretaxSpread $or%– Aftertaxspread $or%– RAROC– SpreadtoRAROCGoal– Test– Isspreadpositive good ornegative
bad ?• Not considered
– Riskfreecurve– Investmentbenchmarkcurve– CapitalRequirement ROA
CREATE SYNERGY. DRIVE PROFITABILITY
30
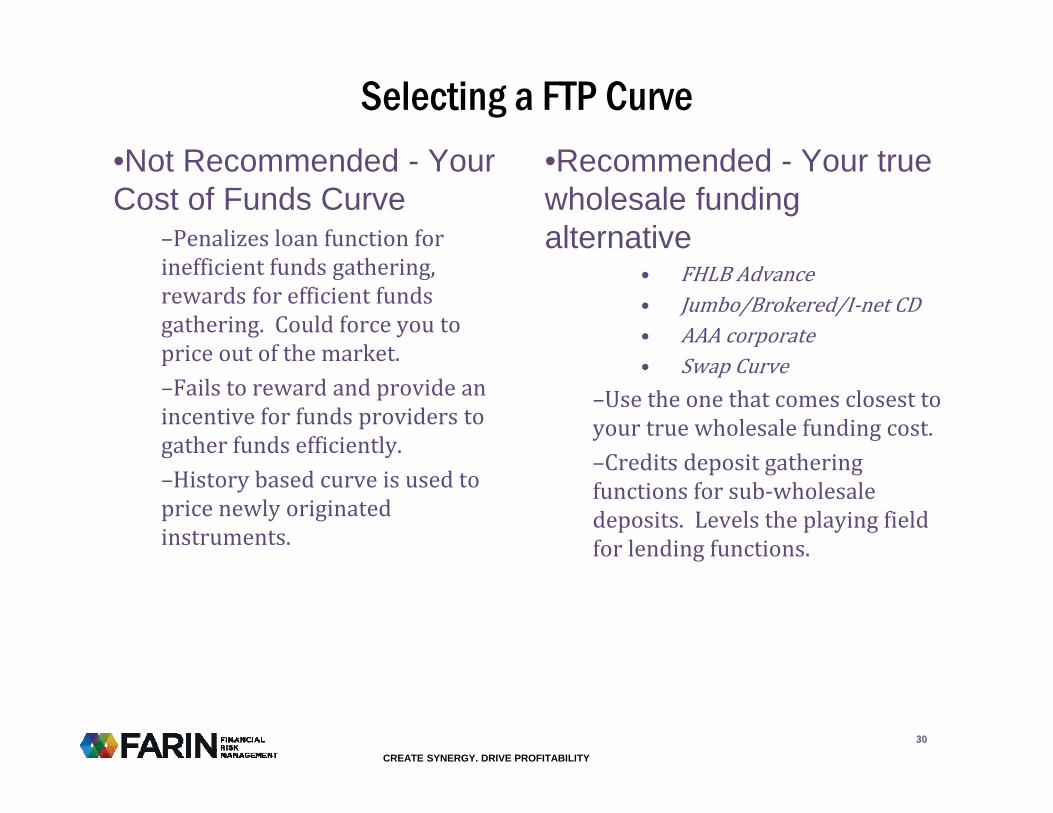
Selecting a FTP Curve •Not Recommended - Your Cost of Funds Curve
–Penalizesloanfunctionforinefficientfundsgathering,rewardsforefficientfundsgathering.Couldforceyoutopriceoutofthemarket.–Failstorewardandprovideanincentiveforfundsproviderstogatherfundsefficiently.–Historybasedcurveisusedtopricenewlyoriginatedinstruments.
•Recommended - Your true wholesale funding alternative
• FHLBAdvance• Jumbo/Brokered/I‐netCD• AAAcorporate• SwapCurve
–Usetheonethatcomesclosesttoyourtruewholesalefundingcost.–Creditsdepositgatheringfunctionsforsub‐wholesaledeposits.Levelstheplayingfieldforlendingfunctions.
CREATE SYNERGY. DRIVE PROFITABILITY
31
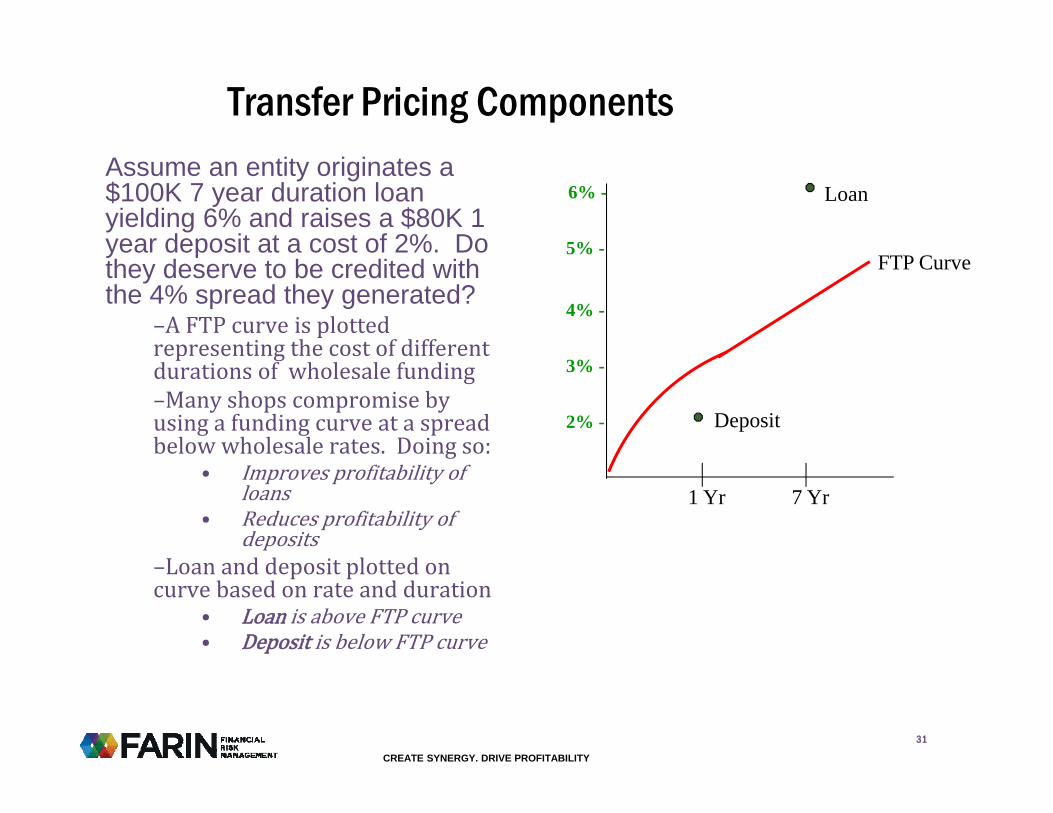
Transfer Pricing ComponentsAssume an entity originates a $100K 7 year duration loan yielding 6% and raises a $80K 1 year deposit at a cost of 2%. Do they deserve to be credited with the 4% spread they generated?
–AFTPcurveisplottedrepresentingthecostofdifferentdurationsofwholesalefunding–Manyshopscompromisebyusingafundingcurveataspreadbelowwholesalerates.Doingso:
• Improvesprofitabilityofloans
• Reducesprofitabilityofdeposits
–Loananddepositplottedoncurvebasedonrateandduration
• Loan isaboveFTPcurve• Deposit isbelowFTPcurve
FTP Curve
Loan
2% -
3% -
4% -
5% -
6% -
1 Yr 7 Yr
Deposit

CREATE SYNERGY. DRIVE PROFITABILITY
32
Transfer Pricing Components
•Spread - Deposit is credited to the entity. In this example:
–Depositratefor1yeardepositis2.0%–FTPratefor1yeardepositis3.0%.–Aspreadof1.0%on$80Kisallocatedtothedepositgatheringunit.
FTP Curve
Deposit
Loan
Spread - Deposit
2% -
3% -
4% -
5% -
6% -
1 Yr 7 Yr

CREATE SYNERGY. DRIVE PROFITABILITY
33
Transfer Pricing Components
•Spread – Rate Riskdue to mismatch is transferred to Treasury.
–OnlytheTreasurycanmanagethisriskandtheyneedthemargincontributiontodoso.–Inthisexample,theslopeintheyieldcurvebetweenthe1and7yearpointsis1% 4%‐3% .
FTP Curve
Deposit
Spread - Deposit
Spread – Rate Risk
2% -
3% -
4% -
5% -
6% -
1 Yr 7 Yr
Loan

CREATE SYNERGY. DRIVE PROFITABILITY
34
Transfer Pricing Components
•Spread – Option Risk is transferred to Treasury
–MostFTPsystemsignorethisrisk,butitisbecomingamoreandmoresubstantialportionoftheriskonfinancialinstitutionbalancesheets.–Tonottransferthisriskadjustmentwouldencouragelenderstograntoptionsinexchangeforhigherratesand/orvolumes.–Lenderscannotmanageoptionrisk.ThiscanonlybedonebyTreasuryandthespreadneedstobeavailabletobuytheriskprotection.
FTP Curve
Deposit
Loan
Spread - Deposit
Spread – Rate Risk
Spread – Option Risk
2% -
3% -
4% -
5% -
6% -
1 Yr 7 Yr
Inthisexample,spread‐optionriskof1%istransferredtotheTreasury.

CREATE SYNERGY. DRIVE PROFITABILITY
35
Transfer Pricing Components
•Spread – Loan is credited to lending unit. Spread includes credit risk which is unit’s responsibility to manage.
–Inthisexample,spread‐loanis1%on$100K.–Theentityretains2%ofthe4%spreadbetweenloanrateanddepositrate–Theother2%istransferredtoTreasurytoprovidespreadneededtomanagetheinstitution’sinterestrateriskandoptionrisk.
FTP Curve
Deposit
Loan
Spread - Deposit
Spread – Rate Risk
Spread – Loan
Spread – Option Risk
2% -
3% -
4% -
5% -
6% -
1 Yr 7 Yr

CREATE SYNERGY. DRIVE PROFITABILITY
36
Transfer Pricing Components
•Return on Equity(RAROC) for the transaction -is calculated by:
–Summingnetinterestincomecontributionfromloanandinvestment–Addingfeesandsubtractingallocatedoperatingexpenses.–NetincomeisdividedbycapitalrequiredtocalculateReturnonCapital ROE
•So FTP income can be measured with
–NetIncome ROA–RAROC
FTP Curve
Deposit
Loan
Spread - Deposit
Spread – Rate Risk
Spread – Loan
Spread – Option Risk
2% -
3% -
4% -
5% -
6% -
1 Yr 7 YrBalance Rate FTP Rate Spread Net Int Inc
Loan 100,000 6.00% 5.00% 1.00% 1,000 Deposit 80,000 2.00% 3.00% 1.00% 800 Total 1,800 Fees 500 Expenses 1,000 Net 1,300 Capital Requirement (8%) 8,000 ROE 16.25%

CREATE SYNERGY. DRIVE PROFITABILITY
Capital Allocation•Why assign a capital requirement to a loan?
–Relatesprofitabilityofanentityloan toaprimaryearningsmeasurementratio.–Allowsforadjustmentsinreturnbasedondifferentialcapitalneedsfordifferentloansandinvestments.
•Should you bother with a capital allocation model?
–Willaddingthislevelofcomplexityhaveamaterialeffectonanalysisordecisions?–Iscapitalaconstraint
• Regulatoryrequirements• Self‐imposedrequirements
•What capital allocation model should I use?
–LeverageRequirement•Corecapitalrequirement•Internalcapitalgoals
–RiskBasedRequirement•BaselIII•InternalModel
–Isuspectwe’llseeamovementtowardinternalmodels
37

CREATE SYNERGY. DRIVE PROFITABILITY
38
FTP Analysis - RAROCBalance weighted costs
Decision – Don’t make the loan !!!
RAROC GoalRAROC (ROE)
Assumed tax rate of 35%
Horizon
Lifetime

CREATE SYNERGY. DRIVE PROFITABILITY
39
FTP Analysis - Income
Decision ToolMake the loan !!!Note: The net incomefigure is converted into ROA
Ratio analysisrestated indollars

CREATE SYNERGY. DRIVE PROFITABILITY
RAROC (Lifetime) 5/20 Balloon CRE20 Yr FR CRE
@4.5%20 Yr FR CRE
@5%20 Yr FR CRE @4.5% w\fee
Wtd Loan Yield 4.000% 4.500% 5.000% 4.500%+Wtd Fees 0.000% 0.000% 0.000% 0.250%- Wtd Fund Bench 1.642% 2.330% 2.330% 2.330%- Option Risk 0.375% 0.375% 0.375% 0.375%- Credit Risk 0.250% 0.250% 0.250% 0.250%- Expense 0.792% 0.775% 0.775% 0.775%= Spread 0.941% 0.770% 1.270% 1.020%- Tax Adjust 0.000% 0.000% 0.000% 0.000%= After Tax Spread 0.941% 0.770% 1.270% 1.020%/ Capital Req. 10.000% 10.000% 10.000% 10.000%= ROE (RAROC) 9.413% 7.704% 12.70% 10.20%ROE Target 10.000% 10.000% 10.000% 10.000%ROE Spread -0.587% -2.296% 2.704% 0.204%
RAROC Comparison - CRE
• How can we make this loan more profitable for ROE?– OriginationfeeOrhigherrate?– Additionalrelationships?
• Finding options brings loan to a 10% ROE to meet target– Canyousellit?
40
CREATE SYNERGY. DRIVE PROFITABILITY
41
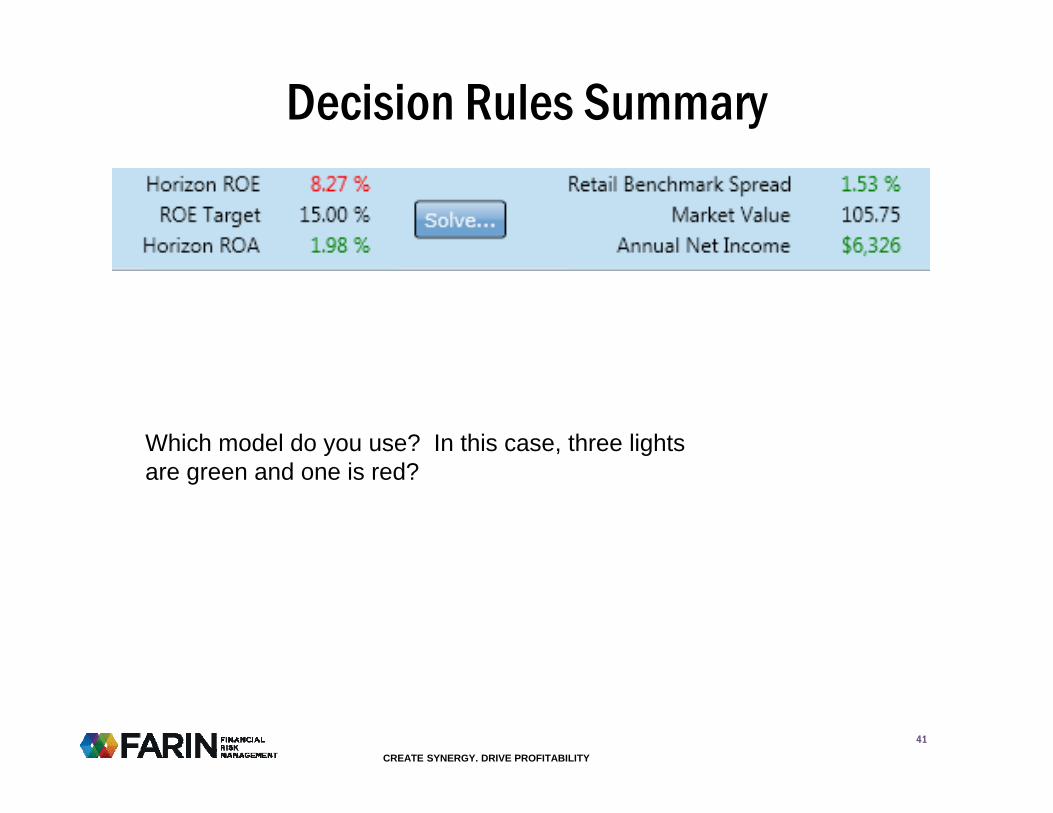
Decision Rules Summary
Which model do you use? In this case, three lights are green and one is red?

CREATE SYNERGY. DRIVE PROFITABILITY
42
Decision TreeLoan New A 48 Mo
Initial Reprice Is the spread to Investment Rate 6.500% 0.000% Benchmark positive? 0.851%Reprice 0 0 Better off putting moneyAmortize in investments.Mature 48Balance 1,000 CapitalOption 0.00% Constraint?Credit 0.15% Decision based on ROE (RAROC)Servicing 0.15% Don't make the
Decision based on loan. income contribution
Is the FTP loan profitadequate? 4.82
Does the FTP ROE beatthe target? -7.70%
Originate for Is the loan price sufficientlyportfolio. above book? 101.82
Don't make the Originate and loan. Sell.
No
NoYes
Yes
YesNo
No
No
Yes
Yes

CREATE SYNERGY. DRIVE PROFITABILITY
Session 2• Recorded Webinar
• Reviewof4decisionmodels• Modelingandtweakingexamples• iPriceInstruction– iPriceisbrowserbased– resultsonourservers.
– Loggingon– Buildingarelationship– Modelingaloan– Tweakingaloan
43
CREATE SYNERGY. DRIVE PROFITABILITY
Session 3• Recorded Webinar
• Modelingandtweakingexamples• iPriceInstruction
– Buildingarelationship– Modelingaloan– Addingloansanddepositstotherelationship– Tweakingtherelationship– Evaluatingrelationshipprofitability
44

CREATE SYNERGY. DRIVE PROFITABILITY
What We Will Provide• Student Resource
Page– RegistrationLink giveusoneworkingdaytoapproveyou
– LinkstotwoWebExon‐demandrecordings• Session3• Session4
– LinktodownloadGettingStartedGuide pdf totheLoanEdge software
• Software and project support from our support staff during normal business hours.
• You will need:– RelativelyfastPCwithinternetaccessandareasonablyuptodateoperatingsystemandbrowser
– SeeGettingStartedGuidefordetails.
45


![EY - Loan portfolio transaction markets this background, this edition of EY’s Loan Portfolio Transaction Markets considers the UK and Irish loan portfolio ljYfkY[lagf eYjc]lk Yf\](https://img.dokumen.tips/doc/110x75/5b1e5c467f8b9a397f8c05ea/ey-loan-portfolio-transaction-this-background-this-edition-of-eys-loan-portfolio.jpg)