Embed Size (px)
Citation preview
Load Test of a Large Bored Pile for the Golden Ears Bridge
Howard P. Thomas1), P.Eng., P.E., F.ASCE Jon Sinnreich2), A.M.ASCE
Michael Max Buehler3), P.Eng.
1) CH2M HILL, Metrotower II, Suite 2100, 4720 Kingsway, Burnaby, BC V5H 4N2.<[email protected]>
2) LOADTEST, INC., 2631-D NW 41st St., Gainesville, FL. <[email protected]>3) Bilfinger Berger (Canada) Inc., Suite 1210 – 1140 West Pender Street, Vancouver, BC V6E 4G1.
ABSTRACT Using Osterberg cells (O-cells), a load test was conducted on a large bored test pile constructed in 2006 for the Golden Ears Bridge project, east of Vancouver, British Columbia. Unique aspects of the test included depth and diameter of shaft, subsurface conditions, excavation technique, weight and length of rebar cage sections, cleanout of excavation, and positioning of the two O-cells. Using a special spherical grab, a 2.5-m-diameter shaft was excavated to 74.5 m depth using polymer slurry drilling mud. Presence of the O-cells assemblies hampered final cleanout of the excavation, and shaft integrity below the lower O-cell was affected by the presence of chunks of stiff clay, probably scraped from shaft sidewall during installation of the reinforcing cage. Despite this, testing of the shaft mobilized a combined toe and side shear resistance of over 62 MN and demonstrated that, for a top loading of 50 MN, the test pile would displace only 30 mm. From this, it was also concluded that noticeable creep of the shaft would not begin until top loading exceeded 30.5 MN. The test results allowed reducing the length of the main bridge piles and improved confidence in the foundation design.
INTRODUCTION
The values of side shear and end bearing resistance factors used for the design of bridge foundations are critically dependent upon the reliability of soil characterization data. In the absence of reliable data, the cost of a bridge foundation can become excessive because of conservative assumptions that must be used in foundation design. Thus common practice on larger projects, especially those with difficult or expensive foundations, dictates confirmation of soil characteristics and the pile-soil interaction by conducting at least one full-scale test. Full-scale testing allows a more reliable and economical foundation design. This paper describes a load test
274
Full-Scale Testing and Foundation Design

conducted on a large, bored pile for the Golden Ears Bridge (GEB) project to address questions regarding the design capacity and construction feasibility of foundations planned for a river crossing near Vancouver, British Columbia.
Project Description
The GEB is a new cable-stayed bridge over the Fraser River in the Lower Mainland of British Columbia, Canada. At the time of construction, the bridge had the distinction of being the longest, “extradosed” (a cross between girder and cable-stayed) bridge in North America. Excluding the approach structures, the bridge is 968 m wide at the river crossing and supported on six piers (four in the river). Each pier is supported on a group of 12 bored piles of 2.5 m diameter and 75 to 85 m in embedment depth. The total bridge and its approaches is 2.6 km.
GEB was designed and constructed by the Golden Crossing General Partnership (GCGP), as part of a design, build, finance, operate, maintain, and rehabilitate project. The owner of the project, the South Coast British Columbia Transportation Authority (commonly known as TransLink), contracted GCGP to operate and maintain the GEB and its associated road network of more than 14 km for 35 years. The Golden Crossing Constructors, a joint venture between Bilfinger Berger (Canada) Inc. and CH2M HILL Canada Limited, carried out design and construction services under an agreement with the GCGP. Construction commenced in 2006 and the six-lane GEB was opened to traffic in June 2009.
Foundation Design
The main bridge and south approach are supported on 2.5-m-diameter bored piles and the north approach is supported on 0.35 × 0.35 m rectangular, driven precast concrete piles. All piles are side-friction--bearing in soils consisting of normally-consolidated to lightly-overconsolidated soft to stiff clay overlain by loose to medium dense sand. Seismic demands on the bridge foundations are high in this seismically-active area. The bored piles required permanent steel casings through granular soils (Zone 1 as described below).
Scope and Purpose of Testing Program
For the GEB project, a full-scale test on a bored pile was designed to provide data necessary to develop design criteria for the bored piles at each of the major structures utilizing that type of foundation. Such structures included the Main Bridge, the South Approach (including ramps), and the Westcon Viaduct. As the reaction loads required for testing a 2.5-m-diameter, 74-m-long bored pile are very large, it was not practical to use a conventional top-loading test. Therefore, a two-level, Osterberg Cell (O-cell) test was proposed. Care was taken to select a geologically-representative site for the test.
Load Test of a Large Bored Pile for the Golden Ears Bridge
Howard P. Thomas1), P.Eng., P.E., F.ASCE Jon Sinnreich2), A.M.ASCE
Michael Max Buehler3), P.Eng.
1) CH2M HILL, Metrotower II, Suite 2100, 4720 Kingsway, Burnaby, BC V5H 4N2. <[email protected]>
2) LOADTEST, INC., 2631-D NW 41st St., Gainesville, FL. <[email protected]> 3) Bilfinger Berger (Canada) Inc., Suite 1210 – 1140 West Pender Street, Vancouver, BC V6E 4G1.
ABSTRACT Using Osterberg cells (O-cells), a load test was conducted on a large bored test pile constructed in 2006 for the Golden Ears Bridge project, east of Vancouver, British Columbia. Unique aspects of the test included depth and diameter of shaft, subsurface conditions, excavation technique, weight and length of rebar cage sections, cleanout of excavation, and positioning of the two O-cells. Using a special spherical grab, a 2.5-m-diameter shaft was excavated to 74.5 m depth using polymer slurry drilling mud. Presence of the O-cells assemblies hampered final cleanout of the excavation, and shaft integrity below the lower O-cell was affected by the presence of chunks of stiff clay, probably scraped from shaft sidewall during installation of the reinforcing cage. Despite this, testing of the shaft mobilized a combined toe and side shear resistance of over 62 MN and demonstrated that, for a top loading of 50 MN, the test pile would displace only 30 mm. From this, it was also concluded that noticeable creep of the shaft would not begin until top loadingexceeded 30.5 MN. The test results allowed reducing the length of the main bridgepiles and improved confidence in the foundation design.
INTRODUCTION
The values of side shear and end bearing resistance factors used for the design ofbridge foundations are critically dependent upon the reliability of soil characterization data. In the absence of reliable data, the cost of a bridge foundation can becomeexcessive because of conservative assumptions that must be used in foundation design. Thus common practice on larger projects, especially those with difficult or expensive foundations, dictates confirmation of soil characteristics and the pile-soilinteraction by conducting at least one full-scale test. Full-scale testing allows a more reliable and economical foundation design. This paper describes a load test
275Full-Scale Testing And Foundation Design
Full-Scale Testing and Foundation Design

SITE CONDITIONS
The Geological Survey of Canada map (Fig. 1) generally shows three types of sediments along the project alignment comprising 1) Fraser River sediments (Fc) containing over-bank silty to silt clay loam overlying sandy to silt loam, 2) Sumas drift sediments (Se) described as raised proglacial deltaic gravel and sand and 3) Capilano sediments (Cd and Ce) consisting of marine and glaciomarine stony (including till-like deposits) to stoneless silt loam to clay loam with minor sand and silt. Organic soils (SAb), including peat, are present close to where the main alignment crosses the CN rail line south of the river, and also to the south of the CP crossing north of the river.
Fig. 1 Surficial Geology Map showing the local distribution of surficial sediments along the GEB alignment
The soils at the main river crossing site and for approximately 2 km north and south were divided into two zones based on field investigation and laboratory testing. These zones listed in order of increasing depth correspond generally to what would be expected for a drowned river valley or fjord under post-glacial conditions and an advancing delta.
Zone 1 consists of recent varied deposits of sand, gravel, firm to soft clayey silt and organic silt, as well as some shallow peat filling in the eroded and previously submerged surface of Zone 2. The depth of this filling varies from up to 40 m at the
276 Full-Scale Testing And Foundation Design
Full-Scale Testing and Foundation Design

main crossing site to around 10 to 30 m on the north side and 20 to 25 m on the south side of the river. The present ground elevation is generally level (at about geodetic elevation +5 m), with a maximum of 1 to 2 m variation. The depth to the Fraser River bottom varies from 10 to 15 m below the bank level.
Zone 2 is composed mainly of silty clay with subzones of clayey silt and silt. The consistency of the zone varies generally from stiff at the top to very stiff to hard at depth. Thin layers of fine sand were noted throughout but particularly below about elevation -75 m (approx. 80 m depth) where thicker layers make up about 10% of the profile to the bottom of the field investigation. Based on project explorations extending as deep as El -127 m, no dense/hard bearing layer existed at the site.
TEST SITE
The test pile site was located on the south bank of the Fraser River, as the subsurface conditions at that location provided the best representation of the subsurface conditions along the alignment of the main bridge and the major structures to the south. The soil profile at the South River Bank test site is summarized in Table 1.
Table 1. Soil Profile at South River Bank Test Site
Depth Description Ground surface to approx. 20 m
Silty SAND and fine to medium grained SAND with some layers of sandy SILT
- very loose to loose (qt = 4 to 8 MPa) 20 m to 32 m Fine to medium SAND – medium dense
- includes silty sand layers from 30 to 36 m 32 m to 36 m Silty SAND to sandy SILT
- loose to medium dense (qt = 8 to 16 MPa) 36 m to 79 m Silty CLAY and clayey SILT with occasional fine sand seams
- firm to stiff, near-normally-consolidated to lightly-overconsolidated, w = 30-40%, LI = 0,2 to 0.4, Su/p’ = 0.23*
79 m to 120 m Silty CLAY and clayey SILT with intermittent layers of SAND - cohesive soils stiff to very stiff, near-normally-consolidated
to lightly-over-consolidated, Su/p’ = 0.23* *Su/p’ = ratio of undrained shear strength to vertical effective stress
Five cone penetration tests (CPT) and one deep borehole were conducted in the vicinity of the test pile. The groundwater table at the site was at approximately at 2.7 m below ground surface. Groundwater pressures in upper sand units were expected to be hydrostatic, whereas artesian pressures up to about 6 m head at 80 m depth had been measured during CPT dissipation tests. These diminished as the underside of the SAND soil unit was approached (at approx. 36 m depth).
SITE CONDITIONS
The Geological Survey of Canada map (Fig. 1) generally shows three types of sediments along the project alignment comprising 1) Fraser River sediments (Fc) containing over-bank silty to silt clay loam overlying sandy to silt loam, 2) Sumas drift sediments (Se) described as raised proglacial deltaic gravel and sand and 3) Capilano sediments (Cd and Ce) consisting of marine and glaciomarine stony (including till-like deposits) to stoneless silt loam to clay loam with minor sand andsilt. Organic soils (SAb), including peat, are present close to where the main alignment crosses the CN rail line south of the river, and also to the south of the CP crossing north of the river.
Fig. 1 Surficial Geology Map showing the local distribution of surficial sediments along the GEB alignment
The soils at the main river crossing site and for approximately 2 km north and south were divided into two zones based on field investigation and laboratory testing. These zones listed in order of increasing depth correspond generally to what would be expected for a drowned river valley or fjord under post-glacial conditions and an advancing delta.
Zone 1 consists of recent varied deposits of sand, gravel, firm to soft clayey silt and organic silt, as well as some shallow peat filling in the eroded and previously submerged surface of Zone 2. The depth of this filling varies from up to 40 m at the
277Full-Scale Testing And Foundation Design
Full-Scale Testing and Foundation Design
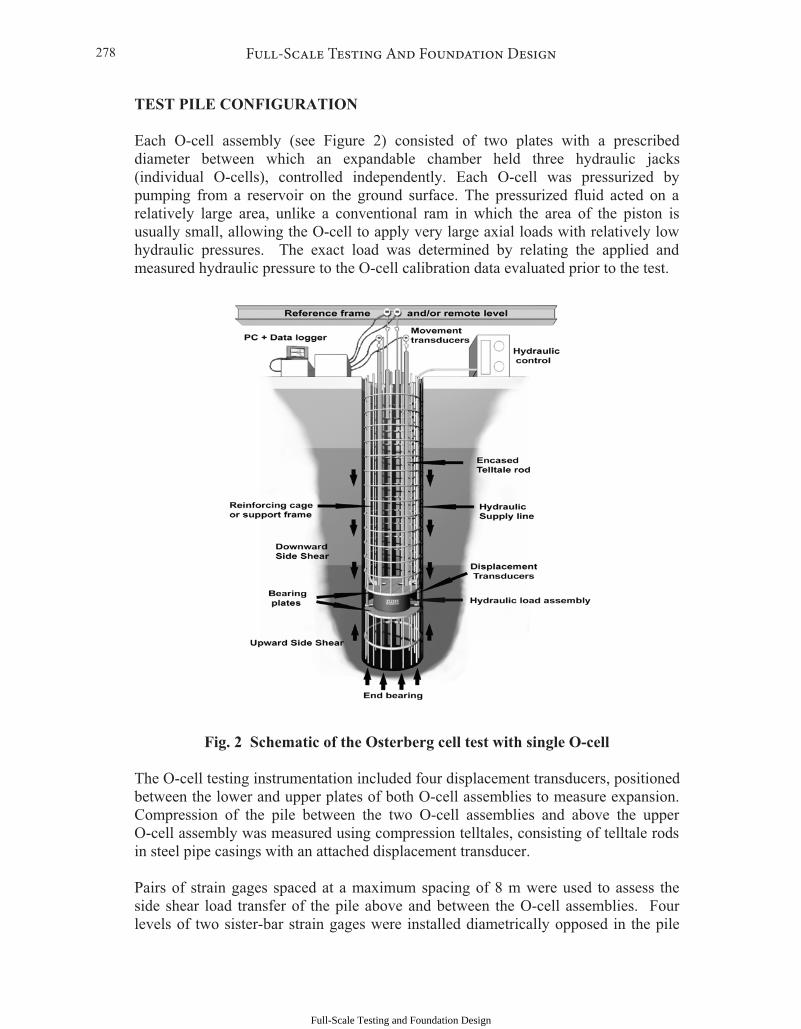
TEST PILE CONFIGURATION
Each O-cell assembly (see Figure 2) consisted of two plates with a prescribed diameter between which an expandable chamber held three hydraulic jacks (individual O-cells), controlled independently. Each O-cell was pressurized by pumping from a reservoir on the ground surface. The pressurized fluid acted on a relatively large area, unlike a conventional ram in which the area of the piston is usually small, allowing the O-cell to apply very large axial loads with relatively low hydraulic pressures. The exact load was determined by relating the applied and measured hydraulic pressure to the O-cell calibration data evaluated prior to the test.
Fig. 2 Schematic of the Osterberg cell test with single O-cell
The O-cell testing instrumentation included four displacement transducers, positioned between the lower and upper plates of both O-cell assemblies to measure expansion. Compression of the pile between the two O-cell assemblies and above the upper O-cell assembly was measured using compression telltales, consisting of telltale rods in steel pipe casings with an attached displacement transducer.
Pairs of strain gages spaced at a maximum spacing of 8 m were used to assess the side shear load transfer of the pile above and between the O-cell assemblies. Four levels of two sister-bar strain gages were installed diametrically opposed in the pile
278 Full-Scale Testing And Foundation Design
Full-Scale Testing and Foundation Design

between the lower and upper O-cells, and six levels of two sister-bar vibrating-wire strain gages were installed in the pile above the upper O-cells. To prevent development of suction, a water-filled vent pipe led up to the surface from each of the O-cell assemblies.
Figure 3 is a schematic diagram of the test pile including O-cells, strain gages, and a generalized soil stratigraphy. The O-cells were located at El -44.0 and El-70.5 m. Planning for the test included detailed analyses to locate and size the O-cells. These analyses required making numerous assumptions, which led to the conclusion that there would be a large uncertainly in the capacity of the pile. These uncertainties related to behavior of the soil, details of the construction, and the testing procedures.
Fig. 3 Test pile instrumentation
TEST PILE CONFIGURATION
Each O-cell assembly (see Figure 2) consisted of two plates with a prescribed diameter between which an expandable chamber held three hydraulic jacks (individual O-cells), controlled independently. Each O-cell was pressurized by pumping from a reservoir on the ground surface. The pressurized fluid acted on arelatively large area, unlike a conventional ram in which the area of the piston is usually small, allowing the O-cell to apply very large axial loads with relatively lowhydraulic pressures. The exact load was determined by relating the applied and measured hydraulic pressure to the O-cell calibration data evaluated prior to the test.
Fig. 2 Schematic of the Osterberg cell test with single O-cell
The O-cell testing instrumentation included four displacement transducers, positionedbetween the lower and upper plates of both O-cell assemblies to measure expansion. Compression of the pile between the two O-cell assemblies and above the upper O-cell assembly was measured using compression telltales, consisting of telltale rodsin steel pipe casings with an attached displacement transducer.
Pairs of strain gages spaced at a maximum spacing of 8 m were used to assess the side shear load transfer of the pile above and between the O-cell assemblies. Four levels of two sister-bar strain gages were installed diametrically opposed in the pile
279Full-Scale Testing And Foundation Design
Full-Scale Testing and Foundation Design

CONSTRUCTION OF TEST PILE
The general construction method for the test pile was as follows:
� A nominal 2,540-mm casing was vibrated to -22 m using internal grabbing where necessary to reduce friction on the inside face of the casing. The tip of the casing was then pressure grouted to minimize leakage during excavation. The casing extended to 6.75 m above ground level.
� Polymer slurry was added to the bore once ground water was reached, and a minimum head of 5 m was constantly maintained throughout the excavation process to preserve the borehole stability. This required casing projections as shown in Fig. 4a.
� A special 24-ton, 6-m-long spherical grab (see Fig. 4b) operated by crane was used to excavate the uncased portion of the pile to the specified toe level of elevation -74 m.
(a) Casing projections enable maintenance of head on slurry
(b) Spherical grab
Fig. 4 Construction Aspects
� The diameter and verticality of the uncased bore were checked periodically by LOADTEST Inc. using a 2-D sonar caliper device. The calipering revealed (Fig. 5a) that the base of the shaft was out of plumb relative to the bottom of the cased section by approximately 680 mm 46˚ East of South (less than one percent of the shaft length).
� After approximately 5 hours for settling of the slurry, a final pass with the grab was made to clean the bottom of the excavation using a gravel pump and airlifting.
� Steel reinforcement was installed with six Crosshole Sonic Logging (CSL) tubes per shaft. The rebar cage (Fig. 5a) with attached O-cell assemblies and instrumentation was installed using a large Liebherr 883 crane over the course of
280 Full-Scale Testing And Foundation Design
Full-Scale Testing and Foundation Design

approximately 8 hours. A dozen M57 rebar sections were joined by special mechanical couplers. Each cage weighed 25 tons.
(a) Caliper test results for test pile
(b) O-cell in Reinforcing Cage
Fig. 5 Installation Aspects
� Concrete was placed using a tremie pipe with the end of the pipe maintained at least 5 m below the top of concrete level. Concrete was delivered to the base of the pile under round-the-clock placement until the top of the concrete reached the ground elevation. Four hundred cubic metres of concrete were placed in the shaft over a period of nine hours.
� The excavation of the test pile began on May 16, 2006 and was completed with the final cleanout, the rebar cage installation, and the concreting on May 19, 2006.
TESTING PROCEDURE
The test was conducted on June 19, 2006, in two stages (see Fig. 6) as follows:
Stage 1: In the first stage the three 405-mm-diameter lower O-cells, with their base located 4.00 m above the toe of pile, were pressurized to assess the combined end bearing and lower side shear characteristics of the pile section below the O-cells, using the upper side shear above as reaction. The O-cells were pressurized in five equal loading increments to a bi-directional gross O-cell load of 7.13 MN. The loading was halted after load interval 1L-5 because of the large differential expansion of the O-cell assembly. In an attempt to correct the tilting, the hydraulic connection to cells “A” and “C” was closed off, and cell “B” was further pressurized.
The hydraulics were then opened, allowing all three O-cells to reach a hydraulic equilibrium of 18.6 MPa in one decrement. All three O-cells were then re-pressurized; however the assembly continued to open differentially. It was then decided to pressurize cell “B” only once again in order to correct the tilting and level the assembly in order to facilitate Stage 2a testing. O-cell “B” was pressurized to a
CONSTRUCTION OF TEST PILE
The general construction method for the test pile was as follows:
� A nominal 2,540-mm casing was vibrated to -22 m using internal grabbing wherenecessary to reduce friction on the inside face of the casing. The tip of the casingwas then pressure grouted to minimize leakage during excavation. The casing extended to 6.75 m above ground level.
� Polymer slurry was added to the bore once ground water was reached, and a minimum head of 5 m was constantly maintained throughout the excavation process to preserve the borehole stability. This required casing projections as shown in Fig. 4a.
� A special 24-ton, 6-m-long spherical grab (see Fig. 4b) operated by crane was used to excavate the uncased portion of the pile to the specified toe level ofelevation -74 m.
(a) Casing projections enable maintenance of head on slurry
(b) Spherical grab
Fig. 4 Construction Aspects
� The diameter and verticality of the uncased bore were checked periodically by LOADTEST Inc. using a 2-D sonar caliper device. The calipering revealed (Fig. 5a) that the base of the shaft was out of plumb relative to the bottom of the cased section by approximately 680 mm 46˚ East of South (less than one percent of the shaft length).
� After approximately 5 hours for settling of the slurry, a final pass with the grab was made to clean the bottom of the excavation using a gravel pump andairlifting.
� Steel reinforcement was installed with six Crosshole Sonic Logging (CSL) tubes per shaft. The rebar cage (Fig. 5a) with attached O-cell assemblies andinstrumentation was installed using a large Liebherr 883 crane over the course of
281Full-Scale Testing And Foundation Design
Full-Scale Testing and Foundation Design

maximum pressure of 46.5 MPa, at which point the differential opening of the assembly was minimized. The O-cells were then unloaded in four decrements.
Stage 2a: After unloading the lower O-cells, the upper O-cell assembly, located 26.50 m above the base of the lower O-cell assembly, was pressurized to assess the shear characteristics of the pile section between the two levels of O-cells by using the upper side shear as reaction. The lower O-cell hydraulics were allowed to drain, to minimize load transfer through the O-cells to end bearing. The upper O-cells were pressurized in 18 equal loading increments to a bi-directional gross O-cell load of 26.1 MN.
Fig. 6 Schematic diagram of O-cell loading
Stage 2b: After loading increment 2L-18, downward movement of the lower O-cell bottom plate indicated some mechanical transfer of load to the lower pile section. The loading of the upper O-cells continued so as to assess the shear characteristics of the pile section above the upper O-cells by using the side shear below and the end bearing as reaction. The upper O-cells were pressurized in two additional loading increments to a bi-directional gross O-cell load of 29.0 MN. The loading was halted after load interval 2L-20 because the upper side-shear was approaching ultimate capacity. The upper O-cells were then depressurized in four decrements, and the test was concluded.
The load increments were applied using the Quick Load Test Method for Individual Piles (ASTM D1143 Standard Test Method for Piles Under Static Axial Load). Each successive load increment was held constant for ten minutes by automatically adjusting the O-cell pressure. Additionally, the load was held constant for 30 minutes
Upper O-cell Closed
ExpandUpper O-cell
ExpandLower O-cell
Lower O-cell Open(allowed to drain)
STAGE 1 STAGE 2a STAGE 2b
Upper O-cell Closed
ExpandUpper O-cell
282 Full-Scale Testing And Foundation Design
Full-Scale Testing and Foundation Design

at nominal downward lower O-cell, downward upper O-cell and upward upper O-cell movements of 4, 8 and 12 mm, respectively. Table 2 below summarizes the three stages of loading:
Table 2. Multi-level testing stages
Stag
e LoadInterval
Upper O-cell Lower O-cell MaxQgross(MN)
O-cell Hydraulics
System
TotalExpansion
(mm)
MaxQgross(MN)
O-cell Hydraulics
System
TotalExpansion
(mm) 1 1L-1 to 1L-5 0 Closed -0.62 7.13 Pressurized +73.69 1 1L-6 0 Closed -0.81 8.08 Pressurized1 +125.39 2a 2L-1 to 2L-18 26.1 Pressurized +39.94 0 Draining +105.03 2b 2L-19 to 2L-20 29.0 Pressurized +76.766 0 Draining2 +104.72 NOTES: 1 Load increment 1L-6 for correction of tilt only. Cells “A”, “B” and “C” had different applied
hydraulic pressures, gross load is estimated. 2 Data indicated mechanical load transfer through lower O-cell to base.
ANALYSIS OF LOAD TEST RESULTS
In order to convert measured strains into loads, a pile stiffness (AE) was computed using the Tangent Stiffness method proposed by Fellenius (2001). Due to anomalous data, strain gauge levels 3, 6 and 10 were not considered in the analysis. The resulting load distribution is illustrated in Fig. 7.
-80
-70
-60
-50
-40
-30
-20
-10
0
10
0 5 10 15 20 25 30 35
Upper O-cell Load ( MN )
Elev
atio
n (
m )
Top of Pile
Bottom of Pile 2L-182L-2 2L-202L-4 2L-6 2L-8 2L-10
S. G. Level 9
S. G. Level 8
S. G. Level 7
S. G. Level 5
S. G. Level 4
S. G. Level 2
S. G. Level 1
Upper O-cell Points
2L-12 2L-162L-14
S. G. Level 3 Not Plotted
S. G. Level 6 Not Plotted
S. G. Level 10 Not Plotted
Fig. 7 Stage 2 load distribution curves
maximum pressure of 46.5 MPa, at which point the differential opening of the assembly was minimized. The O-cells were then unloaded in four decrements.
Stage 2a: After unloading the lower O-cells, the upper O-cell assembly, located 26.50 m above the base of the lower O-cell assembly, was pressurized to assess the shear characteristics of the pile section between the two levels of O-cells by using the upper side shear as reaction. The lower O-cell hydraulics were allowed to drain, to minimize load transfer through the O-cells to end bearing. The upper O-cells were pressurized in 18 equal loading increments to a bi-directional gross O-cell load of 26.1 MN.
Fig. 6 Schematic diagram of O-cell loading
Stage 2b: After loading increment 2L-18, downward movement of the lower O-cell bottom plate indicated some mechanical transfer of load to the lower pile section. The loading of the upper O-cells continued so as to assess the shear characteristics of the pile section above the upper O-cells by using the side shear below and the end bearing as reaction. The upper O-cells were pressurized in two additional loadingincrements to a bi-directional gross O-cell load of 29.0 MN. The loading was halted after load interval 2L-20 because the upper side-shear was approaching ultimate capacity. The upper O-cells were then depressurized in four decrements, and the test was concluded.
The load increments were applied using the Quick Load Test Method for Individual Piles (ASTM D1143 Standard Test Method for Piles Under Static Axial Load). Each successive load increment was held constant for ten minutes by automatically adjusting the O-cell pressure. Additionally, the load was held constant for 30 minutes
Upper O-cell Closed
ExpandUpper O-cell
ExpandLower O-cell
Lower O-cell Open(allowed to drain)
STAGE 1 STAGE 2a STAGE 2b
Upper O-cell Closed
ExpandUpper O-cell
283Full-Scale Testing And Foundation Design
Full-Scale Testing and Foundation Design

The unit shear analysis used the measured O-cell displacements, the measured elastic compression of each pile section, the measured strains and the computed pile stiffness. The pile was divided into a number of segments, with either O-cell assembly, strain gage pair or the top of pile at each zone boundary. The unit shear was computed as the difference in loads at the boundaries of the segment (less segment buoyant weight, if the load was applied upward), divided by the shear area of the segment. The displacement of each segment was then measured at the higher-loaded boundary, minus half of the elastic compression of the segment.
A top load-displacement plot was derived using the t-z method (Meyer et al. 1975). The inputs for the t-z method were the unit shear and end bearing curves, along with computed pile properties. Results of this analysis produced a top-load-displacement plot for the pile.
O-cell testing provides a method for evaluating that load beyond which a top-loaded drilled pile might experience significant unwanted creep behavior. The analysis is derived from the method of the pressuremeter test (PMT) creep analysis (see ASTM D4719). A top-loaded pile will not begin to exhibit significant creep, until all components begin creep movement. This will occur at the maximum of the movements required to reach the creep limit for each component. Based on the results of the test, significant creep for the test pile will not begin until a top loading exceeds 30.5 MN by some unknown amount.
IMPACT OF CONSTRUCTION TECHNIQUE
The purpose of the polymer slurry was to maintain a stable hole and prevent sloughing of silty or sandy layers. Suitable admixtures and their concentrations were planned in advance but could be varied on site to address the conditions encountered. The slurry especially relied on excess head (see Fig. 4) rather than specific gravity for its effectiveness. The deep, mudded hole successfully stood open for 14 hours for cleaning and for installation of the coupled, reinforcing cage segments.
The downward load-displacement of the lower O-cell during Stage 1 testing showed lower-than-expected end-bearing stiffness. This was probably due to soil debris and mud at the test pile toe and related non-uniform loading of the lower O-cell of the test pile. This debris seems to have been scraped off the sides of the shaft by the rebar cage, as it was being lowered into the excavation. This assumption is borne out by the fact that tilting (non-uniform expansion of the O-cells) occurred across the O-cell assembly during Stage 1 loading, which ultimately halted the loading prematurely. However, the tilting was limited to the bottom plate.
During and after excavation, the open test shaft was measured using a sonar caliper device in order to generate a profile of the actual shaft shear area and volume. Hole diameter varied from 2.5 to 2.8 m and overall out of plumb was only 0.86 percent. Figure 8 compares the nominal, calipered and poured concrete volumes. The calipered shear area was used in the subsequent analysis of test data.
284 Full-Scale Testing And Foundation Design
Full-Scale Testing and Foundation Design

-80
-70
-60
-50
-40
-30
-20
-10
00 50 100 150 200 250 300 350 400 450
Concrete Volume ( m3 )
Dep
th (
m )
NominalCaliperedPoured
Fig. 8 Comparison of nominal, calipered and poured (actual) shaft volumes
Using the nominal shaft profile would have overestimated the computed maximum unit shear values by up to 11 percent in the nine shear zones. This comparison highlights the importance of maintaining an accurate concreting log, especially of a test pile. In the absence of good caliper data, the concrete log may be used to estimate shear areas for more accurate test data analysis.
CAPACITY COMPARISON WITH DESIGN METHODS
Applicable references on design and testing of bored piles include Fellenius (2006) and the Canadian Foundation Engineering Manual (2006). However, experience was lacking in the Fraser Lowland basin regarding load-carrying capacity of bored friction piles. Based on the O-cell and strain gage data from the GEB load test, Figure 9a depicts the unfactored available side shear resistance as a function of depth for the test pile.
Three methods calibrated to the test results were used for the project foundation design. These were the effective stress Beta method, a modified LCPC CPT method, and API alpha method. Below 36 m, the unit weight of water was increased from 9.8 to 10.87 kN/m3 to account for the artesian pressure. Detailed results of this curve-fitting exercise were described by Amini et al. (2008).
Based on the full-scale testing, the available side shear resistance was found to be significantly greater than expected. Alpha values recommended by FHWA (1999) significantly underestimated the side-friction capacity of bored piles in clay at this site. It was concluded that the pile construction procedures used for GEB resulted in side-friction resistances significantly higher than bored piles in the FHWA database.
The unit shear analysis used the measured O-cell displacements, the measured elasticcompression of each pile section, the measured strains and the computed pilestiffness. The pile was divided into a number of segments, with either O-cell assembly, strain gage pair or the top of pile at each zone boundary. The unit shear was computed as the difference in loads at the boundaries of the segment (less segment buoyant weight, if the load was applied upward), divided by the shear area of the segment. The displacement of each segment was then measured at the higher-loaded boundary, minus half of the elastic compression of the segment.
A top load-displacement plot was derived using the t-z method (Meyer et al. 1975). The inputs for the t-z method were the unit shear and end bearing curves, along with computed pile properties. Results of this analysis produced a top-load-displacementplot for the pile.
O-cell testing provides a method for evaluating that load beyond which a top-loaded drilled pile might experience significant unwanted creep behavior. The analysis isderived from the method of the pressuremeter test (PMT) creep analysis (see ASTM D4719). A top-loaded pile will not begin to exhibit significant creep, until all components begin creep movement. This will occur at the maximum of themovements required to reach the creep limit for each component. Based on theresults of the test, significant creep for the test pile will not begin until a top loadingexceeds 30.5 MN by some unknown amount.
IMPACT OF CONSTRUCTION TECHNIQUE
The purpose of the polymer slurry was to maintain a stable hole and prevent sloughing of silty or sandy layers. Suitable admixtures and their concentrations were planned in advance but could be varied on site to address the conditions encountered. The slurry especially relied on excess head (see Fig. 4) rather than specific gravity for its effectiveness. The deep, mudded hole successfully stood open for 14 hours for cleaning and for installation of the coupled, reinforcing cage segments.
The downward load-displacement of the lower O-cell during Stage 1 testing showed lower-than-expected end-bearing stiffness. This was probably due to soil debris and mud at the test pile toe and related non-uniform loading of the lower O-cell of the test pile. This debris seems to have been scraped off the sides of the shaft by the rebar cage, as it was being lowered into the excavation. This assumption is borne out by the fact that tilting (non-uniform expansion of the O-cells) occurred across the O-cell assembly during Stage 1 loading, which ultimately halted the loading prematurely. However, the tilting was limited to the bottom plate.
During and after excavation, the open test shaft was measured using a sonar caliper device in order to generate a profile of the actual shaft shear area and volume. Hole diameter varied from 2.5 to 2.8 m and overall out of plumb was only 0.86 percent. Figure 8 compares the nominal, calipered and poured concrete volumes. Thecalipered shear area was used in the subsequent analysis of test data.
285Full-Scale Testing And Foundation Design
Full-Scale Testing and Foundation Design

IMPACT OF TEST RESULTS ON DESIGN AND CONSTRUCTION
Based on the local conditions and utilizing the calibrated design methods, similar relationships were developed by extrapolation for design for each of the six bridge piers. However, even within a single pier, the design pile lengths varied depending on the static and dynamic loads on each pile in the group.
Due to the disturbed base conditions of the test shaft, the measured end bearing was lower than anticipated. Based on the undisturbed shear strength of the clay in the vicinity of the pile tip, the measured toe resistance was only 37% of that which was expected. The design for the production piles for the bridge conservatively adopted a low end-bearing value for ultimate limit states with the proviso that earthquake-induced displacements of 150 mm could be tolerated without collapse of the structure.
(a) Pile Shaft Resistance (b) Pier M2 Under Construction
Fig. 9. Pile Test Results and Final Pier Construction [Data for (a) from Amini et al. (2008).]
Figure 9b depicts one of the main bridge piers under construction. The main bridge bored piles are 2.4-2.5 m in diameter and 75-85 m in length. Seismic design generally governed pile reinforcement and size requirements. The 475-year return period loading generally controlled the pile lengths. A special template was first floated into place at each of the pier locations. Supported initially on temporary driven spudpiles, this template served first as a working platform, then at the base of the pier. The upper portion of the piles (within the alluvial soil layers) were excavated and constructed from a barge within a permanent steel casing (OD 2540 mm, 20 mm thick). The lower portion of the piles, within the cohesive soil layers, was excavated and constructed without the use of a steel casing.
286 Full-Scale Testing And Foundation Design
Full-Scale Testing and Foundation Design

The design called for very heavy rebar cages using T50 rebar. Rigorous quality control procedures were followed and cleanout of the shafts was effectively accomplished in the 60 production piles, which were not obstructed by the O-cells. From analysis of moments and shears in the piles under seismic loading, a waiver was obtained allowing the reinforcing cages to be stopped short of full depth based on the transition point from plastic to elastic ground deformations. This reduced both scraping of the hole wall and the time required to install the cages.
OBSERVATIONS AND CONCLUSIONS
Accepted design methods underestimated the side friction resistance mobilized by the Golden Ears Bridge test pile. The test provided important information, previously lacking in the region, on available side friction resistance of bored piles in deep lacustrine deposits, also on the important effects of construction methods.
� Driven piles had been used traditionally in the Fraser River Lowlands of the Lower Mainland of British Columbia. The GEB test pile confirmed the feasibility of constructing largely-uncased bored piles in the deep, unconsolidated fine-grained deposits present there.
� Successful use of polymer slurry requires continuously maintaining an excess head via projecting surface casing. Special scaffolding and a work platform were required on the GEB project for the monitoring and access. This also required sealing around the casing. The amount of excess head needed also depends on artesian pressures in the ground.
� Even if sonar calipering is done, concrete volume placed and concrete surface level should be continuously monitored, as a cross-check on shaft diameter variations
� Testing of the test pile mobilized a combined toe and side shear resistance of over 62 MN and demonstrated that, for a top loading of 50 MN, the test pile would displace only 30 mm.
� However, presence of O-cells in a test shaft can hamper final cleanout. This in turn can cause a “soft toe” with reduced end-bearing capacity. This isn’t an issue for production piles.
� No decrease in side friction resistance with axial movement was observed in the GEB test. This behavior affects how end-bearing and side shear resistance may be combined in the design.
� Hydraulic jacks with longer 230 mm stroke are now available. These should be considered for use in O-cells near the base of large-diameter shafts.
Based on accepted design methods, preliminary design had indicated that foundations for the GEB would be both deep and costly. The test results helped to reduce the length of the main bridge piles and improve confidence in the foundation design.
As a postscript, too late for the GEB project, a special supplement to the Canadian Highway Bridge Design Code was issued in June 2006, which allowed resistance
IMPACT OF TEST RESULTS ON DESIGN AND CONSTRUCTION
Based on the local conditions and utilizing the calibrated design methods, similarrelationships were developed by extrapolation for design for each of the six bridge piers. However, even within a single pier, the design pile lengths varied depending on the static and dynamic loads on each pile in the group.
Due to the disturbed base conditions of the test shaft, the measured end bearing was lower than anticipated. Based on the undisturbed shear strength of the clay in the vicinity of the pile tip, the measured toe resistance was only 37% of that which was expected. The design for the production piles for the bridge conservatively adopted a low end-bearing value for ultimate limit states with the proviso that earthquake-induced displacements of 150 mm could be tolerated without collapse of the structure.
(a) Pile Shaft Resistance (b) Pier M2 Under Construction
Fig. 9. Pile Test Results and Final Pier Construction [Data for (a) from Amini et al. (2008).]
Figure 9b depicts one of the main bridge piers under construction. The main bridgebored piles are 2.4-2.5 m in diameter and 75-85 m in length. Seismic design generally governed pile reinforcement and size requirements. The 475-year return period loading generally controlled the pile lengths. A special template was first floated into place at each of the pier locations. Supported initially on temporary driven spudpiles, this template served first as a working platform, then at the base of the pier. The upper portion of the piles (within the alluvial soil layers) were excavated and constructed from a barge within a permanent steel casing (OD 2540 mm, 20 mmthick). The lower portion of the piles, within the cohesive soil layers, was excavatedand constructed without the use of a steel casing.
287Full-Scale Testing And Foundation Design
Full-Scale Testing and Foundation Design

factors as high as 0.7 for design of deep foundations. This would have allowed for some further shortening of the deep river piles.
ACKNOWLEDGEMENTS
The GEB load test was a team effort. The authors wish to thank colleagues at CH2M HILL, Bilfinger Berger, LOADTEST, Inc., Trow Associates, and to Bengt Fellenius for his assistance in planning and interpreting the results of the test. Thanks also to TransLink for permission to publish this paper. At the same time, the views expressed herein are solely those of the authors.
REFERENCES
Amini, A., Fellenius, B. H., Sabbagh, M., Naesgaard, E. and Buehler, M. (2008), “Pile loading tests at Golden Ears Bridge”, 61st Canadian Geotechnical Conference, Edmonton, AB, September 21-24, 2008.
ASTM Standard D1143 (2007). Standard test methods for deep foundations under static axial compressive load. American Society for Testing and Materials, West Coshohocken, PA, USA.
ASTM Standard D4719 (2007). Standard test methods for prebored pressuremeter testing in soils. American Society for Testing and Materials, West Coshohocken, PA, USA.
Canadian Foundation Engineering Manual (2006), Fourth Edition, Canadian Geotechnical Society, 488 p.
Canadian Highway Bridge Design Code S6-00 and Supplement dated June 2006. Fellenius, Bengt H. (2001), “From strain measurements to load in an instrumented
pile,” Geotechnical News, March 2001, pp.35-38. Fellenius, Bengt H., (2006), Basics of foundation design. Electronic Edition.
wwwFellenius.net. 275 p. Meyer, P. L., Holmquist, D. V. and Matlock, H. (1975). “Computer predictions for
axially-loaded piles with non-linear supports,” Proceedings of the 7th Offshore Technology Conference, Houston, Texas, Paper No. 2186.
O’Neill, M.W. and Reese, L.C. (1999), Drilled shafts: Construction procedures and design methods, FHWA-IF-99-025. 758 p.
288 Full-Scale Testing And Foundation Design
Full-Scale Testing and Foundation Design