Embed Size (px)
Citation preview
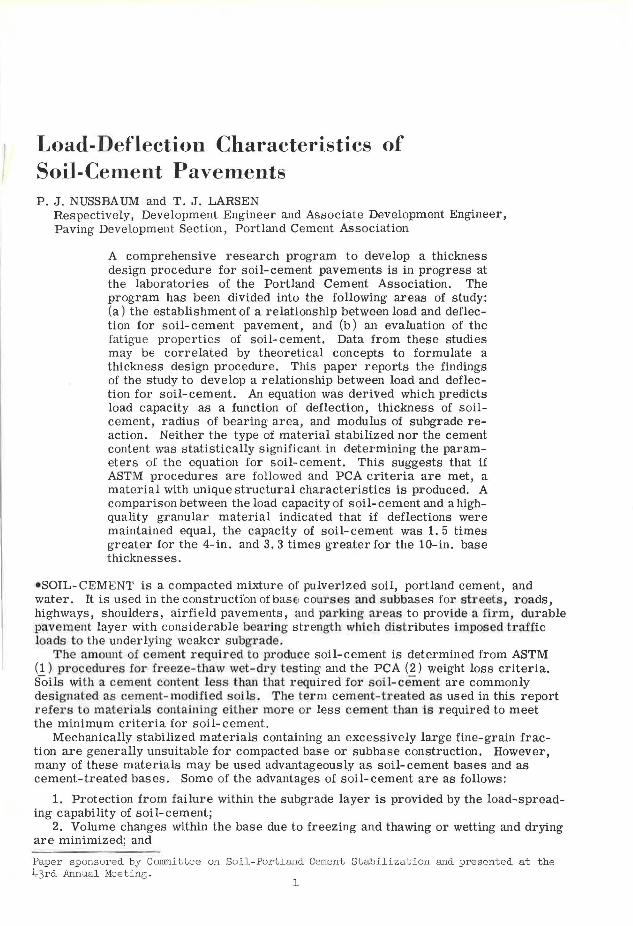
Load-Deflection Characteristics of Soil-Cement Pavements P. J . NUSSBAUM and T. J. LARSEN
Respectively, Development Engineer and Associate Development Engineer, Paving Development Section, Portland Cement Association
A comprehensive research program to develop a thickness design procedure for soil-cement pavements is in progress at the laboratories of the Portland Cement Association. The program has been divided into the following areas of study: (a) the establishment of a relationship between load and deflection for soil- cement pavement, and (b) an evaluation of the fatigue properties of soil-cement. Data from these studies may be correlated by theoretical concepts to formulate a thickness design procedure. This paper reports the findings of the study to develop a relationship between load and deflection for soil-cement. An equation was derived which predicts load capacity as a function of deflection, thickness of soilcement, radius of bearing area, and modulus of subgrade reaction. Neither the type of material stabilized nor the cement content was statistically significant in determining the parameters of the equation for soil-cement. This suggests that if ASTM procedures are followed and PCA criteria are met, a material with unique structural characteristics is produced. A comparison between the load capacity of soil-cement and a highquality granular material indicated that if deflections were maintained equal, the capacity of soil-cement was 1. 5 times greater for the 4-in. and 3. 3 times greater for the 10-in. base thicknesses.
•SOIL-CEMENT is a compacted mixture of pulverized soil, portland cement, and water. It is used in the constructfon of base courses and subbases for streets, roads, highways, shoulders, airfield pavements, and pa1·king areas to provide a firm, durable pavement layer with considerable bearing strength which distributes imposed traffic loads to the under lying weaker subgrade.
The amorn1t of cement required to produce soil- cement is determined from ASTM (1) procedures for freeze-thaw wet-dry testing and the PCA (2) weight loss criteria. Soils with a cement content less than that required for soil-cement are commonly designated as cement-modifi ed soils. The term cement-treated as used in this report refers to materials containing either more or less cement thru1 is required to meet the minimum criteria for soil-cement.
Mechanically stabilized materials containing an excessively large fine-grain fraction are generally unsuitable for compacted base or subbase construction. However, many of these materials may be used advantageously as soil- cement bases and as cement-treated bases. Some of the advantages of soil-cement are as follows:
1. Protection from failure within the subgrade layer is provided by the load-spreading capability of soil-cement;
2. Volume changes within the base due to freezing and thawing or wetting and drying are minimized; and
Paper sponsored by Committee on Soil-Portland Cement Stabilization and presented at the 43rd Annual Meet ing .
1

2
3. The strength of a soil-cement base provides a stable working platform for construction operations.
SCOPE AND OBJECTIVES OF PROGRAM
Data are reported from load-deflection tests on 34 panels, each of which was 10 x 10 ft or larger. Of these panels, 28 were constructed with the cement requirement for soil-cement and six contained higher or lower cement contents. For comparative purposes, tests were also made on six mechanically stabilized bases constructed from a high-quality granular material.
Principal controlled variables of the test program were applied load, magnitude of deflection, thickness of base, strength of subgrade, size and shape of loading plate, and soil type or cement content. Secondary variables were included in indoor and outdoor tests to evaluate the effect of exposure conditions and tests both with and without a 1-in. thick flexible surface to determine the effect of a thin wearing course on load capacity.
The long-range objective of the inv estigation is the development of a thickness design procedure for soil-cement. This paper is concerned with the load-deflection characteristics of cement- treated materials and has the following specific objectives:
1. To determine the significant variables affecting the load-deflection response of soil-cement test panels;
2. To develop an equation describing the load-deflection relationship for soil-cement bases in terms of the significant variables;
3. To determine the effect of cement content on the load capacity of cement-treated soils constructed with cement contents above and below that required for soil-cement; and
4. To compar e the load response characteristics of soil- cement to a high-quality granular material.
TABLE J
LOAD TEST PROGRAM
Base Bas e Subgrade Thi ckness Plate R:ld iu.s (in . )a
Type Mat . T ype Group (in,)
12 15 Ovals
Soil-cemen t A 4 7
10
n A 7
10
m A 4 7
10
IV B d
10
v c 4 x x x 7 (x) (x i (x )
10
v A 4 7 x x
JO x 13
v D 4 x x x x x 7 (x ) (x) (x) M (x )
10 x v D 4 x
7 x 10 x " 13 x
Ce ment-treated v A I x J x k x x
VI A
" Granular VII A 4
7 x 10
Vil B p 4 x 7 x
10
it(x) • l1)l'Ut1i. ;.Q .

N
r:il ....:i i:o < ~
Cl)
....:i < iil r:il ~
~ r:il
~ i:o Ii< 0 Cl)
r:il H
~ r:il p..
~ p..
....:i H 0 Cl)
1i 0
.OCO,.....'<l',ON Cl! ,.._.._..I,_. I ,..... '<!' '<!' N,..... C:O,.....
I I I I I I I
<<<<<<<
C:O'<!'C:OIDIDID ...... NO,.....NN,.....'<I' T"""'l,..-tT"""'IT"""'IT"""'IT"""'IT"""'I
C:OMt-C:OIDID • • • • • • I
'<l'M<X>IDIDCO ......
....... O>IDN 00 M 0
T"""'l T"""'l 1""""'1 T"""'l T"""'l T"""'I
COt-tOIDCOIDtO NO,.....NN,.....M T"""IT"""'IMT"""'IT"""'IT""'IT"""'I
LOAD PROGRAM AND TEST PROCEDURE
The load program includes test on panels made from soil-cement, cementtreated, and granular base materials.
3
The panels were 4, 7, 10 and 13 in. thick and were constructed from seven different soil types on four different subgrade materials. Loads were applied at the panel interior with circular bearing plates of 6-, 8-, 12-, or 15-in. radius or with a pair of oval plates spaced 14 in. center to center to simulate a dual-tire wheel assembly. The major and minor axes of each oval plate were 11. 5 and 7 in. , respectively.
Because of the numerous variables, it was not feasible to conduct the program to fit a complete factorial; therefore, the load test program given in Table 1 was designed to emphasize those combinations of variables considered most important.
The load test procedure included the application of seven preloads to eliminate some of the inelastic deformation of the subgrade, thus reproducing better the behavior of an in-service pavement. Deflection under the preload was limited to 0. 03 in. Loads for each test were applied in increments to a deflection of 0. 05 in. This limit was set to preserve the integrity of the test panels for loading with other plate diameters. In a few cases, the O. 05-in. deflection was not attained because of the load limits of the reaction system. Deflections at each load increment were read when the rate of settlement was less than 0. 001 ipm.
MATERIALS AND CONSTRUCTION
Base Materials
Test panels were constructed from soil types I through V at the cement content determined necessary from ASTM test procedures and PCA weight-loss criteria, and from soil types V and VI with cement contents greater and less than those required to meet minimum requirements for soil-cement. The standard density, optimum moisture, and required cement content, together with the placement conditions for each base material, are given in Table 2. The standard density varied from 107 to 128 pcf, the optimum moisture content from 9. 6 to 15. 5 percent, and the required

4
100
90 Base Materia I
80 +-
~ 70 (lJ
3: 60 >.
_o
~ 50
4- 40 +-c (lJ 30 u ..__ (lJ
0.... 20
10
0 .005
ICLAYI
+..c
100
90
80
.~70 (lJ
3:
>. .D
60
..__ 50 (lJ
c: ;;: 40 +-
~ 30 u ..__ (lJ
0.... 20
10
.074 .42 2 .0 19.1 Particle Size - mm.
S ILT I F INE SANDI COA RSE S. I GRAVEL
Figure l . Gradation of cohesive bases .
Q .____,l.,-__..=-~~~....,....-~~~_._~~~_....~~~~~__,
.0 1 .074 .42 2.0 19.1 Pa rt i c I e Size - m m.
SILT IFI NE SAND lcoARSE s . J GRAVEL
Figure 2 . Gradation of cohesionless bases .

TABLE 3
STRENGTH PROPERTIES OF BASE MATE RIA LS
Base Type
Soil-cement
Cement-treated
Base Mat.
I 11 m IV v v
VI
Ceme~t
Co11t . ( t.)
4. 6 13.3
8. 7 5. 6 5, 5
2 4 8 3 6
11
Sonic E oo' psi)
1,15 0. 57 1,0 'L 4 1. 30
0. 91 1.05 1. 32 0. 56 0. 87 1. 18
28-Day Strength (psi)
Flexural
105 170 194 210 118
50 107 130
53 76
130
Compressi. ve
475 660 675
460
260 382 451 193 180 295
5
cement content for soil-cement from 4. 6 to 13. 3 percent by weight.
Gradations for each of the untreated soil components are shown in Figures 1 and 2. Two cohesive and three noncohesive materials were used in the test panels, with the amount passing the No. 200 mesh sieve varying from 16 to 91 percent and the gravel component ranging from 0 to 25 percent. The soil type varied from A-1-b to A-4(8), covering a portion of the wide range of soils suitable for soilcement base construction.
Specimens were fabricated for strength tests at the time of construction of the panels. The specimens were 2. 8- x 5. 6-in. cylinders and 3- x 11. 25-in. beams. All specimens were moist cured for 2 8 days. Strength data for the base materials are reported in Table 3.
Soil for construction of the panels was mixed in a pug mill for 2 min before and after addition of Type I cement. Sufficient water was then added with a spray bar to bring the mixture to optimum moisture and mixing was continued for 3 min. The treated soil was compacted within 30 min after mixing. Compaction was accomplished with hand- operated vibratory and impact equipment. All test panels were cured for 28 days before loading, either by application of a curing compound commonly used for portland cement concrete pavements or with an asphalt emulsion.
Base material VII was used for construction of the granular test panels. The gradation and soil properties are indicated in Figure 2 and Table 2. A 1-in. thick bituminous surface course was placed on all granular base panels.
Subgrade Materials
Four different materials, designated A, B, C and D, were used as subgrades under the test panels. The gradation and Atterberg limits for each material are shown in Table 4. Materials A and B were placed outdoors to a depth of 4 ft on top of a native silty clay. Materials C and D were used for indoor tests.
Subgrade strength was determined with a 30-in. diameter bearing plate in accordance with the procedures of ASTM D 119 5- 57. The modulus of subgrade reaction for each panel group was determined at the time of load testing and is reported in Table 5. Most of the panels were constructed on low-strength subgrades to emphasize the load response characteristics of the base for the more critical, weaker subgrade condition. Variation of strength for indoor subgrades was attained by selectively reworking the soils on removal of the test panels. Subgrade strength changes for the outdoor test panels were due principally to the climatic variable.
FACILITIES
Indoor Area
Indoor tests were conducted in a concrete building with temperature control during
Subgrade Material Gravel Coarse Sand
(>2.0mm) (2. 0-0. 42 mm)
A 0 2 B 29 32 c 0 4 D 0 4
TABLE 4
SUBGRADE MATERIALS
Gradation (%)
Fine Sand Silt (0. 42-0. 074mm) (0.074-0.005mm)
8 32 26 8 16 40
9 35
Clay (< 0. 005mm)
58 5
40 52
Colloids (< 0. 001 mm)
44
20 40
Atterberg Limits (%)
L. L. P. I.
38 13 NP NP 36 19 39 22

6
Figure 3. Load test with dual oval plates, indoor,
Figure ~. Load test with 30 in. plate, outdoor.
Outdoor Area
TABLE 5
MODULUS OF SUBGRADE REACTION k
Group Subgrade Material k (pci)
a A 99 b A 106 c A 79 d B 284 e c 120 f A 92 g D 175 h D 155 i A 116 j A 116 k A 116
A 116 m A 116 n A 116 0 A 120 p B 300
the heating season. Space was provided for testing six soil-cement panels. Overhead steel beams were framed into the building walls and a system of traveling crossbeams and trolleys permitted load application at any location on a test panel. A view of the indoor area with a load test in progress is shown in Figure 3.
Subgrade soils were placed in a 4-ft deep pit excavated within the building. The test pit is 24 ft wide and 50 ft long. A concrete slab isolated from the footings by an expansion joint was placed at the bottom of the pit, and a shielded membrane waterproofing treatment was applied to protect the subgrade from moisture changes.
Reaction for outdoor load tests, as shown by Figure 4, was provided by a system of steel beams and trolleys which permitted loading at any location on the test panels. The reaction system was secured by a series of soil anchors placed to a depth of about 10 ft.
An area adjacent to each test panel and at the same elevation as the subgrade was protected with polyethylene and a plywood housing. Thus, a subgrade condition similar to that below the test panels was preserved for determining the subgrade strength at the time of load testing.
EQUIPMENT AND INSTRUMENTATION
Loads were applied with 20-ton capacity hydraulic jacks. The magnitude of load was measured by a strain sensing load cell and a strain indicator. The oval bearing plates seen in Figure 3 were arranged to simulate in gross area and spacing the dual truck tire commonly used with 18, 000-lb axle loadings. Equal distribution of load was

7
assured by careful leveling of each oval and by measurements of the magnitude of load transmitted to each. As shown in Figure 4, a housing was placed between the load cell and the bearing plate to contain a dial used to measure deflection directly under the center of the load. A centrally located %-in. diameter hole afforded access of the dial stem to the test panel below the bearing plate.
Deflections of test panels due to load were measured with 0. 001-in. dial gages attached to a wooden bridge. Supports for the dial bridge were outside the area influenced by load. As seen in Figures 3 and 4, dials were arranged to read deflections of the test slab adjacent to the edge of the bearing plate, at the center of load application, and also along longitudinal and transverse lines through the center of loading. Stainless steel plugs cemented to the soil-cement base served as reference points for the dial stems. For panels with thin bituminous surfacing, the stainless steel plugs extended through small holes drilled in the asphalt cover.
LOAD-DEFLECTION DATA
An analysis of variance was made on the accumulated data to determine which of the variables were statistically significant in influencing the relationship between load and deflection. The magnitudes of load and deflection, modulus of subgrade reaction, thickness of base, and radius of bearing area were found to be significant. Variables of soil type, cement content, thin bituminous surface, and exposure were not significant when the minimum criteria for soil-cement were met, although cement content was significant in determining the load capacity if the cement content was less than that required for soil-cement.
Data are presented to indicate the effect of each significant variable on load capacity, and comparisons are made between soil-cement, cement-modified soil, and granular bases. Techniques of nondimensional analysis are used to derive equations for computing pavement thickness in terms of the variables. Since inclusion of the complete record of accumulated data is not feasible, in most cases onlysampledataarepresented.
EVALUATION OF VARIABLES
In the following discussion an evaluation of the variables of thickness, size of bearing plate, strength of subgrade, soil type, and cement content is made to determine the contribution of each to the load-deflection characteristics of soil-cement base con-
struction. Each variable is examined in terms of load capacity with the remaining variables held constant.
TABLE 6
EFFECT OF THICKNESS ON LOAD-DEFLECTIONa Effect of Thickness on
Thickness Deflection under Load (in . ) Load Capacity
Group (in . ) 3Kips 6Klps 9Kips 12Klps To evaluate the effect of thickness on
a 4 0.032 0. 058 load capacity, the variables of subgrade
7 0.010 0. 020 0.030 0.040 strength and loading plate size were held 10 0.005 0.010 o. 017 0. 022 constant. A sampling of test data for
b 4 0. 024 0. 042 0. 063 four increments of load applied with a 7 0.012 0. 018 0. 025 0. 035 16-in. diameter plate is presented in
10 0.006 0.013 0. 020 0.027
4 0.020 0.034 0. 063 Table 6 and in Figures 5, 6 and 7. The
c data show that load capacity increased with 7 0. 013 0.027 0.045
10 0.009 0. 015 0.027 0. 035 increasing thickness. The load-deflection d 4 0.008 o. 011 0.021 0. 023 data shown in Figure 5 are from test panels
7 0. 006 0. 001 0. 015 of Group f and are representative of the 10 o. 003 0. 005 0.008 load response characteristics obtained
e 4 0.020 0.043 from all other tests on soil-cement. For 7 0.007 0. 016 0.027 o. 038
10 0.005 0.014 0. 023 0.032 a constant thickness, the load-deflection 4 0.024 0.047 diagram was linear for the range of de-7 0. 010 0.023 0.037 0.056 flections shown.
10 0. 006 0. 015 0. 025 0.035 13 0. 005 0. 010 0. 015 0.020 The trend of load capacity with in-
aTest da t a f o r 8 - in . pl a te radius . creasing thickness of soil-cement, illus-

8
20
18 Group f Plate radius-Sin .
16
14 - ./ / "' 12 0.
,/~./ ""' ' 10 'O 0 0 _, 8 . /"
6 /'/ 4 } /..---· 2 -;/" ---· ~· 00 .0 1 .02 .03 .04
Deflect ion- in.
Figure 5. Effect of so i l - cement thi ckness on load capacity .
JP~9k i p s • Di stance from center of load - ft _
. 01
~ .02 0
Fi gure 7 ,
I 2 3 4 5
Grouo f Plate rad ius - Sin
Deflect i on profi l e cement base .
for
6
soil-
trated by Figure 6, shows that for a constant deflection the load capacity increased exponentially with increased thickness of soil-cement.
20
16
' 12 ~
0 0 --'
B
4
Plate radius - 8 in
Deflection - ,03 in .
.,/
4 6 8 10 12 I~ Th i ckne ss - in.
Figur e 6. Curvilinear r el ationship between thickness and load capac ity .
TABLE 7
EFFECT OF PLATE SIZE ON DEFLECTIONa
ThickneRR Deflection at Plate Radius (in.) Group
a
b
c
d
e
(in.)
4 7
10
4 7
10
4 7
10
4 7
10
4 7
10
4 7
10 13
6In .
0.032 0. 014
0. 030 0.021
0. 052 0.028
0. 024 0.010 0. 005
0. 30 0. 024
0. 048 0.029 0.016
aTest data for 9 - kip load .
8In.
0.030 0.017
0. 063 0.025 0.020
0. 063 0. 045 0.027
0.021 0. 011 0,005
0.027 0. 023
0. 037 0.025 0.015
12 In.
0. 062 0. 021 0.015
0. 050 0.019 0.01 8
0. 032 0.019
0. 017 0.009 0. 006
0. 043 0. 019 0.017
0.03 8 0.033 0. 018 0. 013
15 In.
0.038 0.031 0.015 0.014
Deflection profiles obtained along two lines at right angles also demonstrated the effect of thickness on load capacity. Data in Figure 7 were taken from tests made on three thicknesses of Group f for a 9-kip load applied with a 16-in. diameter plate. Measurable deflections occurred over a radial distance of more than 5 ft from the point of load application, demonstrating that a considerable slab area participated in carrying and distributing impos ed loads.
Effect of Plate Size and Shape on Load Capacity
An evaluation of the effect of plate size on load capacity was made by comparison of deflections for loads applied with four different size bearing plates on four thicknesses

05
,04 -
.03
6
Group f Lood - 9 kips Thickness - 7 in .
8 10 12 14 Plate radius- in ,
16
Figure 8 . Effe ct of plate size on deflec tion .
40 .--.-~~.-~~-.-~~-.-~~-.-~
"'
36
32
26
24
~20
'016 c 0
...J 12
B
4
50
Plate radius - 12 in ~
Deflection - 03in
100 150 200 Modulu s of subgrade reo cti on,
250 k - pci
Fig. IQ - EFF ECT OF SUB GRADE STR E NG TH ON LOAD CAPAC ITY
300
Figure 10 . Effect of subgrade on load capacity .
strengt h
05
!! ~ -04
-~ !£
.e ::' .. ~
.03
·~ 0 2
" a. c 0
t " .01
" 0
9
•
Line of Equalit y
o._~~~~~~~~~~~~~~~~ 0 .DI 02 0 3 04 ,05
Deflection at c ent e r o1 dual ovals - i n.
Figure 9. Comparison of deflections for circular and oval plates.
of soil-cement. A sampling of test data given in Table 7 indicates that as the plate size was increased, the magnitude of deflections decreased. It is significant that soil-cement bases are more sensitive to plate size than are the more rigid concrete pavements. However, the effect of in-creasing plate size was reduced for increased thicknesses of soil-cement. An
example of the data for the 7-in. thick slab of Group f is shown in Figure 8. An increase in plate radius from 6 to 15 in. resulted in an exponential decrease in base deflections. For an 8-in. radius plate with a bearing area of 201 sq in., the deflection was 0. 037 in. A plate of this size corresponds closely to the area of a dual truck tire commonly used with 18-kip axle loading . A reduction in bearing area to 113 sq in. (6- in . radius plate) resulted in a 30 per cent increase in deflection.
Dual oval plate tests were made to compare deflections with those obtained with circular plates. The oval steel bearing plates were arranged to simulate the bearing area of dual truck tires. A comparison is made in Figure 9 between deflections measured at the center of the dual plates and those measured at the periphery of a 16-in. diameter circular plate. Deflections of the oval and circular plates were in good agreement , so it may be concluded that data from the laboratory study are comparable to the vehicle load data obtained from field in-service pavement evaluations.
Effect of Subgrade Strength on Load Capacity
To determine the effect of subgrade strength on load capacity, a comparison was made of the test data with deflection, thickness, and size of load plate held constant. Data in Figure 10 show that load capacity of the soil-cement increased with increasing subgrade strength. The data show considerable scatter, but indicate that a linear relationship is acceptable. It is seen that subgrade strength should be included in a load response equation .
Influence of Soil Type and Cement Content on Load Capacity
Influence of soil type and cement content on load capacity of soil- cement was determined by comparing the magnitudes of load required to obtain a deflection of 0. 04 in.

10
TABLE 8
EFFECT OF CEMENT CONTENT ON LOAD CAPACITY
Soil- Cement Load Capaclt ya
Thickness Arith. Mean Std. Dev. Coeff. of (in.) (kips) (kips) Var. (%)
4 4.1 0.5 13 7 8. 1 1. 2 15
10 12. 7 1. 3 10
aAt 0.04- in. defl ecti on , adj usted to 11 = 79 pci.
when loaded with an 8-in. radius plate. Data presented previously showed that load capacity varied directly with subgrade strength. Ther efore, to compare load capacity, a strength ratio was ob-tained for each test group by dividing the modulus of subgrade reaction, k, of each group by the modulus of Group c , which had the low k-value of 79 pci. Equivalent loads for the uniform subgrade strength condition were then obtained by dividing the actual loads by the strength ratio for the respective group. Variations of equivalent load capacity were observed for the range of soil type from A-1- b to A- 4 ( 8) and the required cement content of 4. 6 to 13. 3 percent by weight. The arithmetic mean load capacity, standard deviation, and coefficient of variation for panel thicknesses of 4, 7 and 10 in. are given in Table 8. The average coefficient of variation for the three thicknesses was about 13 percent, demonstrating that the wide variations of soil type and cement content were of minor significance in influencing the load-deflection response of soil-cement bases. It is demonstrated later that this variation is approximately equal to the replication error.
.06
0 5
04 .
03
.02
Plate radiu s - 8 in . Bose thi ckn ess - 7in. Loo d - 9ki ps
2 4 6 8 10 Cement cont ent percent by weight
Figure 11. Effe ct of cement content on deflection for cement - t r eated soils .
C/J a. -"'
40
30
-g 20 0 ...J
10
-- Soil-cement -- Granular Bose
Plate Radius-Bin. Deflection - .03 in.
Subgrade ''k"
106
--------120
o ...._,,~~----~-----~-_. 4 7 10
Thickness of base - in .
F i gure 12 . Load capacity of soi l -cement and granular bases.
Effect of Higher or Lower Cement Content. - Load tests were made to determine the effect on load capacity of variations in cement content above and below the minimum requirements for soil-cement. Data in Figure 11 show that for the same soil component, deflections decreased significantly as the cement content was increased in the range of cement-modified soils. For the range of cement contents greater than the minimum requirements for soil-cement, the rate of decrease of deflection was smaller. The lower durability of pavements constructed with cement contents less than the minimum amount required to produce soil-cement may be important to field performance. Therefore, environmental factors should be considered in selecting the desired cement content . As noted previously, the required cement contents for soilcement are 5. 5 percent for soil type V and 8. 5 percent for soil type VI.
The preliminary data of a further investigation of cement-treated bases indicate that for cement contents substantially diffe r ent from the minimum amount necessary for making soil-cement, cement content should be considered in the load response analysis.

4
3
2
_j
ll 0 8
p ,06 <( T ,0..l!,!!_ ____ ,.
.04
0 3
,0 2
21,9=1.52
I
01 -=--~~~ ......... ~~--------:,...,...-~~,....., .2 .4 .6 .8 1.0 2 .0 3.0 4.0
a h
Figure l3 . Best -fit line fo r soil-cement bases .
Group
Avg.
TABLE 9
REPRODUCIBILIT Y OF TEST DATAa
Bearing Plate Ra dius (in. )
6 8
12
6 6
12 Dual ovals
Load (kips)
8. 8 10. 3 9. 7 9. 9
12.1 13. 0
9. 8 10. 7 10 . 6 12. 3 13. 4 14. 1 10. 4 12. 6
Avg . Load (kips)
9. 5 9 . 8
12 . 6
10. 2 11 . 5 13. 8 11. s
Dev . from Mean
(i )
6. 4 1. 2 3. 2
4. D 10. ~
2. 2 9.6
5. 7
aData for r eplicrt te 7-in. soil -cemen t panels at O.OJ-i n, deflect ion ,
11
Comparison with Load Capacity of Granular Bases. - Granular base load tests were made to compare the load capacity of soil- cement with those of a high-quality granular base material. Figure 12 indicates that the load capacity of the granular base is considerably less than that of soil-cement for both strong and weak subgrades. It should be noted that the sub-grade under the granular base was slightly stronger than the subgrade under the soil
cement. In addition, the thicknesses refer only to the base material and do not include the 1-in . . bituminous surface on the granular materials. Load capacity increased with increasing granular base thickness, but the rate of gain in load capacity was substantially greater for increasing thicknesses of soil-cement than for granular bases. A comparison of load capacity based on equal deflections for soil- cement and granular bases showed that the ratio of soil-cement to granular base load capacity was about 1. 5 for the 4-in. and about 3. 3 for the 10-in. thicknesses. This was true for both weak and strong subgrade conditions. This demonstrates the effect of the beam strength of soil- cement and its influence on load capacity.
ANALYSIS OF LOAD-DEFLECTION TEST RESULTS
An analysis of the load-deflection test results was made to develop an equation evaluating the influence of the significant variables on load capacity for soil-cement and cement-treated bases.
Soil- Cement Bases
Load response of soil- cement bases is described in terms of the significant va riables. A nondimensional logarithmic plot of the test data is shown in Figure 13. Deflection, w, multiplied by the modulus of subgrade reaction, k, and divided by the intensity of applied load, p, is plotted along the ordinate. The ratio of bearing area radius, a, to soil-cement thickness, h, is given along the abscissa.
(1)
where the parameter a is the ordinate at a point on the best-fit line corresponding to an abscissa of a/h = 1 and f3 is the slope of the regression line. It is recognized that a curvilinear best-fit line would better describe the test data at a/ h of 3 or larger. However, the straight line is used for the range of a/ h from 0. 5 to 2. 0, which covers most of the conditions of load area and pavement thicknesses encountered in pavement design. It is seen that a = 0. 058 and f3 = 1. 52. Thus, the specific expression describing the load response of soil-cement is

12
TABLE 10
BEST-FIT PARAMETERS FOR CEMENT-TREATED
BASE COURSES
Base Group O! f3 Cement Content Mat. (i by wt.)
v 0.100 1. 52 2.0 v j 0.066 1. 58 4. 0 v k o. 049 1. 58 8.0 VI 1 0.085 1. 59 3. 0 VI m 0.066 1. 57 6.0 VL n U, UVI
• O M J.. U I .l.1, v
w n o~a a k (
\ 1.52
p = u. ;) "h) (2)
The standard error of estimate at a/ h = 1 was 0 . 007 and the coefficient of cor-relation was 0. 94. When expressed in terms of thickness of s oil-cement re-quired for a 9-kip load, an 8-in. radius plate, and 0. 03-in. deflection, the standard error was about 0. 5 in.
E 12 ' "' ~ l 1 c
-"' <.> £ 10 + ru ~ 9 -"
a - 8-in
p- 45psi w - ,03 in .
a:~ /3 from Tobie 10
2 8 :;: 1 7 1----------""'©c::-----=<~~~~x
c
E 6 ru
u 5l·~~_...........___ 2 3 4 5 6 7 8 9 10 11
Cement con t ent pe rcent by wei ght
F' i gure ll1 . Effect of cement content on r e~uired base thickness .
Replicate tests were made on 7-in. thick panels to determine the reproducibility of the data. Presented in Table 9 are comparisons between original and replicate test data. The comparisons are based on the magnitude of load required to produce a deflection of 0. 03 in. It is seen that maximum deviation from the mean was 10. 4 percent and the average deviation for seven replicate tests was 5. 7 percent. For a 7-in. thickness, the replication error would be about 0. 4 in., which is approximately equal to the standard error of estimate and to the coefficient of variation attributed to the effect of different soil types and cement contents.
The best-fit equation may be solved explicitly for thickness of soil-cement, h, to yield:
h (3)
and may be restated in terms of the t otal applied load, P, to read:
h-a---- (0.072)( p) 0
·
658
0. 32 wk (4)
An increase in plate radius, deflection, or subgrade strength would deer.ease the required thickness of soil- cement, whereas an increase in total load results in an increase of the required thickness.
Eq. 4 defines the load response characteristics for soil-cement produced from a wide range of soil types stabilized with the cement content required from ASTM tests and !'CA weight-loss criteria. A wide range of s oil-cement materials were used to dete.rmine the load-deflection equation, thus indicating that soil-cement is a unique structural material, and a strength factor is not required in the equation.
Cement-Treated vs Soil-Cement Bases
Load response of cement-treated bases is described in terms of the variables found significant for soil- cement; however, for cement-treated bases the amount of cement
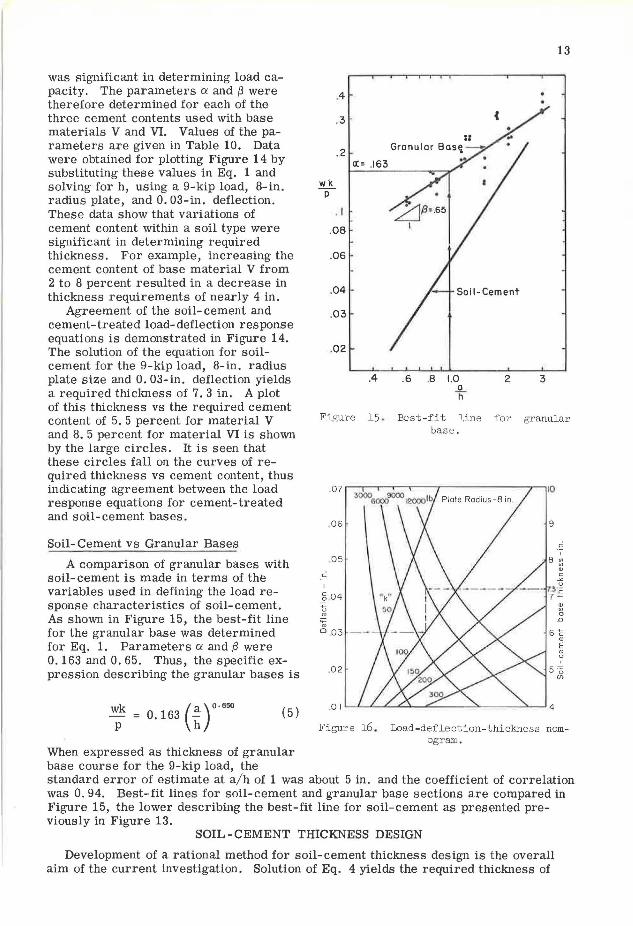
was significant in determining load capacity. The parameters a and {3 were therefore determined for each of the three cement contents used with base materials V and VI. Values of the parameters are given in Table 10. Data were obtained for plotting Figure 14 by substituting these values in Eq. 1 and solving for h, using a 9-kip load, 8-in. radius plate, and 0. 03-in. deflection. These data show that variations of cement content within a soil type were significant in determining required thickness. For example, increasing the cement content of base material V from 2 to 8 percent resulted in a decrease in thickness requirements of nearly 4 in.
Agreement of the soil- cement and cement-treated load-deflection response equations is demonstrated in Figure 14. The solution of the equation for soilcement for the 9-kip load, 8-in. radius plate size and 0. 03-in. deflection yields a required thickness of 7. 3 in. A plot of this thickness vs the required cement content of 5. 5 percent for material V and 8. 5 percent for material VI is shown by the large circles. It is seen that these circles fall on the curves of required thickness vs cement content, thus indicating agreement between the load response equations for cement-treated and soil-cement bases.
Soil- Cement vs Granular Bases
A comparison of granular bases with soil- cement is made in terms of the variables used in defining the load response characteristics of soil-cement. As shown in Figure 15, the best-fit line for the granular base was determined for Eq. 1. Parameters a and {3 were 0.163 and 0. 65. Thus, the specific expression describing the granular bases is
wk (a)o.sso - = 0.163 -p h
(5)
When expressed as thickness of granular base course for the 9-kip load, the
wk p
.4
.3 -
. 2
. I
.OB
.06
.04
.03
.02
.4
Figure 15 .
06
05
02
.6 .8 1.0
~ Best-fit line
base .
13
(
2 3
for granular
9
~ 0 .a
6" "' E "' u
5 'ii (/)
Figure 16. Load-de f l ect ion-thickness nom-ogrSlll.
standard error of estimate at a/ h of 1 was about 5 in. and the coefficient of correlation was 0. 94. Best-fit lines for soil-cement and granular base sections are compared in Figure 15, the lower describing the best-fit line for soil-cement as presented previously in Figure 13.
SOIL-CEMENT THICKNESS DESIGN
Development of a rational method for soil-cement thickness design is the overall aim of the current investigation. Solution of Eq. 4 yields the required thickness of

14
soil- cement for a predetermined magnitude of permissible deflection. In Figure 16 a nomogram of Eq. 4 is presented for a 201- sq in. bearing area, equivalent to an 8- in. radius plate. In this example, the nomogram is entered with an assumed deflection of 0.03 in., progression is horizontal to intercept the modulus of subgrade reaction of 100 pci, then vertical to intercept the curve for a wheel load of 9, 000 lb; the required thickness is given as 7. 3 in. Similarly, with an assumed deflection of 0. 04 in., the thickness is 6.1 in. Thus, the magnitude of deflection assumed has considerable influence on the required thickness. The development of the load- deflection relationship for soil-cement, as described by Eq, 4, is a step forward in developing a thickness design method for soil-cement. A further test program has as its objective the determination of the fatigue characteristics and permissible deflections of soil- cement bases. From the load- deflection characteristics and the permissible deflection, a fully realistic soil-cement thickness design method can then be developed.
CONCLUSIONS
1. Significant variables of the load-deflection response of soil-cement meeting recognized test criteria were the modulus of subgrade reaction, thickness of soil-cement, and radius of bearing area. Variables not significant were type of soil and cement content, climatic exposure variables, and thin bituminous surfacing.
2. A load response equation for soil- cement (Eq. 2) was developed from a statistical analysis of a nondimensional plotting of the significant load- deflection test data. However, use of this equation in the thickness design of soil- cement bases depends on the determination of the fatigue characteristics and permissible deflection limits of soil- cement. It is significant that a factor for strength was not needed in this equation.
3. Load-deflection characteristics of cement-treated bases can be described by Eq. 1. Variations of cement content within a soil type were significant in determining required thickness, as was shown by decreasing values of a with increasing amounts of cement. The effect of increased load capacity with increased cement content was most significant at cement contents less than those required for soil-cement. However , durability considerations may alter the load capacity vs cement content relationship.
4. Load capacity of soil- cement compared to granular bases at equal magnitude of deflection was about 1. 5 times greater for the 4-in. thick bases and about 3. 3 times greater for the 10-in. thickness.
REFERENCES
1. American Society for Testing Materials. ASTM Standards, Part 4. ASTM Designation D559-57 and D560-57, pp. 1343 and 1349, 1961.
2. Soil-Cement Laboratory Handbook. Portland Cement Assoc., p. 28, 1959.