Embed Size (px)
Citation preview

1
LNG vs. Conservation andRenewable Energy – What Is in the Best Interest of California?
Prevention First 2004, September 15, 2004
Bill Powers, P.E.Border Power Plant Working Grouptel: (619) 295-2072www.borderpowerplants.org

2
Worldwide View of LNG Supply Chains

3
Where Is Gas Coming from toMake LNG for the California? Clockwise from left: Camisea pipeline, Peru; offshore Sakhalin, Russia; Bintuni Bay, WestPapua, Indonesia; Barrow Island, Australia

4
LNG Liquefaction, Tankerand Receiving Operations

5
Financing Issues - Cost ofGreenfield LNG Supply Chain
Element of Chain Cost ($ billions)
Gas production field variable
LNG liquefaction plant ~2
LNG ships (8 to 12) 1.5 to 2.5
LNG regasification 0.5 to 1.0
Total (w/o gas field) 4 to 5

6
Pacific LNG Trade and California
• Financial institutions suffered heavy losses in merchant power projects – risk averse;
• Need long-term LNG contracts w/invest grade entities like California utilities;
• Cost to deliver LNG to CA $4/MMBtu and up;• CA demand is declining, rebound with business-
as-usual approach by 2016;• Abundant high cost domestic supplies will be
developed if prices stay > $4/MMBtu.aa) EnergyPulse online, Impact of LNG Imports on North American Natural Gas Prices, June 10, 2004.

7
What is Legislative History with Onshore LNG Terminals?
• California LNG Terminal Act of 1977 (rescinded 1987):• Maximum population density 10 people per sq. mi to
one mile from fenceline, 60 people per sq. mi to fourmiles from fenceline, same for tanker shipping lanes;
• Fire risk from LNG spills of 25,000 m3 and 125,000 m3
were evaluated as basis for safety buffer zone• Power of eminent domain granted to terminal operator
to maintain low population densities
• 1979 Federal Pipeline Safety Act explicitly states“need to encourage remote siting”

8
Is There a Cost DifferenceBetween Onshore andOffshore LNG Terminals?
Project Capacitya (bcfd)
Capital Cost (~$ millions)
Shell/Sempra 1.3 600
Chevronb (GBS offshore) 1.0 650
Mitsubishi 1.0 400
BHP Billitonc (offshore) 1.5 600 Note (a): bcfd = billion cubic feet per day Note (b): GBS = gravity-based system (a de facto artificial island) Note (c): floating terminal

9
How Are LNG Projects in California Being Designed?
Project Upstream Gas field and liquefaction
facilities
Downstream regasification
facilities
Distance to more than 60 people
per mile2
BHP Billiton off Ventura County
NW Australia, floating offshore
Floating offshore,15 miles from
coast
> 15 miles
Mitsubishi Long Beach Harbor
Oman, Tangguh, Sakhalin, other? Sakhalin onshore: Gas from critical Western Gray Whale caving ground, 600 km. pipeline through virgin region.
Onshore in urban/ industrial setting, removal/storage of propane and ethane onsite
< 2 miles
Note: Neither of these projects use seawater to regasify the LNG

10
How Are LNG Projects in Baja California Being Designed?
Project Upstream Gas field and liquefaction
facilities
Downstream regasification
facilities
Distance to more than 60 people per mile2
Sempra/Shell Near Ensenada, 50 mi. south of border
New Papua, onshore on site of
existing village, in SE Asia’s largest
mangrove forest
onshore, last undeveloped stretch of Baja coast north of
Ensenada
2 miles
ChevronTexaco 10 mi. south of border
Onshore at Barrow Island, known as NW
Australia’s “Ark” – invasive species issue
offshore 600 m. from island – critical marine avian habitat
8 miles
Note: Both of these projects will use > 100 million gal/day of seawater to regasify the LNG

11
Global Warming – How Much CO2in Gas Being Converted to LNG?
Project CO2 % of
source gas
Fraction of source gas that is combustible
excluding CO2 portionc
(assume combustible portion is pure methane)
Increase in % CO2 emissions relative to
pure methane combustion w/o sequestrationc
ChevronTexaco Gorgon, NW Australia
11 – 15a .85 - .89 12 - 18
Sempra/Shell Tangguh, New Papua, Indonesia
~10b .90 11
BHP Billiton Scarborough, NW Australia
<1 >.99 <1
Note (a): The CO2 would have to be vented to atmosphere or sequestered Note (b): BP Tangguh EIA webpage Note (c): If 10% of source gas is CO2, assume remaining 90% is combustible methane gas.

12
Global Warming and Air Pollution– How Much Gas Is Used to Make, Transport, and Regasify LNG?
Process Step Additional Gas Consumption (%)
Wellhead extraction, field gas processing, pipeline transport of natural gas to user
basecase
Liquefaction 9-10
Transport from Far East via tanker 7-9
Regasification 2-3
Total additional natural gas consumed:
18-22
Transport note: Assumes 36-day round trip and 0.20 to 0.25% of LNG cargo consumed per day of voyage by onboard fuel requirements

13
What Is Cumulative Additional CO2Associated with Pacific LNG?
Project Increase in % CO2
emissionsb
Increase in % CO2 from LNG
liquefaction, transport, and regas
Total increase in % CO2
emissions relative domestic low CO2 production field
Domestic low CO2 production fielda
basecase 0 basecase
ChevronTexaco Gorgon, NW Australia
12 - 18 20 ~30-40
Sempra/Shell Tangguh, New Papua, Indonesia
11 20 ~30
BHP Billiton Scarborough, NW Australia
basecase 20 ~20
Note (a): Assumes CO2 content of field gas is less than 1% by volume Note (b): Assumes wellhead CO2 is vented to atmosphere and not sequestered

14
Seawater LNG Vaporization –What Is the Marine Impact?
• 100,000,000+ gallons/day of seawater used• Mortality of entrained marine life is 100% • Once-through seawater usage rate is
equivalent to that of a 300 MW combined-cycle power plant
• Seawater temperature is reduced by as much as 20 oF
May 2003 USCG EIS for proposed Port Pelican LNG terminal andJuly 15, 2003 envr coalition comment letter on USCG EIS. See www.borderpowerplants.org

15
What Are Key Envr., Social or PoliticalIssues with Each LNG Supply Chain?
Project Key Issue(s)
Sempra/ Shell
1) Political unrest in West Papua could delay or kill Tangguh project despite commitments from China and Korea to invest. BP* working to avoid militarization of the project area, despite clashes. 2) High CO2 emissions in source gas (~10% CO2 content), ~30% overall CO2 penalty. 3) Environmental permit suspended as result of lawsuit in Mexico over risk to existing tourism resort. 4) Regas plant site identified for tourism in state plan. 5) Last untouched spot on Baja coast between Tijuana and Ensenada. 6) Opposition to use of seawater for regasification.
Chevron Texaco
1) Major western Australia environmental organizations opposing Barrow Island “Ark” site. 2) High CO2 emissions in source gas (11-15% CO2 content), ~30-40% overall CO2 penalty. 3) Mexican opposition party and NGO concerns over sovereignty issues related to concession granted for regas plant. 4) Concern over impact of regas plant on threatened avian species on adjacent island. 5) Opposition to use of seawater for regasification.
Mitsubishi 1) Mitsubishi associated with negative impacts with all upstream Pacific Rim LNG liquefaction projects, proposing “spot cargo” format with no fixed LNG supplier. 2) Risk of locating regas terminal in highly populated, critical infrastructure location. 3) Unclear if regas terminal NOx and PM emissions will be offset by LNG vehicles.
BHP Billiton 1) Upstream impacts may be minimal if floating LNG liquefaction plant used to develop Scarborough gas field. 2) 20% CO2 penalty associated with LNG processing and transport. 3) Security issues with offshore terminal, +/-?
BP*: British Petroleum, developer of gas fields and liquefaction plant.

16

17
What Are Air Quality Impactsof California LNG Terminals?• SES Long Beach LNG terminal:
•NOx Emissionsa: 311 tons per year (tpy)•PM10 Emissions: 38 tpy (dual-fuel LNG tankers)
•Principal sources: LNG tankers, tugboats, LNG vaporizers
• BHP Billiton Offshore LNG Terminal:•NOx Emissionsb: 295 tpy•PM10 Emissions: 19 tpy (natural gas only tankers)
Note (a): Sound Energy Solutions, Resource Report 9, Long Beach LNG Import Project, December 11, 2003, Table 9.1-14. Daily maximum emission rates reported in Table 9.1-14 are multiplied by 365 to calculate annual emissions.
Note (b): Environmental Analysis, Cabrillo Port Offshore LNG Import Terminal, Tables 5.7-20 and 5.7-21, Docket 16877, U.S. Coast Guard website, http://dms.dot.gov/.

18
Off-Road Diesel NOx Standards Catching up to On-Road Standards Dan Donohoue, Chief, Emissions Assessment Branch, ARB, “Off-Road & Stationary Diesel Engine/Equipment Advancements: CARB’s Perspective”, Jan. 2004, CAPCOA Diesel Conf.
012345678
1988
1992
1996
2000
2004
2008
2012
g/bh
p-hr
OnOn--roadroad
OffOff--road road 275 hp275 hp
19
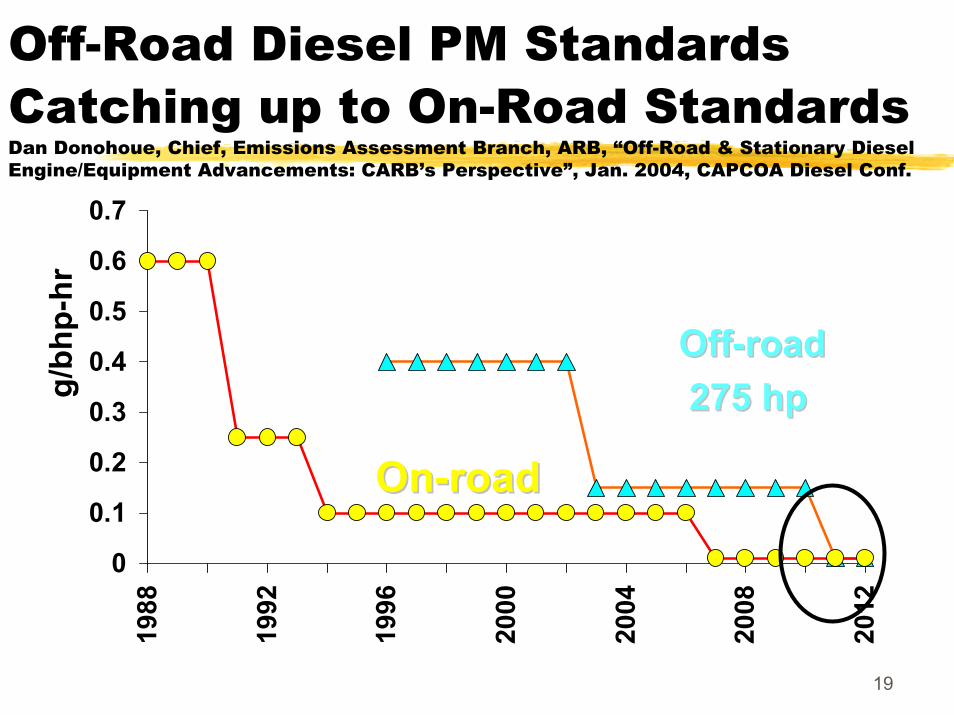
Off-Road Diesel PM Standards Catching up to On-Road StandardsDan Donohoue, Chief, Emissions Assessment Branch, ARB, “Off-Road & Stationary Diesel Engine/Equipment Advancements: CARB’s Perspective”, Jan. 2004, CAPCOA Diesel Conf.
0
0.1
0.2
0.3
0.4
0.5
0.6
0.7
1988
1992
1996
2000
2004
2008
2012
g/bh
p-hr
OnOn--roadroad
OffOff--roadroad275 hp275 hp

20
Will LNG Terminal Emissions be Offset by Use of LNG in Vehicles?• No. No difference in on-road heavy duty LNG and
heavy duty diesel (HDD) vehicle NOx and PM10limits from 2007 onward. Use of on-road certifiedHDD engine is option for major POLB emitters -terminal tractors
• Nearly 100 on-road diesel engine terminal tractorsare currently in use at POLB (at APM Terminal)
• However, phase-in of LNG would not begin until2009 model year at the earliest. On-road and off-road NOx and PM10 heavy duty vehicle limits are same from 2011 onward.

21
What is Estimated Cost of On-RoadDiesel or LNG Terminal Tractor Relative to Off-Road Basecase?
• ~550 off-road HDD terminal tractors (akayard hostlers or yard goats) at POLB;
• Complete fleet turnover ~ every 7 years;
• Current cost premium for LNG-fueled yardhostler: $32k on $65k base (off-road diesel engine) terminal tractor price;
• Cost premium for onroad diesel: $6K

22
Rigorous Evaluation of LNG Need – Has It Been Done? • May ‘03 Energy Action Plan, Action No. 6:
• Evaluate the net benefits of increasing the state’s natural gas supply options, such as liquefied natural gas;
• Monitor the gas market to identify anyexercise of market power and manipulation, and work to improve FERC-establishedmarket rules to correct any observed abuses.

23
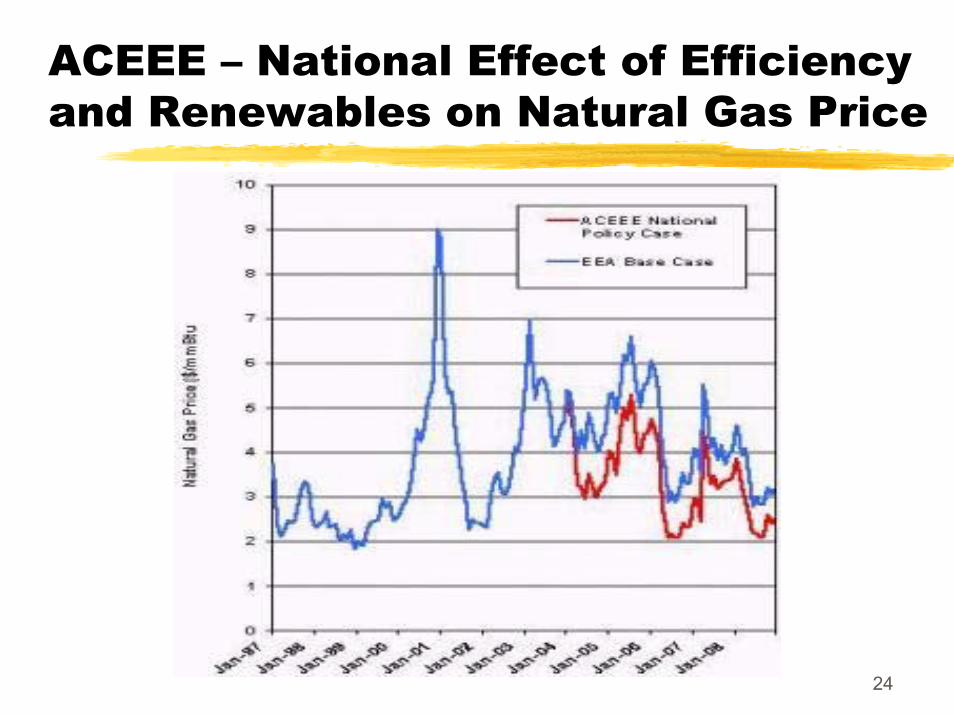
CEC’s Dec. ‘03 Assessment of LNG vs. ACEEE Dec. ’03 Alternatives• CEC: Opportunity to access supply from other
continents, may help downward pressure on price;• Overdependence on foreign supply is concern.• ACEEE: Saving peak energy fastest way to reduce
gas usage and price. 20% price reduction, $0.90/MMBtu, possible in 12 months;
• Small change in consumption has disproportionatelylarge impact on price - CA reduced peak by 11% in late spring of 2001 and helped break market power.
• $30 billion investment nets $100 billion in savings.ACEEE: American Council for an Energy-Efficient Economy
24
ACEEE – National Effect of Efficiency and Renewables on Natural Gas Price

25
Risks of IncreasedDependence on NG/LNG
• CEC states “. . Natural gas generation expected to increase from 36% in ’04 to 43% in 2013.”a
• Orrin Hatch, Dec. ’03 – “Must determine if price surges are result of market forces or manipulation.”b
• LNG floor price on West Coast will be > $4/MMBtu. At this price coal power is much cheaper than gas.
• Confirmation - Sempra Energy is aggressivelypursuing 1,450 MW coal project in Nevada tosupply Southern California (LADWP).
a) CEC Integrated Energy Policy Report, December 2003
b) Surge in Natural Gas Prices Brings Fear of Sharply Higher Heating Costs, Canadian Press, 12/16/03

26
California and Natural Gas Needs –Increase Supply or Decrease Demand?
Gas Demand, Projected Demand Increase, Gas Options
Gas Quantity, mmcfd(million cubic feet per day)
Average daily natural gas use in California, 2001
6,600
Projected increase in gas demand over 2002 baseline, 2006-2016
0-200a
Average projected daily natural gas delivery from one LNG terminal
700-800
Reduction in California gas demand from conservation measures and renewable energy supplies identified as cost-effective priorities by state
1,100 – 1,500b
Note (a): Dervied from presentations by PGE, SoCalGas, and SDGE at CEC/CPUC Natural Gas Workshop, Dec. 9-10, 2003. 2006-2016 demand increase in SoCalGas/SDGE territory: 0 mmcfd. In PGE territory: 0-200 mmcfd. Note (b): Derived from Synapse Energy Economics evaluation submitted in March 23, 2004 RACE coalition comments in CPUC Utility Long-Term Natural Gas Procurement Proceeding, Rulemaking 04-01-25

27
What is the Cost of EnergyOptions for California?
Energy Optionsa and 2004 Residential Power Rates $/kwhb
Natural gas combined-cycle power plant (baseload) 0.05 Natural gas simple cycle power plant (peaking) 0.16 Wind 0.05 Solar thermal (parabolic trough) 0.14 – 0.17 Geothermal (flash) 0.05 Energy conservation measuresc 0.03 – 0.06
San Diego Gas & Electric 2004 residential charge 0.15d
CFE, North Baja California 2004 residential charge 0.22e
Note (a): California Energy Commission, Comparative Cost of California Central station Electricity Generation Technologies, August 2003, pg. 3 and 11. Note (b): “levelized direct cost” – assumes life-of-project natural gas cost in $5/MMBtu to $6/MMBtu range. Note (c): California Consumer Power and Conservation Financing Authority, “Clean Growth: Clean Energy for California’s Economic Future – Energy Resource Investment Plan,” February 2002, Table 6-2, pg. 54. Note (d): Includes only metered kwh usage charge and “electric energy charge,” April 2004. Note (e): Includes only December 2003 published CFE summer usage charge based on 1,000 kwh/month.

28
Gas Demand Reduction IsBest Policy Approach• Conservation effort in spring 2001 probably most
unifying event among CA citizenry in last 25 years;• That spirit of common cause can be harnessed
again;• The public interest would be best served by
decreasing demand, not increasing supply via LNG. • Biggest political obstacles to implementing demand
reduction policy will be utilities and companies in natural gas and LNG supply business;
• Outstanding opportunity to show leadership, vision, and political independence;
• Political/financial reality – None of the LNG terminals proposed for Californias may reach fruition.

29
The Clean Energy Option• Gas demand is static, no
growth in 2002-2016,• Demand and price can be
decreased considerably by aggresively implementing energy conservation renewable energy,
• Potential to reduce natural demand by the equivalent of at least 1½ to 2 LNG terminals,
• Best environmental, fuel price, and public policy.