Embed Size (px)
Citation preview


Living standards, inequality and poverty in the UK
Pascale Bourquin, Robert Joyce and Agnes Norris Keiller
© Institute for Fiscal Studies Living Standards, Poverty and Inequality in the UK: 2020

£400
£420
£440
£460
£480
£500
£520
£54020
02–0
3
2003
–04
2004
–05
2005
–06
2006
–07
2007
–08
2008
–09
2009
–10
2010
–11
2011
–12
2012
–13
2013
–14
2014
–15
2015
–16
2016
–17
2017
–18
2018
–19Av
erag
e ne
t equ
ival
ised
hou
seho
ld in
com
e (£
per
wee
k in
201
8–20
19 p
rices
)Median real UK household income
© Institute for Fiscal Studies Living Standards, Poverty and Inequality in the UK: 2020
1.2% per year
1.6% per year
-0.6% per year
No growthBHC income

£400
£420
£440
£460
£480
£500
£520
£54020
02–0
3
2003
–04
2004
–05
2005
–06
2006
–07
2007
–08
2008
–09
2009
–10
2010
–11
2011
–12
2012
–13
2013
–14
2014
–15
2015
–16
2016
–17
2017
–18
2018
–19Av
erag
e ne
t equ
ival
ised
hou
seho
ld in
com
e (£
per
wee
k in
201
8-19
pric
es)
Median real UK household income
© Institute for Fiscal Studies Living Standards, Poverty and Inequality in the UK: 2020
1.2% per year
1.6% per year
-0.6% per year
No growth
AHC income
BHC income

£320
£340
£360
£380
£400
£420
£440
£46020
02–0
3
2003
–04
2004
–05
2005
–06
2006
–07
2007
–08
2008
–09
2009
–10
2010
–11
2011
–12
2012
–13
2013
–14
2014
–15
2015
–16
2016
–17
2017
–18
2018
–19Av
erag
e ne
t equ
ival
ised
hou
seho
ld in
com
e (£
per
wee
k in
201
8-19
pric
es)
Median real UK household (AHC) income, by age group
© Institute for Fiscal Studies Living Standards, Poverty and Inequality in the UK: 2020
Aged 60+All
Aged less than 60

Real growth in percentiles of household income (AHC) since 2007-08
© Institute for Fiscal Studies Living Standards, Poverty and Inequality in the UK: 2020
-6%
-4%
-2%
0%
2%
4%
6%20
07−0
8
2008
−09
2009
−10
2010
−11
2011
−12
2012
−13
2013
−14
2014
−15
2015
−16
2016
−17
2017
−18
2018
−19
Real
gro
wth
sin
ce 2
007−
08
10th percentile
50th percentile
90th percentile

© Institute for Fiscal Studies
How do we measure poverty?
Focus on income poverty
‒ Can be measured before or after housing costs (BHC or AHC) – we focus on AHC
Absolute poverty
‒ Fixed poverty line: 60% of median 2010-11 income (inflation adjusted)
‒ Approx. £13,200 a year for a childless couple (AHC)
Relative poverty
‒ Moving poverty line: 60% of contemporary median income
‒ Approx. £13,900 a year for a childless couple (AHC)
Living Standards, Poverty and Inequality in the UK: 2020

© Institute for Fiscal Studies
Absolute poverty rate (AHC) by demographic group
Living Standards, Poverty and Inequality in the UK: 2020
0%
5%
10%
15%
20%
25%
30%
35%
2007
‒08
2008
‒09
2009
‒10
2010
‒11
2011
‒12
2012
‒13
2013
‒14
2014
‒15
2015
‒16
2016
‒17
2017
‒18
2018
‒19
Pensioners
Working-age non-parents
All
Children

© Institute for Fiscal Studies
Percentage point change in absolute poverty rate (AHC) over 8-year periods
Living Standards, Poverty and Inequality in the UK: 2020
-7
-6
-5
-4
-3
-2
-1
0
1961−1969 1970−1978 1980−1988 1990−1998 2000−2008 2010−2018
Chan
ge in
abs
olut
e po
vert
y ra
te
(ppt
.)
Note: The absolute poverty line is defined as 60% of median income in the initial year of each eight-year period.

© Institute for Fiscal Studies
-5%
-4%
-3%
-2%
-1%
0%
1%
2%
3%
4%
5%
Lowest income20%
Middle income20%
Highest income20%
All
Cont
ribu
tion
s to
cha
nge
in n
et
hous
ehol
d in
com
eDrivers of mean net income growth between 2016-17 and 2018-19
Living Standards, Poverty and Inequality in the UK: 2020
Total net income growth

© Institute for Fiscal Studies
-5%
-4%
-3%
-2%
-1%
0%
1%
2%
3%
4%
5%
Lowest income20%
Middle income20%
Highest income20%
All
Cont
ribu
tion
s to
cha
nge
in n
et
hous
ehol
d in
com
eDrivers of mean net income growth between 2016-17 and 2018-19
Living Standards, Poverty and Inequality in the UK: 2020
Working-age benefits
Other
Net employment earnings
Total net income growth

© Institute for Fiscal Studies
-5%
-4%
-3%
-2%
-1%
0%
1%
2%
3%
4%
5%
Lowest income20%
Middle income20%
Highest income20%
All
Cont
ribu
tion
s to
cha
nge
in n
et
hous
ehol
d in
com
eDrivers of mean net income growth between 2016-17 and 2018-19
Living Standards, Poverty and Inequality in the UK: 2020
Total net income growth
Working-age benefits
Other
Net employment earnings

© Institute for Fiscal Studies
Relative poverty rates (AHC) among workers by job characteristics (2015−2019)
Living Standards, Poverty and Inequality in the UK: 2020
0% 5% 10% 15% 20%
All employees
Employees in shutdown sectors
Employees in other sectors
Employees, can easily work from home
Employees, cannot easily work from home
Note: The sectors classed as being directly affected by the lockdown are (with four-digit Standard Industrial Classification (SIC) codes in parentheses): non-food, non-pharmaceutical retail (4719, 4730–4772, 4776–4799); passenger transport (4910, 4931–4939, 5010, 5030, 5110); accommodation and food (5510–5630); travel (7911–7990); childcare (8510, 8891); arts and leisure (9001–9329 except ‘artistic creation’ 9003); personal care (9601–9609 except ‘funeral and related activities’ 9603); and domestic services (9700). Ease of working from home based on Dingel and Neiman (2020).

© Institute for Fiscal Studies
Benefit entitlement among workless households (working-age only)
£0
£5,000
£10,000
£15,000
£20,000
£25,000
£30,000
£35,000
AllAll with childrenLone parent, 3+ childrenCouple, 3+ children
Mea
n re
al a
nnua
l ben
efit
ent
itle
men
t (2
020-
21 p
rice
s)
2020-21, no temporary measures
Temporary increases in 2020-21
Note: Entitlements give the mean entitlement among workless households in each category observed in the 2018−19 FRS. To focus on households of working age, we exclude households including any adults aged 60 or over. Monetary values indicate entitlements if making a new benefit claim, ignore free school meals and are expressed in 2020−21 prices using CPI uprating.
Living Standards, Poverty and Inequality in the UK: 2020

© Institute for Fiscal Studies
Benefit entitlement among workless households (working-age only)
£0
£5,000
£10,000
£15,000
£20,000
£25,000
£30,000
£35,000
AllAll with childrenLone parent, 3+ childrenCouple, 3+ children
Mea
n re
al a
nnua
l ben
efit
ent
itle
men
t (2
020-
21 p
rice
s)
2020-21, no temporary measures
Temporary increases in 2020-21
Note: Entitlements give the mean entitlement among workless households in each category observed in the 2018−19 FRS. To focus on households of working age, we exclude households including any adults aged 60 or over. Monetary values indicate entitlements if making a new benefit claim, ignore free school meals and are expressed in 2020−21 prices using CPI uprating.
Cuts since 2011-12
Living Standards, Poverty and Inequality in the UK: 2020
£1,600
£2,900

© Institute for Fiscal Studies
Summary
• COVID-19 crisis hit at a time where we are still paying the price of the long hangover from the last recession
• Years of low earnings growth
• Pared-back benefit system
• Disappointing median income growth and poverty trends
• Those who look most at risk during pandemic already doing poorly
• Underlines crucial importance of avoiding such severe persistent effects as we bounce back from this recession
Living Standards, Poverty and Inequality in the UK: 2020

Appendix slides
© Institute for Fiscal Studies Living Standards, Poverty and Inequality in the UK: 2020

Real growth in percentiles of household income (BHC) since 2007-08
© Institute for Fiscal Studies Living Standards, Poverty and Inequality in the UK: 2020
-6%
-4%
-2%
0%
2%
4%
6%
8%
10%20
07−0
8
2008
−09
2009
−10
2010
−11
2011
−12
2012
−13
2013
−14
2014
−15
2015
−16
2016
−17
2017
−18
2018
−19
Real
gro
wth
sin
ce 2
007−
08 10th percentile
50th percentile
90th percentile

© Institute for Fiscal Studies
Relative poverty rate (AHC) by demographic group
Living Standards, Poverty and Inequality in the UK: 2020
0%
5%
10%
15%
20%
25%
30%
35%
40%
1990
1991
1992
1993
1994
1995
1996
1997
1998
1999
2000
2001
2002
2003
2004
2005
2006
2007
2008
2009
2010
2011
2012
2013
2014
2015
2016
2017
2018
PensionersWorking-age non-parents
All
Children

Jobs and job quality between the eve of the Great Recession and the eve of COVID-19
Pascale Bourquin and Tom Waters
© Institute for Fiscal Studies Living Standards, Poverty and Inequality in the UK: 2020

Strong employment growth was one of the success stories of the recoveryEmployment rate 25-64
© Institute for Fiscal Studies
60%
65%
70%
75%
80%
85%
90%
1993
1994
1995
1996
1997
1998
1999
2000
2001
2002
2003
2004
2005
2006
2007
2008
2009
2010
2011
2012
2013
2014
2015
2016
2017
2018
2019
Men
Women
All

Change in employment by household incomeEmployment rate 25–64
© Institute for Fiscal Studies
0
2
4
6
8
10
12
0%
10%
20%
30%
40%
50%
60%
70%
80%
90%
100%
1 2 3 4 5 6 7 8 9 10
Perc
enta
ge p
oin
t ch
ange
in e
mp
loym
ent
rate
, 20
07
-08
to
20
18
-1
9
Emp
loym
ent
rate
Equivalised AHC household income decile
2007–08

Change in employment by household incomeEmployment rate 25–64
© Institute for Fiscal Studies
0
2
4
6
8
10
12
0%
10%
20%
30%
40%
50%
60%
70%
80%
90%
100%
1 2 3 4 5 6 7 8 9 10
Perc
enta
ge p
oin
t ch
ange
in e
mp
loym
ent
rate
, 20
07
-08
to
20
18
-1
9
Emp
loym
ent
rate
Equivalised AHC household income decile
2018–19
2007–08Change (right axis)

50% 55% 60% 65% 70% 75% 80% 85% 90% 95% 100%
All
FemaleMale
Age 25–34Age 35–44Age 45–54Age 55–64
WhiteNon-white
ImmigrantNon-immigrant
Single female, no kidsSingle female, has kids
Female in couple, no kidsFemale in couple, has kids
Single male, no kidsSingle male, has kids
Male in couple, no kidsMale in couple, has kids
● 2007 ● 2019
Sex
Age
Ethnicity
Immigrant
Family type
All
While some groups saw faster growth than others, almost all saw an increaseEmployment rate, 25-64
© Institute for Fiscal Studies
1. Employment growth in all groups
2. Faster growth for groups with low rates to begin with
3. Doesn’t appear to be ‘hiding’ lower employment rates for others
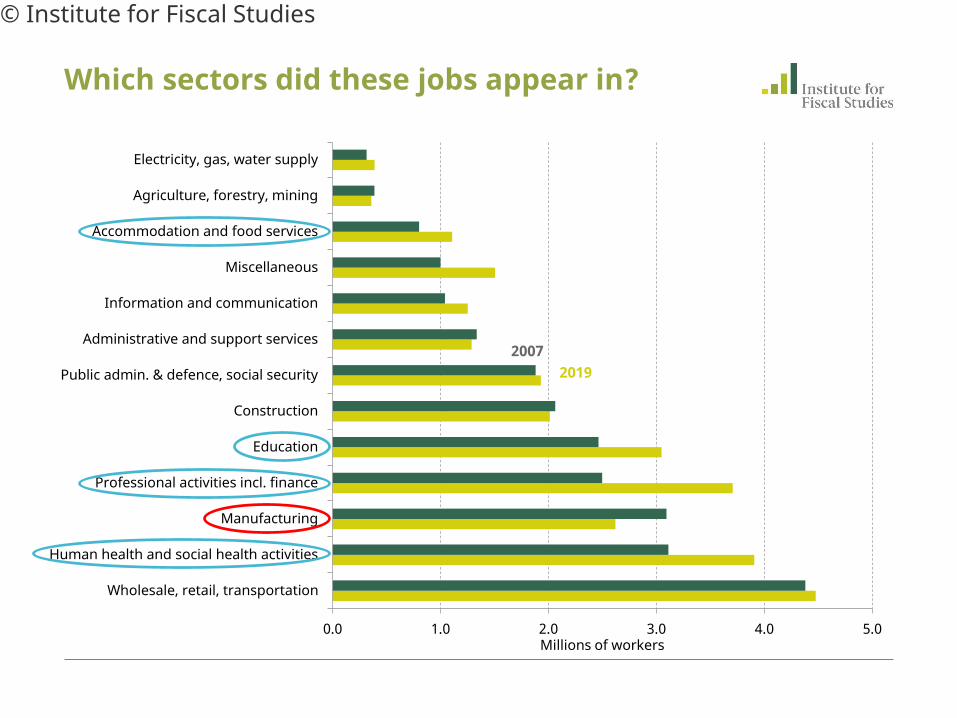
0.0 1.0 2.0 3.0 4.0 5.0
Wholesale, retail, transportation
Human health and social health activities
Manufacturing
Professional activities incl. finance
Education
Construction
Public admin. & defence, social security
Administrative and support services
Information and communication
Miscellaneous
Accommodation and food services
Agriculture, forestry, mining
Electricity, gas, water supply
Millions of workers
Which sectors did these jobs appear in?
© Institute for Fiscal Studies
20192007

How did these trends affect exposure to the COVID-19 crisis?
© Institute for Fiscal Studies
• All of the growth in employment can be accounted for in jobs that can be done from home
• No change in the share of the workforce in industries that have been shut down
• Increase in the share of workers with childcare responsibilities
• Increase in the share of workers classified as keyworkers

Changes in reported job ‘quality’ are mixed
© Institute for Fiscal Studies

Changes in reported job ‘quality’ are mixed
© Institute for Fiscal Studies
* indicates a statistically significant difference at the 10% level; ** indicates a statistically significant difference at the 5% level.
0.0% 20.0% 40.0% 60.0% 80.0% 100.0%
Job is interesting*Can work independently*
Can help others in jobJob useful to society**
Job uses my skills**
Will work hard to help firm**Proud of firm
Would turn down higher paid job to stay with firmGood relations with colleaguesGood relations with managers
Opportunities for advancement are high**
● 2005 ● 2015
Interest in & value of work
Relations with managers, colleagues, firm
Progression

Changes in reported job ‘quality’ are mixed
© Institute for Fiscal Studies
* indicates a statistically significant difference at the 10% level; ** indicates a statistically significant difference at the 5% level.
0.0% 20.0% 40.0% 60.0% 80.0% 100.0%
Job is interesting*Can work independently*
Can help others in jobJob useful to society**
Job uses my skills**
Will work hard to help firm**Proud of firm
Would turn down higher paid job to stay with firmGood relations with colleaguesGood relations with managers
Opportunities for advancement are high**
Often hard physical work**Often stressful*
Often interferes with family life
Job is secureDo not worry much about losing job*
Flexibility in working hoursEasy to get hour off for personal matters**
● 2005 ● 2015
Interest in & value of work
Difficulties at work
Relations with managers, colleagues, firm
Job security
Flexibility
Progression

-15%
-10%
-5%
0%
5%
10%
15%
20%
5 10 15 20 25 30 35 40 45 50 55 60 65 70 75 80 85 90 95
Real
-ter
ms
chan
ge
Percentile of hourly wage distribution
Pay has been very poorReal growth in hourly wages, 2007 to 2019, age 25-64
© Institute for Fiscal Studies
Women
All
Men

Conclusion
• Employment growth clearly was very strong, esp. for poorer households
• Come at a time when other labour market outcomes have been mixed (job quality) or poor (pay)
• Current crisis: undercut the one thing holding poverty down
• Challenge for poverty is to get employment back to where it was pre-COVID – as well as the (already existing!) issues of poor pay, insecurity
© Institute for Fiscal Studies