Embed Size (px)
Citation preview
LIVESTOCK STATISTICALBULLETIN
2015
Department of Animal Production and HealthPeradeniyaSri Lanka.

Livestock Statistical Bulletin - 2015
Department of Animal Production and Health iii
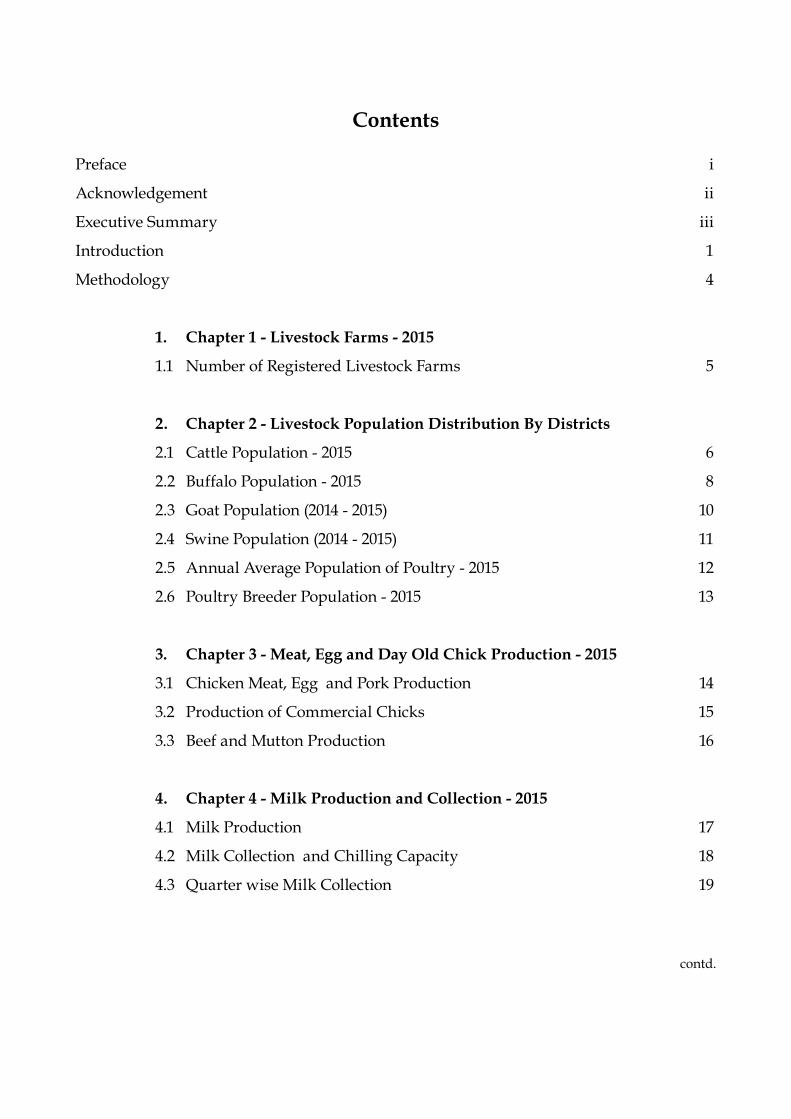
Contents
Preface i
Acknowledgement ii
Executive Summary iii
Introduction 1
Methodology 4
1. Chapter 1 - Livestock Farms - 2015
1.1 Number of Registered Livestock Farms 5
2. Chapter 2 - Livestock Population Distribution By Districts
2.1 Cattle Population - 2015 6
2.2 Buffalo Population - 2015 8
2.3 Goat Population (2014 - 2015) 10
2.4 Swine Population (2014 - 2015) 11
2.5 Annual Average Population of Poultry - 2015 12
2.6 Poultry Breeder Population - 2015 13
3. Chapter 3 - Meat, Egg and Day Old Chick Production - 2015
3.1 Chicken Meat, Egg and Pork Production 14
3.2 Production of Commercial Chicks 15
3.3 Beef and Mutton Production 16
4. Chapter 4 - Milk Production and Collection - 2015
4.1 Milk Production 17
4.2 Milk Collection and Chilling Capacity 18
4.3 Quarter wise Milk Collection 19
contd.
Livestock Statistical Bulletin - 2015
iv Department of Animal Production and Health
5. Chapter 5 - Imports and Exports (2011 - 2015)
5.1 Import of Milk and Milk Products 20
5.2 Import of Milk and Milk Products in LME 21
5.3 Average Prices of Whole Milk Powder
in International Market 22
5.4 Export of Milk and Milk Products 23
5.5 Export of Milk and Milk Products in LME 24
5.6 Import of Meat and Meat Products 25
5.7 Export of Meat and Meat Products 26
5.8 Import of Feed Ingredients 27
6. Chapter 6 - Feed Production and Prices
6.1 Feed Production (2011 - 2015) 28
6.2 Feed Ingredient Production (2014 - 2015) 29
6.3 Compound Feed Prices (2011 - 2015) 30
6.4 Feed Ingredient Retail Prices (2011 - 2015) 31
7. Chapter 7 - Livestock Product Prices
7.1 Prices of Poultry and Poultry Products - 2015 32
7.2 Retail Prices of Meat and Eggs (2013 - 2015) 33
8. Chapter 8 - Cost of Production and Availability
8.1 Cost of Production of Livestock Products (2012 - 2015) 34
8.2 Per-capita Availability of Livestock Products per Year (2011 - 2015) 35
Livestock Statistical Bulletin - 2015
Department of Animal Production and Health i
PREFACE
In the development arena maintaining databases are extremely important. It is a necessity for sound planning and policy formulation pertaining to the sector.
With the rapid growth of the livestock industry it has become obligatory to compile, analyze and maintain livestock statistics for easy reference and for usage.
Livestock Planning and Economics (LPE) division of the Department of Animal Production and Health (DAPH) is maintaining a comprehensive database on livestock to facilitate livestock sector development in the country. In this background the division of LPE in DAPH collects data from its smallest service delivery unit spread all over the country called “Government Veterinary Office“ in regular basis on animal population, livestock production, marketing etc.. Further the division obtains data from various other sources on imports, exports, prices etc…
Therefore, I would like to extend my gratitude to the Livestock Development Instructors those who made their tireless effort to collect data from grass root level with the similar appreciation to government veterinary surgeons those who guided and supervised the process very cautiously. All the provincial directors and other officials those who contributed are well appreciated in this process.
All the other data providers are equally acknowledged since this will not be a reality without their priceless contribution.
At the same time I am thankful to all officers in LPE Division with special regards to Ms. Mala Wickramasinghe (Livestock Development Officer) who worked very hard to collect data to bring out this “Livestock Statistical Bulletin” for the year 2015. The invaluable contribution made by them to make this a success is placed on record with appreciation.
I am also thankful to Dr. K.D. Ariyapala (Director /Livestock Planning and Economics) for guidance given in this work while equally acknowledging Dr. K. A. C. H. A. Kothalawala (Chief Livestock Economist), who is currently reading for her PhD in Japan, for initiating this valuable task. I also appreciate Dr. D. L. N. Kumudinie (Veterinary Surgeon - Livestock Economics) who has been given the responsibility of the editing and publication of this bulletin.
I hope that this publication will be immensely useful for policy makers, planners, and stakeholders of the livestock industry.
Dr. T.A.C. Tiskumara, Director General, Department of Animal Production and Health,Peradeniya.
Livestock Statistical Bulletin - 2015
ii Department of Animal Production and Health
Acknowledgement
Acknowledgements are due toAll Provincial Directors, District Veterinary Surgeons,
Range Veterinary Surgeons and Livestock Development Instructors for collecting and sending accurate data for this document .
Thanks are due to all the other organizations who provided data related to livestock sector.
Thanks are due toAll the staff members of the livestock Planning and Economics division and other officials of the Department of Animal Production and Health
for the support givenin preparation of this document.
Livestock Statistical Bulletin - 2015
Department of Animal Production and Health iii
EXECUTIVE SUMMARY
The livestock sector of Sri Lanka recorded 8% growth during 2015 with 0.6% contribution to GDP at present. Future planning for further development based on trends and forecasting is an obligation of the Industry. In this scenario data pertaining to the livestock sector are necessary to be collected, analyzed and used for interpretations.
In year 2015 cattle population has been increased by 10% while buffalo population increased by 2% when compared to 2014. In spite of this increase in population, the total milk production in 2015 has decreased by 4% compared to 2014. The reduction attributed to the changes in milk production curve resulted after FMD epidemic in 2013 and 2014. Formal milk collection has increased only by 1% in 2015, which may resulted as a consequence of negative growth rate of the dairy sector. Import of milk and milk products have been increased by 22% compared to 2014 while value of imports reduced by 23%. Thus the marked increase of imports may attribute to decreased international market prices of milk and milk commodities as well as to consumer preference towards powdered milk. As the result, even with a negative growth of the sector, the annual per-capita availability (48.56 L) of milk has increased. Negative impacts of FMD is diminishing, and thus the total milk production and per-capita availability is expected to be rise by nearly 10% in the next year. In the coming years, with the recent initiatives taken by the government to start mega farms, with imported cattle of higher production capacity, the sector is expected to grow at a faster rate.
According to the available data, chicken meat production has increased by 9% whereas the egg production has increased by 3% in year 2015 compared to 2014. The commercial poultry feed production has also increased by 24% supporting the expansion of the industry. The per capita availability of chicken meat per year has increased from 7.19 kg in 2014 to 7.82 kg in 2015. The per-capita availability of eggs has been increased from 107.9 eggs per year in 2014 to 109.1 eggs per year in 2015. The availability of broiler day old chicks in year 2015 has increased by 8% while the production of layer day old chicks was decreased by 5%.
Goat production is still recognized as a traditional form of livestock production among farmers especially in the dry zone. However, marked growth in both the population and number of farms were noted in 2015. Out of the total (358,233) goat population main part is concentrated in the dry and intermediate zones. The highest population (95,259) reported in Northern Province and 63% of total goat population is located in Eastern, Northern and North Western provinces. The mutton which is the main output of goat industry is around 1.35 (‘000 MT) resulting per-capita consumption of 0.09 kg per year in year 2015.
The beef production has reduced marginally and per capita availability is around 1.53 kg/year in 2015.
Livestock Statistical Bulletin - 2015
iv Department of Animal Production and Health
Swine production is mainly concentrated in western coastal belt of Sri Lanka. Total pig population has increased in 2015 by 32% while new farm registration does show a marginal growth. Out of total population (94,612) 83% of pigs are reared by farmers in Western and North Western provinces of the country. However, the annual swine meat production is 7.18 (‘000 MT) resulting per-capita consumption of 0.34 kg/year in year 2015.
Livestock Statistical Bulletin - 2015
Department of Animal Production and Health 1
InTRODUCTIOn
In Sri Lanka, livestock rearing is mainly a rural livelihood activity which utilize idling labour, underutilized agricultural by products, marginal lands in turn support agriculture and improves the nutritional status of rural population. There is a strong symbiotic relationship between the crop and livestock and exploiting the synergies of the two sub-sectors of crop and livestock helps to enhance the productivity of the agriculture economy of Sri Lanka.
However, at present, industry and service sectors are rapidly growing comparative to agriculture and hence the contribution of agriculture sector to national GDP is reducing accounts to 7.9% in 2015 (Annual Report, Central Bank of Sri Lanka, 2015), and the contribution of livestock sector is recorded as 0.6% to the national GDP.
Though, the livestock sector contribution to national GDP is low the sector continues to grow recording 8% in 2015. The consumption of livestock products has increased dramatically over the last two decades with the increase of per capita income and urbanization. Livestock production, while helping to improve the nutritional status of the population, offers many possibilities for value addition by converting them into numerous high value products. Furthermore, the livestock industry complements other industries such as tanneries and blacksmiths. Livestock production also contributes to the energy needs by way of biogas while reducing Greenhouse Gas Production. Domestic biogas units associated with cattle farming and pig farming have proven as successful sources of alternate energy for many domestic energy needs in rural Sri Lanka. These characteristics and the labour intensive nature of many livestock operations, under Sri Lanka conditions, can therefore be effectively harnessed for rural employment creation, livelihood improvement and poverty alleviation initiatives.
Dairy Sector
Dairy farming has been a practice from pre-historic era among rural people in Sri Lanka. Traditionally dairy animals have performed multiple functions of producing milk for household consumption, males as a mode of transportation and dung as organic fertilizer and fuel. They may act as a capital reserve and provide employment to help farmers over lean periods, and give greater income stability. Presently, it is one of the major employments for rural poor. Dairy animals generate a continuous flow of income and act as a cushion against income shocks arising due to crop failure for resource poor people. Milk is a ‘cash crop’ for smallholders, converting low value agricultural byproducts, crop residues and cheap family labor into a value added market commodity (Taneja and Birthal, 2005). Regular milk sales allow them to move from subsistence to earning a market-based income. Still small-scale dairying is predominant in the country while large and medium scale operations are developing slowly, transiting from subsistence to profitable industry. Its efficiency as an
Livestock Statistical Bulletin - 2015
2 Department of Animal Production and Health
integrated farming system provides financial health and social securities to thousands of rural dwellers in Sri Lanka.
Though 61% of milk and dairy requirement is still depending on imports, dairy sector has shown significant development in the country for last two years. Of the total milk that is available, the volume of milk entering the formal milk market in 2015 was around 218.4 million liters and the rest is channeled via informal routes and also consumed domestically.
Imports of milk and milk products have shown a fast growth increasing per-capita consumption of milk from 45.16 L/year in 2014 to 48.56 L/year in 2015. The milk imports (liquid milk equivalent of milk and milk products) have increased nearly by 22% in 2015.
Poultry Sector
Poultry industry has shown a significant difference after 1977 with economic reforms in Sri Lanka. Since 1980 poultry population has grown from 6.3 million to 37.2 million in 2015. The per capita consumption of chicken meat and egg had changed from 100 g and 38 eggs in 1980 to 7.82 kg and 109.1 eggs in 2015. The poultry production is in private hands with forward contracts for input supplying and marketing mainly in small scale broiler production. Therefore, small scale rural farmers get their inputs at doorstep and have to market their products at pre-agreed price. The consumption needs of poultry products are totally supplied by domestic enterprises.
Goat Sector
Goat production is a common small animal production mainly comprises of intensive and semi-intensive management systems. In both systems animals are reared primarily for mutton though some does are also milked and the milk is sold. Goat milk is becoming popular due to its merit in contributing to health benefits and therefore rearing dairy goats under intensive management is becoming popular since recent past.
Swine Sector
Pig production is mainly concentrated in the coastal belt of Western and North-Western provinces of Sri Lanka. Highly commercialized large scale farms with three way crosses (Landrace, Large White and Duroc), medium scale intensive farms and semi-intensive farms with crosses of indigenous pigs produce animals for pork industry in the country.
All these sub-sectors are developed with guidance of the livestock master plan which is the development framework for the industry for the future.
Livestock Statistical Bulletin - 2015
Department of Animal Production and Health 3
Data collection and dissemination is a requirement for proper development plans of the industry for future. In this situation data related to livestock sector is necessary to be collected, analyzed, interpreted and disseminate to the uses. The objective of this document is to compile and disseminate the collected data for future planning of the sector.
Livestock Statistical Bulletin - 2015
4 Department of Animal Production and Health
METHODOLOgY
Data were collected in January to December, 2015 from 324 veterinary ranges on animal population (cattle, buffaloe, goat/sheep and swine), number of farms, management systems, milk production, formal milk collection, informal milk collection, number of animals slaughtered, etc…..
Further, data have been collected from milk collecting agencies and milk cooperatives on milk collection, collecting points, chilling capacities etc..... Data pertaining to meat production were collected from local authorities and Municipalities.
Data on poultry population, chicken meat production and egg production were taken using breeder farm monthly return. Data on milk and meat imports and exports were taken from Sri Lanka Customs, Quarantine Stations of DAPH. The retail prices of livestock products were taken from HARTI while farm gate and whole sale prices of livestock products and inputs were collected by the division of livestock planning and economics division. Data on feed production was collected from division of veterinary regulatory affairs of DAPH.
The data had been analyzed for economic indicators and trends in the economics unit of the LPE division.
Livestock Statistical Bulletin - 2015
Department of Animal Production and Health 5
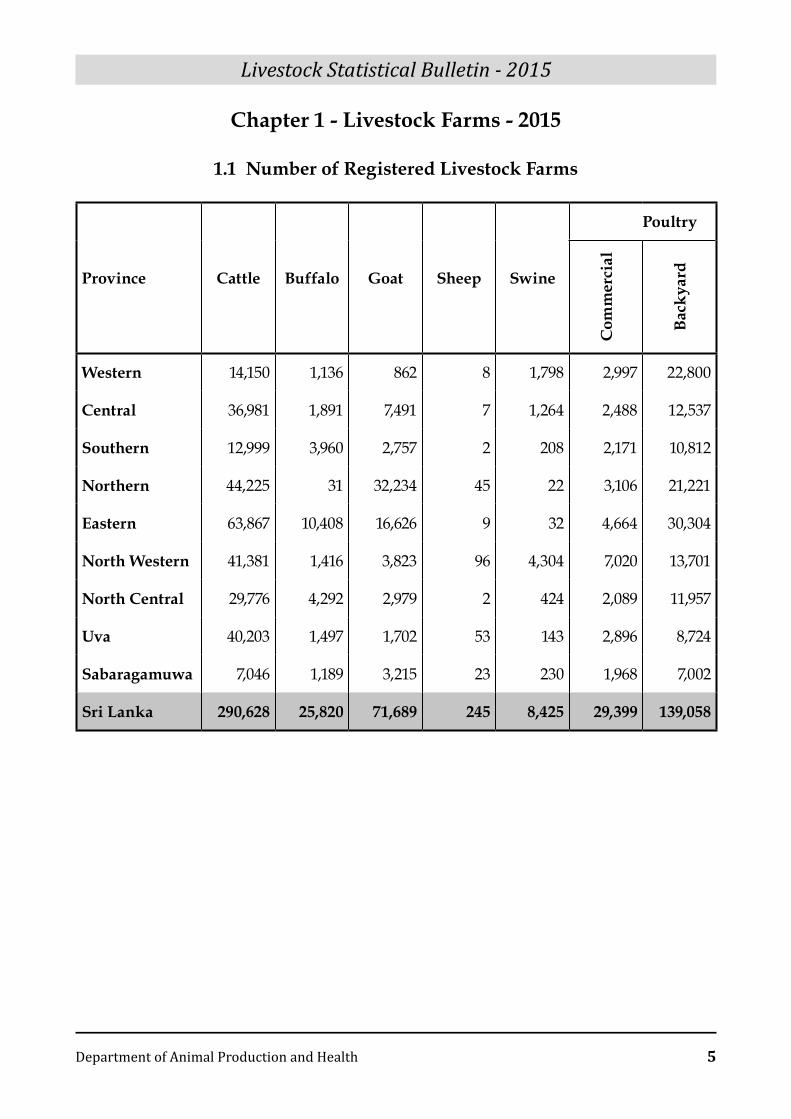
Chapter 1 - Livestock Farms - 2015
1.1 number of Registered Livestock Farms
Province Cattle Buffalo goat Sheep Swine
Poultry
Com
mer
cial
Back
yard
Western 14,150 1,136 862 8 1,798 2,997 22,800
Central 36,981 1,891 7,491 7 1,264 2,488 12,537
Southern 12,999 3,960 2,757 2 208 2,171 10,812
northern 44,225 31 32,234 45 22 3,106 21,221
Eastern 63,867 10,408 16,626 9 32 4,664 30,304
north Western 41,381 1,416 3,823 96 4,304 7,020 13,701
north Central 29,776 4,292 2,979 2 424 2,089 11,957
Uva 40,203 1,497 1,702 53 143 2,896 8,724
Sabaragamuwa 7,046 1,189 3,215 23 230 1,968 7,002
Sri Lanka 290,628 25,820 71,689 245 8,425 29,399 139,058
Livestock Statistical Bulletin - 2015
6 Department of Animal Production and Health
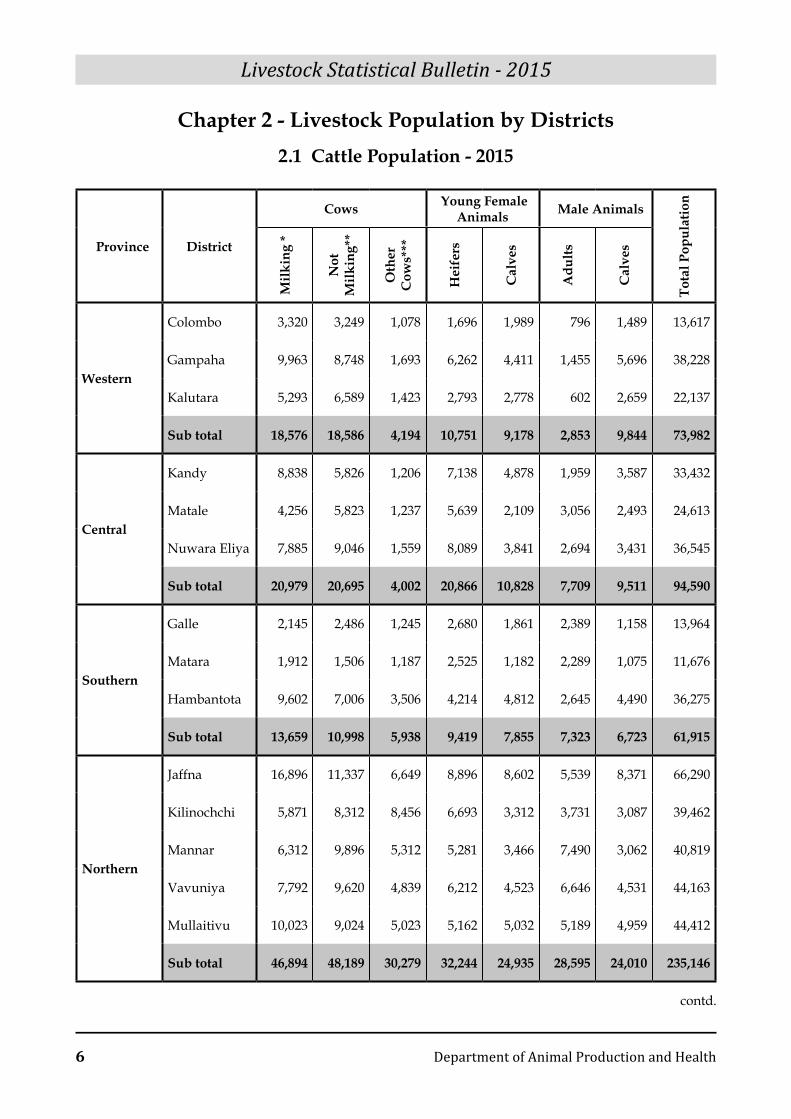
Chapter 2 - Livestock Population by Districts2.1 Cattle Population - 2015
Province District
Cows Young Female Animals Male Animals
Tota
l Pop
ulat
ion
Milk
ing
*
not
M
ilkin
g**
Oth
er
Cow
s***
Hei
fers
Cal
ves
Adu
lts
Cal
ves
Western
Colombo 3,320 3,249 1,078 1,696 1,989 796 1,489 13,617
Gampaha 9,963 8,748 1,693 6,262 4,411 1,455 5,696 38,228
Kalutara 5,293 6,589 1,423 2,793 2,778 602 2,659 22,137
Sub total 18,576 18,586 4,194 10,751 9,178 2,853 9,844 73,982
Central
Kandy 8,838 5,826 1,206 7,138 4,878 1,959 3,587 33,432
Matale 4,256 5,823 1,237 5,639 2,109 3,056 2,493 24,613
Nuwara Eliya 7,885 9,046 1,559 8,089 3,841 2,694 3,431 36,545
Sub total 20,979 20,695 4,002 20,866 10,828 7,709 9,511 94,590
Southern
Galle 2,145 2,486 1,245 2,680 1,861 2,389 1,158 13,964
Matara 1,912 1,506 1,187 2,525 1,182 2,289 1,075 11,676
Hambantota 9,602 7,006 3,506 4,214 4,812 2,645 4,490 36,275
Sub total 13,659 10,998 5,938 9,419 7,855 7,323 6,723 61,915
northern
Jaffna 16,896 11,337 6,649 8,896 8,602 5,539 8,371 66,290
Kilinochchi 5,871 8,312 8,456 6,693 3,312 3,731 3,087 39,462
Mannar 6,312 9,896 5,312 5,281 3,466 7,490 3,062 40,819
Vavuniya 7,792 9,620 4,839 6,212 4,523 6,646 4,531 44,163
Mullaitivu 10,023 9,024 5,023 5,162 5,032 5,189 4,959 44,412
Sub total 46,894 48,189 30,279 32,244 24,935 28,595 24,010 235,146
contd.
Livestock Statistical Bulletin - 2015
Department of Animal Production and Health 7
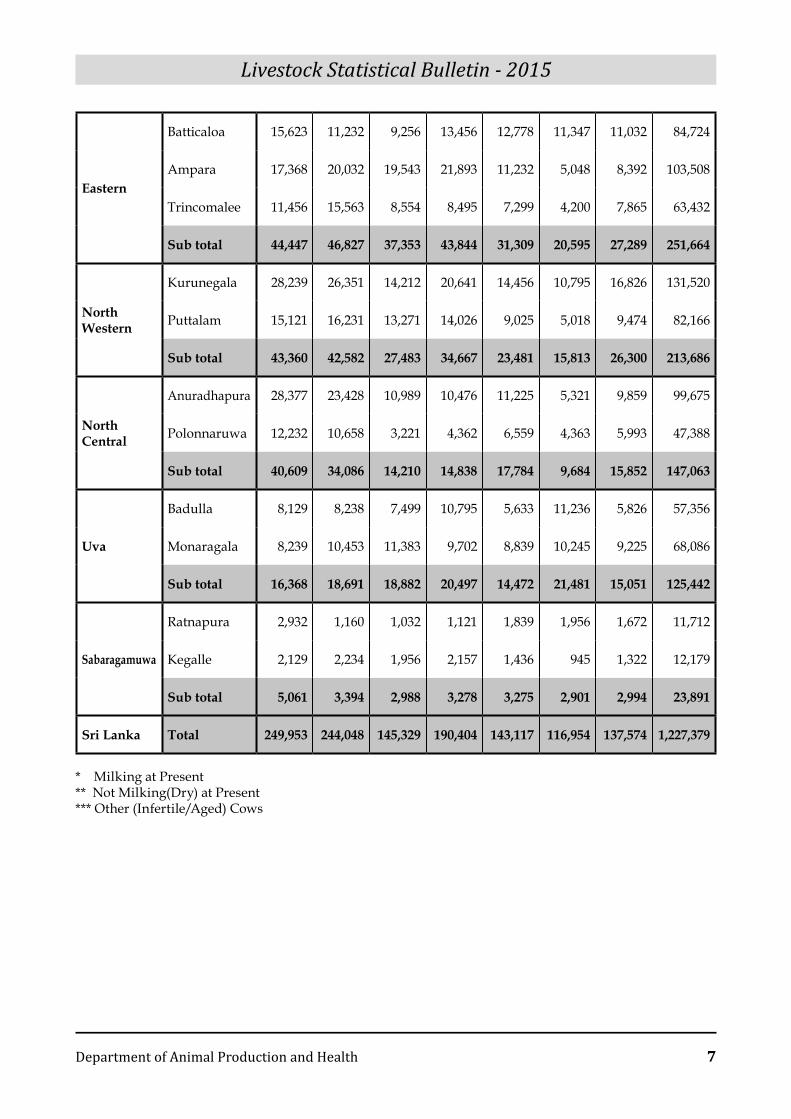
Eastern
Batticaloa 15,623 11,232 9,256 13,456 12,778 11,347 11,032 84,724
Ampara 17,368 20,032 19,543 21,893 11,232 5,048 8,392 103,508
Trincomalee 11,456 15,563 8,554 8,495 7,299 4,200 7,865 63,432
Sub total 44,447 46,827 37,353 43,844 31,309 20,595 27,289 251,664
north Western
Kurunegala 28,239 26,351 14,212 20,641 14,456 10,795 16,826 131,520
Puttalam 15,121 16,231 13,271 14,026 9,025 5,018 9,474 82,166
Sub total 43,360 42,582 27,483 34,667 23,481 15,813 26,300 213,686
north Central
Anuradhapura 28,377 23,428 10,989 10,476 11,225 5,321 9,859 99,675
Polonnaruwa 12,232 10,658 3,221 4,362 6,559 4,363 5,993 47,388
Sub total 40,609 34,086 14,210 14,838 17,784 9,684 15,852 147,063
Uva
Badulla 8,129 8,238 7,499 10,795 5,633 11,236 5,826 57,356
Monaragala 8,239 10,453 11,383 9,702 8,839 10,245 9,225 68,086
Sub total 16,368 18,691 18,882 20,497 14,472 21,481 15,051 125,442
Sabaragamuwa
Ratnapura 2,932 1,160 1,032 1,121 1,839 1,956 1,672 11,712
Kegalle 2,129 2,234 1,956 2,157 1,436 945 1,322 12,179
Sub total 5,061 3,394 2,988 3,278 3,275 2,901 2,994 23,891
Sri Lanka Total 249,953 244,048 145,329 190,404 143,117 116,954 137,574 1,227,379
* Milking at Present** Not Milking(Dry) at Present*** Other (Infertile/Aged) Cows
Livestock Statistical Bulletin - 2015
8 Department of Animal Production and Health
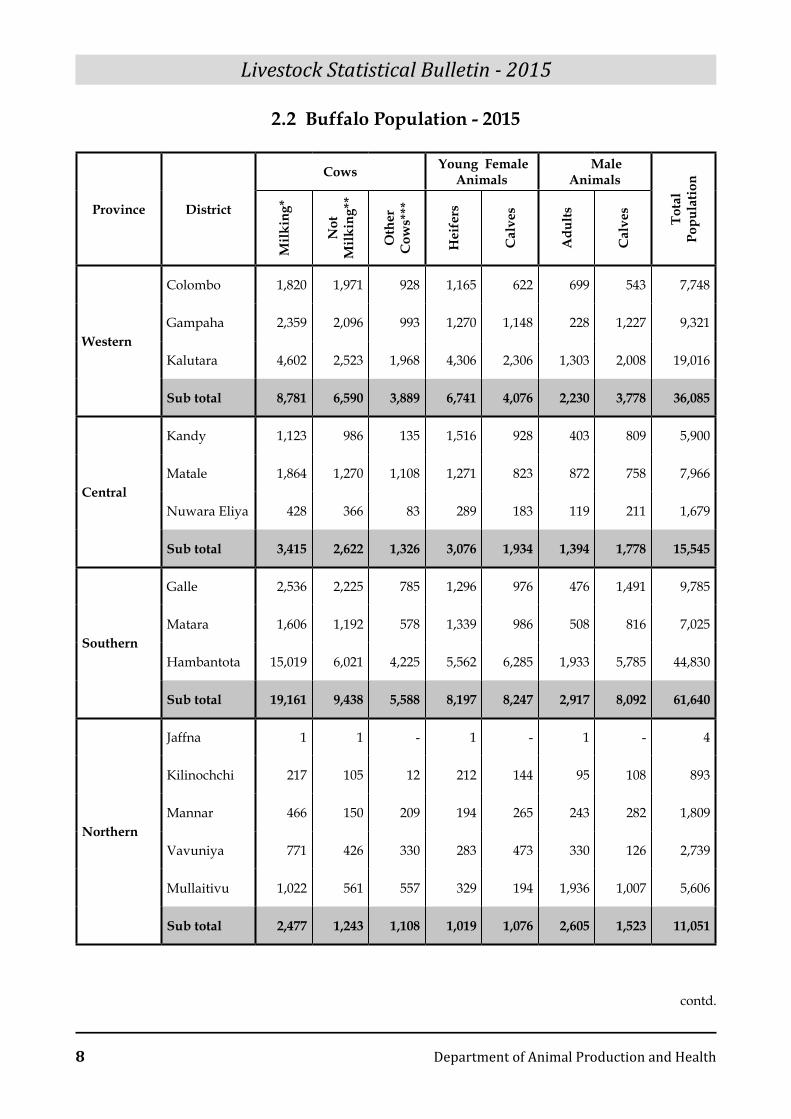
2.2 Buffalo Population - 2015
Province District
Cows Young Female Animals
Male Animals
Tota
l Po
pula
tion
Milk
ing*
not
M
ilkin
g**
Oth
er
Cow
s***
Hei
fers
Cal
ves
Adu
lts
Cal
ves
Western
Colombo 1,820 1,971 928 1,165 622 699 543 7,748
Gampaha 2,359 2,096 993 1,270 1,148 228 1,227 9,321
Kalutara 4,602 2,523 1,968 4,306 2,306 1,303 2,008 19,016
Sub total 8,781 6,590 3,889 6,741 4,076 2,230 3,778 36,085
Central
Kandy 1,123 986 135 1,516 928 403 809 5,900
Matale 1,864 1,270 1,108 1,271 823 872 758 7,966
Nuwara Eliya 428 366 83 289 183 119 211 1,679
Sub total 3,415 2,622 1,326 3,076 1,934 1,394 1,778 15,545
Southern
Galle 2,536 2,225 785 1,296 976 476 1,491 9,785
Matara 1,606 1,192 578 1,339 986 508 816 7,025
Hambantota 15,019 6,021 4,225 5,562 6,285 1,933 5,785 44,830
Sub total 19,161 9,438 5,588 8,197 8,247 2,917 8,092 61,640
northern
Jaffna 1 1 - 1 - 1 - 4
Kilinochchi 217 105 12 212 144 95 108 893
Mannar 466 150 209 194 265 243 282 1,809
Vavuniya 771 426 330 283 473 330 126 2,739
Mullaitivu 1,022 561 557 329 194 1,936 1,007 5,606
Sub total 2,477 1,243 1,108 1,019 1,076 2,605 1,523 11,051
contd.
Livestock Statistical Bulletin - 2015
Department of Animal Production and Health 9
Eastern
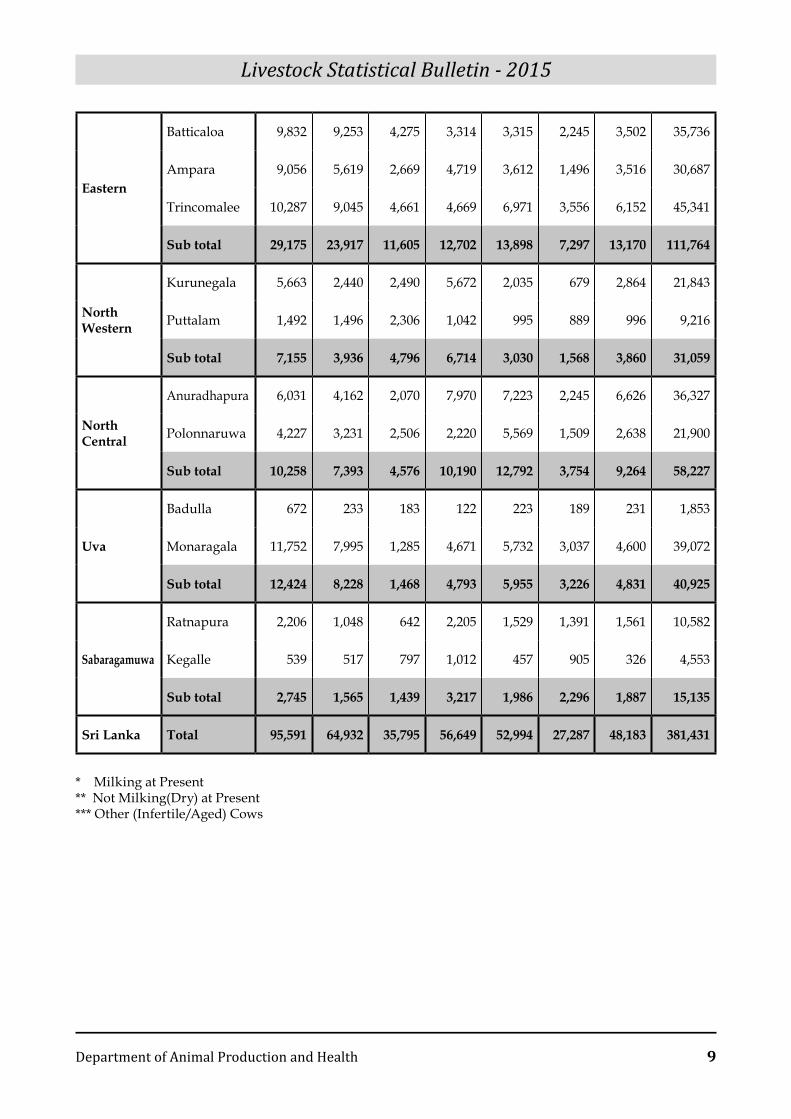
Batticaloa 9,832 9,253 4,275 3,314 3,315 2,245 3,502 35,736
Ampara 9,056 5,619 2,669 4,719 3,612 1,496 3,516 30,687
Trincomalee 10,287 9,045 4,661 4,669 6,971 3,556 6,152 45,341
Sub total 29,175 23,917 11,605 12,702 13,898 7,297 13,170 111,764
north Western
Kurunegala 5,663 2,440 2,490 5,672 2,035 679 2,864 21,843
Puttalam 1,492 1,496 2,306 1,042 995 889 996 9,216
Sub total 7,155 3,936 4,796 6,714 3,030 1,568 3,860 31,059
north Central
Anuradhapura 6,031 4,162 2,070 7,970 7,223 2,245 6,626 36,327
Polonnaruwa 4,227 3,231 2,506 2,220 5,569 1,509 2,638 21,900
Sub total 10,258 7,393 4,576 10,190 12,792 3,754 9,264 58,227
Uva
Badulla 672 233 183 122 223 189 231 1,853
Monaragala 11,752 7,995 1,285 4,671 5,732 3,037 4,600 39,072
Sub total 12,424 8,228 1,468 4,793 5,955 3,226 4,831 40,925
Sabaragamuwa
Ratnapura 2,206 1,048 642 2,205 1,529 1,391 1,561 10,582
Kegalle 539 517 797 1,012 457 905 326 4,553
Sub total 2,745 1,565 1,439 3,217 1,986 2,296 1,887 15,135
Sri Lanka Total 95,591 64,932 35,795 56,649 52,994 27,287 48,183 381,431
* Milking at Present** Not Milking(Dry) at Present*** Other (Infertile/Aged) Cows
Livestock Statistical Bulletin - 2015
10 Department of Animal Production and Health
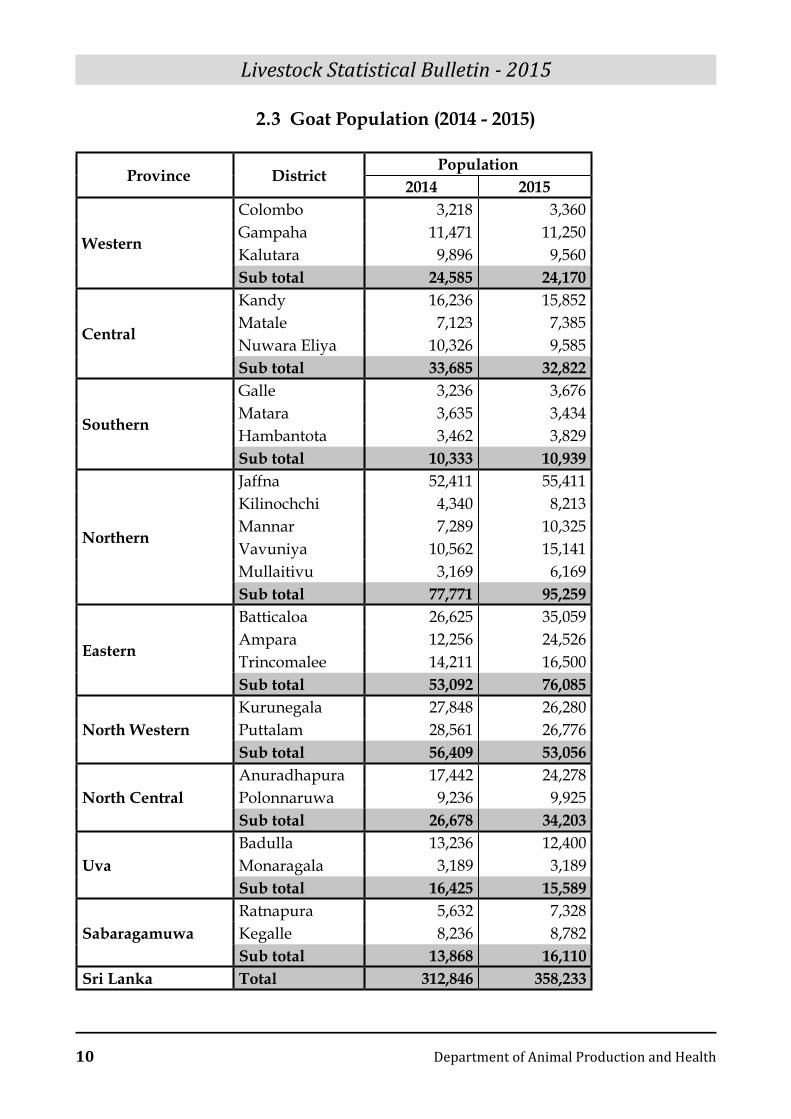
2.3 goat Population (2014 - 2015)
Province DistrictPopulation
2014 2015
Western
Colombo 3,218 3,360 Gampaha 11,471 11,250 Kalutara 9,896 9,560 Sub total 24,585 24,170
Central
Kandy 16,236 15,852 Matale 7,123 7,385 Nuwara Eliya 10,326 9,585 Sub total 33,685 32,822
Southern
Galle 3,236 3,676 Matara 3,635 3,434 Hambantota 3,462 3,829 Sub total 10,333 10,939
northern
Jaffna 52,411 55,411 Kilinochchi 4,340 8,213 Mannar 7,289 10,325 Vavuniya 10,562 15,141 Mullaitivu 3,169 6,169 Sub total 77,771 95,259
Eastern
Batticaloa 26,625 35,059 Ampara 12,256 24,526 Trincomalee 14,211 16,500 Sub total 53,092 76,085
north WesternKurunegala 27,848 26,280 Puttalam 28,561 26,776 Sub total 56,409 53,056
north CentralAnuradhapura 17,442 24,278 Polonnaruwa 9,236 9,925 Sub total 26,678 34,203
UvaBadulla 13,236 12,400 Monaragala 3,189 3,189 Sub total 16,425 15,589
SabaragamuwaRatnapura 5,632 7,328 Kegalle 8,236 8,782 Sub total 13,868 16,110
Sri Lanka Total 312,846 358,233
Livestock Statistical Bulletin - 2015
Department of Animal Production and Health 11
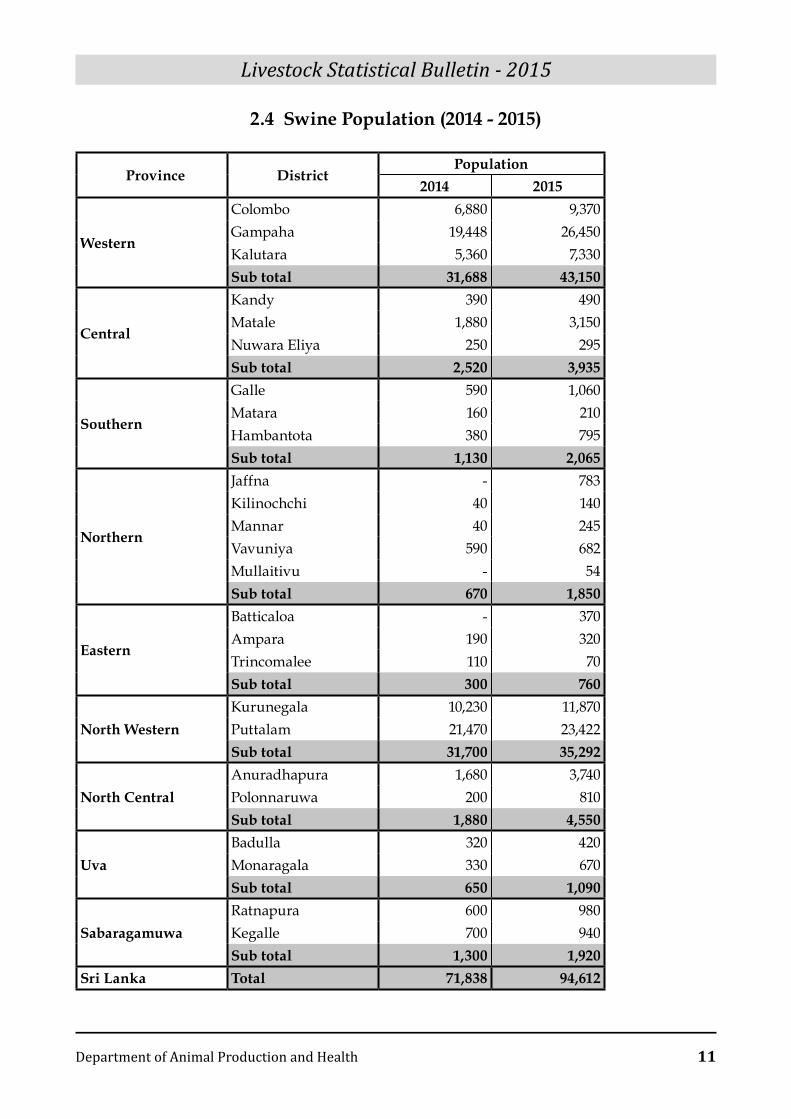
2.4 Swine Population (2014 - 2015)
Province DistrictPopulation
2014 2015
Western
Colombo 6,880 9,370 Gampaha 19,448 26,450 Kalutara 5,360 7,330 Sub total 31,688 43,150
Central
Kandy 390 490 Matale 1,880 3,150 Nuwara Eliya 250 295 Sub total 2,520 3,935
Southern
Galle 590 1,060 Matara 160 210 Hambantota 380 795 Sub total 1,130 2,065
northern
Jaffna - 783 Kilinochchi 40 140 Mannar 40 245 Vavuniya 590 682 Mullaitivu - 54 Sub total 670 1,850
Eastern
Batticaloa - 370 Ampara 190 320 Trincomalee 110 70 Sub total 300 760
north WesternKurunegala 10,230 11,870 Puttalam 21,470 23,422 Sub total 31,700 35,292
north CentralAnuradhapura 1,680 3,740 Polonnaruwa 200 810 Sub total 1,880 4,550
UvaBadulla 320 420 Monaragala 330 670 Sub total 650 1,090
SabaragamuwaRatnapura 600 980 Kegalle 700 940 Sub total 1,300 1,920
Sri Lanka Total 71,838 94,612
Livestock Statistical Bulletin - 2015
12 Department of Animal Production and Health
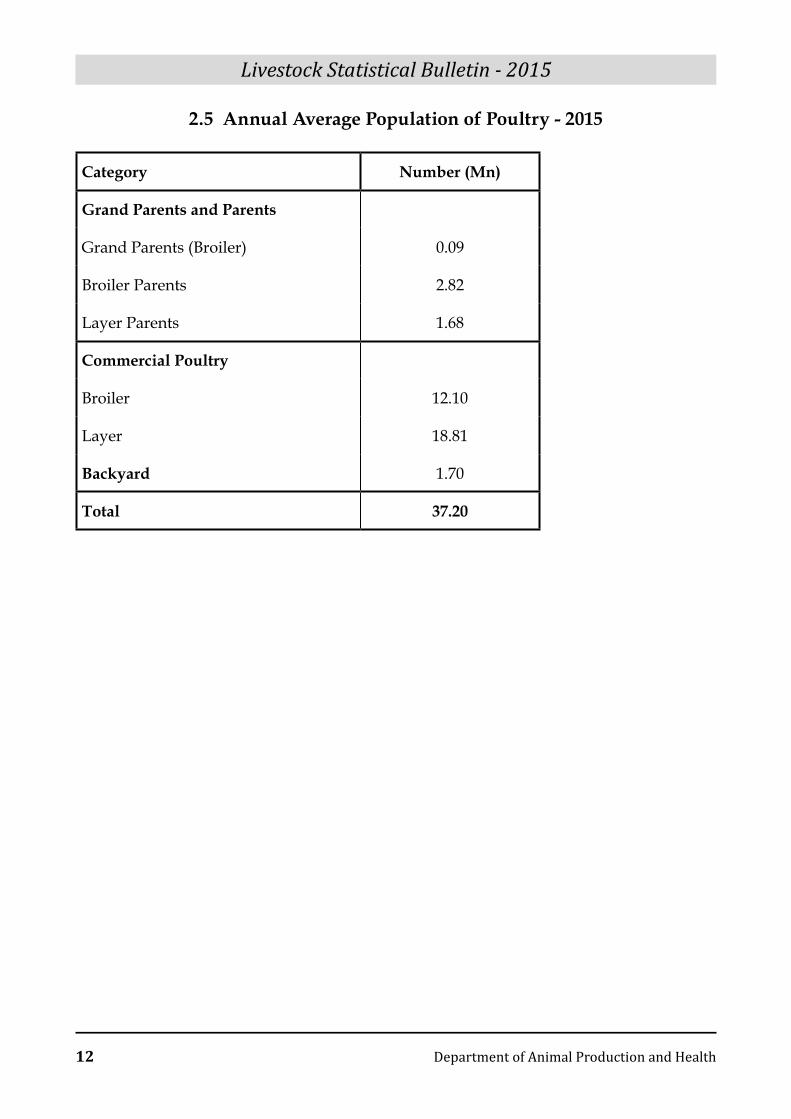
2.5 Annual Average Population of Poultry - 2015
Category number (Mn)
grand Parents and Parents
Grand Parents (Broiler) 0.09
Broiler Parents 2.82
Layer Parents 1.68
Commercial Poultry
Broiler 12.10
Layer 18.81
Backyard 1.70
Total 37.20
Livestock Statistical Bulletin - 2015
Department of Animal Production and Health 13
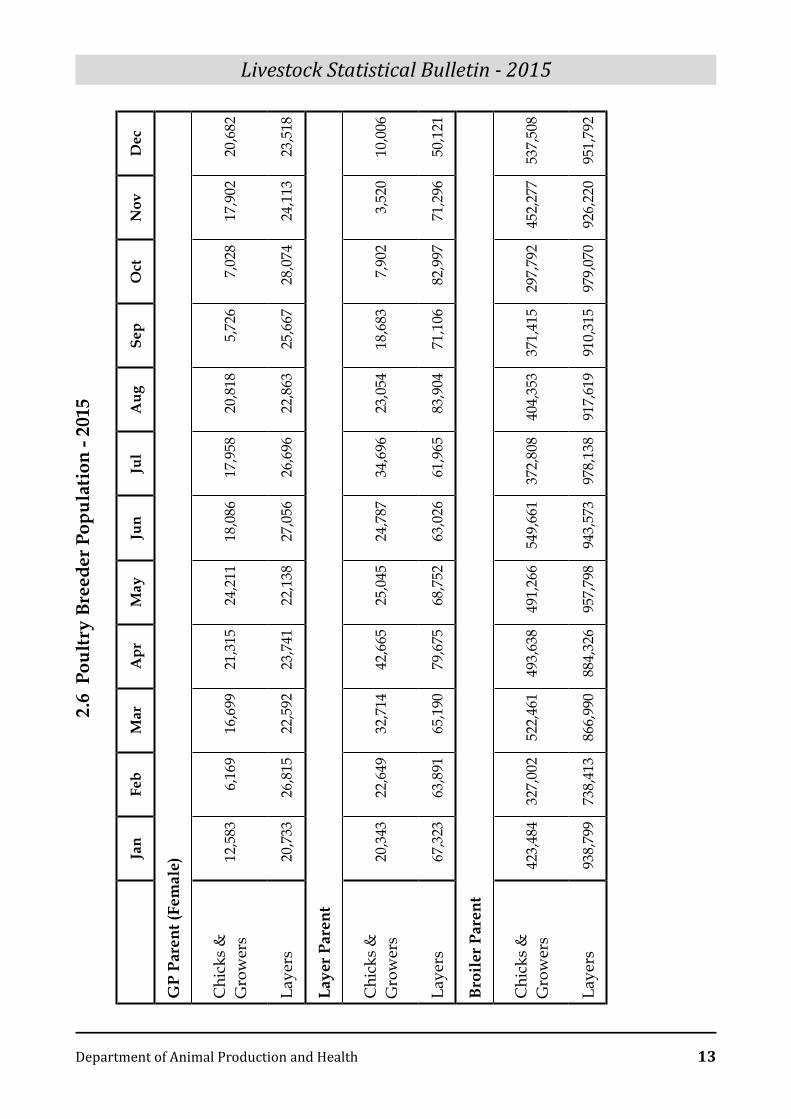
2.6
Pou
ltry
Bre
eder
Pop
ulat
ion
- 201
5
Jan
Feb
Mar
Apr
May
Jun
Jul
Aug
Sep
Oct
nov
Dec
gP
Pare
nt (F
emal
e)
Chi
cks
&
Gro
wer
s 1
2,58
3 6
,169
1
6,69
9 2
1,31
5 2
4,21
1 1
8,08
6 1
7,95
8 2
0,81
8 5
,726
7
,028
1
7,90
2 2
0,68
2
Laye
rs 2
0,73
3 2
6,81
5 2
2,59
2 2
3,74
1 2
2,13
8 2
7,05
6 2
6,69
6 2
2,86
3 2
5,66
7 2
8,07
4 2
4,11
3 2
3,51
8
Laye
r Par
ent
Chi
cks
&
Gro
wer
s 2
0,34
3 2
2,64
9 3
2,71
4 4
2,66
5 2
5,04
5 2
4,78
7 3
4,69
6 2
3,05
4 1
8,68
3 7
,902
3
,520
1
0,00
6
Laye
rs 6
7,32
3 6
3,89
1 6
5,19
0 7
9,67
5 6
8,75
2 6
3,02
6 6
1,96
5 8
3,90
4 7
1,10
6 8
2,99
7 7
1,29
6 5
0,12
1
Broi
ler P
aren
t
Chi
cks
&
Gro
wer
s 4
23,4
84
327
,002
5
22,4
61
493
,638
4
91,2
66
549
,661
3
72,8
08
404
,353
3
71,4
15
297
,792
4
52,2
77
537
,508
Laye
rs 9
38,7
99
738
,413
8
66,9
90
884
,326
9
57,7
98
943
,573
9
78,1
38
917
,619
9
10,3
15
979
,070
9
26,2
20
951
,792
Livestock Statistical Bulletin - 2015
14 Department of Animal Production and Health
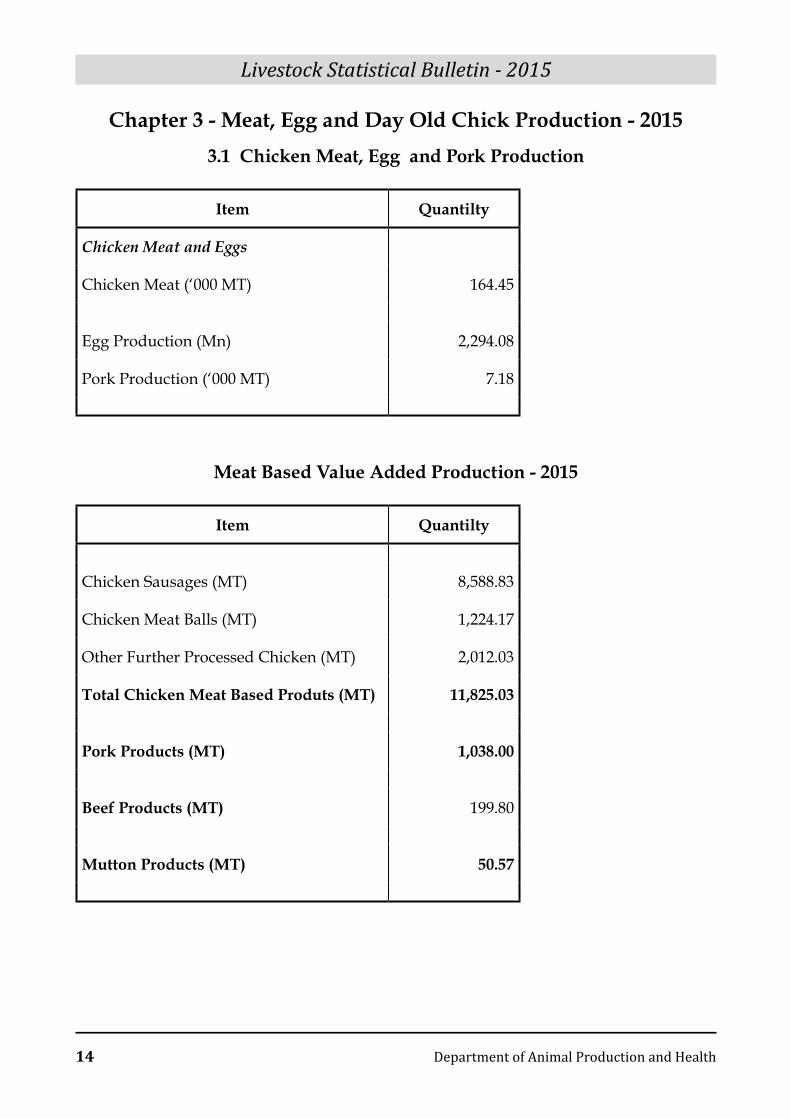
Chapter 3 - Meat, Egg and Day Old Chick Production - 20153.1 Chicken Meat, Egg and Pork Production
Item Quantilty
Chicken Meat and Eggs
Chicken Meat (‘000 MT) 164.45
Egg Production (Mn) 2,294.08
Pork Production (‘000 MT) 7.18
Meat Based Value Added Production - 2015
Item Quantilty
Chicken Sausages (MT) 8,588.83
Chicken Meat Balls (MT) 1,224.17
Other Further Processed Chicken (MT) 2,012.03
Total Chicken Meat Based Produts (MT) 11,825.03
Pork Products (MT) 1,038.00
Beef Products (MT) 199.80
Mutton Products (MT) 50.57
Livestock Statistical Bulletin - 2015
Department of Animal Production and Health 15
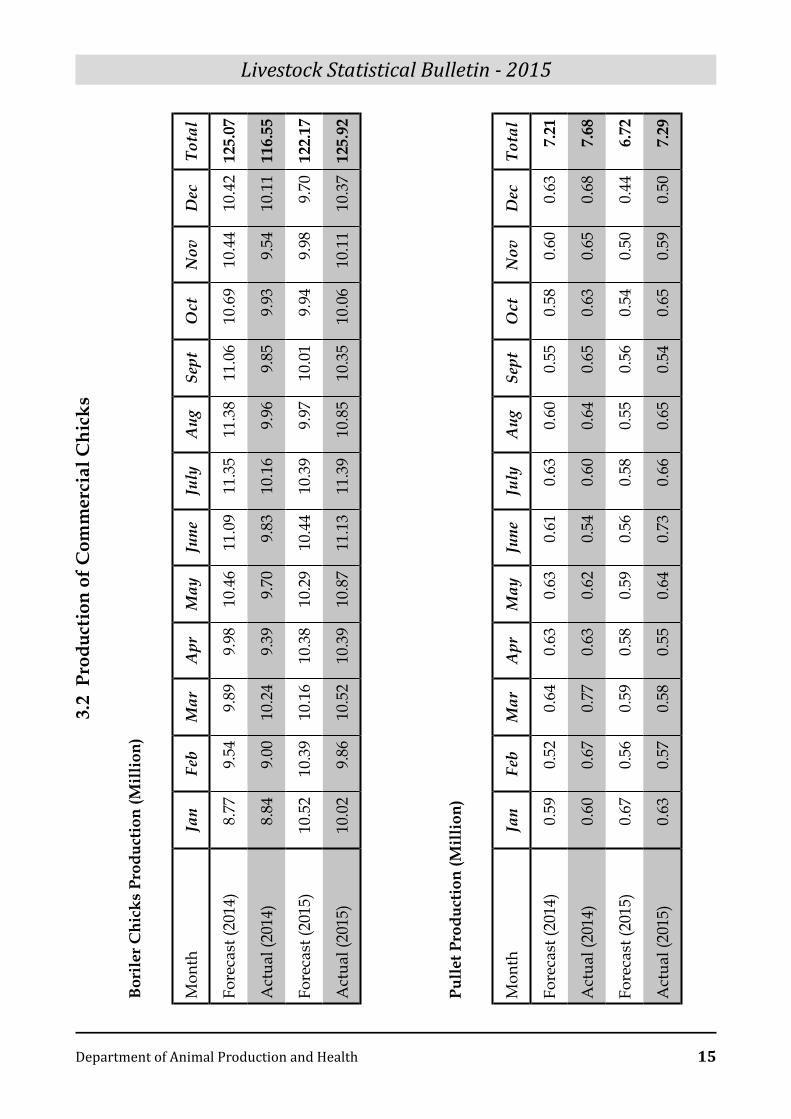
3.2
Pro
duct
ion
of C
omm
erci
al C
hick
s
Bori
ler C
hick
s Pr
oduc
tion
(Mill
ion)
Mon
th
Jan
Feb
Mar
Apr
May
June
July
Aug
Sept
Oct
Nov
Dec
Tota
l
Fore
cast
(201
4)8.
779.
549.
899.
9810
.46
11.0
911
.35
11.3
811
.06
10.6
910
.44
10.4
212
5.07
Act
ual (
2014
)8.
849.
0010
.24
9.39
9.70
9.83
10.1
69.
969.
859.
939.
5410
.11
116.
55
Fore
cast
(201
5)10
.52
10.3
910
.16
10.3
810
.29
10.4
410
.39
9.97
10.0
19.
949.
989.
7012
2.17
Act
ual (
2015
)10
.02
9.86
10.5
210
.39
10.8
711
.13
11.3
910
.85
10.3
510
.06
10.1
110
.37
125.
92
Pulle
t Pro
duct
ion
(Mill
ion)
Mon
th
Jan
Feb
Mar
Apr
May
June
July
Aug
Sept
Oct
Nov
Dec
Tota
l
Fore
cast
(201
4)0.
590.
520.
640.
630.
630.
610.
630.
600.
550.
580.
600.
637.
21
Act
ual (
2014
)0.
600.
670.
770.
630.
620.
540.
600.
640.
650.
630.
650.
687.
68
Fore
cast
(201
5)0.
670.
560.
590.
580.
590.
560.
580.
550.
560.
540.
500.
446.
72
Act
ual (
2015
)0.
630.
570.
580.
550.
640.
730.
660.
650.
540.
650.
590.
507.
29
Livestock Statistical Bulletin - 2015
16 Department of Animal Production and Health
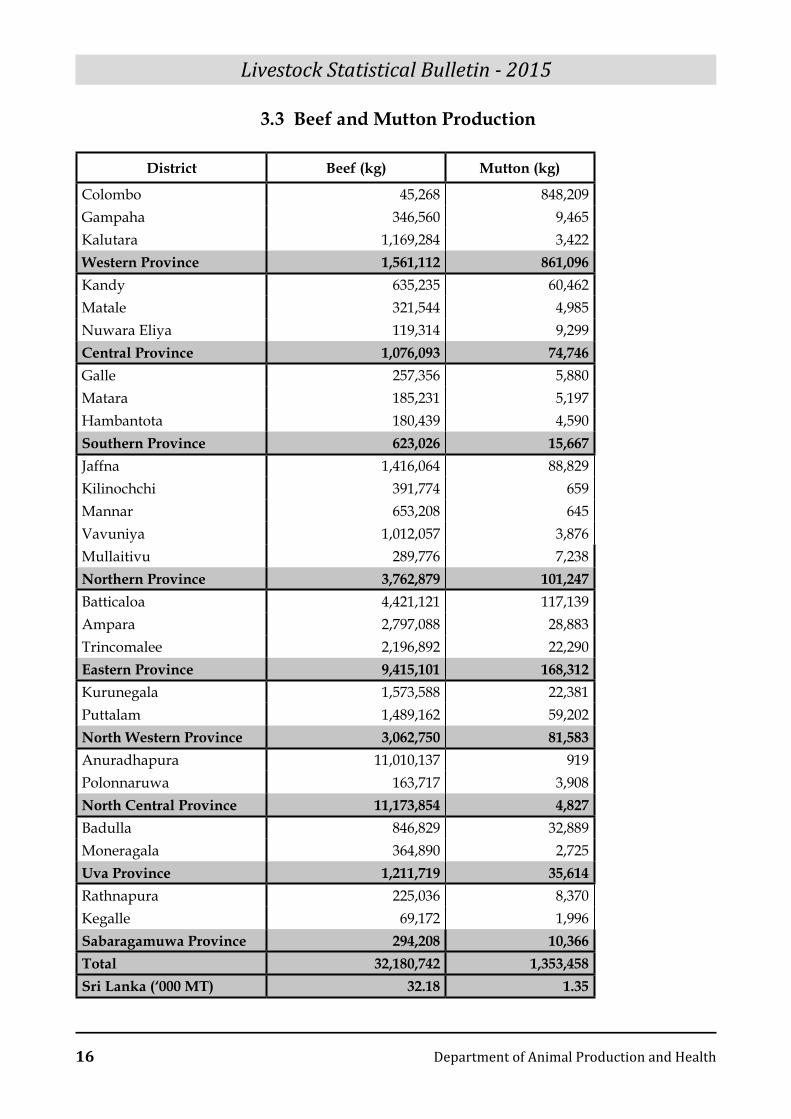
3.3 Beef and Mutton Production
District Beef (kg) Mutton (kg)
Colombo 45,268 848,209 Gampaha 346,560 9,465 Kalutara 1,169,284 3,422 Western Province 1,561,112 861,096 Kandy 635,235 60,462 Matale 321,544 4,985 Nuwara Eliya 119,314 9,299 Central Province 1,076,093 74,746 Galle 257,356 5,880 Matara 185,231 5,197 Hambantota 180,439 4,590 Southern Province 623,026 15,667 Jaffna 1,416,064 88,829 Kilinochchi 391,774 659 Mannar 653,208 645 Vavuniya 1,012,057 3,876 Mullaitivu 289,776 7,238 northern Province 3,762,879 101,247 Batticaloa 4,421,121 117,139 Ampara 2,797,088 28,883 Trincomalee 2,196,892 22,290 Eastern Province 9,415,101 168,312 Kurunegala 1,573,588 22,381 Puttalam 1,489,162 59,202 north Western Province 3,062,750 81,583 Anuradhapura 11,010,137 919 Polonnaruwa 163,717 3,908 north Central Province 11,173,854 4,827 Badulla 846,829 32,889 Moneragala 364,890 2,725 Uva Province 1,211,719 35,614 Rathnapura 225,036 8,370 Kegalle 69,172 1,996 Sabaragamuwa Province 294,208 10,366 Total 32,180,742 1,353,458 Sri Lanka (‘000 MT) 32.18 1.35
Livestock Statistical Bulletin - 2015
Department of Animal Production and Health 17
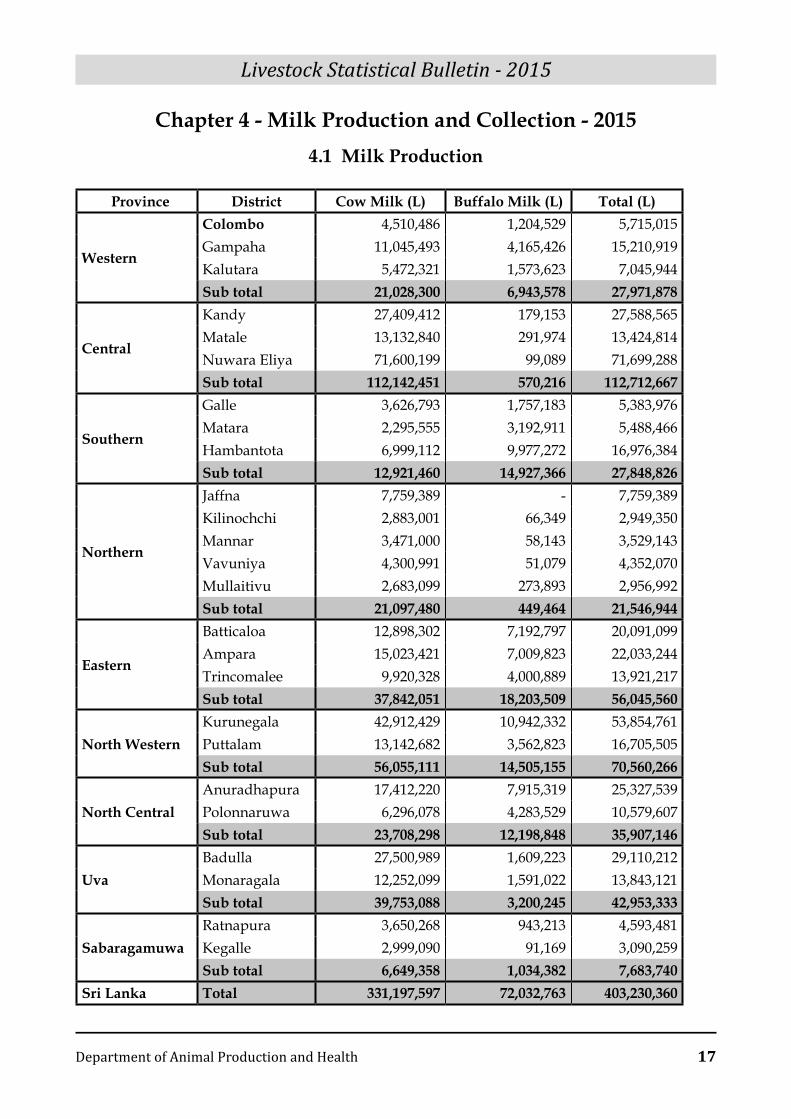
Chapter 4 - Milk Production and Collection - 20154.1 Milk Production
Province District Cow Milk (L) Buffalo Milk (L) Total (L)
Western
Colombo 4,510,486 1,204,529 5,715,015 Gampaha 11,045,493 4,165,426 15,210,919 Kalutara 5,472,321 1,573,623 7,045,944 Sub total 21,028,300 6,943,578 27,971,878
Central
Kandy 27,409,412 179,153 27,588,565 Matale 13,132,840 291,974 13,424,814 Nuwara Eliya 71,600,199 99,089 71,699,288 Sub total 112,142,451 570,216 112,712,667
Southern
Galle 3,626,793 1,757,183 5,383,976 Matara 2,295,555 3,192,911 5,488,466 Hambantota 6,999,112 9,977,272 16,976,384 Sub total 12,921,460 14,927,366 27,848,826
northern
Jaffna 7,759,389 - 7,759,389 Kilinochchi 2,883,001 66,349 2,949,350 Mannar 3,471,000 58,143 3,529,143 Vavuniya 4,300,991 51,079 4,352,070 Mullaitivu 2,683,099 273,893 2,956,992 Sub total 21,097,480 449,464 21,546,944
Eastern
Batticaloa 12,898,302 7,192,797 20,091,099 Ampara 15,023,421 7,009,823 22,033,244 Trincomalee 9,920,328 4,000,889 13,921,217 Sub total 37,842,051 18,203,509 56,045,560
north WesternKurunegala 42,912,429 10,942,332 53,854,761 Puttalam 13,142,682 3,562,823 16,705,505 Sub total 56,055,111 14,505,155 70,560,266
north CentralAnuradhapura 17,412,220 7,915,319 25,327,539 Polonnaruwa 6,296,078 4,283,529 10,579,607 Sub total 23,708,298 12,198,848 35,907,146
UvaBadulla 27,500,989 1,609,223 29,110,212 Monaragala 12,252,099 1,591,022 13,843,121 Sub total 39,753,088 3,200,245 42,953,333
SabaragamuwaRatnapura 3,650,268 943,213 4,593,481 Kegalle 2,999,090 91,169 3,090,259 Sub total 6,649,358 1,034,382 7,683,740
Sri Lanka Total 331,197,597 72,032,763 403,230,360
Livestock Statistical Bulletin - 2015
18 Department of Animal Production and Health
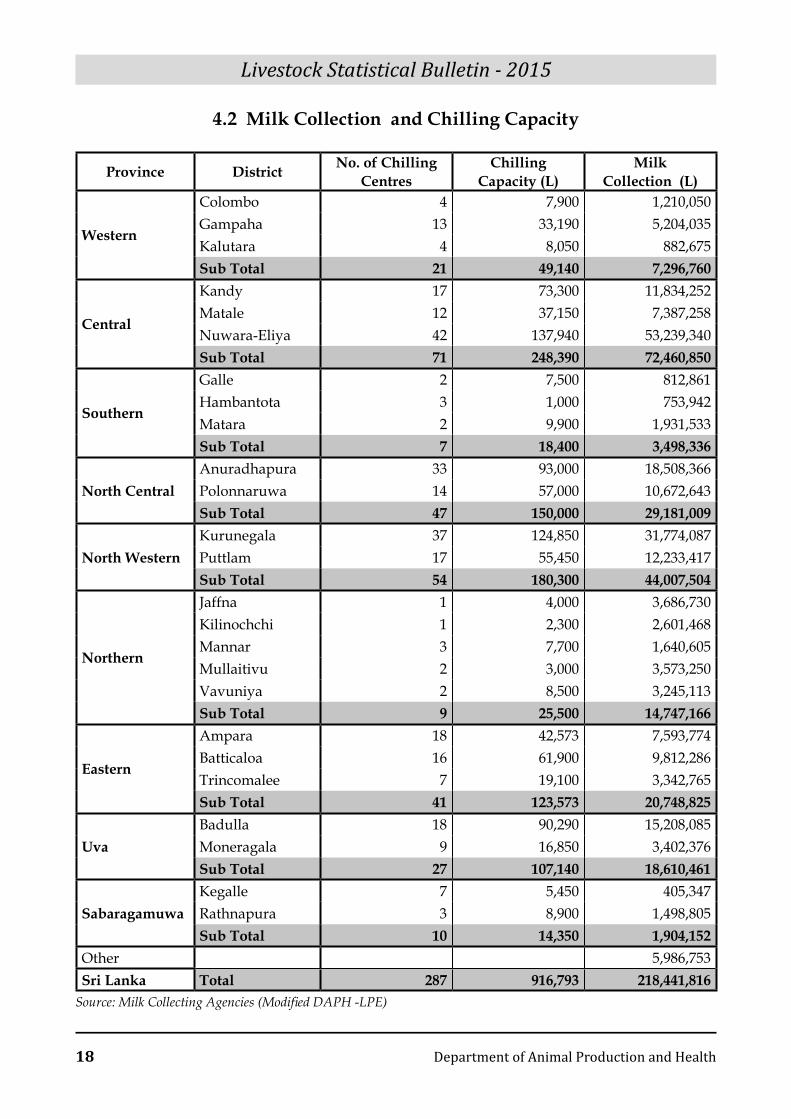
4.2 Milk Collection and Chilling Capacity
Province District no. of Chilling Centres
Chilling Capacity (L)
Milk Collection (L)
Western
Colombo 4 7,900 1,210,050 Gampaha 13 33,190 5,204,035 Kalutara 4 8,050 882,675 Sub Total 21 49,140 7,296,760
Central
Kandy 17 73,300 11,834,252 Matale 12 37,150 7,387,258 Nuwara-Eliya 42 137,940 53,239,340 Sub Total 71 248,390 72,460,850
Southern
Galle 2 7,500 812,861 Hambantota 3 1,000 753,942 Matara 2 9,900 1,931,533 Sub Total 7 18,400 3,498,336
north CentralAnuradhapura 33 93,000 18,508,366 Polonnaruwa 14 57,000 10,672,643 Sub Total 47 150,000 29,181,009
north WesternKurunegala 37 124,850 31,774,087 Puttlam 17 55,450 12,233,417 Sub Total 54 180,300 44,007,504
northern
Jaffna 1 4,000 3,686,730 Kilinochchi 1 2,300 2,601,468 Mannar 3 7,700 1,640,605 Mullaitivu 2 3,000 3,573,250 Vavuniya 2 8,500 3,245,113 Sub Total 9 25,500 14,747,166
Eastern
Ampara 18 42,573 7,593,774 Batticaloa 16 61,900 9,812,286 Trincomalee 7 19,100 3,342,765 Sub Total 41 123,573 20,748,825
UvaBadulla 18 90,290 15,208,085 Moneragala 9 16,850 3,402,376 Sub Total 27 107,140 18,610,461
SabaragamuwaKegalle 7 5,450 405,347 Rathnapura 3 8,900 1,498,805 Sub Total 10 14,350 1,904,152
Other 5,986,753 Sri Lanka Total 287 916,793 218,441,816
Source: Milk Collecting Agencies (Modified DAPH -LPE)
Livestock Statistical Bulletin - 2015
Department of Animal Production and Health 19
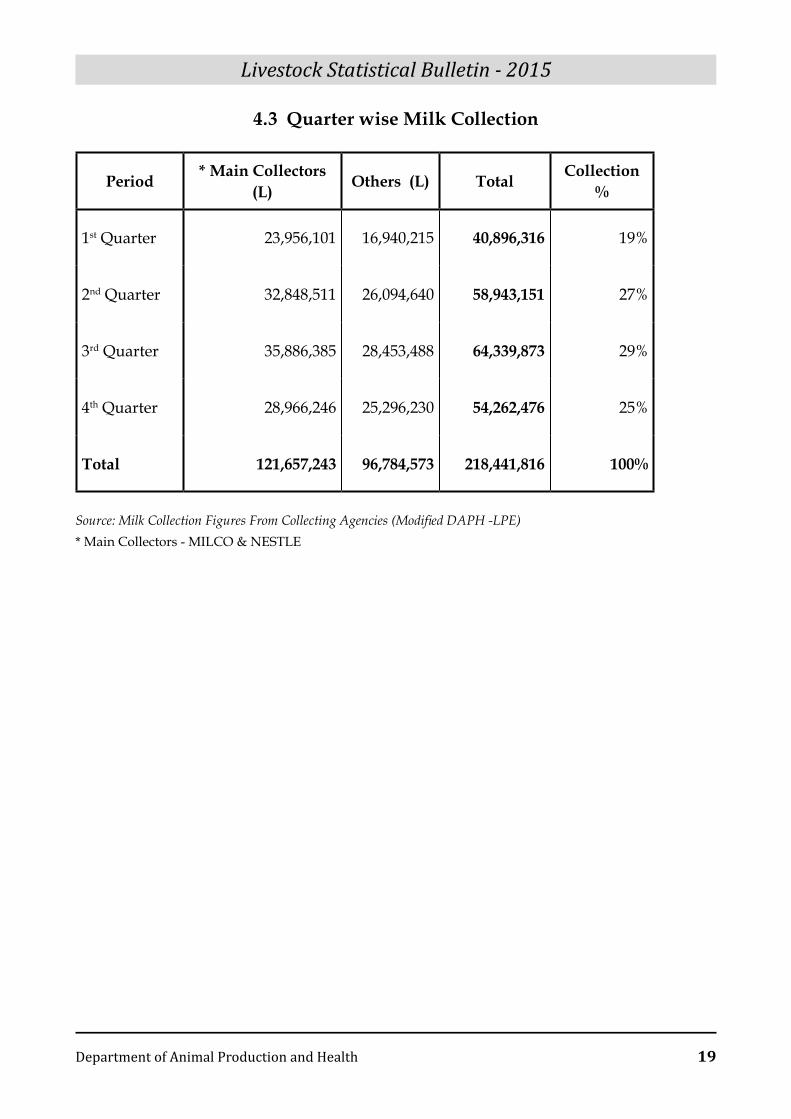
4.3 Quarter wise Milk Collection
Period * Main Collectors (L) Others (L) Total Collection
%
1st Quarter 23,956,101 16,940,215 40,896,316 19%
2nd Quarter 32,848,511 26,094,640 58,943,151 27%
3rd Quarter 35,886,385 28,453,488 64,339,873 29%
4th Quarter 28,966,246 25,296,230 54,262,476 25%
Total 121,657,243 96,784,573 218,441,816 100%
Source: Milk Collection Figures From Collecting Agencies (Modified DAPH -LPE)* Main Collectors - MILCO & NESTLE
Livestock Statistical Bulletin - 2015
20 Department of Animal Production and Health
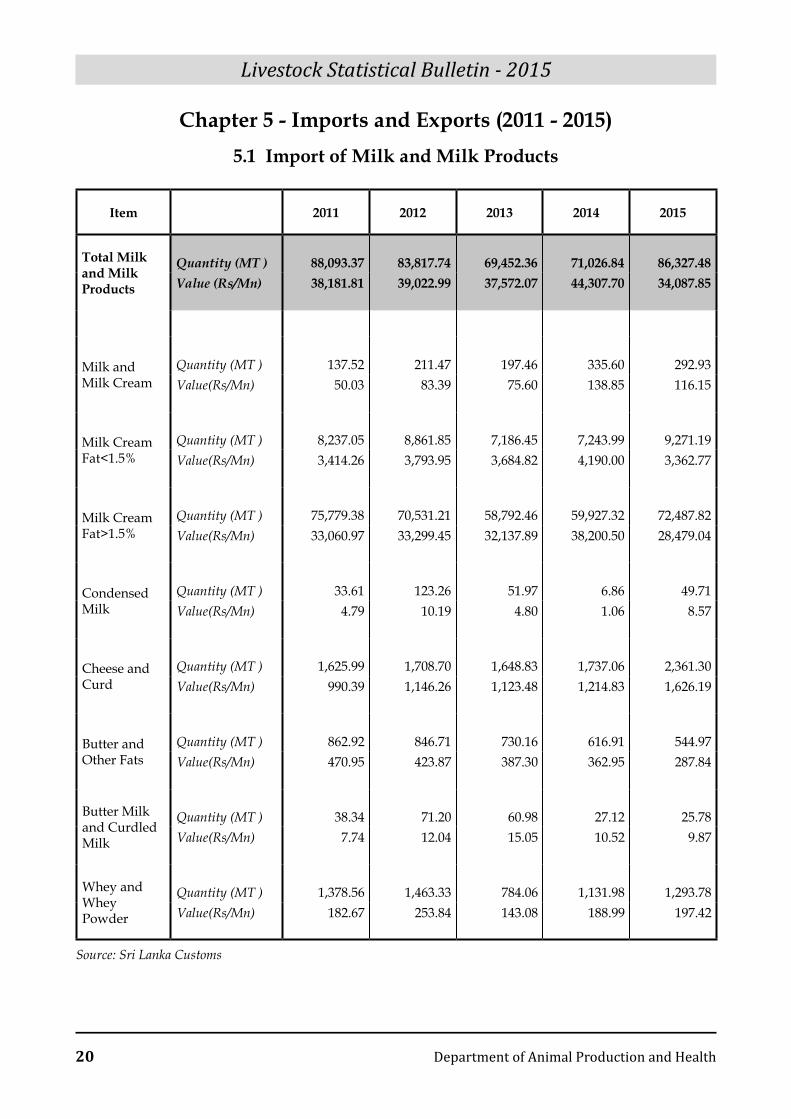
Chapter 5 - Imports and Exports (2011 - 2015)5.1 Import of Milk and Milk Products
Item 2011 2012 2013 2014 2015
Total Milk and Milk Products
Quantity (MT ) 88,093.37 83,817.74 69,452.36 71,026.84 86,327.48 Value (Rs/Mn) 38,181.81 39,022.99 37,572.07 44,307.70 34,087.85
Milk and Milk Cream
Quantity (MT ) 137.52 211.47 197.46 335.60 292.93 Value(Rs/Mn) 50.03 83.39 75.60 138.85 116.15
Milk Cream Fat<1.5%
Quantity (MT ) 8,237.05 8,861.85 7,186.45 7,243.99 9,271.19 Value(Rs/Mn) 3,414.26 3,793.95 3,684.82 4,190.00 3,362.77
Milk Cream Fat>1.5%
Quantity (MT ) 75,779.38 70,531.21 58,792.46 59,927.32 72,487.82 Value(Rs/Mn) 33,060.97 33,299.45 32,137.89 38,200.50 28,479.04
Condensed Milk
Quantity (MT ) 33.61 123.26 51.97 6.86 49.71 Value(Rs/Mn) 4.79 10.19 4.80 1.06 8.57
Cheese and Curd
Quantity (MT ) 1,625.99 1,708.70 1,648.83 1,737.06 2,361.30 Value(Rs/Mn) 990.39 1,146.26 1,123.48 1,214.83 1,626.19
Butter and Other Fats
Quantity (MT ) 862.92 846.71 730.16 616.91 544.97 Value(Rs/Mn) 470.95 423.87 387.30 362.95 287.84
Butter Milk and Curdled Milk
Quantity (MT ) 38.34 71.20 60.98 27.12 25.78 Value(Rs/Mn) 7.74 12.04 15.05 10.52 9.87
Whey and Whey Powder
Quantity (MT ) 1,378.56 1,463.33 784.06 1,131.98 1,293.78 Value(Rs/Mn) 182.67 253.84 143.08 188.99 197.42
Source: Sri Lanka Customs
Livestock Statistical Bulletin - 2015
Department of Animal Production and Health 21
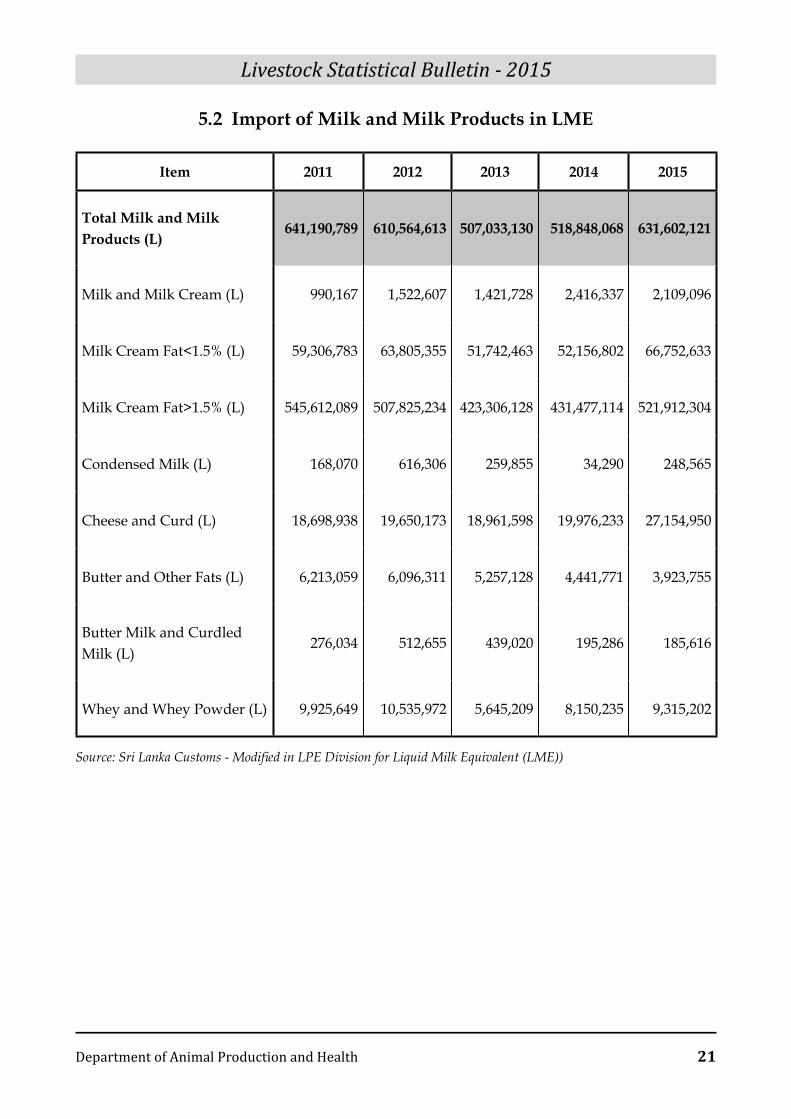
5.2 Import of Milk and Milk Products in LME
Item 2011 2012 2013 2014 2015
Total Milk and Milk Products (L)
641,190,789 610,564,613 507,033,130 518,848,068 631,602,121
Milk and Milk Cream (L) 990,167 1,522,607 1,421,728 2,416,337 2,109,096
Milk Cream Fat<1.5% (L) 59,306,783 63,805,355 51,742,463 52,156,802 66,752,633
Milk Cream Fat>1.5% (L) 545,612,089 507,825,234 423,306,128 431,477,114 521,912,304
Condensed Milk (L) 168,070 616,306 259,855 34,290 248,565
Cheese and Curd (L) 18,698,938 19,650,173 18,961,598 19,976,233 27,154,950
Butter and Other Fats (L) 6,213,059 6,096,311 5,257,128 4,441,771 3,923,755
Butter Milk and Curdled Milk (L)
276,034 512,655 439,020 195,286 185,616
Whey and Whey Powder (L) 9,925,649 10,535,972 5,645,209 8,150,235 9,315,202
Source: Sri Lanka Customs - Modified in LPE Division for Liquid Milk Equivalent (LME))
Livestock Statistical Bulletin - 2015
22 Department of Animal Production and Health
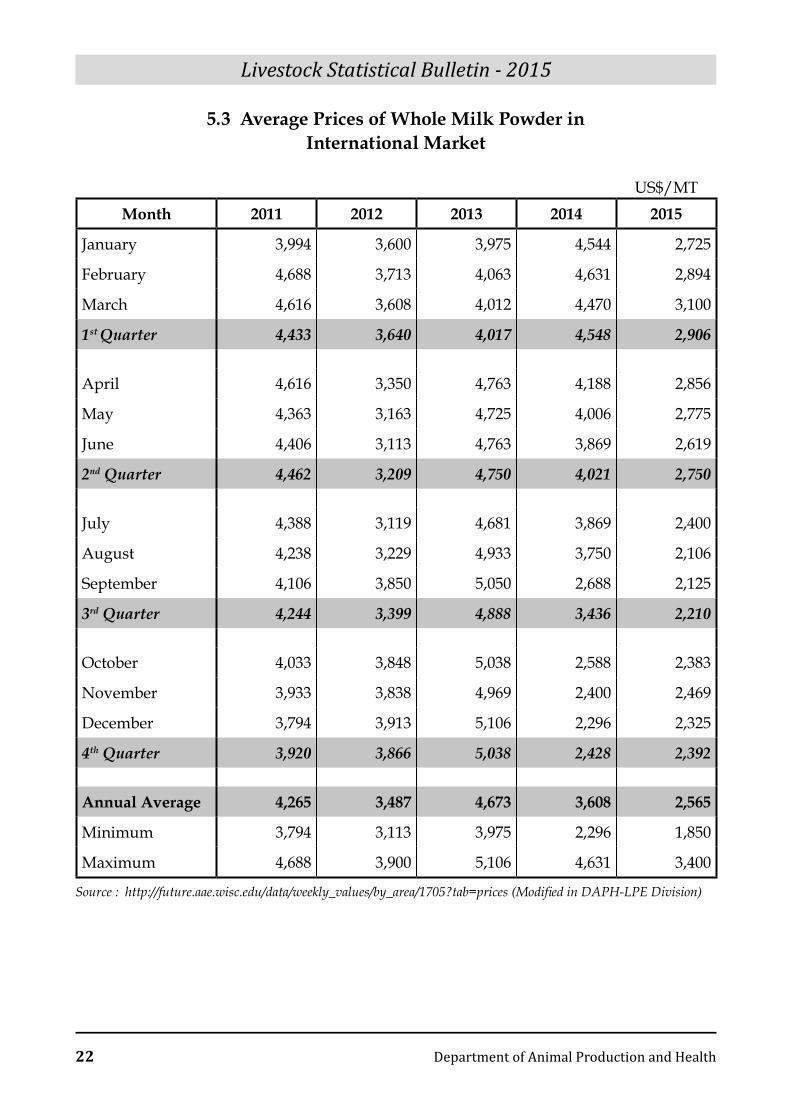
5.3 Average Prices of Whole Milk Powder inInternational Market
US$/MTMonth 2011 2012 2013 2014 2015
January 3,994 3,600 3,975 4,544 2,725
February 4,688 3,713 4,063 4,631 2,894
March 4,616 3,608 4,012 4,470 3,100
1st Quarter 4,433 3,640 4,017 4,548 2,906
April 4,616 3,350 4,763 4,188 2,856
May 4,363 3,163 4,725 4,006 2,775
June 4,406 3,113 4,763 3,869 2,619
2nd Quarter 4,462 3,209 4,750 4,021 2,750
July 4,388 3,119 4,681 3,869 2,400
August 4,238 3,229 4,933 3,750 2,106
September 4,106 3,850 5,050 2,688 2,125
3rd Quarter 4,244 3,399 4,888 3,436 2,210
October 4,033 3,848 5,038 2,588 2,383
November 3,933 3,838 4,969 2,400 2,469
December 3,794 3,913 5,106 2,296 2,325
4th Quarter 3,920 3,866 5,038 2,428 2,392
Annual Average 4,265 3,487 4,673 3,608 2,565
Minimum 3,794 3,113 3,975 2,296 1,850
Maximum 4,688 3,900 5,106 4,631 3,400
Source : http://future.aae.wisc.edu/data/weekly_values/by_area/1705?tab=prices (Modified in DAPH-LPE Division)
Livestock Statistical Bulletin - 2015
Department of Animal Production and Health 23
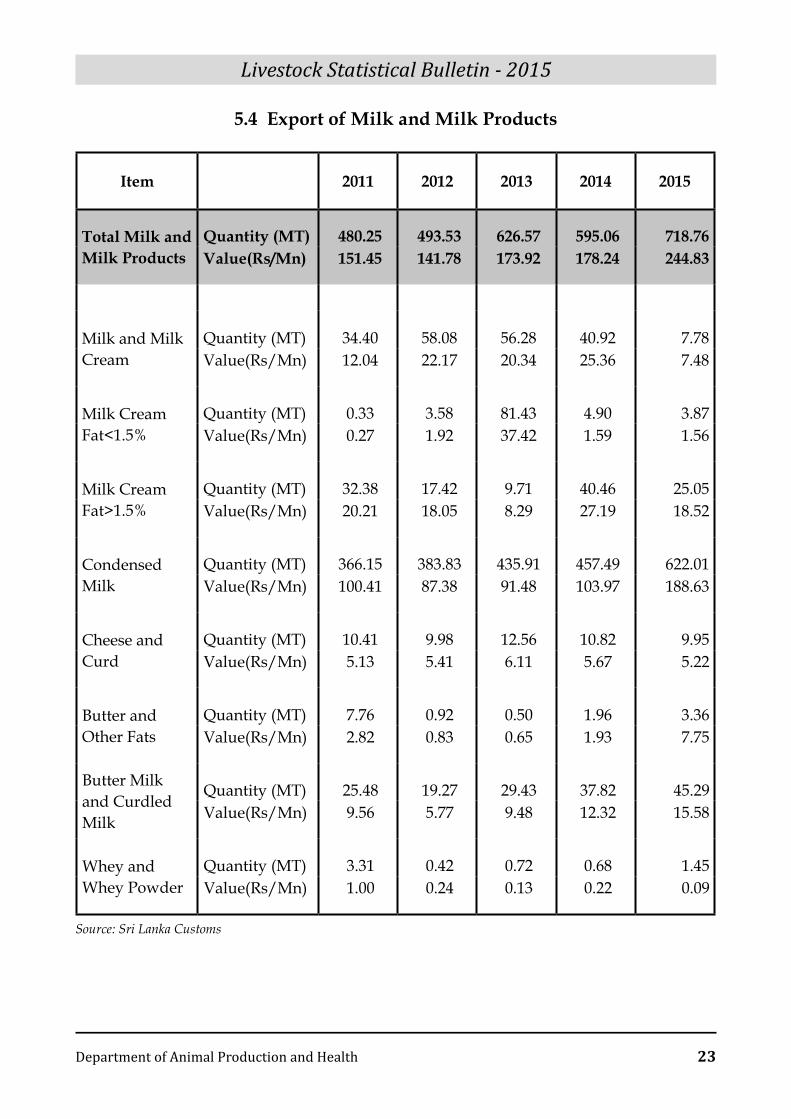
5.4 Export of Milk and Milk Products
Item 2011 2012 2013 2014 2015
Total Milk and Milk Products
Quantity (MT) 480.25 493.53 626.57 595.06 718.76 Value(Rs/Mn) 151.45 141.78 173.92 178.24 244.83
Milk and Milk Cream
Quantity (MT) 34.40 58.08 56.28 40.92 7.78 Value(Rs/Mn) 12.04 22.17 20.34 25.36 7.48
Milk Cream Fat<1.5%
Quantity (MT) 0.33 3.58 81.43 4.90 3.87 Value(Rs/Mn) 0.27 1.92 37.42 1.59 1.56
Milk Cream Fat>1.5%
Quantity (MT) 32.38 17.42 9.71 40.46 25.05 Value(Rs/Mn) 20.21 18.05 8.29 27.19 18.52
Condensed Milk
Quantity (MT) 366.15 383.83 435.91 457.49 622.01 Value(Rs/Mn) 100.41 87.38 91.48 103.97 188.63
Cheese and Curd
Quantity (MT) 10.41 9.98 12.56 10.82 9.95 Value(Rs/Mn) 5.13 5.41 6.11 5.67 5.22
Butter and Other Fats
Quantity (MT) 7.76 0.92 0.50 1.96 3.36 Value(Rs/Mn) 2.82 0.83 0.65 1.93 7.75
Butter Milk and Curdled Milk
Quantity (MT) 25.48 19.27 29.43 37.82 45.29 Value(Rs/Mn) 9.56 5.77 9.48 12.32 15.58
Whey and Whey Powder
Quantity (MT) 3.31 0.42 0.72 0.68 1.45 Value(Rs/Mn) 1.00 0.24 0.13 0.22 0.09
Source: Sri Lanka Customs
Livestock Statistical Bulletin - 2015
24 Department of Animal Production and Health
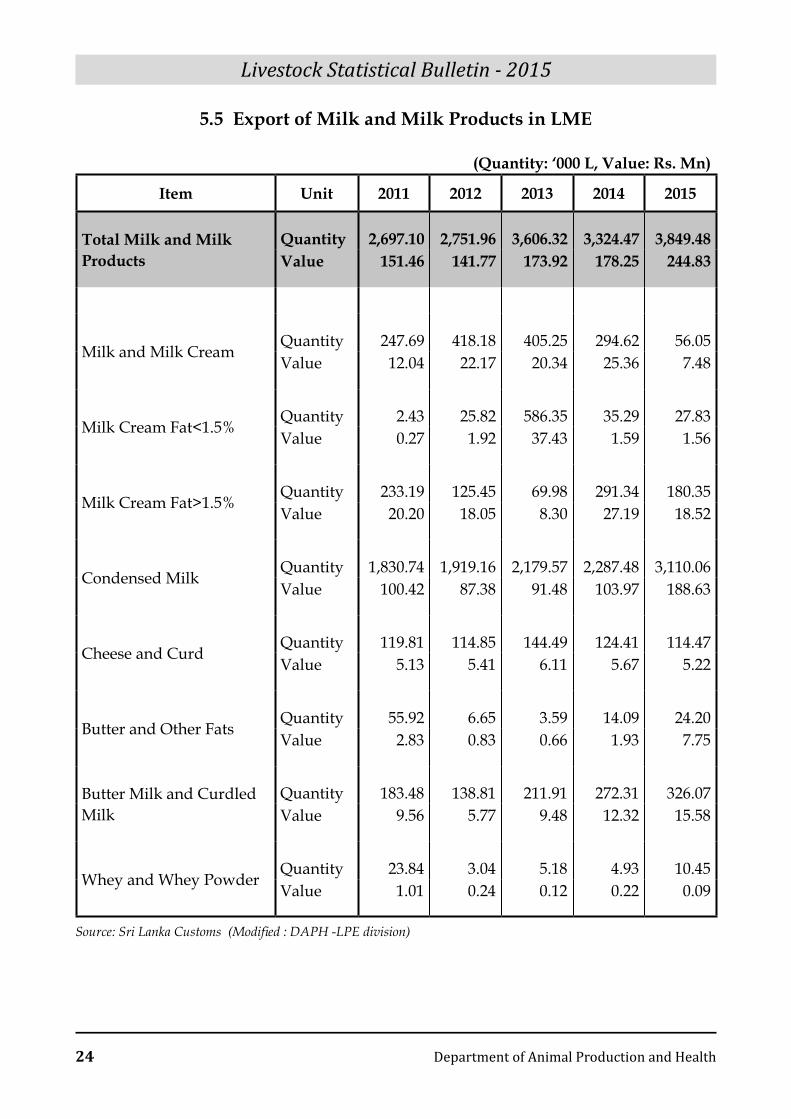
5.5 Export of Milk and Milk Products in LME
(Quantity: ‘000 L, Value: Rs. Mn)
Item Unit 2011 2012 2013 2014 2015
Total Milk and Milk Products
Quantity 2,697.10 2,751.96 3,606.32 3,324.47 3,849.48 Value 151.46 141.77 173.92 178.25 244.83
Milk and Milk CreamQuantity 247.69 418.18 405.25 294.62 56.05 Value 12.04 22.17 20.34 25.36 7.48
Milk Cream Fat<1.5%Quantity 2.43 25.82 586.35 35.29 27.83 Value 0.27 1.92 37.43 1.59 1.56
Milk Cream Fat>1.5%Quantity 233.19 125.45 69.98 291.34 180.35 Value 20.20 18.05 8.30 27.19 18.52
Condensed MilkQuantity 1,830.74 1,919.16 2,179.57 2,287.48 3,110.06 Value 100.42 87.38 91.48 103.97 188.63
Cheese and CurdQuantity 119.81 114.85 144.49 124.41 114.47 Value 5.13 5.41 6.11 5.67 5.22
Butter and Other FatsQuantity 55.92 6.65 3.59 14.09 24.20 Value 2.83 0.83 0.66 1.93 7.75
Butter Milk and Curdled Milk
Quantity 183.48 138.81 211.91 272.31 326.07 Value 9.56 5.77 9.48 12.32 15.58
Whey and Whey PowderQuantity 23.84 3.04 5.18 4.93 10.45 Value 1.01 0.24 0.12 0.22 0.09
Source: Sri Lanka Customs (Modified : DAPH -LPE division)
Livestock Statistical Bulletin - 2015
Department of Animal Production and Health 25
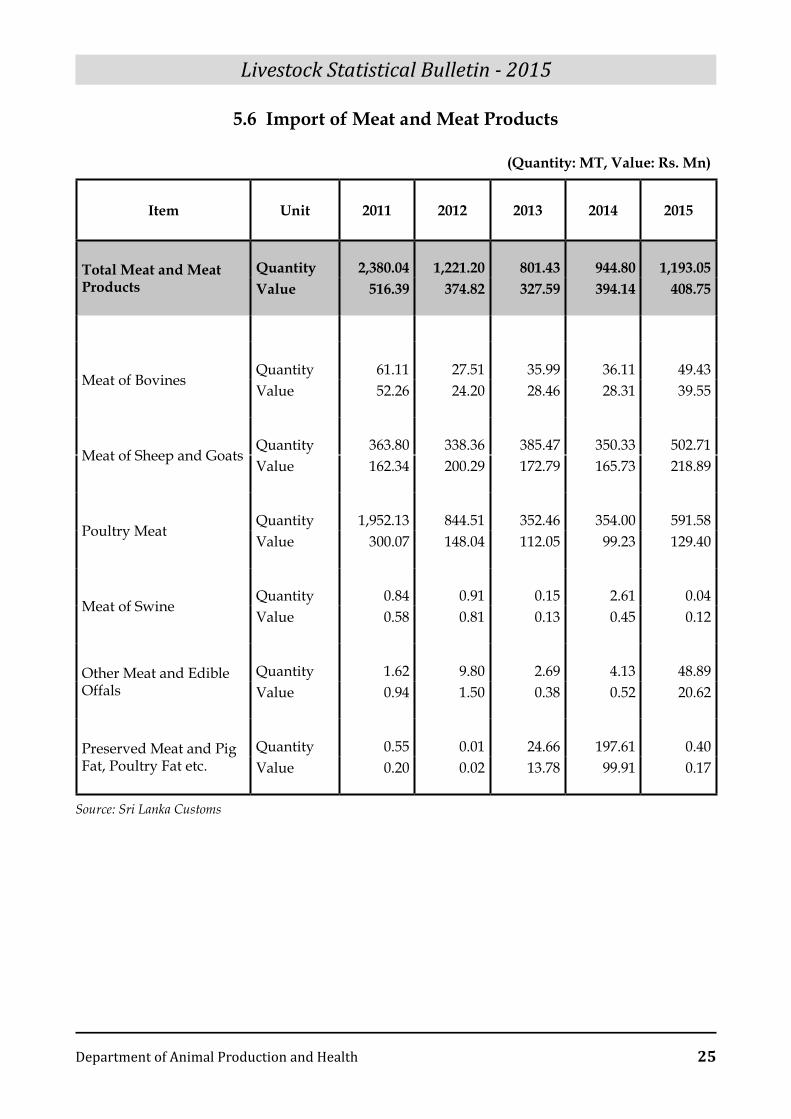
5.6 Import of Meat and Meat Products
(Quantity: MT, Value: Rs. Mn)
Item Unit 2011 2012 2013 2014 2015
Total Meat and Meat Products
Quantity 2,380.04 1,221.20 801.43 944.80 1,193.05 Value 516.39 374.82 327.59 394.14 408.75
Meat of BovinesQuantity 61.11 27.51 35.99 36.11 49.43 Value 52.26 24.20 28.46 28.31 39.55
Meat of Sheep and GoatsQuantity 363.80 338.36 385.47 350.33 502.71 Value 162.34 200.29 172.79 165.73 218.89
Poultry MeatQuantity 1,952.13 844.51 352.46 354.00 591.58 Value 300.07 148.04 112.05 99.23 129.40
Meat of SwineQuantity 0.84 0.91 0.15 2.61 0.04 Value 0.58 0.81 0.13 0.45 0.12
Other Meat and Edible Offals
Quantity 1.62 9.80 2.69 4.13 48.89 Value 0.94 1.50 0.38 0.52 20.62
Preserved Meat and Pig Fat, Poultry Fat etc.
Quantity 0.55 0.01 24.66 197.61 0.40 Value 0.20 0.02 13.78 99.91 0.17
Source: Sri Lanka Customs
Livestock Statistical Bulletin - 2015
26 Department of Animal Production and Health
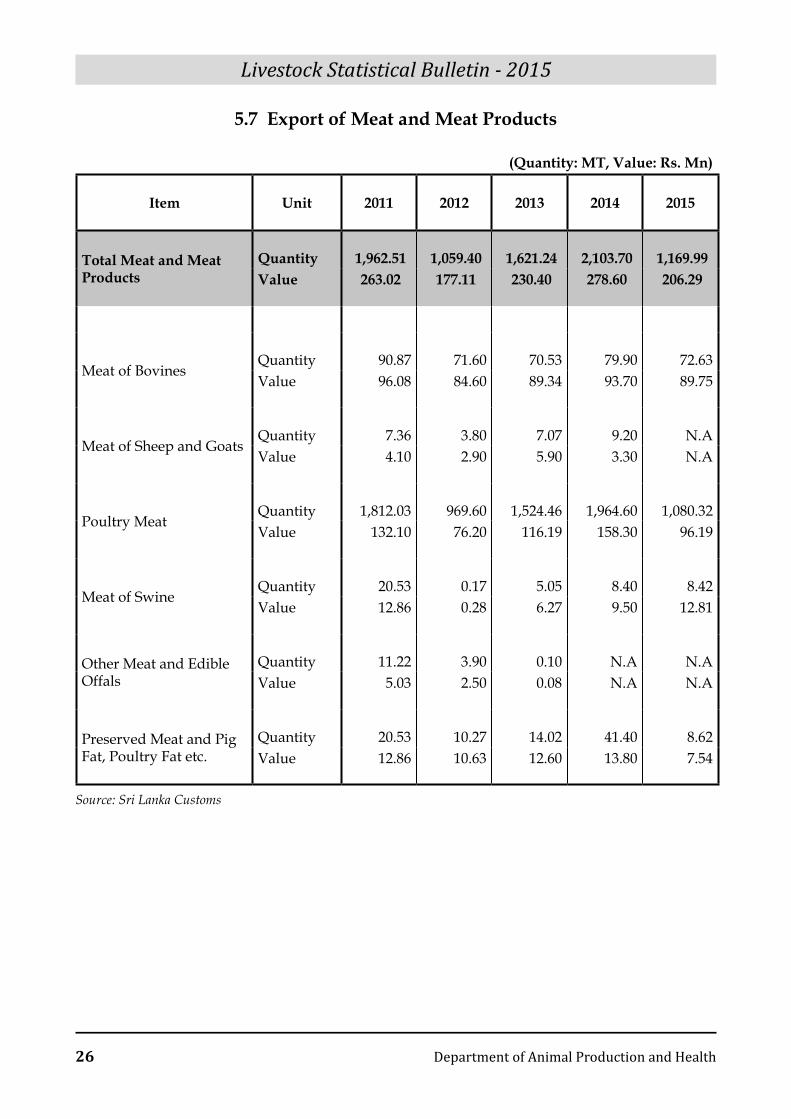
5.7 Export of Meat and Meat Products
(Quantity: MT, Value: Rs. Mn)
Item Unit 2011 2012 2013 2014 2015
Total Meat and Meat Products
Quantity 1,962.51 1,059.40 1,621.24 2,103.70 1,169.99 Value 263.02 177.11 230.40 278.60 206.29
Meat of BovinesQuantity 90.87 71.60 70.53 79.90 72.63 Value 96.08 84.60 89.34 93.70 89.75
Meat of Sheep and GoatsQuantity 7.36 3.80 7.07 9.20 N.A Value 4.10 2.90 5.90 3.30 N.A
Poultry MeatQuantity 1,812.03 969.60 1,524.46 1,964.60 1,080.32 Value 132.10 76.20 116.19 158.30 96.19
Meat of SwineQuantity 20.53 0.17 5.05 8.40 8.42 Value 12.86 0.28 6.27 9.50 12.81
Other Meat and Edible Offals
Quantity 11.22 3.90 0.10 N.A N.A Value 5.03 2.50 0.08 N.A N.A
Preserved Meat and Pig Fat, Poultry Fat etc.
Quantity 20.53 10.27 14.02 41.40 8.62 Value 12.86 10.63 12.60 13.80 7.54
Source: Sri Lanka Customs
Livestock Statistical Bulletin - 2015
Department of Animal Production and Health 27
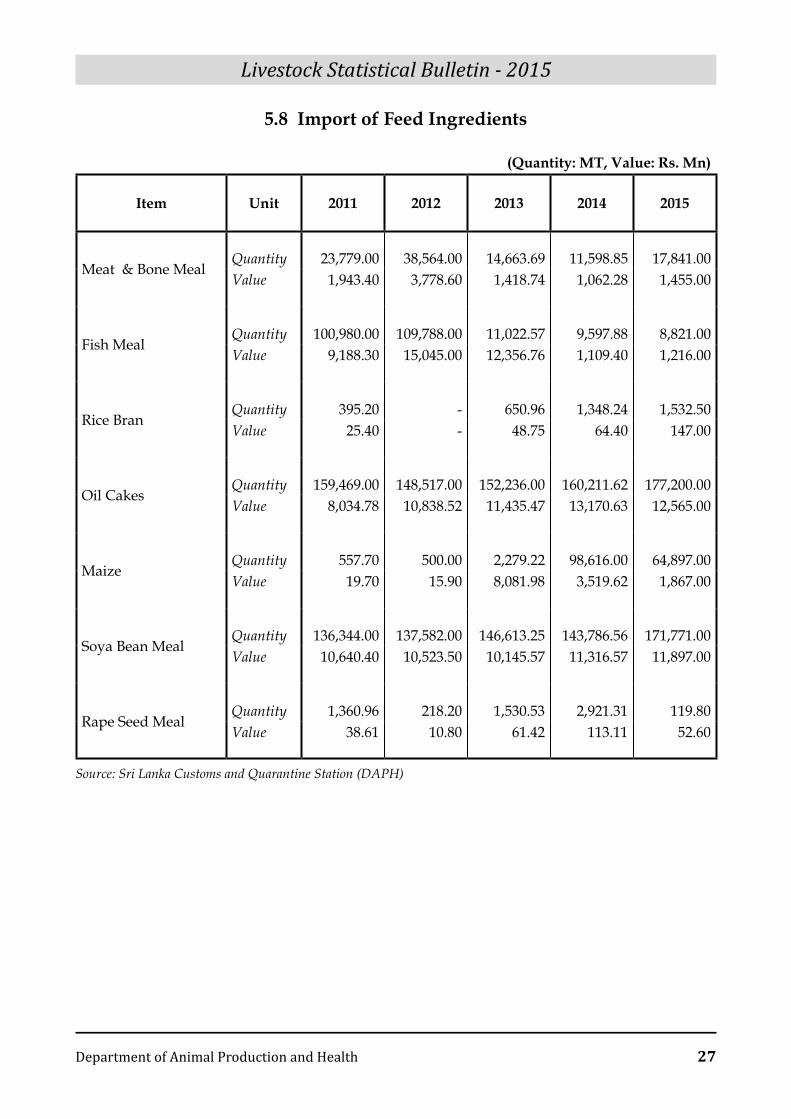
5.8 Import of Feed Ingredients
(Quantity: MT, Value: Rs. Mn)
Item Unit 2011 2012 2013 2014 2015
Meat & Bone MealQuantity 23,779.00 38,564.00 14,663.69 11,598.85 17,841.00 Value 1,943.40 3,778.60 1,418.74 1,062.28 1,455.00
Fish MealQuantity 100,980.00 109,788.00 11,022.57 9,597.88 8,821.00 Value 9,188.30 15,045.00 12,356.76 1,109.40 1,216.00
Rice Bran Quantity 395.20 - 650.96 1,348.24 1,532.50 Value 25.40 - 48.75 64.40 147.00
Oil CakesQuantity 159,469.00 148,517.00 152,236.00 160,211.62 177,200.00 Value 8,034.78 10,838.52 11,435.47 13,170.63 12,565.00
Maize Quantity 557.70 500.00 2,279.22 98,616.00 64,897.00 Value 19.70 15.90 8,081.98 3,519.62 1,867.00
Soya Bean MealQuantity 136,344.00 137,582.00 146,613.25 143,786.56 171,771.00 Value 10,640.40 10,523.50 10,145.57 11,316.57 11,897.00
Rape Seed MealQuantity 1,360.96 218.20 1,530.53 2,921.31 119.80 Value 38.61 10.80 61.42 113.11 52.60
Source: Sri Lanka Customs and Quarantine Station (DAPH)
Livestock Statistical Bulletin - 2015
28 Department of Animal Production and Health
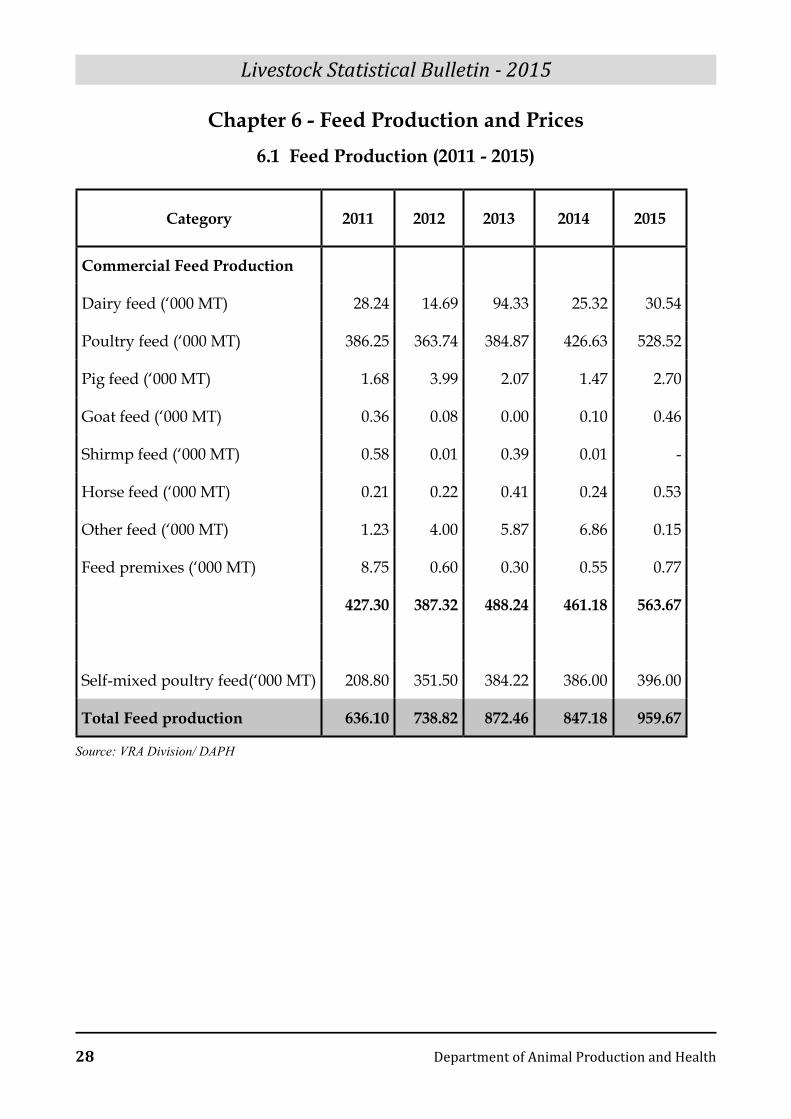
Chapter 6 - Feed Production and Prices6.1 Feed Production (2011 - 2015)
Category 2011 2012 2013 2014 2015
Commercial Feed Production
Dairy feed (‘000 MT) 28.24 14.69 94.33 25.32 30.54
Poultry feed (‘000 MT) 386.25 363.74 384.87 426.63 528.52
Pig feed (‘000 MT) 1.68 3.99 2.07 1.47 2.70
Goat feed (‘000 MT) 0.36 0.08 0.00 0.10 0.46
Shirmp feed (‘000 MT) 0.58 0.01 0.39 0.01 -
Horse feed (‘000 MT) 0.21 0.22 0.41 0.24 0.53
Other feed (‘000 MT) 1.23 4.00 5.87 6.86 0.15
Feed premixes (‘000 MT) 8.75 0.60 0.30 0.55 0.77
427.30 387.32 488.24 461.18 563.67
Self-mixed poultry feed(‘000 MT) 208.80 351.50 384.22 386.00 396.00
Total Feed production 636.10 738.82 872.46 847.18 959.67
Source: VRA Division/ DAPH
Livestock Statistical Bulletin - 2015
Department of Animal Production and Health 29
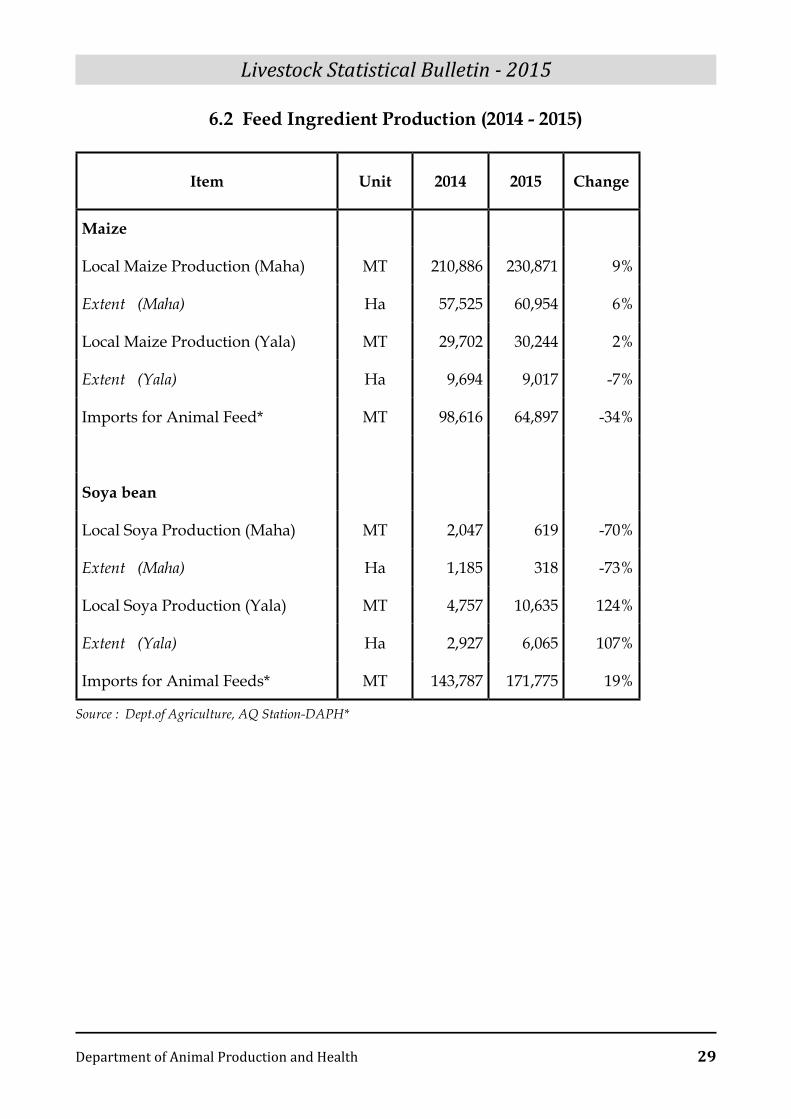
6.2 Feed Ingredient Production (2014 - 2015)
Item Unit 2014 2015 Change
Maize
Local Maize Production (Maha) MT 210,886 230,871 9%
Extent (Maha) Ha 57,525 60,954 6%
Local Maize Production (Yala) MT 29,702 30,244 2%
Extent (Yala) Ha 9,694 9,017 -7%
Imports for Animal Feed* MT 98,616 64,897 -34%
Soya bean
Local Soya Production (Maha) MT 2,047 619 -70%
Extent (Maha) Ha 1,185 318 -73%
Local Soya Production (Yala) MT 4,757 10,635 124%
Extent (Yala) Ha 2,927 6,065 107%
Imports for Animal Feeds* MT 143,787 171,775 19%
Source : Dept.of Agriculture, AQ Station-DAPH*
Livestock Statistical Bulletin - 2015
30 Department of Animal Production and Health
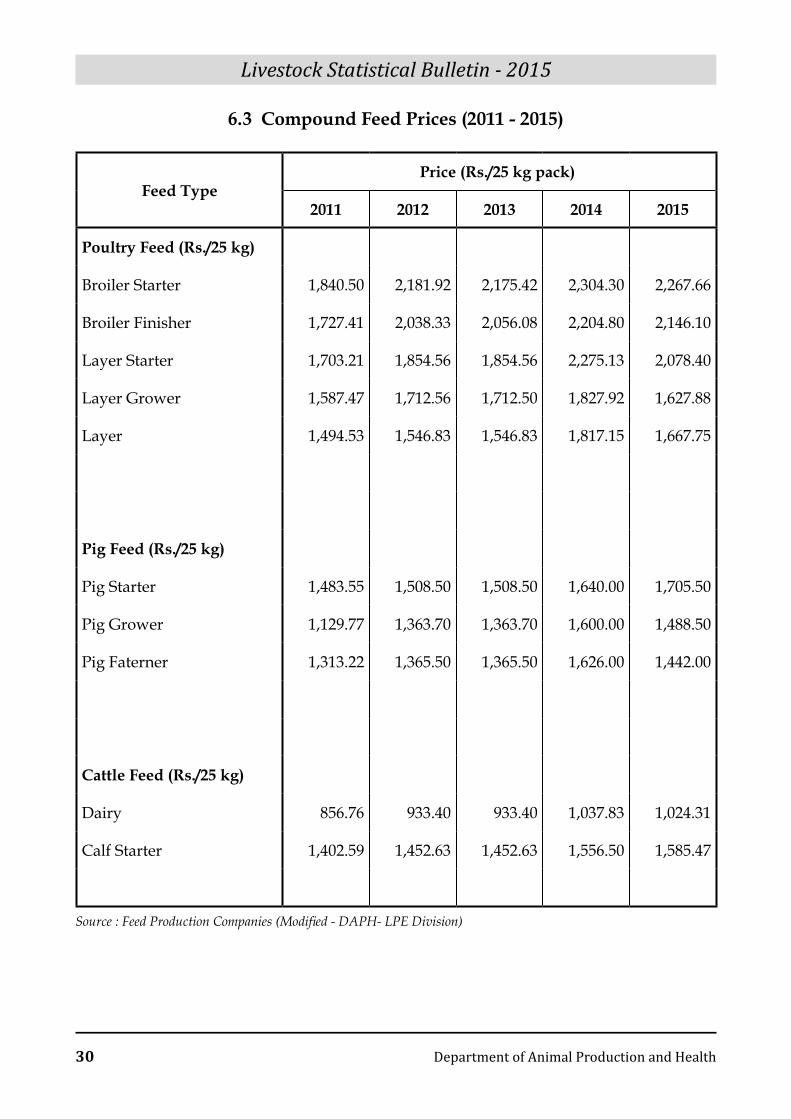
6.3 Compound Feed Prices (2011 - 2015)
Feed Type Price (Rs./25 kg pack)
2011 2012 2013 2014 2015
Poultry Feed (Rs./25 kg)
Broiler Starter 1,840.50 2,181.92 2,175.42 2,304.30 2,267.66
Broiler Finisher 1,727.41 2,038.33 2,056.08 2,204.80 2,146.10
Layer Starter 1,703.21 1,854.56 1,854.56 2,275.13 2,078.40
Layer Grower 1,587.47 1,712.56 1,712.50 1,827.92 1,627.88
Layer 1,494.53 1,546.83 1,546.83 1,817.15 1,667.75
Pig Feed (Rs./25 kg)
Pig Starter 1,483.55 1,508.50 1,508.50 1,640.00 1,705.50
Pig Grower 1,129.77 1,363.70 1,363.70 1,600.00 1,488.50
Pig Faterner 1,313.22 1,365.50 1,365.50 1,626.00 1,442.00
Cattle Feed (Rs./25 kg)
Dairy 856.76 933.40 933.40 1,037.83 1,024.31
Calf Starter 1,402.59 1,452.63 1,452.63 1,556.50 1,585.47
Source : Feed Production Companies (Modified - DAPH- LPE Division)
Livestock Statistical Bulletin - 2015
Department of Animal Production and Health 31
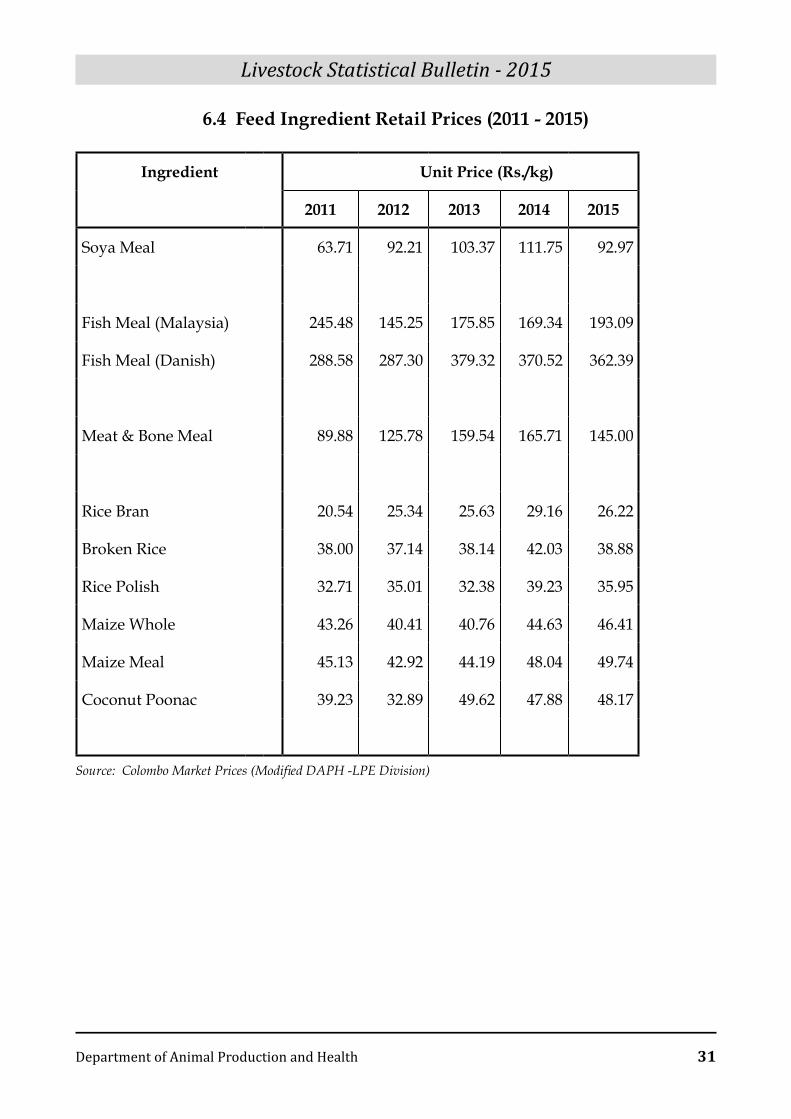
6.4 Feed Ingredient Retail Prices (2011 - 2015)
Ingredient Unit Price (Rs./kg)
2011 2012 2013 2014 2015
Soya Meal 63.71 92.21 103.37 111.75 92.97
Fish Meal (Malaysia) 245.48 145.25 175.85 169.34 193.09
Fish Meal (Danish) 288.58 287.30 379.32 370.52 362.39
Meat & Bone Meal 89.88 125.78 159.54 165.71 145.00
Rice Bran 20.54 25.34 25.63 29.16 26.22
Broken Rice 38.00 37.14 38.14 42.03 38.88
Rice Polish 32.71 35.01 32.38 39.23 35.95
Maize Whole 43.26 40.41 40.76 44.63 46.41
Maize Meal 45.13 42.92 44.19 48.04 49.74
Coconut Poonac 39.23 32.89 49.62 47.88 48.17
Source: Colombo Market Prices (Modified DAPH -LPE Division)
Livestock Statistical Bulletin - 2015
32 Department of Animal Production and Health
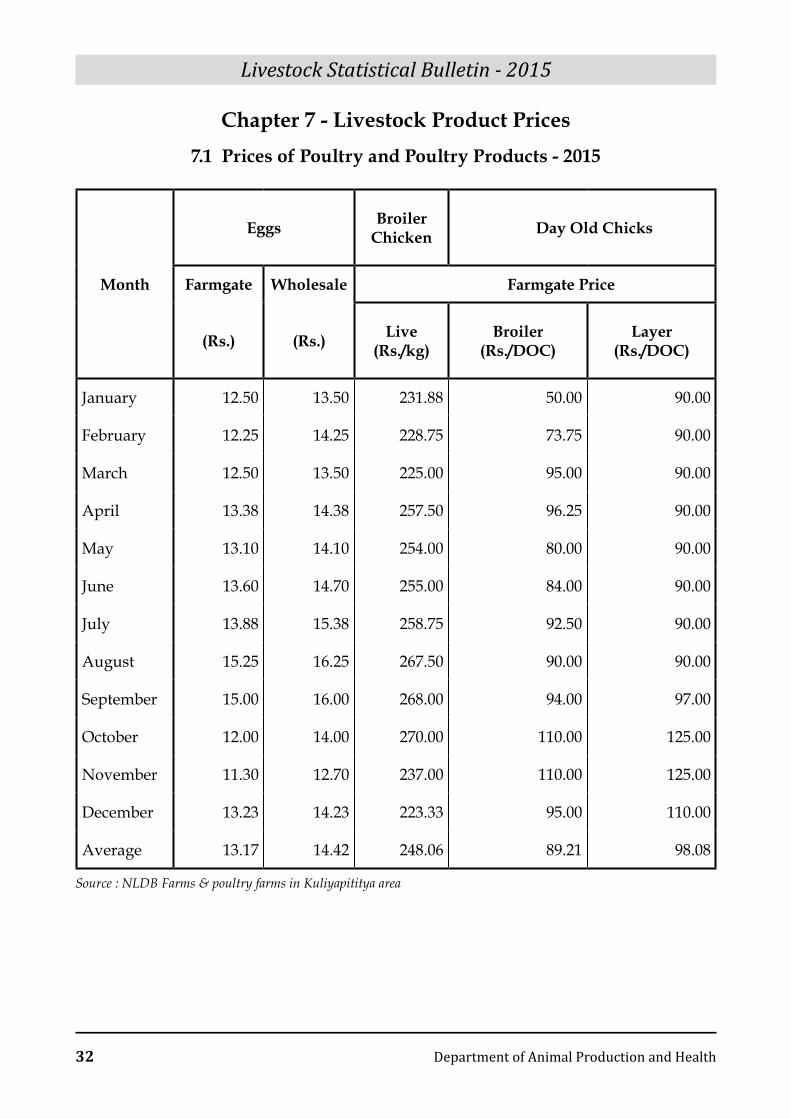
Chapter 7 - Livestock Product Prices7.1 Prices of Poultry and Poultry Products - 2015
Eggs Broiler Chicken Day Old Chicks
Month Farmgate Wholesale Farmgate Price
(Rs.) (Rs.) Live(Rs./kg)
Broiler(Rs./DOC)
Layer(Rs./DOC)
January 12.50 13.50 231.88 50.00 90.00
February 12.25 14.25 228.75 73.75 90.00
March 12.50 13.50 225.00 95.00 90.00
April 13.38 14.38 257.50 96.25 90.00
May 13.10 14.10 254.00 80.00 90.00
June 13.60 14.70 255.00 84.00 90.00
July 13.88 15.38 258.75 92.50 90.00
August 15.25 16.25 267.50 90.00 90.00
September 15.00 16.00 268.00 94.00 97.00
October 12.00 14.00 270.00 110.00 125.00
November 11.30 12.70 237.00 110.00 125.00
December 13.23 14.23 223.33 95.00 110.00
Average 13.17 14.42 248.06 89.21 98.08
Source : NLDB Farms & poultry farms in Kuliyapititya area
Livestock Statistical Bulletin - 2015
Department of Animal Production and Health 33
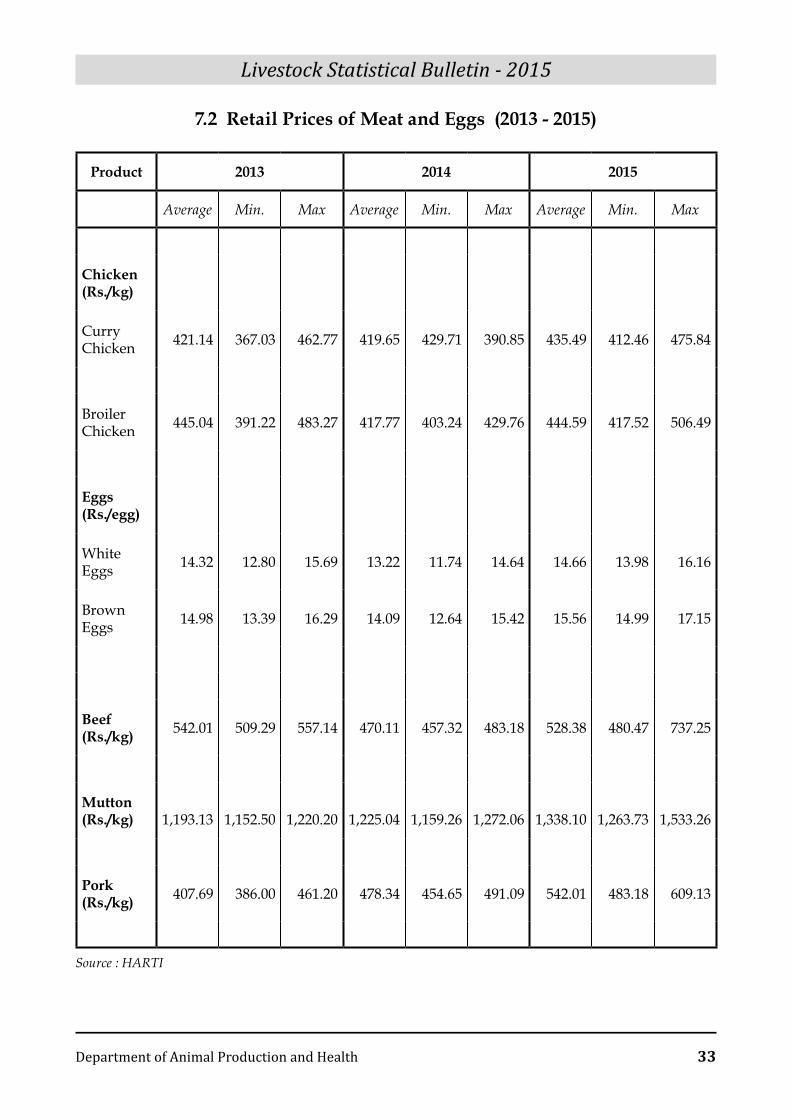
7.2 Retail Prices of Meat and Eggs (2013 - 2015)
Product 2013 2014 2015
Average Min. Max Average Min. Max Average Min. Max
Chicken(Rs./kg)
CurryChicken 421.14 367.03 462.77 419.65 429.71 390.85 435.49 412.46 475.84
Broiler Chicken 445.04 391.22 483.27 417.77 403.24 429.76 444.59 417.52 506.49
Eggs(Rs./egg)
WhiteEggs 14.32 12.80 15.69 13.22 11.74 14.64 14.66 13.98 16.16
BrownEggs 14.98 13.39 16.29 14.09 12.64 15.42 15.56 14.99 17.15
Beef (Rs./kg) 542.01 509.29 557.14 470.11 457.32 483.18 528.38 480.47 737.25
Mutton (Rs./kg)
1,193.13
1,152.50
1,220.20
1,225.04
1,159.26
1,272.06
1,338.10
1,263.73
1,533.26
Pork(Rs./kg) 407.69 386.00 461.20 478.34 454.65 491.09 542.01 483.18 609.13
Source : HARTI
Livestock Statistical Bulletin - 2015
34 Department of Animal Production and Health
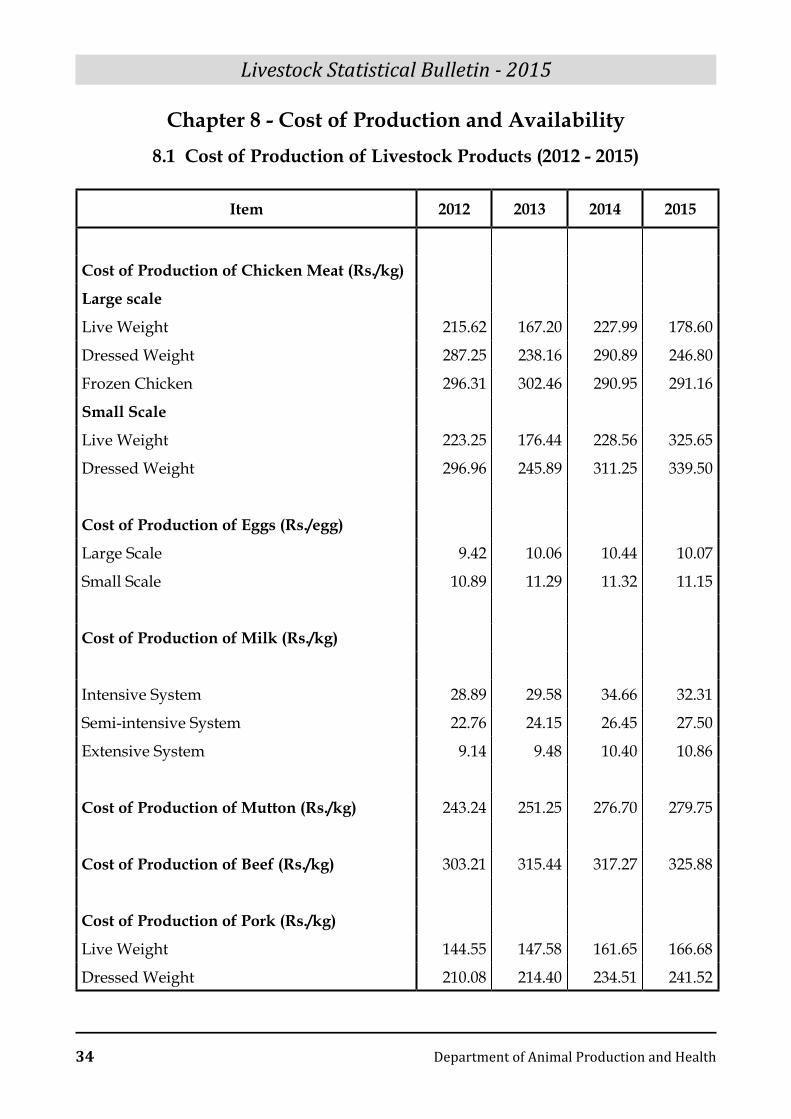
Chapter 8 - Cost of Production and Availability8.1 Cost of Production of Livestock Products (2012 - 2015)
Item 2012 2013 2014 2015
Cost of Production of Chicken Meat (Rs./kg)
Large scale
Live Weight 215.62 167.20 227.99 178.60
Dressed Weight 287.25 238.16 290.89 246.80
Frozen Chicken 296.31 302.46 290.95 291.16
Small Scale
Live Weight 223.25 176.44 228.56 325.65
Dressed Weight 296.96 245.89 311.25 339.50
Cost of Production of Eggs (Rs./egg)
Large Scale 9.42 10.06 10.44 10.07
Small Scale 10.89 11.29 11.32 11.15
Cost of Production of Milk (Rs./kg)
Intensive System 28.89 29.58 34.66 32.31
Semi-intensive System 22.76 24.15 26.45 27.50
Extensive System 9.14 9.48 10.40 10.86
Cost of Production of Mutton (Rs./kg) 243.24 251.25 276.70 279.75
Cost of Production of Beef (Rs./kg) 303.21 315.44 317.27 325.88
Cost of Production of Pork (Rs./kg)
Live Weight 144.55 147.58 161.65 166.68
Dressed Weight 210.08 214.40 234.51 241.52
Livestock Statistical Bulletin - 2015
Department of Animal Production and Health 35
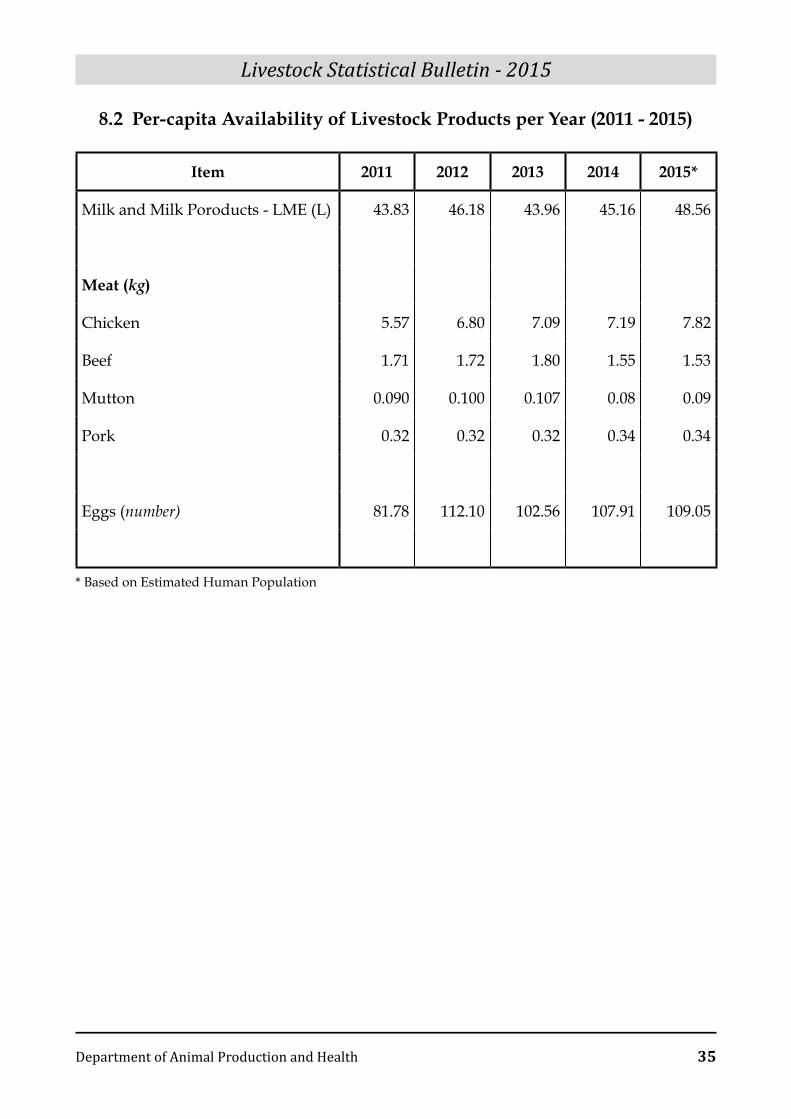
8.2 Per-capita Availability of Livestock Products per Year (2011 - 2015)
Item 2011 2012 2013 2014 2015*
Milk and Milk Poroducts - LME (L) 43.83 46.18 43.96 45.16 48.56
Meat (kg)
Chicken 5.57 6.80 7.09 7.19 7.82
Beef 1.71 1.72 1.80 1.55 1.53
Mutton 0.090 0.100 0.107 0.08 0.09
Pork 0.32 0.32 0.32 0.34 0.34
Eggs (number) 81.78 112.10 102.56 107.91 109.05
* Based on Estimated Human Population
Prepared by
Mrs.M. Wickramsinghe (Livestock Development Officer) Mrs M.I.S.Marasinghe (Livestock Development Officer)
Mrs R. Wijesinghe (Statistical Officer)Mr.M.K.C.Nuwan Kumara (Livestock Development Officer)
Mr.M.Jayasinghe (Development Officer)
EditorDr(Miss) D. L. N. Kumudinie
Division of Livestock Planning and Economics,Department of Animal Production and HealthP.O. Box 13, Gatambe, Peradeniya , Sri Lanka.
Tel: 081 2387060 Fax: 081 2388186