Embed Size (px)
Citation preview

Quarterly Statistical Bulletin
Quarter Ended September 2014
Issue 21/2014

The CMA Capital Markets Bulletin – Q3/2014
1
The CMA (CMA) Bulletin is developed and published by the CMA. While reasonable care has been
taken to prepare the bulletin, CMA accepts no responsibility or liability whatsoever, resulting from the
use of information herein. The CMA has no objection to the material herein being used, provided an
acknowledgement of the same is made. Any comments and/or suggestions on any of the
features/sections may be sent to [email protected].

The CMA Capital Markets Bulletin – Q3/2014
2
Abbreviations and Acronyms
ADB African Development Bank
BR Brokers
CDSC Central Depository and Settlement Corporation
CDS Central Depository and Settlement
CIC Co-operative Insurance Company
CMA Capital Markets Authority
CMC Cooper Motors Corporation
CPI Consumer price index
CU Custodians
DTB Diamond Trust Bank
DTM Deposit Taking Microfinance
EAC East African Community
EAPCC East African Portland Cement Company
EC East African Corporate investors
EI East African Individual investors
FC Foreign Corporate Investors
FI Foreign Individual Investors
IOSCO International Organization of Securities Commissions
IPO Initial Public Offer
KES Kenya Shillings
KNBS Kenya National Bureau of Statistics
LC Local Corporate investors
LI Local Individual investors
NASI NSE All-Share Index
NIC National Industrial Credit
NSE Nairobi Securities Exchange
PO Public Offer
Q1 Quarter one
Q2 Quarter two
Q3 Quarter three
Q4 Quarter four
qoq quarter on quarter
USD United States Dollars

The CMA Capital Markets Bulletin – Q3/2014
3
Table of Contents
Abbreviations and Acronyms ................................................................................................................. 2
1.0 Primary Market Performance ......................................................................................................... 10
1.1 Primary Equities Market ............................................................................................................. 10
1.2 Primary Bonds Market................................................................................................................ 14
2.0 Secondary Market Performance ............................................................................................... 17
2.1 Equities ....................................................................................................................................... 17
3.0 Investor Profiles at the Nairobi Securities Exchange ............................................................... 23
4.0 Corporate Actions ..................................................................................................................... 34
5.0 Major International Economic Developments........................................................................... 35
APPENDICES ...................................................................................................................................... 37

The CMA Capital Markets Bulletin – Q3/2014
4
Quarterly Statistical Bulletin A publication of CMA

The CMA Capital Markets Bulletin – Q3/2014
5
The Kenyan economy
Revision of GDP levels
During the quarter, a 2010-initiated rebasing and revising the National Accounts was concluded by the
Kenya National Bureau of Statistics (KNBS), being the sixth major revision in the history of national
accounts in Kenya. The main objectives of the revision as postulated by KNBS were; to implement
recommendations of 2008 System of National Accounts (2008 SNA), change base year from 2001 to
2009, and incorporate new sources of data that have become available since the previous major
revision. Consequently, Kenya’s Gross Domestic Product (GDP) figures have risen to Kshs 4.76
Trillion shillings, effectively becoming Africa’s ninth largest economy, above Ghana, Tunisia and
Ethiopia. Nigeria, South Africa, Egypt, Algeria, Angola, Morocco, Libya and oil-producing Sudan are
the only African economies currently ranking higher than Kenya.
Implications of Revision and Rebasing
For 2009, the revised GDP moved up by 20.5 percent relative to previous estimates, while for the
other years between 2006 and 2013, the gap between the revised GDP gradually increased from 15
to 25 per cent. Broadly, the major reason that led to the upward revision of the GDP included use of
better data, improved coverage and revised input-output production structures which were lower in a
number of sectors compared to the revised estimates. In terms of data improvement, the 2009
Population Census; Kenya Integrated Household Budget Survey (KIHBS) of 2005/06; and 2010
Census of Industrial Production majorly contributed to the upward revisions.
GDP Growth Rate in Q2/2014
According to KNBS’ provisional estimates of GDP, the country's economy expanded by 5.8 percent
during the second quarter of 2014 compared to 7.2 per cent recorded during a similar quarter of 2013.
The growth was mainly supported by robust growths in; construction (18.9 per cent), manufacturing
(9.1 per cent) financial & insurance (8.3 per cent); information and communication (6.4 per cent); and
wholesale and retail trade (6.8 per cent).

The CMA Capital Markets Bulletin – Q3/2014
6
Exchange Rate Movements
Table 1: Mean Exchange Rate for the Kenya Shilling - A comparison of Q3/2013 and Q3/2014
Currency Sep 2012
Sep 2013
Sep 2014 %∆ (Sep 2014/Sep 2013)
US DOLLAR 85.28 86.65 89.28 3.04%
STG POUND 138.57 139.96 145.12 3.69%
EURO 110.15 116.88 113.29 -3.07%
SA RAND 10.38 8.59 7.93 -7.68%
KES/USHS 29.75 29.64 29.68 0.13%
KES/TSHS 18.48 18.58 18.77 1.02%
KES / RWF 7.28 7.72 7.71 -0.13%
KES / BIF 17.24 17.76 17.36 -2.25%
Note: a negative means appreciation; Source: CBK
Interest Rate Environment
The average yield rate for the 91-day Treasury bills, which is a benchmark for the general trend of
interest rates, decreased from 9.78 per cent in July 2014 to 8.29 per cent in August 2014. The interest
rate spread on the other hand decreased from 10.32 percent in July 2014 to 9.4 percent in September
2014.
Table 2: Selected weighted average monthly interest rates for Kenya
Month Deposit Savings Lending Overdraft
91-day T-bill
CBR
Q1/2014
Jan-2014 6.55 1.56 17.03 16.82 9.26
8.50
Feb-2014 6.57 1.49 17.06 16.88 9.16
8.50
Mar-2014 6.61 1.56 16.91 16.44 8.98
8.50
Q2/2014
Apr-2014 6.48 1.53 16.70 16.44 8.80
8.50
May-2014 6.42 1.54 16.97 17.85 8.82
8.50
Jun-2014 6.56 1.50 16.36 15.88 9.81
8.50
Q3/2014
Jul -2014 6.59 1.33 16.91 17.12
9.78
8.50
Aug-2014 6.51 1.50 16.26 16.19 8.29
8.50
Sep-2014 6.64 1.51 16.04 N/A N/A
8.50
Source: CBK/KNBS
N/A Not available
The CMA Capital Markets Bulletin – Q3/2014
7
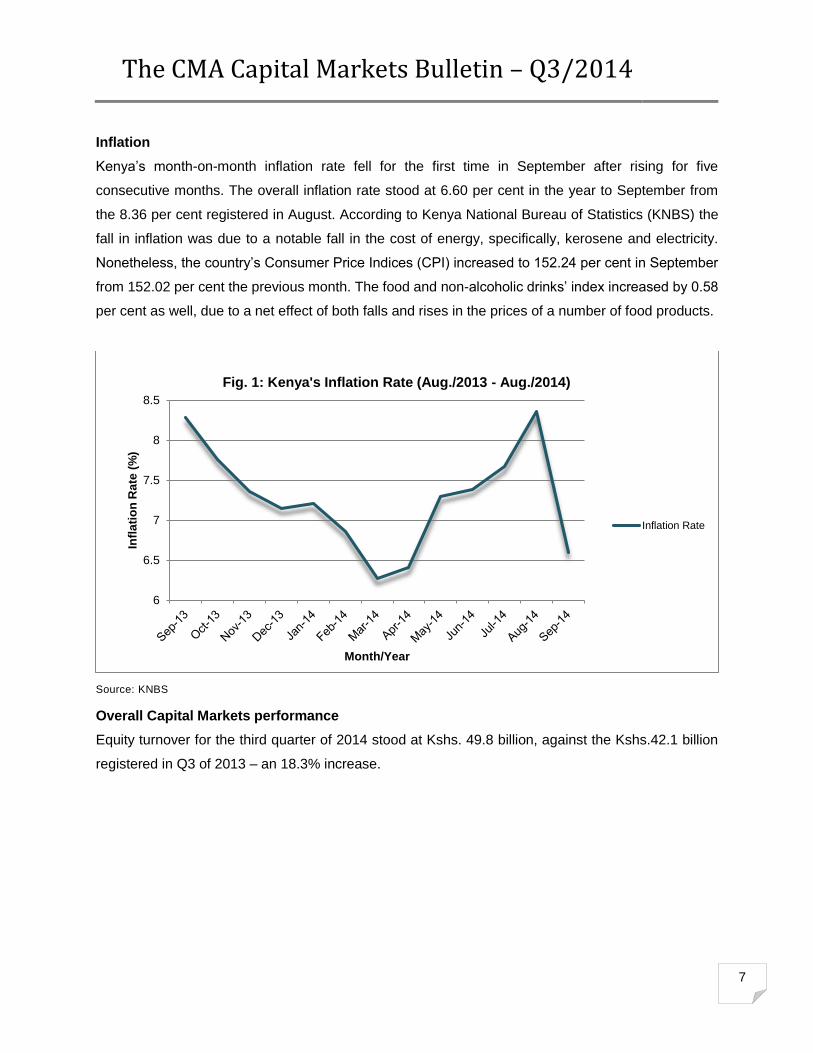
Inflation
Kenya’s month-on-month inflation rate fell for the first time in September after rising for five
consecutive months. The overall inflation rate stood at 6.60 per cent in the year to September from
the 8.36 per cent registered in August. According to Kenya National Bureau of Statistics (KNBS) the
fall in inflation was due to a notable fall in the cost of energy, specifically, kerosene and electricity.
Nonetheless, the country’s Consumer Price Indices (CPI) increased to 152.24 per cent in September
from 152.02 per cent the previous month. The food and non-alcoholic drinks’ index increased by 0.58
per cent as well, due to a net effect of both falls and rises in the prices of a number of food products.
Source: KNBS
Overall Capital Markets performance
Equity turnover for the third quarter of 2014 stood at Kshs. 49.8 billion, against the Kshs.42.1 billion
registered in Q3 of 2013 – an 18.3% increase.
6
6.5
7
7.5
8
8.5
Infl
ati
on
Rate
(%
)
Month/Year
Fig. 1: Kenya's Inflation Rate (Aug./2013 - Aug./2014)
Inflation Rate

The CMA Capital Markets Bulletin – Q3/2014
8
Source: CMA
Similarly, average market capitalization rose by 28.8% in the quarter from Kshs.1,716.6 billion in
Q3/2013 to Kshs.2,211.8 billion. Further, the volume of shares traded rose by 13.9%, with 2,021.3
million shares being traded, compared to 1,775.1 million shares that had been traded in a similar
quarter in 2013. In the secondary bonds market, KShs.146.3 billion worth of bonds was traded in the
quarter ending September 2014, compared to KShs.88 billion worth of bonds traded during Q3/2013.
1,000.00
1,200.00
1,400.00
1,600.00
1,800.00
2,000.00
2,200.00
2,400.00
Ma
rke
t C
ap
in
Ks
hs
Bil
lio
ns
Month/Year
Fig. 2: Kenya's Monthly Market Capitalization levels 2012 - 2014
Market Cap

The CMA Capital Markets Bulletin – Q3/2014
9
Source: CMA
In the in the quarter, the Nairobi Securities Exchange (NSE) self-listed on its Main Market Segment
following an IPO conducted between 24 July and 12 August 2014, which marked the only activity in
the primary equities market during the quarter under review.
In the primary bonds market Four (4) Treasury bonds were all re-opened in the quarter, as the
Government sought to raise Kshs.40 billion, which was relatively lower than the Kshs.60 billion sought
in the previous quarter. Owing to better market liquidity, Kshs.65.23 billion worth of bond applications
were received and 58.88 per cent of the total applications, worth Kshs. 38.41 billion. Accepted.
4,600.000
4,700.000
4,800.000
4,900.000
5,000.000
5,100.000
5,200.000
5,300.000
5,400.000
5,500.000
NSE
20
-Sh
are
Ind
ex
Date
Fig. 3: NSE Index Trend - Sep. 2013 - Sep. 2014
NSE Index

The CMA Capital Markets Bulletin – Q3/2014
10
1.0 Primary Market Performance
1.1 Primary Equities Market
a. Initial Public Offers (IPOs)
During the quarter, the Nairobi Securities Exchange (NSE) self-listed on its Main Market Segment
through an IPO. The IPO which was conducted between 24 July and 12 August 2014 raised
Kshs.4.789 billion against a target of Kshs.627 million, implying a 763.92 per cent subscription level,
the most oversubscribed offer since the bourse was founded 60 years ago.
Table 3: Initial Public Offers (IPOs) 2000 - 2014
Company
Shares on Issue
Year of Issue
Issue Price
Sum Raised
Subscription level
Ordinary Shares
Year/Month
Kshs
Kshs.
%
African Lakes (Delisted in 2003)
4,000,000
2000 March
94.50
378,000,000.00
150%
Mumias Sugar Company
300,0000,000
2001 November
6.25
1,125,000,000
60%
Kengen
658,900,000
2006 April
11.90
7,840,910,000.00
333%
Scangroup
69,000,000
2006 June
10.45
721,050,000.00
620%
Eveready
63,000,000
2006 Aug
9.50
598,500,000.00
830%
Access Kenya
80,000,000
2007 March
10.00
800,000,000.00
363%
Kenya Re
240,000,000
2007 July
9.50
2,280,000,000.00
334%
Safaricom
10,000,000,000
2008 June
5.00
50,000,000,000.00
532%
Co-op Bank
701,000,000
2008 October
9.50
5,400,000,000.00
81%
British American
660,000,000
2011 September
9.00
3,515,103,000
60%
Nairobi Securities Exchange
66,000,000
2014 September
9.50
627,000,000.00
764%
TOTAL
15,541,900,000
73,285,563,000.00
Source: CMA
b. Additional Offers and Listings by Introduction
Table 4: Additional Offers (AOs) and POs 2000 - 2014
Company
Shares on Issue
Type of issue
Year of Issue
Offer Price
Sum Raised
Subscription level
Ordinary Shares
AOs/POs
Year
Kshs
Kshs.
%
Pan African Insurance Holdings
24,000,000
AO
2000
21.50
516,000,000.00
100%
ICDC
8,948,725
AO
2001
37.00
211,905,808.00
64%
Mumias Sugar Company
91,999,220
AO
2006
49.50
4,320,000,000.00
95%

The CMA Capital Markets Bulletin – Q3/2014
11
Company
Shares on Issue
Type of issue
Year of Issue
Offer Price
Sum Raised
Subscription level
Deacons Kenya
12,800,000
PO
2010
62.50
700,990,000.00
87.5%
UAP
12,500,000
PO
2012
60.00
971,910,000
129.59%
SMEP DTM
145,454,546
PO
2012
11.00
266,658,887.00
16.67%
TOTAL 295,702,491
6,987,464,695.00
Table 5: Introductions 2000 - 2014
Company
Shares on Issue
Year of Issue
Offer Price
Equity Bank
90,500,000
2006
90.00
CFC Insurance Holdings
515,270,364
2011
6.15
TransCentury Limited
267,038,090
2011
50.00
Longhorn Publishers
58,500,000
2012
14.00
CIC Insurance
2,179,615,440
2012
3.50
Umeme
1,623,878,005
2012
8.80
Home Afrika Ltd.
405,300,000
2013
12.00
TOTAL
5,140,101,899.00
c. Rights Issues
Table 6: Rights Issues 2004-2014
Company
Shares on Issue
Date of Issue
Offer Price
Sum Raised
Subscription level
KCB
50,000,000
2004
49.00
2,750,125,000.00
112%
Uchumi
120,000,000
2005
10.00
1,269,600,000.00
106%
CfC Bank
12,000,000
2005
62.00
744,000,000.00
100%
DTB
15,527,343
2006
50.00
2,305,810,436.00
297%
Olympia Capital
30,000,000
2007
14.00
428,400,000.00
102%
DTB
23,291,015
2007
70.00
2,902,060,469.00
178%
NIC Bank
16,482,910
2007
70.00
1,719,167,513.00
149%
HFCK
115,000,000
2008
20.00
2,369,000,000.00
103%
KCB
221,777,777
2008
25.00
8,122,024,075.00
146%
KCB
887,111,110
July 2010
17.00
12,500,000,000.00
82.5%
TPS East Africa
24,701,774
September 2010
48.00
1,185,685,152.00
135%
Standard Chartered
15,109,323
October 2010
165.45
2,499,837,490.00
161%
KPLC
488,630,245
November 2010
19.50
9,830,340,000.00
103%

The CMA Capital Markets Bulletin – Q3/2014
12
Company
Shares on Issue
Date of Issue
Offer Price
Sum Raised
Subscription level
KQ
1,477,169,549
March 2012
14.00
14,487,949,714.00
70.06%
DTB
24,455,566
June 2012
74.00
3,369,522,734
186.2%
NIC
98,724,391
September 2012
21.00
7,007,457,273.00
338%
CFC Stanbic Holdings
121,637,427
October 2012
33.00
4,495,719,302.00
112%
Standard Chartered Bank
22,080,000
October 2012
145.00
8,272,934,400.00
258%
Diamond Trust Bank
22,010,009
August 2014
165.00
3,631,651,485.00
440.27%
NIC Bank
42,663,040
September
49.25
On-going
-
TOTAL 3,828,371,479 89,891,285,043.00
Source: CMA
Bonus Issues (2009 – 2014) Table 7: Bonus Issues 2009-2014
Company
Date (Month/Year)
Bonus Issue Ratio
NIC Bank Feb-09 1:10
Carbacid Oct-09 2:1
NIC Bank Feb-10 1:10
National Bank Mar-10 2:5
Nation Media Group Mar-10 1:10
Jubilee Holdings Mar-10 1:10
TPS Serena Mar-10 1:6
Centum Investment Jun-10 1:10
Car & General Jan-11 1:2
Pan Africa Insurance Mar-11 1:1
Jubilee Holdings Apr-11 1:10
Centum Investment Jun-11 1:10
KPLC Oct-11 1:8
NIC Bank Feb-12 1:10
Cooperative Bank Mar-12 1:5
Access Kenya Mar-12 1:20
Jubilee Mar-12 1:10
Standard Group Apr-12 1:10
Kenya Re Apr-12 1:6
Eaagads Jul-12 1:1
Nation Media Group Mar-13 1:5
Carbacid Investments Oct-13 1:2
CIC insurance July-14 1:5
Longhorn Kenya Sep-2014 3:2

The CMA Capital Markets Bulletin – Q3/2014
13
Source: CMA
d. Stock Splits (2004 – 2014)
Table 8: Stock Splits 2004-2014
Company
Date (Month/Year)
Share Split Ratio
KenolKobil Jun-04 10:1
EA Breweries Aug-04 5:1
E.A. Cables Aug-04 10:1
Centum Oct-06 10:1
Barclays Nov-06 1:5
Sasini Dec-06 5:1
CMC Holdings Jan-07 10:1
KCB Mar-07 10:1
Nation Media Group Mar-08 2:1
Equity Bank Feb-09 1:10
Kenolkobil May-10 10:1
KPLC Oct-10 1:8
ARM May-12 5:1
City Trust Jan-13 5:1
Carbacid Investments Oct-13 1:5
Source: CMA
e. Listed, Delisted and/or Suspended Companies
There were no de-listings during the quarter. CMC Holdings remained suspended during the quarter,
pending finalization of a takeover bid.
Table 9: Listed/Delisted/Suspended Companies
Year Number of Listed Companies
Number of Delisted Companies Number of Suspended Companies
2005
48
-
2 (BOC, Carbacid); Re-admitted 2009
2006
51
-
1 (Uchumi Supermarkets) -Re-admitted 2011
2007
54
-
-
2008
55
1 (Unilever Tea (K) Ltd.)
1 (A. Baumann)
2009
55
-
-
2010
55
-
-
2011
58
-
2 (CMC Holdings Limited); EAPCC (Re-admitted 2012)
2012
61
-
-
2013
61
1 (AccessKenya)
2(City Trust Limited) – Re-admitted and renamed I&M Holdings Limited; Rea Vipingo, pending a take-over bid.

The CMA Capital Markets Bulletin – Q3/2014
14
Year Number of Listed Companies
Number of Delisted Companies Number of Suspended Companies
2014*
62
-
2(City Trust Limited) – Re-admitted and renamed I&M Holdings Limited; Rea Vipingo, pending a take-over bid.
*As at September 2014; Source: CMA
1.2 Primary Bonds Market
a. Treasury Bonds
In Q3 2014, Four (4) Treasury bonds (i.e. all re-opened) were issued as the Government sought to
raise Kshs.40 billion, compared to Kshs.60 billion sought in the previous quarter. Owing to better
market liquidity, Kshs.65.23 billion worth of bond applications were received, with the government
accepting 58.88 per cent of the total applications worth Kshs. 38.41 billion. The value of the accepted
applications was 96 per cent of the intended amount. In the preceding quarter in 2014, the Government
had sought Kshs. 60 billion but accepted Kshs. 52.57 billion worth of bond applications.
Table 10: Issued/Re-opened Bonds in the quarter to September 2014
Bond Issue Tenor
Due Date
Offered (Kshs bn)
Bids (Kshs bn)
Accepted (Kshs bn)
Performance Rate (%)
Coupon Rate
Average Yield
Q1. 2014
Jan 2014
IFB 1/2014/10 (New Issue)
10 Year
15/01/2024
10.0
40.83
15.03
408.23%
12.180%
12.364%
Feb 2014
IFB 1/2013/15 (Re-opened)
15-year
07/02/2028
10.00
23.44
14.43
234.41%
11.250%
12.375%
Mar 2014
IFB 1/2014/2 (New Issue)
2-year
21/03/2016
15.00
48.78
20.00
326.07%
10.803%
10.803%
Q2. 2014
April 2014
FXD1/2014/5 (New Issue)
5-year
22/04/2019
15.00
30.27
17.51
202.67%
10.870%
10.870%
May 2014
FXD2/2014/2 (New Issue)
2-year
23/05/2016
15.00
12.51
12.27
83.38%
10.793%
10.793%
June 2014
FXD1/2014/5 (New Issue)
5-year
17/06/2019
30.00
15.27
14.29
80%
11.934%
11.934%
FXD1/2012/20 (New Issue
20-year
01/11/2032
8.64
8.50
12.000%
13.357%
Q3. 2014
Jul. 2014
FXD 2/2014/2 (Re-Open)
2-year
23/05/2016
10.00
20.25
7.87
202.48%
10.793%
11.034%
Aug. 2014
FXD2/2013/5 (Re-Open)
5-year
25/08/2014
15.00
24.42
13.52
186.34%
11.305%
11.126
SDB1/2011/30 (Re-Open)
30-year
3.53
1.53
12.000%
13.775
Sep. 2014
FXD 1/2014/10 (Re-Open)
10 -year
15/01/2024
15.00
17.03
15.49
135.07%
12.180%
12.296%
* Average yield has been taken to be equivalent to the market weighted average rate; Source: Central Bank of Kenya (CBK)

The CMA Capital Markets Bulletin – Q3/2014
15
a. Corporate Bonds
Table 11: Corporate Bond Issues Jan. 2007- September 2014.
Issuer
Approved Amount (Kshs mn)
Issued Amount
(Kshs mn)
Date of approval
Maturity
Tenor
Outstanding
(Kshs mn)
Yield (%)
PTA BANK
PTA Bank (2007) FR (MTN)/2007/7YR
1,000
1,000
30-Oct-07
31-Oct-14
7yrs
700.0
FR: 1% above the most recent average 182-day T-bill rate.
BARCLAYS KENYA
Barclays Bank K Ltd FR (MTN)/7YR
3,000
1,500
19-Nov-07
19-Nov-14
7yrs
1,500.0
0.6% above the most recent average 91 day T-bill rate.
Barclays Bank (FXD (MTN)/2008/7YR
1300
14-Jul-08
15-Jul-15
7yrs
1300.0
- Fixed rate of 0.75% above the spot 7-year Treasury yield rate, with an indicative fixed coupon rate of 11.5%.
Barclays Bank K Ltd FR (MTN)/7YR
700
14-Jul-08
15-Jul-15
7yrs
700.0
- Floating rate equivalent to the spot 182-day Treasury Bill yield rate plus a margin of 1%.
MABATI ROLLING MILLS
Mabati Rolling Mills FR (MRM)/2008/8YR
2,000
1,378.50
27-Oct-08
17-Oct-16
8yrs
1,273.5
182 Day T-Bill rate + 1.75% re-priced semi-annually
Mabati Rolling Mills FR (MRM)/2008/8YR
621.50
1-Sep-08
1-Sep-16
8yrs
726.5
FXD 13.00%
SHELTER AFRIQUE
Shelter Afrique 1st tranche FR 1/2011/3YR
2,500
1,416.79
11-Jul-11
22-Jul-14
3yrs
1,416.79
FR: 1.5% above the prevailing 182-day but capped at 13.5%.
Shelter Afrique 1st tranche FXD 1/2011/3YR
1,083.21
11-Jul-11
22-Jul-14
3yrs
1,083.21
FXD 12.5%
Shelter Afrique 2nd tranche FXD 2/2012/3YR
500
500
17-Dec-12
14-Dec-15
3yrs
500.0
FR: 1.5-2% above the prevailing 182-day but capped at 13.5%. FXD 12.75%
Shelter Afrique New FXD 1/13/05YR
5,000
4,239.70
30-Sep-13
24-Sep-13
5yrs
4,239.70
FXD 12.75%
Shelter Afrique New FR 1/13/05YR
760.30
30-Sep-13
24-Sep-13
5yrs
760.30
182 Day T-Bill rate + 1.50%
CFC STANBIC
CFC Stanbic FR (CFC Stanbic) 2009/7YR
5,000
97.9
7-Jul-09
7-Jul-16
7yrs
97.91
FR: +1.75% above prevailing 182-day T-Bill rates
CFC Stanbic FXD (CFC Stanbic) 2009/7YR
2,402
7-Jul-09
7-Jul-16
7yrs
2,402.09
FXD: 12.5%
CFC Stanbic FXD 2 (CFC Stanbic)2010/4YR
2,500
17-Dec-10
17-Dec-14
4yrs
2,519.0
FXD 7.5%
SAFARICOM LTD.
FR (Safaricom Ltd) 2009/5YR
12,000
463.40
2-Nov-09
3-Nov-14
5yrs
463.40
T.B (182) + 1.85%
FXD (Safaricom Ltd) 2009/5YR
7,049.60
2-Nov-09
3-Nov-14
5yrs
7,049.60
FXD: 12.25%
FXD 2 (Safaricom Ltd) 2009/5YR
5,000.00
2-Nov-09
3-Nov-14
5yrs
5,000
FXD-6.75%
HOUSING FINANCE

The CMA Capital Markets Bulletin – Q3/2014
16
Source: CMA
FXD (HFCK) 02/2012/7YR
10,000
2,969.10
22-Oct-12
14-Oct-19
7yrs
2,969.0
FXD: 13%
FR (HFCK) 2010/7YR
1,166.50
26-Oct-10
2-Oct-17
7yrs
1,166.50
FR: 182 day + 3% with a floor of 5% and a cap of 9.5%
FXD (HFCK) 2010/7YR
5,864.40
26-Oct-10
2-Oct-17
7yrs
5,864.40
FXD: 8.5%
KENGEN
FXIB 1/2009/10YR
25,000
25,000
2-Nov-10
31-Oct-19
10yrs
19,042.97
FXD: 12.5%
CONSOLIDATED BANK
Consolidated Bank CON.BD-FR (SN)/2012/7YR
2,000.0
1.0
30-Jul-12
22-Jul-19
7yrs
1.0
Senior FR notes (182-day T-bill + 2%)
Consolidated Bank CON.BD-FXD (SBN)/2012/7YR
196.5
30-Jul-12
22-Jul-19
7yrs
196.5
Subordinated FXD notes (13.60%)
Consolidated Bank CON.BD-FXD (SN)/2012/7YR
1,480.6
30-Jul-12
22-Jul-19
7yrs
1,480.6
Senior FXD notes (13.25%)
CENTUM
CENTUM CTNB.BD.18.09.17/13.50; Senior Unsecured FXD Rate Notes
4,167.9
2,917.1
26-Sep-12
18-Sep-17
5yrs
2,917.1
Senior unsecured FXD 13.5%
CENTUM CTNB.BD.18.09.17/12.75; Senior Unsecured Equity-Linked Notes
1,250.8
26-Sep-12
18-Sep-17
5yrs
1,250.8
FXD rate of 12.75 percent payable semi-annually and will participate in an equity upside linked to the growth of the Company’s NAV subject to a maximum of 15% of the par value of the notes.
INVESTMENT & MORTGAGES
1&M FXD I &M-01/13/5.25
3,655.0
3,429
13-Dec-13
8-Mar-13
5.25yrs
3,429.0
FXD: 12.5%
I & M FRN I &M-01/13/5.25
226
13-Dec-13
8-Mar-13
5.25yrs
226.0
FR: 182 day + 2%
BRITAM MEDIUM TERM NOTE
BRTB.BD.22/07/19-0037-13
6,000.0
6,000.0 22-Jul-14 15-Jul-19
5yrs
6,000.0
FXD: 13.0%
UAP HOLDINGS MEDIUM TERM NOTE
UAP.BD.22.07.2019
2000.0
2000.0 28-Jul-14 22-Jul-19
5yrs
2,000.0
FXD: 13.0%

The CMA Capital Markets Bulletin – Q3/2014
17
2.0 Secondary Market Performance
2.1 Equities
Equity turnover for the third quarter of 2014 stood at Kshs. 49.8 billion, against the Kshs.42.1 billion
registered in Q3 of 2013 – an 18.3% increase. Similarly, average market capitalization rose by 28.8%
in the quarter from Kshs.1,716.6 billion in Q3/2013 to Kshs.2,211.8 billion. The volume of shares
traded also rose by 13.9%, with 2,021.3 million shares being traded, compared to 1,775.1 million
shares that had been traded in a similar quarter in 2013.
Table 12: Gross Stock Market statistics-Q2:2013/Q2:2014
Q3/2013 Q3/2014
Jul-2013 Aug-2013 Sep-2013 Jul-2014 Aug-2014 Sep-2014
End Month NSE 20-Share Index
4,788 4,698 4,793 4,906 5,139 5,256
NASI 123.0 120.0 127.0 152.0 158.0 163.0
Shares Volume Traded (Mn) 615.90 670.38 488.79 625.48 628.64 767.18
Equity Turnover (Kshs. Bn) 11.21
20.80
10.06
15.04
15.51
19.24
Bonds Turnover (Kshs. Bn) 34.17 24.52 29.30 28.74 49.47 55.00
End-Month Mkt. Cap (Kshs. Bn) 1,677.26 1,681.66 1,790.85 2,125.31 2,216.57 2,293.49 Source: NSE
Table 13: Key Equity Market Performance Indicators: 2006 – 2014* Year
Equity Turnover (Kshs Bn)
Share Volume (Mn)
Avg. NSE 20-Share Index
Avg. Market Cap (KshsBn)
2006
94.9
1,454.7
5646
791.6
2007
88.6
1,938.2
5445
851.1
2008
97.5
5,856.5
3521
853.7
2009
38.2
3,169.1
3247
834.2
2010
103.5
6,479.8
4257
1,089.2
2011
78.1
5,684.7
3751
1,035.8
2012
86.8
5,464.2
3736
1,072.9
2013
155.75
7,576.20
4784
1,691.5
2014*
150.52
6,1,61.60
4972
2,089.04
*up to September; Source: NSE, Capital Markets Authority

The CMA Capital Markets Bulletin – Q3/2014
18
*up to September; Source: CMA
Table 14: Top 10 Companies by Market Capitalization in KShs billion for Q3/2014
Listed Company
Jul/ 2014
Aug/2014
Sep/2014
Q3/2014 Average
SAFCOM
488.80
518.85
514.84
507.50
EABL
230.91
219.04
218.25
222.73
EQTY
167.55
173.10
198.10
179.58
KCB
162.64
171.59
173.09
169.11
SCBK
95.53
98.31
104.81
99.55
CO-OP
93.14
93.63
105.12
97.30
BBK
92.06
97.77
95.05
94.96
BAT (K)
65.00
79.00
85.40
76.47
TBK
54.14
62.95
65.13
60.74
BAMB
63.52
59.89
53.72
59.04
Top 10 Co.s Total Mkt Cap 1,513.29
1,574.14
1,613.50
End-month total Mkt Cap 2125.306
2216.574
2293.489997
Mkt. Concentration 71.20% 71.02% 70.35%
Source: NSE
0
20
40
60
80
100
120
140
160
180
2006 2007 2008 2009 2010 2011 2012 2013 2014*
Eq
uit
y T
urn
ov
er
(ET
O)
in K
sh
s.
Bn
Year
Fig.4: Kenya's Equity Turnover (ETO) in Kshs Billions
ETO

The CMA Capital Markets Bulletin – Q3/2014
19
Table 15: Top 10 Companies by Equity Turnover in Kshs billion (Q3/2014)
Listed Company
Apr/ 2014
May/2014
June/2014
Q2/2014 Average
SCOM
4.06
2.96
3.41
10.43
EQTY
2.28
1.10
2.59
5.97
KCB
2.08
2.86
2.08
7.01
EABL
1.59
1.80
1.27
4.66
ICDC
0.46
0.47
1.02
1.95
BAT
0.24
0.98
0.70
1.92
COOP
0.50
0.34
0.91
1.75
ARM
0.66
0.40
0.37
1.43
BRIT
0.34
0.25
0.61
1.19
KENO
0.07
0.80
0.46
1.33
Top 10 Co.s Total Turnover
12.28
11.97
13.40
Total Mkt Turnover 15.04
15.51
19.24
Top10 Co.s Mkt. Concentration 81.65% 77.13% 69.65%
Source: NSE
Table 16: Q3/2014 Top 10 Companies in terms of Liquidity (Turnover ratio)
Company Jul Aug Sep Liquidity Ratio (%)
OCH 0.46% 2.02% 9.29% 11.78%
KENO 0.55% 6.48% 3.39% 10.42%
TCL 0.45% 1.28% 6.86% 8.59%
MSC 1.64% 1.90% 3.41% 6.95%
LKL 0.58% 0.33% 5.85% 6.76%
UCHM 2.81% 2.32% 1.08% 6.21%
ICDC 1.48% 0.76% 2.33% 4.57%
KNRE 1.66% 0.98% 1.93% 4.57%
HFCK 1.92% 1.45% 1.08% 4.45%
KCB 1.28% 1.66% 1.20% 4.14%
Source: CMA

The CMA Capital Markets Bulletin – Q3/2014
20
2.2 Bonds
Annual Bond market performance
Table 17: Key Bond Market Performance Indicators: 2006 – 2014*
Year
Treasury Bond Turnover (Kshs Bn)
Corporate Bond Turnover (Kshs Bn)
Total Bond Turnover (Kshs Bn)
Corporate Bond Turnover as a % of Total Bond Turnover
Treasury Bond Turnover as a % of Total Bond Turnover
2006
48.6
0%
48.6
0% 100.00%
2007
84.9
0%
84.9
0% 100.00%
2008
95.4
0%
95.4
0% 100.00%
2009
110.6
0%
110.6
0% 100.00%
2010
466.9
12.5
479.4 2.61% 97.39%
2011
437.1
8.5
445.6 1.91% 98.09%
2012
563.8
1.9
565.7 0.34% 99.66%
2013
451.6
0.9
452.5 0.20% 99.80%
2014*
373.67
0.9
374.61 0.25% 99.75%
Source: Source: NSE, CMA *up to September Source: NSE
Quarterly Bond market performance
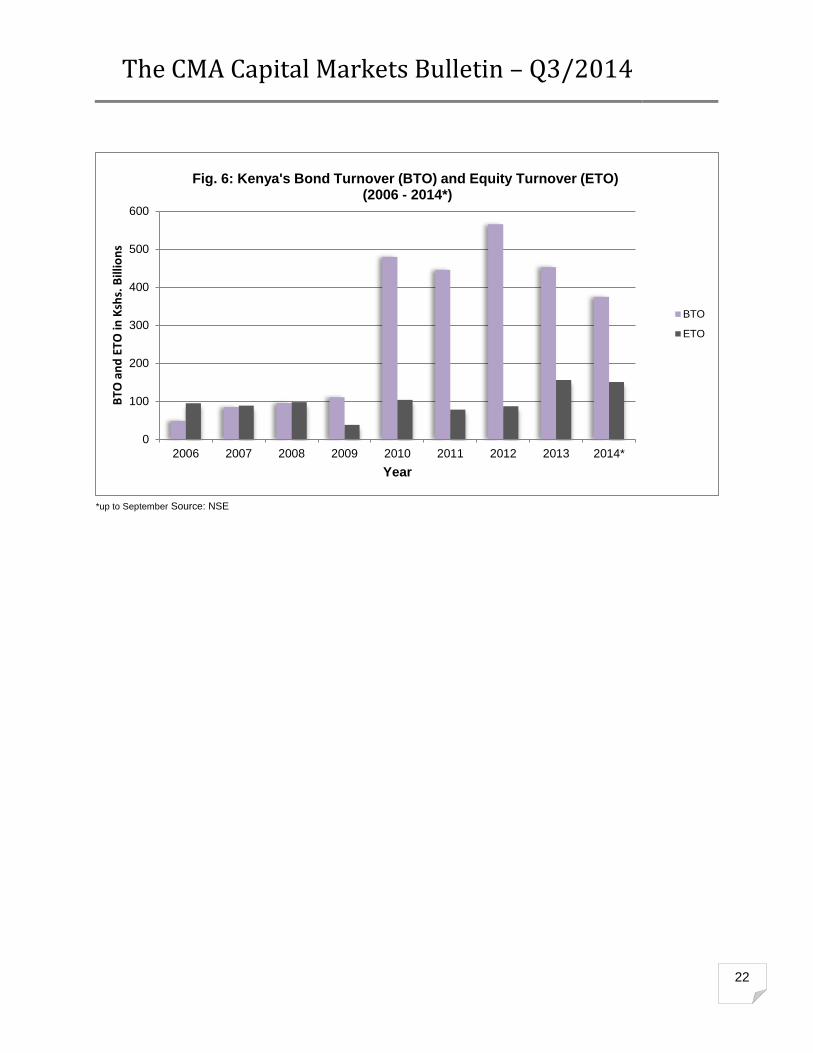
KShs.146.3 billion worth of bonds was traded in the quarter to September 2014, compared to KShs.
88 billion worth of bonds traded during Q3/2013.
Table 18: Quarterly Bond Turnover Trends (Jul. – Sep.) 2006-2014*
YEAR
Month
Bond Turnover (Kshs Bn)
2006
Jul. to Sep
15.3
2007
Jul. to Sep
28.6
2008
Jul. to Sep
43.5
2009
Jul. to Sep
24.4
2010
Jul. to Sep
117.6
2011
Jul. to Sep
114.0
2012
Jul. to Sep
216.9
2013
Jul. to Sep
88.0
2014
Jul. to Sep
146.33
Source: NSE, Capital Markets Authority

The CMA Capital Markets Bulletin – Q3/2014
21
Source: CMA
Table 19: Issued Bonds: Q3/2011– Q3/2014
Month Government Bond Turnover (Ksh bn)
Corporate Bond Turnover (Ksh bn)
Total Bond Turnover (Ksh bn)
q3/2011
July 33.41 0.39 33.80
August 43.06 1.06 44.11
September 35.67 0.44 36.11
q3/2012
July 34.13 0.04 34.17
August 86.88 0.04 86.92
September 95.85 0.01 95.87
q3/2013
July 34.13 0.04 34.17
August 24.44 0.08 24.52
September 29.29 0.01 29.30
q3/2014
July 49.47 - 49.47
August 54.86 0.14 55.00
September 41.83 0.03 41.86
Source: NSE
0
50
100
150
200
250
q3-2006 q3-2007 q3-2008 q3-2009 q3-2010 q3-2011 q3-2012 q3-2013 q3-2014
Bo
nd
Tu
rno
ver
in K
sh
s.
Billio
ns
Q3 -Year
Fig 5: Q3 Bond Turnover Trends - (2006 - 2014)
Q3 Bond Turnover Trends
The CMA Capital Markets Bulletin – Q3/2014
22
*up to September Source: NSE
0
100
200
300
400
500
600
2006 2007 2008 2009 2010 2011 2012 2013 2014*
BTO
an
d E
TO in
Ksh
s. B
illio
ns
Year
Fig. 6: Kenya's Bond Turnover (BTO) and Equity Turnover (ETO)(2006 - 2014*)
BTO
ETO

The CMA Capital Markets Bulletin – Q3/2014
23
3.0 Investor Profiles at the Nairobi Securities Exchange
Table 20: Investor Equity Holdings &Corporate Bonds Amount Outstanding (Q3/2014)
Equities
Account Type
Category of Investor
No. of Investors
No. of Shares held
% of shares held
EACI East African Corporate
256 462,456,938 0.57%
EAI East African Individuals
7,893 122,792,584 0.15%
FCI Foreign Corporate
587 17,331,367,029 21.40%
FII Foreign Investors (Individuals)
8,077 819,239,463 1.01%
LCI Local Corporate
43939 20,032,722,050 24.73%
LI Local Individuals
1,24954,696 42,226,305,669 52.13%
Corporate Bonds
Account Type
Category of Investor
No. of Investors
Amount Outstanding in Kshs. Bn
% of total outstanding
EACI East African Corporate
10
162,100,000 0.26%
EAII East African Individuals
6
6,962,500 0.01%
FCI Foreign Corporate Investors
3
560,187,500 0.88%
FII Foreign Investors (Individuals)
82
209,521,657 0.33%
LCI Local Corporate Investors
954
59,340,524,224 93.53%
LII Local Investors (Individuals)
3,064
3,168,146,016 4.99%
Note: Holdings at CDSC keep changing from time to time and may be different from those in the registrar records submitted to CMA; Source: CDSC
Table 21: Investor Equity & Corporate Bond Trading Statistics (Jul.2014 – Sep. 2014)
Equities % trading market share
Corporate Bonds % trading market share
Equities % trading market share
Corporate Bonds % trading market share
Account Type
Investor Category
Apr. 2014 - Jun. 2014
Jul.2014-Sep.2014
BR
Brokers 0.23% - 1.03% -
CU
Custodians - - - -
EC
East African Corporate 0.68% - 0.21% -
EI
East African Individuals 0.22%
- 0.24%
-
FC
Foreign Corporate 67.95% - 47.63% 4.60%
FI
Foreign Investors (Individuals) 0.85% 3.36% 0.83% 7.24%
JR Junior Investors 0.00% 0.03% -

The CMA Capital Markets Bulletin – Q3/2014
24
Equities % trading market share
Corporate Bonds % trading market share
Equities % trading market share
Corporate Bonds % trading market share
Account Type
Investor Category
Apr. 2014 - Jun. 2014
Jul.2014-Sep.2014
LC
Local Corporate 30.07% 80.04% 27.14% 80.02%
LI
Local Individuals
22.86% 16.59% 22.89% 8.14%
Table 22: Number of Accounts Opened 2008 – 2014
Client Type
2008
2009
2010
2011
2012
2013
2014*
EC
East African Corporate
342
13 49 17
22
22
23
EI
East African Individuals
7,986
79 92 108
96 258
407
FC
Foreign Corporate
222
144 621 409
414 721
506
FI
Foreign Investors (Individuals)
2,586
334 440 338
300 1,446
483
LC
Local Corporate
109,533
2,143 3,981 1,229
877 3,945
1,350
LI
Local Individuals
843,979
52,836 120,756 31,607
19,473 173,157
28,885
TOTAL
964,648
55,549 125,939 33,708
21,182 179,549
31,654
Source CDSC
A total of 13,506 new CDS accounts were opened in the quarter ending September 2014, compared
to 8,721 new CDS accounts opened in Q2/2014 and 9,427 new CDS accounts opened in Q1/2014. In
the year-to-date, a total of 31,654 accounts have already been opened.
Table 23: Equity Investors according to Gender as at Sep. – 2014
Oct-Dec. 2013
Jan-Mar. 2014
Apr-Jun. 2014
Jul-Sep. 2014
Gender
No. of Investors
Share Qty Held
No. of Investors
Share Qty Held
No. of Investors
Share Qty Held
No. of Investors
Share Qty Held
F
264,765
1,482,658,740
535,496
3,305,154,354
528,238
3,323,632,773
534,793
3,697,931,371
M
553,517
6,054,687,783
1,136,041
6,684,994,891
1,119,990
6,726,510,196
1,134,630
6,840,290,723
TOTAL 818,282 7,537,346,523
535,496
3,305,154,354
1,648,228
10,050,142,969
1,669,423
10,538,222,094
Source CDSC
Table 24: Share pledges as at Sep. – 2014
Share Pledges
No. of Investors
Quantity Pledged
46,269
4,216,904,632
TOTAL 46,269
4,216,904,632

The CMA Capital Markets Bulletin – Q3/2014
26
Table 25: Shareholding per listed company as at September 2014
Company Latest Report Total Shares
Amount Amount Held By
Foreign Shareholders % Held By Foreign
Shareholders
No. Held By Local Individual
Investors
% Held By Local
Individuals Amount Held By
Local Institutions
% Held By Local
Institutions
AGRICULTURAL
Eaagads AIMS Sep.
32,157,000
7,781,800
24.20
3,930,904
12.22
20,444,296
63.47
Kakuzi Sep.
19,599,999
6,788,170
34.64
7,304,889
37.27
5,506,940
28.10
Kapchorua Tea AIMS Sep.
3,912,000
1,066,414
27.26
708,641
18.08
2,136,745
54.65
Limuru Tea AIMS Sep.
1,200,000
10,126
0.84
377,590
31.47
812,284
67.69
Rea Vipingo Sep.
60,000,000
38,167,532
63.61
16,711,880
27.85
5,120,588
8.53
Sasini Sep.
228,055,500
3,892,275
1.70
57,151,463
25.06
167,011,762
73.23
Williamson AIMS Sep.
8,756,320
4,959,938
56.25
2,481,496
28.39
1,314,886
15.36
AUTOMOBILES & ACCESSORIES
Car & General
Sep.
40,103,308
208,309
0.52
9,810,748
24.47
30,084,251
75.01
CMC Holdings Sep.
suspended
suspended
suspended
suspended
suspended
suspended
suspended
Marshalls (E.A.) Sep.
14,393,106
774,275
5.38
1,802,904
12.53
11,815,927
82.10
Sameer Africa Sep.
278,342,393
6,928,837
2.49
50,395,230
18.11
221,018,326
79.41
BANKING
Barclays Bank Sep.
5,431,536,000
3,979,787,512
73.28
814,079,596
14.99
637,668,892
11.74
CFC Stanbic Holdings Sep.
395,321,638
296,433,375
75.00
21,136,665
5.35
77,751,598
19.67
Diamond Trust Bank Sep.
220,100,096
121,068,882
50.01
45,425,604
18.76
75,615,619
31.23
Equity Bank Sep.
3,702,777,020
1,824,798,005
49.28
584,043,310
15.77
1,293,935,705
34.95
HFCK
Sep.
231,520,000
8,174,081
2.59
61,641,490
26.62
161,704,429
69.84
Kenya Commercial Sep.
3,024,729,532
885,534,834
29.28
794,209,136
26.26
1,344,985,562
44.47
National Bank Sep.
280,000,000 1,364,112 0.50 57,685,593 20.60
220,950,295 78.90
NIC Bank Sep.
597,282,563
11,070,904
1.85
105,426,641
17.65
480,785,018
80.50
Standard Chartered Sep.
309,159,514
231,897,528
75.01
33,249,964
10.75
44,012,022
14.24

The CMA Capital Markets Bulletin – Q3/2014
27
Company Latest Report Total Shares
Amount Amount Held By
Foreign Shareholders % Held By Foreign
Shareholders
No. Held By Local Individual
Investors
% Held By Local
Individuals Amount Held By
Local Institutions
% Held By Local
Institutions
The Co-op Bank Sep. 4,889,316,242 185,950,595
3.80
857,543,188
17.54 3,845,822,459
78.66
I&M Sep. 392,362,039 52,473,502
13.37
43,763,544
11.15 296,124,993
75.47
COMMERCIAL AND SERVICES
Express Kenya AIMS Sep.
297,186
0.84
11,155,096
31.51
23,951,508
67.65
297,186
Hutchings Biemer Suspended
Suspended
Suspended
Suspended
Suspended
Suspended
Suspended
Suspended
Kenya Airways Sep.
1,496,469,035
634,805,778
42.42
223,318,423
14.92
638,344,834
42.66
Nation Media Group Sep.
188,542,286
112,741,972
59.80
36,115,766
19.16
39,684,548
21.05
Scangroup Sep.
378,865,102
256,504,049
67.70
67,927,871
17.92
54,433,182
14.37
Standard Group
Sep.
81,731,808
56,876,255
69.59
5,905,664
7.23
18,949,889
23.19
TPS Eastern Africa Sep.
182,174,108
119,333,628
65.51
15,169,082
8.33
47,671,398
26.17
Uchumi Sep.
265,424,636
82,377,964
31.04
102,632,382
38.67
80,414,290
30.30
Longhorn Kenya Ltd Sep.
58,500,000
16,900
0.03
19,221,690
32.86
39,261,410
67.11
CONSTRUCTION & ALLIED
Athi River Mining Sep.
495,275,000
124,025,512
25.04
124,495,407
25.14
246,754,081
49.82
Bamburi Cement Sep.
362,959,275
244,255,460
67.30
13,281,660
3.66
105,422,155
29.05
Crown Berger Kenya Sep.
23,727,000
6,063,641
25.55
4,085,290
17.22
13,578,069
57.23
E.A. Cables Sep.
253,125,000
4,435,100
1.75
55,351,194
21.87
193,338,706
76.38
E.A. Portland Cement Jun. 90,000,000 26,622,276 29.58 1,576,358 1.75 61,801,366 68.67
ENERGY & PETROLEUM
KenGen Sep.
2,198,361,456
34,540,695
1.57
368,630,662
16.77
1,795,190,099
81.66
KenolKobil Sep.
1,471,761,200
727,481,730
49.43
182,728,954
12.42
561,550,516
38.16
Kenya Power Sep.
1,953,617,045
182,835,283
9.37
194,294,957
9.96
1,574,336,805
80.59
Total Kenya Sep.
629,542,458
592,968,241
94.19
29,616,489
4.70
6,957,728
1.11
INSURANCE

The CMA Capital Markets Bulletin – Q3/2014
28
Company Latest Report Total Shares
Amount Amount Held By
Foreign Shareholders % Held By Foreign
Shareholders
No. Held By Local Individual
Investors
% Held By Local
Individuals Amount Held By
Local Institutions
% Held By Local
Institutions
Liberty Holdings Ltd ord.1.00
Sep.
515,270,364
323,383,069
60.37
23,873,162
4.46
188,451,268
35.18
Jubilee Holdings Sep.
59,895,000
35,228,021
58.82
19,566,788
32.67
5,100,191
8.52
Kenya Re Insurance Sep.
699,949,068
58,291,755
8.33
107,865,242
15.41
533,792,071
76.26
Pan Africa Insurance Sep.
96,000,000
1,501,614
1.56
3,418,972
35.61
60,313,414
62.83
British-American Investments
Sep.
1,891,451,850
549,334,377
28.34
618,025,974
31.88
771,055,487
39.78
CIC Insurance Sep.
2,179,615,440
44,385,444
1.70
579,887,880
22.17
1,991,265,204
76.13
INVESTMENT
Centum Investment Sep.
665,441,714
38,777,703
5.82
313,346,392
47.09
313,317,619
47.08
Olympia Capital Sep.
40,000,000
370,400
0.93
17,919,358
44.80
21,710,242
54.28
Trans-Century AIMS Sep.
273,950,284
58,020,114
20.70
202,946,527 72.41
19,317,835 6.89
MANUFACTURING & ALLIED
A.Baumann& Co AIMS Suspended
Suspended
Suspended
Suspended
Suspended
Suspended
Suspended
Suspended
B.O.C Kenya Sep.
19,525,446
14,515,330
74.35
2,762,098
14.15
2,248,018
11.51
BAT Sep.
100,000,000
76,940,918
76.94
6,316,105
6.32
16,742,977
16.74
Carbacid Investments Sep.
254,851,985
22,737,662
8.93
124,700,145
48.91
107,414,178
42.16
East African Breweries Sep.
790,774,356
258,067,423
32.64
80,223,978
10.14
452,482,955
57.22
Eveready East Africa Sep.
210,000,000
22,601,943
10.76
63,365,678
30.17
124,032,379
59.06
Kenya Orchards Ltd Sep.
12,868,124
5,543
0.03
6,604,482
51.32
5,929,242
50.38
Mumias Sugar Sep.
1,530,000,000
82,721,229
5.41
914,446,557
59.77
532,832,214
34.83
Unga Group Sep.
75,708,873
4,249,038
5.61
27,857,849
36.79
43,601,986
57.59
TELECOMMUNICATION AND TECHNOLOGY
Safaricom Sep.
40,065,428,000
5,086,478,283
12.70
1,903,317,751
4.80
33,075,631,966
82.60
FIXED INCOME SECURITIES MARKET SEGMENT - PREFERENCE SHARES
Kenya Power & Lighting Ltd 4% Pref. 20.00
Sep.
1,800,000
82,462
4.58
641,396
35.43
1,076,142
59.79

The CMA Capital Markets Bulletin – Q3/2014
29
Company Latest Report Total Shares
Amount Amount Held By
Foreign Shareholders % Held By Foreign
Shareholders
No. Held By Local Individual
Investors
% Held By Local
Individuals Amount Held By
Local Institutions
% Held By Local
Institutions
Kenya Power & Lighting Ltd 7% Pref 20.00
Sep.
350,000
15,388 4.40
100,049 28.59
234,533 67.00
GROWTH ENTERPRISE MARKET SEGMENT (GEMS)
Home Africa Sep.
405,245,320
31,621,009 7.80
237,033,091 58.49
136,601,220 33.71
Umeme Sep.
13,372,000
12,968,307
0.8
248,900
0.02
36,268,000
2.23
Ng – not given Source: CMA

The CMA Capital Markets Bulletin – Q3/2014
30
Table 26: Trends in Investor Holdings at the NSE (2004 – 2014*)
Type of Investor
2004
2005
2006
2007
2008
2009
2010
2011
2012
2013
2014*
E.A. Institutions (%)
47.4
51.2
52.8
54.5
77.2
74.2
73.6
68.33
66.70
47.58
65.92
E.A. Individuals (%)
22.8
22.5
21.6
26.9
14.9
15.7
13.8
12.23
12.01
23.70
12.81
Foreign Investors (%)
29.8
26.3
25.6
18.6
7.9
10.1
12.6
19.44
21.29
27.89
21.93
*As at June; Source: CMA
Table 27: Trends in Foreign institutional and Local Equity Investor participation at the NSE in 2014
Quarter
Month/Year
Foreign Investor Purchases
Foreign Investor Sales
Equity Turnover
Participation of Foreign Investors
Kshs. Millions
Kshs. Millions
Kshs. Millions
%
Q4/2013
Oct
10,244
7,521
15,937
55.74%
Nov
6,329
5,445
13,129
44.84%
Dec
6,225
6,915
11,329
57.99%
Q1/2014 Jan 7,711
8,587
15,970
51.03%
Feb 7,007
8,512
14,743
52.63%
March 6,593
6,992
13,042
52.08%
Q2/2014 Apr 9,815
8,406
15,570
57.84%
May 11,258
13,836
23,023
54.50%
June 11,532
8,946
18,190
56.29%
Q3/2014 Jul 8,453
8,311
15,043
55.72%
Aug 8,540
5,287
15,513
44.57%
Sep 8,411
9,261
19,241
45.92%
Source: NSE
Diaspora Remittances
Remittances to Kenya increased by 20.3 per cent, to USD 128.8 million in August 2014 compared to
USD 107 million in August 2013. In comparison to the preceding month’s remittances, the August
2014 remittances were higher by 10 percent.
Table 28: Remittance Inflows by Source (USD ‘000’) in 2006 - 2014*
Year 2006 2007 2008 2009 2010 2011 2012 2013 2014*
January
31,506
40,930
53,925
39,535
45,117
64,139 89,755 102,970
110,969
February 30,283 39,533 50,382 53,353 46,423 60,759 103,970 102,372
110,421
March 36,354 48,562 59,344 55,361 52,309 71,557 106,399 103,393
119,585
April 35,369 38,251 67,872 48,117 52,679 70,071 95,625 104,993
113,409

The CMA Capital Markets Bulletin – Q3/2014
31
Year 2006 2007 2008 2009 2010 2011 2012 2013 2014*
May 42,427 41,163 48,538 49,180 51,172 68,124 100,995 110,150
119,657
June 35,667 48,643 49,490 46,347 52,541 71,888 99,488 99,809
116,064
July 41,065 53,350 44,137 50,372 50,652 72,797 92,736 112,834
117,101
August 30,587 58,803 43,388 55,947
51,993
79,563 94,819 107,049
128,826
September 28,841 60,575 48,953 53,347
58,557
84,854 92,519 107,452
October 29,633 46,848 61,113 53,037
58,503
81,311
91,627 112,919
November 31,403 55,564 43,970 48,231
56,400
80,802
97,504 113,420
December
34,459
41,421
40,129
56,329
65,617
85,244
105,656 113,216
Total
407,593
573,643
611,241
609,156
641,943
891,109 1,171,093
1,290,577
936,032
*up to August; Source: CBK
The cumulative year-to-date remittances increased by 10.96 per cent to USD 936 million in August
2014 from USD 843 million in August 2013. In addition, the average annual flow sustained an upward
trend in 2014, peaking at USD 128.8 million in August 2014 from a low of USD 110.4 million in February
2014.
Table 29: Remittance Inflows by Source in USD millions, in Q3/2014 Jun. – Aug. 2014
North America Europe Rest of the World
Remittances in USD Millions
Jun-2014 52.83 32.15 31.08
Jul-2014 52.62 31.37 33.11
Aug-2014
64.01
31.52
33.29
Remittances as a % of total Flows
Jun-2014
45.5
27.7
26.8
Jul-2014
44.9
26.8
28.3
Aug-2014
49.7
24.5
25.8
Source: CBK
Foreign Investor Net Cash-flow Activity
Foreign portfolio flows registered a net inflow of Kshs.2,545 million in Q3/2014, compared to
Kshs.1,417 million net inflow in Q2/2014.

The CMA Capital Markets Bulletin – Q3/2014
32
Table 31: Foreign Investor Net Cash Inflow Activity (Kshs Millions) 2009-2014
2010
2011
2012
2013
2014
January
2,517
1,987
(812)
2,133
(876)
February
489
622
795
(3,927)
(1,505)
March
1,998
1,552
2,651
1,810
(399)
April
151 (3,024)
1,771
3,026
1,409
May
(325) (3,334)
1,099
3,475
(2,578)
June
1,601 (1,597)
1,639
2,602
2,586
July
1,159
1,173
828
1,625
142
August
471
621
1,048
9,839
3253
September
1,206
535
3,286
2,063
(850)
October
2,147 719
2,965
2,723
November
2,526 31
4,335
884
December
1,186 935
2,129
(690)
NET CASH FLOW
15,126
220
21,734
25,563
1,182
*as at September: Source: NSE

The CMA Capital Markets Bulletin – Q3/2014
33
Source: CMA
(6,000.00)
(4,000.00)
(2,000.00)
-
2,000.00
4,000.00
6,000.00
8,000.00
10,000.00
12,000.00
Jan Feb Mar Apr May Jun Jul Aug Sep
Po
rtfo
lio
Flo
ws
in
Ks
hs
Mil
lio
ns
Month
Fig. 7: Kenya's Net Portfolio Flows in Kshs. Millions, year to September (2012 - 2014)
2012
2013
2014

The CMA Capital Markets Bulletin – Q3/2014
34
4.0 Corporate Actions
Corporate Actions (Apr. 2014 – Sep. 2014).
Company Announcement Date Corporate Action Amount(Kshs.)/Ratio
ARM 01-04-14 1st & Final 0.60
Total 03-04-14 1st & Final 0.60
Liberty 09-04-14 Scrip dividend 1.00
Crown Paints 30-04-14 Interim 1.75
Safaricom 13-05-14 Final 0.47
Bamburi 06-06-14 Interim 6.00
Kapchorua Tea 09-06-14 Final 5.00
Williamson Tea 09-06-14 Final 7.00
Longhorn 10-06-14 Interim 0.80
Diamond Trust Bank 19-06-14 Right issue 1:10
BAT 10-07-14 Interim 3.50
Housing Finance 17-07-14 Interim 0.75
EABL 08-08-14 Final 4.00
CFC 11-08-10 Interim 0.95
BOC 18-08-14 Interim 2.20
Umeme 18-08-14 Interim 9.40*
Jubilee 26-08-14 Interim 1.00
Nation Media Group 29-08-14 Interim 2.50
Olympia Capital Holdings 01-09-14 1st & Final 0.25
Uchumi 08-09-14 1st & Final 0.30
Unga 26-09-14 1st & Final 0.75
Longhorn 26-09-14 Final 1.20
Longhorn 26-09-14 Bonus 3:20
NIC Bank 26-09-14 Right Issue 1:14
* Uganda Shillings; Source: NSE

The CMA Capital Markets Bulletin – Q3/2014
35
5.0 Major International Economic Developments
USA
The U.S. economy expanded significantly faster than initially estimated in the third quarter of 2014.
According to US’s Commerce Department, Gross domestic product grew at a seasonally adjusted
annual rate of 3.6% from July through September. The figure was revised up from an earlier 2.8%
estimate and marks the strongest growth pace since the first quarter of 2012.
The upgrade was nearly entirely the result of businesses boosting their stockpiles. The change in
private inventories, as measured in dollars, was the largest in 15 years after adjusting for inflation.
Source: http://online.wsj.com/articles/SB10001424052702303997604579239852058216032
United Kingdom
According to UK’s National Statistics Office, UK economic growth slowed in the three months to
September, with the economy expanding by 0.7%. The figure was weaker than the 0.9% expansion
recorded for the second quarter. Gross domestic product (GDP) was 3% higher in the three months
than the same period in 2013. The third quarter figure will raise concerns that the recovery will fall
victim to the slowdown affecting the Eurozone. However, the UK still looked set to be the fastest-
growing advanced economy in 2014.
http://www.bbc.com/news/business-29752338
China
Gross domestic product (GDP) growth for the July-September quarter came in at 7.3 percent from the
year-ago period, after the 7.5 percent growth in the second quarter. This is the slowest reading since
the first quarter of 2009, when China's growth rate slumped to 6.6 percent amid the depths of the
global financial crisis.
Source: http://www.cnbc.com/id/102101000#.
Africa
According to IMF, Sub-Saharan Africa's economic growth remains strong and should accelerate to 5.8
percent in 2015 but if the Ebola outbreak in its western corner is protracted or spreads it will have
"dramatic consequences". In its latest World Economic Outlook, the Fund said Africa should repeat
2013's growth rate of 5.1 percent this year and then accelerate in 2015 as infrastructure investments
boost efficiency and the service sectors and agriculture flourish. The 2015 forecast was an
improvement on the 5.5 percent growth for the overall region projected by the IMF in April.
In a separate report, the World Bank said that without a scaled-up response, transportation, cross-
border trade, supply chains and tourism in West Africa could be "severely disrupted", costing the

The CMA Capital Markets Bulletin – Q3/2014
36
region as a whole tens of billions of dollars. The security situation in several parts of Sub-Saharan
Africa remained fragile, the IMF said, noting rumbling internal conflicts in South Sudan and Central
African Republic.
Growth in South Africa, the continent's most advanced economy, had been hit by protracted strikes,
low business confidence and tight electricity supply. But it saw "muted recovery" taking hold in 2015
through improving labor relations and gradually stronger exports that would push South African growth
to 2.3 percent from a forecast 1.4 percent this year. By contrast, Nigeria - the continent's top oil
producer which overtook South Africa as its biggest economy this year after a dramatic GDP rebasing
- is forecast to expand 7 percent this year and 7.3 percent in 2015. Some African economies had been
able to increasingly tap capital markets, with recent sovereign bond issuances in the Eurodollar market
largely oversubscribed, the report said, citing maiden issues by Kenya and Ivory Coast.
http://www.reuters.com/article/2014/10/07/imf-economy-africa-idUSL6N0S21H620141007

The CMA Capital Markets Bulletin – Q3/2014
37
APPENDICES
Nairobi Securities Exchange Listed Companies
AGRICULTURAL
Eaagads Ltd Ord 1.25 AIMS
Kakuzi Ltd Ord.5.00
Kapchorua Tea Co. Ltd Ord Ord 5.00 AIMS
The Limuru Tea Co. Ltd Ord 20.00 AIMS
Rea Vipingo Plantations Ltd Ord 5.00
Sasini Ltd Ord 1.00
Williamson Tea Kenya Ltd Ord 5.00 AIMS
AUTOMOBILES & ACCESSORIES
Car & General (K) Ltd Ord 5.00
CMC Holdings Ltd Ord 0.50
Marshalls (E.A.) Ltd Ord 5.00
Sameer Africa Ltd Ord 5.00
BANKING
Barclays Bank of Kenya Ltd Ord 0.50
CFC Stanbic of Kenya Holdings Ltd ord.5.00
Diamond Trust Bank Kenya Ltd Ord 4.00
Equity Bank Ltd Ord 0.50
Housing Finance Co.Kenya Ltd Ord 5.00
I&M Holdings Ltd Ord 1.00
Kenya Commercial Bank Ltd Ord 1.00
National Bank of Kenya Ltd Ord 5.00
NIC Bank Ltd Ord 5.00
Standard Chartered Bank Kenya Ltd Ord 5.00
The Co-operative Bank of Kenya Ltd Ord 1.00
COMMERCIAL AND SERVICES
Express Kenya Ltd Ord 5.00 AIMS
Hutchings Biemer Ltd Ord 5.00
Kenya Airways Ltd Ord 5.00
Longhorn Kenya Ltd Ord 1.00 AIMS
Nation Media Group Ltd Ord. 2.50
Scangroup Ltd Ord 1.00
Standard Group Ltd Ord 5.00
TPS Eastern Africa Ltd Ord 1.00
Uchumi Supermarket Ltd Ord 5.00
CONSTRUCTION & ALLIED
ARM Cement Ltd Ord 1.00
Bamburi Cement Ltd Ord 5.00
Crown Paints Kenya Ltd Ord 5.00
E.A.Cables Ltd Ord 0.50
E.A.Portland Cement Co. Ltd Ord 5.00
ENERGY & PETROLEUM
KenGen Co. Ltd Ord. 2.50
KenolKobil Ltd Ord 0.05
Kenya Power & Lighting Co Ltd Ord 2.50
Kenya Power & Lighting Ltd 4% Pref 20.00
Kenya Power & Lighting Ltd 7% Pref 20.00
Total Kenya Ltd Ord 5.00
Umeme Ltd Ord 0.50
INSURANCE
British-American Investments Co.(Kenya) Ltd Ord 0.10
CIC Insurance Group Ltd Ord.1.00
Jubilee Holdings Ltd Ord 5.00
Kenya Re Insurance Corporation Ltd Ord 2.50
Liberty Kenya Holdings Ltd Ord.1.00
Pan Africa Insurance Holdings Ltd Ord 5.00
INVESTMENT
Centum Investment Co Ltd Ord 0.50
Olympia Capital Holdings Ltd Ord 5.00
Trans-Century Ltd Ord 0.50 AIMS
INVESTMENT SERVICES
Nairobi Securities Exchange Ltd Ord 4.00
MANUFACTURING & ALLIED

The CMA Capital Markets Bulletin – Q3/2014
38
A.Baumann & Co Ltd Ord 5.00 AIMS
B.O.C Kenya Ltd Ord 5.00
British American Tobacco Kenya Ltd Ord 10.00
Carbacid Investments Ltd Ord 1.00
East African Breweries Ltd Ord 2.00
Eveready East Africa Ltd Ord.1.00
Kenya Orchards Ltd Ord 5.00 AIMS
Mumias Sugar Co. Ltd Ord 2.00
Unga Group Ltd Ord 5.00
TELECOMMUNICATION & TECHNOLOGY
Safaricom Ltd Ord 0.05
GROWTH ENTERPRISE MARKET SEGMENT (GEMS)
Home Afrika Ltd Ord 1.00
Traded Bonds’ Statistics Q3/2014
July 2014
Security High Yield (%) Low Yield (%) Deals Turnover (Kshs)
Government bonds
FXD1/2006/012 14 10.9384 3 11989718.5
FXD1/2007/010 11.4 10.8 4 569287600
FXD1/2007/012 10.9941 10.9941 1 108514
FXD1/2008/015 13.2 12.35 3 15261181.45
FXD1/2008/020 12.5 12.1 153 2463267703
FXD1/2009/005 9.274 9.274 1 2067014
FXD1/2009/010 11.374 11.374 1 7032837
FXD1/2009/015 12.238 12.238 1 2616352.5
FXD1/2010/005 10.557 10.557 1 3741206.4
FXD1/2010/010 12 11.5 6 410832082.5
FXD1/2010/015 12.59 12.075 8 1263196107
FXD1/2010/025 13.2 12.3 3 26942080
FXD1/2011/005 11.905 10.4 4 388501888
FXD1/2012/005 12 10.75 21 6062048688
FXD1/2012/010 12.55 11.5 5 731998662
FXD1/2012/015 12.9927 10.6 8 1266491214
FXD1/2012/020 13.7 12.47 72 4507584941
FXD1/2013/005 12.8 10.7 4 453597211.7
FXD1/2013/010 12.7 11.32 21 3437425452
FXD1/2013/015 13.0192 10.7 18 3,166,840,378
FXD1/2014/002 11.234 11.234 1 4,116,756
FXD1/2014/005 11.785 11 9 1,601,811,700
FXD1/2014/010 12.8 11.475 60 6,160,727,840
FXD2/2007/015 13.5 12.25 2 2,087,094
FXD2/2008/010 11.336 11.336 1 6,875,113
FXD2/2010/005 11.23 11.23 1 1,910,232
FXD2/2010/010 13 11.7 3 302,962,126
FXD2/2013/005 12.15 10.8 8 1,036,742,900
FXD2/2013/015 13 12 8 910,291,772

The CMA Capital Markets Bulletin – Q3/2014
39
Security High Yield (%) Low Yield (%) Deals Turnover (Kshs)
FXD2/2014/002 11.235 10.65 3 641,477,312
FXD2/2014/005 11.5 10.9 65 1,457,709,644
FXD3/2007/015 12.3 12.057 2 214,817,066
FXD3/2008/010 11.34 11.34 1 6,707,118
FXD3/2013/002 11.23 11.23 1 2,139,594
FXD3/2013/005 12.4 10.9585 9 208,728,488
FXD4/2012/002 10.9 10.9 1 608,104,800
FXD4/2013/002 11.236 11.236 1 2,533,390
IFB1/2009/012 11 10.8 2 6,173,442
IFB1/2010/008 10.8 10.75 2 7,615,061
IFB1/2011/012 13.6 10.65 39 6,545,259,677
IFB1/2013/012 11.5 10.6991 26 4,286,085,381
IFB2/2010/009 10.95 10.7 9 659,779,585
SDB1/2011/030 14 12.6514 5 2,447,770
Subtotal 597 49,467,934,689
Corporate Bonds - -
Subtotal - -
Grand Total 597 49,467,934,689
August 2014
Security High Yield (%) Low Yield (%) Deals Turnover (Kshs)
Government bonds
FXD1/2006/009 11.30 11.30 2 10442690
FXD1/2006/012 11.50 11.50 1 5656200
FXD1/2007/008 11.40 11.40 2 10279259.25
FXD1/2007/010 11.30 11.30 1 2513720
FXD1/2007/012 11.90 11.90 3 7909117.5
FXD1/2008/010 12.75 12.75 1 189046.8
FXD1/2008/015 12.00 11.82 2 12976833.1
FXD1/2008/020 13.10 12.20 44 679416024.8
FXD1/2010/010 12.20 12.00 4 17596599.75
FXD1/2010/015 12.23 12.23 1 276500.4
FXD1/2010/025 13.07 13.07 1 132589.05
FXD1/2011/005 11.20 11.20 3 4664148.5
FXD1/2011/020 13.30 12.70 4 27495996.5
FXD1/2012/005 11.30 10.20 26 3909184117
FXD1/2012/010 12.50 11.50 12 1533621574
FXD1/2012/015 13.10 12.40 3 299889318.3
FXD1/2012/020 13.40 12.50 160 8176933695
FXD1/2013/002 10.00 10.00 1 161058750
FXD1/2013/005 11.50 10.90 69 1979841672
FXD1/2013/010 12.60 11.50 19 3,269,385,033
FXD1/2013/015 13.10 10.65 8 2,677,539,698
FXD1/2014/002 11.20 10.60 11 4,781,976,422

The CMA Capital Markets Bulletin – Q3/2014
40
Security High Yield (%) Low Yield (%) Deals Turnover (Kshs)
FXD1/2014/005 11.66 10.80 9 1,705,983,940
FXD1/2014/010 12.20 11.78 14 4,117,744,150
FXD2/2007/015 12.50 12.50 1 13,182,250
FXD2/2008/010 11.05 11.05 1 1,001,100
FXD2/2010/010 11.30 11.30 1 937,850
FXD2/2010/015 12.29 12.29 1 121,776
FXD2/2012/002 11.40 11.40 1 2,594,295
FXD2/2013/002 12.50 9.75 6 1,081,794,487
FXD2/2013/005 11.40 10.85 20 4,146,242,150
FXD2/2013/015 13.10 12.20 2 211,801,328
FXD2/2014/002 11.20 10.55 15 2,950,662,061
FXD2/2014/005 11.25 10.80 10 2,156,787,643
FXD3/2007/015 11.85 11.85 2 433,057,335
FXD3/2012/002 11.50 11.50 3 15,365,130
FXD3/2013/002 11.20 11.20 1 10,627,580
FXD3/2013/005 11.70 10.80 6 912,473,630
FXD4/2012/002 11.50 10.00 2 1,238,074,920
FXD4/2013/002 11.30 11.30 2 4,406,812
IFB1/2009/012 12.50 12.00 2 632,634
IFB1/2011/012 12.90 10.60 23 3,788,800,811
IFB1/2013/012 11.00 10.60 24 4,352,214,607
IFB2/2009/012 12.00 12.00 3 3,183,229
IFB2/2010/009 10.40 10.40 1 76,529,550
SDB1/2011/030 13.90 12.65 9 71,264,200
Subtotal 537 54,864,462,469
Corporate Bonds
BBKB 10.32 8.89 3 4,706,201
CONB 11 11 1 2,067,189
HFCB 13.5 8.6867 4 120,959,600
KENB 13.2 12 5 2,222,089
PTAB 8.74 8.74 1 205,481
SCOB 12.25 8.74 2 8,787,565
Subtotal 16 138,948,124
Grand Total 553 55,003,410,593
September 2014
Security High Yield (%) Low Yield (%) Deals Turnover (Kshs)
Government bonds
FXD1/2006/011 10.927 10.927 1 2722464
FXD1/2006/012 11.0111 11.0111 1 2307574.5
FXD1/2007/008 8.5217 8.5217 1 1534984.5
FXD1/2007/010 11 11 1 206563.6

The CMA Capital Markets Bulletin – Q3/2014
41
Security High Yield (%) Low Yield (%) Deals Turnover (Kshs)
FXD1/2008/010 13 10.9343 2 1395441.6
FXD1/2008/015 13.5 11.7943 3 12891378.65
FXD1/2008/020 13 12.3 10 1124627807
FXD1/2009/010 11.2223 11.2223 1 306591
FXD1/2009/015 12 12 1 53726.7
FXD1/2010/005 9.9962 9.9962 1 4346302.5
FXD1/2010/010 11.4 11.05 2 280296000
FXD1/2010/015 12.0369 12.0369 1 2818935
FXD1/2011/005 13 11 2 383985.9
FXD1/2011/020 12.9 12.5249 2 10372501.1
FXD1/2012/005 13 10.2 9 750909473.6
FXD1/2012/015 12.9 10.53 4 420980640.7
FXD1/2012/020 13.2 12.5 52 913713753.8
FXD1/2013/002 12.844 8.5839 5 1652155132
FXD1/2013/005 13 10.7 9 1891890176
FXD1/2013/010 11.815 11.815 2 124757079.6
FXD1/2013/015 12.85 12.1 20 1044351168
FXD1/2014/002 11 10.5 5 1862655628
FXD1/2014/005 11.30 10.80 10 2076257051
FXD1/2014/010 12.00 11.85 17 2333844012
FXD2/2006/010 10.80 10.80 1 4081455
FXD2/2007/015 11.90 11.30 2 505673862
FXD2/2008/010 10.98 10.98 1 8891285.25
FXD2/2010/005 10.25 10.25 1 2051765.1
FXD2/2010/010 11.53 11.10 3 316628406.8
FXD2/2010/015 12.11 12.11 1 745037.1
FXD2/2013/002 11.50 8.70 10 4071727591
FXD2/2013/005 10.98 10.63 9 1603200765
FXD2/2013/015 12.80 12.20 21 1404593352
FXD2/2014/002 10.70 10.70 2 232117875
FXD2/2014/005 11.70 10.70 40 7406391919
FXD3/2007/015 12.00 11.80 3 438005806.6
FXD3/2008/010 11.01 11.01 1 2960383.35
FXD3/2013/002 10.30 10.00 5 1108267942
FXD3/2013/005 12.90 10.70 5 644716906.5
FXD4/2012/002 8.75 8.34 3 220996219.5
FXD4/2013/002 10.60 10.40 6 1771718953
IFB1/2009/012 12.50 10.65 4 6,376,353
IFB1/2010/008 10.60 10.60 1 2,953,257
IFB1/2011/012 16.07 10.60 14 2,680,619,953
IFB1/2013/012 11.00 10.65 18 4,779,212,433
IFB2/2009/012 10.65 10.65 1 1,597,925
IFB2/2010/009 10.40 10.40 1 5,813,782
SDB1/2011/030 14.00 13.77 12 94,844,024
Subtotal 327 41,829,965,619

The CMA Capital Markets Bulletin – Q3/2014
42
Security High Yield (%) Low Yield (%) Deals Turnover (Kshs)
Corporate Bonds
KENB 13.2 11.7 11 9,288,508
PTAB 8.4 8.4 1 104,062
UAPB 11.8 11.8 1 422,645
HFCB 13 11.8 4 11,305,975
I&MB 11.7 11.7 1 542,561
BRTB 12.5 12.5 2 6,834,837
CONB 13.5 13 2 203,959
CTMB 11.4 11.4 1 1,114,858
Subtotal 23 29,817,404
Grand Total 350 41,859,783,023
Performance of other Selected EAC Markets Quarterly Performance – EAC Member States (Equities) [quarter to September 2014].
Indicator
Uganda
Tanzania
Kenya
Number of Shares Traded (million) 209.99
81.34
2,021.29
Turnover (US Dollars billion) 0.01158
0.1046
0.560
Number of Deals 1,339
9,097
156,330
Average Market Cap (US Dollars billion) 8.68
12.8673
24.85
Turnover Ratio ( Turnover/Average Market Cap) 0.0013
0.0813
0.0225
All Share Index (Closing) 1,860.00
2,576.48
163
Exchange rate to the USD (Sep) 2651.9161
1,665.07
89.00
Source: CMSA; NSE; USE
Market Capitalization in USD (Millions) for selected Markets – Jul. – Sep. 2014
Exchange % change
/ Sep 13
(in USD)
% change /
Sep 13 (in local
cur) July August September
Americas
Bermuda SE 1 634.9 1 641.6 1 641.5 2.8% 2.8%
BM&FBOVESPA 1 102 538.4 1 207 504.0 991 690.3 -8.4% 0.8%
Buenos Aires SE 57 558.7 64 621.9 82 439.5 67.7% 145.6%
Colombia SE 209 959.1 214 872.5 195 212.8 -13.5% -8.4%
Lima SE 83 761.5 82 640.6 76 073.4 -3.8% 0.0%
Mexican Exchange 535 699.2 561 943.9 544 250.2 10.2% 12.4%
NASDAQ OMX 6 505 313.8 6 788 376.3 6 683 219.0 20.7% 20.7%
NYSE 18 507 191.9 19 278 128.3 18 778 742.0 13.6% 13.6%
Santiago SE 248 783.0 245 964.4 242 204.8 -14.2% 1.8%
TMX Group 2 423 747.2 2 364 196.3 2 204 378.1 7.5% 16.9%
Total region 29 676 187.8 30 809 889.7 29 799 851.5 13.2%

The CMA Capital Markets Bulletin – Q3/2014
43
Exchange % change
/ Sep 13
(in USD)
% change /
Sep 13 (in local
cur) July August September
Asia - Pacific
Australian SE 1 512 784.5 1 523 563.0 1 344 319.2 -2.5% 4.1%
BSE India 1 488 747.1 1 525 952.7 1 519 146.5 48.9% 46.9%
Bursa Malaysia 529 982.7 548 901.0 526 525.4 9.7% 10.4%
Colombo SE 21 937.9 22 670.8 23 510.4 29.8% 28.3%
GreTai Securities Market 89 667.2 88 137.8 86 007.0 22.6% 26.2%
HoChiMinh SE 49 921.9 53 473.3 50 433.8 30.8% 31.5%
Hong Kong Exchanges 3 290 333.3 3 352 822.6 3 145 906.9 6.9% 7.1%
Indonesia SE 436 438.1 436 718.4 419 877.1 14.4% 20.3%
Japan Exchange Group - Osaka NA NA NA - -
Japan Exchange Group - Tokyo 4 658 417.8 4 572 373.8 4 484 864.7 0.7% 12.5%
Korea Exchange 1 333 695.4 1 356 821.8 1 273 184.0 6.1% 4.2%
National Stock Exchange India 1 459 149.7 1 493 236.6 1 485 239.3 50.2% 48.1%
New Zealand Exchange 74 603.0 74 830.5 69 705.4 7.9% 15.3%
Philippine SE 256 082.6 259 184.3 261 203.5 18.3% 21.9%
Shanghai SE 2 615 035.0 2 658 914.3 2 868 705.0 13.9% 14.2%
Shenzhen SE 1 627 915.3 1 715 057.4 1 912 599.2 34.4% 34.8%
Singapore Exchange 820 417.1 815 226.0 778 017.3 1.6% 3.2%
Taiwan SE Corp. 889 047.1 905 044.5 847 814.3 8.8% 12.0%
The Stock Exchange of Thailand 427 491.8 447 259.7 453 059.7 16.0% 20.2%
Total region 20 122 517.7 20 356 951.9 20 064 879.4 10.7%
Europe - Africa - Middle East
Abu Dhabi SE 126 120.7 126 064.9 126 889.2 27.5% 27.5%
Amman SE 26 586.6 25 841.5 25 605.8 10.0% 10.1%
Athens Exchange 89 026.9 88 014.4 77 164.2 10.3% 18.2%
BME Spanish Exchanges 1 212 965.4 1 228 741.6 1 145 535.7 5.4% 13.0%
Borsa Istanbul 228 693.7 220 640.6 195 691.1 -12.7% -1.6%
Budapest SE 16 650.9 16 700.4 16 330.7 -20.3% -10.8%
Casablanca SE 54 826.7 55 400.7 56 622.3 12.0% 18.4%
Cyprus SE 2 291.4 2 313.7 2 195.3 31.4% 40.8%
Deutsche Börse 1 810 139.5 1 789 725.7 1 716 295.3 -0.1% 7.0%
Dubai Financial Market 94 380.7 97 292.2 97 385.7 - -
Egyptian Exchange 70 224.0 73 420.7 73 758.5 34.6% 39.6%
Euronext 3 623 096.1 3 646 775.6 3 503 834.0 4.5% 11.9%
Irish SE 156 340.1 153 926.3 161 366.9 6.9% 14.5%
Johannesburg SE 1 036 221.9 1 034 111.3 950 514.9 9.2% 22.6%
Kazakhstan SE 26 634.8 27 354.1 26 368.2 8.5% 28.4%
Ljubljana SE 8 645.4 8 405.4 8 145.5 21.3% 30.0%
Luxembourg SE 73 468.1 71 644.7 66 783.1 2.5% 9.8%
Malta SE 4 052.9 3 903.7 3 794.6 -5.7% 1.1%
Mauritius SE 9 105.9 9 114.4 9 111.2 11.6% 15.6%
Moscow Exchange 661 097.3 619 098.4 580 378.8 -24.7% -8.1%
Muscat Securities Market 39 423.4 40 016.6 40 535.5 16.0% 16.0%
NASDAQ OMX Nordic Exchange 1 292 876.6 1 287 014.2 1 242 939.9 4.6% 12.1%
Oslo Børs 277 800.3 281 366.8 273 042.5 13.5% 21.2%

The CMA Capital Markets Bulletin – Q3/2014
44
Exchange % change
/ Sep 13
(in USD)
% change /
Sep 13 (in local
cur) July August September
Qatar Stock Exchange 189 575.9 198 061.4 202 111.5 40.4% 40.5%
Saudi Stock Exchange - Tadawul 559 990.9 602 166.4 590 005.9 39.5% 39.6%
SIX Swiss Exchange 1 545 221.4 1 575 393.1 1 526 981.0 3.9% 9.8%
Tel Aviv SE 218 067.2 211 686.5 211 162.4 14.1% 19.3%
Wiener Börse 112 750.1 110 756.3 102 603.0 -9.2% -2.7%
Total region 13 566 274.6 13 604 951.4 13 033 152.8 4.3%
WFE Total 63 364 980.1 64 771 793.0 62 897 883.8 10.4%
Source : World Federation of Exchanges members
Non-members statistics are available under queries on WFE website at http://www.world-exchanges.org/statistics/monthly-query-tool
Total excludes Osaka and National Stock Exchange of India to avoid double counting with Tokyo and Bombay SE respectively Data combine the main and Alternative / SMEs market capitalizations.
Australian SE: including investment funds BME: including investment companies listed (open-end investmernt companies) that differ from investment funds included in table 1.3.2 because of their legal status and that cannot be distinguished from other listed companies
Johannesburg SE: figures include the market capitalization of all listed companies, but exclude listed warrants, convertibles and investment funds
JPX - Osaka SE: on 16 July 2013, Osaka SE cash equity products were listed on Tokyo SE
JPX - Tokyo SE: on 16 July 2013, Osaka SE cash equity products were listed on Tokyo SE
Korea Exchange: includes Kosdaq market data
Mauritius SE: from Aug. 2006, data includes Development & Enterprise Market
NASDAQ OMX Nordic Exchange: OMX includes Copenhagen, Helsinki, Iceland, Stockholm, Tallinn, Riga and Vilnius Stock Exchanges Singapore Exchange: market capitalization includes domestic listings and a substantial number of foreign listings, defined as companies whose principal place of business is outside of Singapore. Inactive secondary foreign listings are excluded
TSX Group: also includes TSX Venture market cap

The CMA Capital Markets Bulletin – Q3/2014
45
CONTACT DETAILS
CAPITAL MARKETS AUTHORITY KENYA Embankment Plaza, 3rd Floor, Longonot Road, Upper Hill P.O. Box 74800-00200 Nairobi Tel:+254-20-2264900, 2221910, 2226225, Cell: 0722207767. 0734651550 Fax: +254- 20-342825 Email: [email protected]; [email protected] Website: www.cma.or.ke