Embed Size (px)
Citation preview

List of Appendices to the Thesis
The Econometrics of Maritime Safety Recommendations to enhance safety at sea
by
Sabine Knapp
Note from the author:
Please note, that the full appendix is not included in the printed version of the thesis due to the large volume of pages. The appendix for further reference is therefore made
available online and can be downloaded here.
ERIM series Nr. 96
ISBN-10: 90-5892-127-1 ISBN-13: 978-90-5892-127-7
© Sabine Knapp, 2006

1

2
List of Appendices Appendix 1: List of Member States of each MoU....................................................................4 Appendix 2: List of Detainable Deficiencies ...........................................................................5 Appendix 3: IMO Definitions of Selected Major Ship Types ..................................................7 Appendix 4: Variable List and Respective Coding for Regressions .......................................8 Appendix 5: Grouping of Countries of Ownership................................................................17 Appendix 6: Results of Correspondence Analysis for Ship Type Selection .........................18 Appendix 7: Step 3: Final Models: General Cargo................................................................20 Appendix 8: Step 3: Final Models: Dry Bulk.........................................................................24 Appendix 9: Step 3: Final Models: Tanker ............................................................................28 Appendix 10: Step 3: Final Models: Container .....................................................................32 Appendix 11: Step 1: Results of Regressions: Passenger Vessels ........................................36 Appendix 12: Step 1: Results of Regressions: Other Ship Types .........................................39 Appendix 13: Step 1: Results of Regressions: Caribbean MoU ............................................42 Appendix 14: Step 3: Probability of Detention: General Cargo ...........................................43 Appendix 15: Step 3: Probability of Detention: Dry Bulk ....................................................45 Appendix 16: Step 3: Probability of Detention: Tanker .......................................................47 Appendix 17: Step 3: Probability of Detention: Container ...................................................49 Appendix 18: LM Test for Very Serious Casualties..............................................................51 Appendix 19: Estimation Results of Greene Model, Very Serious Casualties ....................53 Appendix 20: Average Probabilities of Corrected versus Uncorrected Model.....................56 Appendix 21: Results of Regression: Very Serious Casualties.............................................59 Appendix 22: Results of Regression: Serious Casualties......................................................62 Appendix 23: Results of Regressions: Less Serious Casualties ...........................................66 Appendix 24: Results of Regression: Fishing Fleet (above 400gt) .......................................71 Appendix 25: Probability of Casualty per DoC Country of Residence.................................74 Appendix 26: LM-Test Type I (Very Serious) and Type II Models ......................................75 Appendix 27: Matching Models: Type I Models ....................................................................80 Appendix 28: Matching Models: Type II Model ....................................................................88 Appendix 29: LM Test: Type III Models................................................................................91 Appendix 30: Matching Models: Type III Models .................................................................98

3
4
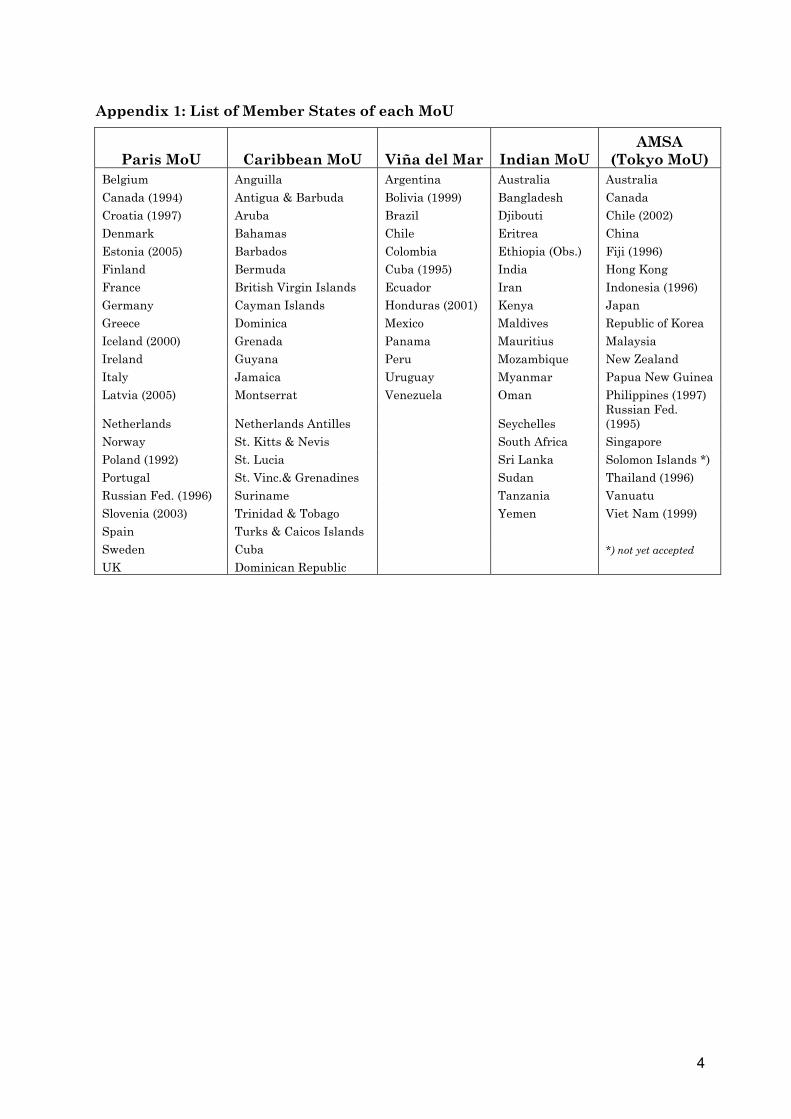
Appendix 1: List of Member States of each MoU
Paris MoU Caribbean MoU Viña del Mar Indian MoU AMSA
(Tokyo MoU) Belgium Anguilla Argentina Australia Australia Canada (1994) Antigua & Barbuda Bolivia (1999) Bangladesh Canada Croatia (1997) Aruba Brazil Djibouti Chile (2002) Denmark Bahamas Chile Eritrea China Estonia (2005) Barbados Colombia Ethiopia (Obs.) Fiji (1996) Finland Bermuda Cuba (1995) India Hong Kong France British Virgin Islands Ecuador Iran Indonesia (1996) Germany Cayman Islands Honduras (2001) Kenya Japan Greece Dominica Mexico Maldives Republic of Korea Iceland (2000) Grenada Panama Mauritius Malaysia Ireland Guyana Peru Mozambique New Zealand Italy Jamaica Uruguay Myanmar Papua New Guinea Latvia (2005) Montserrat Venezuela Oman Philippines (1997)
Netherlands Netherlands Antilles Seychelles Russian Fed. (1995)
Norway St. Kitts & Nevis South Africa Singapore Poland (1992) St. Lucia Sri Lanka Solomon Islands *) Portugal St. Vinc.& Grenadines Sudan Thailand (1996) Russian Fed. (1996) Suriname Tanzania Vanuatu Slovenia (2003) Trinidad & Tobago Yemen Viet Nam (1999) Spain Turks & Caicos Islands Sweden Cuba *) not yet accepted UK Dominican Republic

5
Appendix 2: List of Detainable Deficiencies1 The following is a list of detainable deficiencies as per the IMO PSC Guidelines and are split up into the relevant legal bases: SOLAS (all ships) 1. improper operation of propulsion or essential machinery 2. insufficient cleanliness in engines room, excessive dirty bilges, insulation of piping
and contamination of oil, improper operation of bilge pumping arrangements 3. failure of proper operation of emergency generator, lighting, batteries and switches 4. failure of proper operation of main and auxiliary steering gear 5. absence or insufficient life savings appliances, survival craft and launching
arrangements or serious deterioration thereof 6. non-functional fire fighting detection or fighting system or equipment including fire
dampers and ventilation valves 7. absence or serious deterioration of fire fighting equipment of the cargo deck area for
tankers. 8. absence or serious deterioration of lights, shapes or sound signals 9. absence or serious deterioration of radio equipment for distress and safety
communication 10. absence of serious deterioration of navigational equipment 11. absence of corrected navigational charts or publications 12. absence of non-sparking exhaust ventilation for cargo pump rooms 13. number of crew does not match the safe manning certificate 14. non-implementation of the enhanced survey program when applicable IBC and IGC Code (ships carrying dangerous cargo and gas carriers) 1. ship is carrying cargo not mentioned in the certificate of fitness or missing cargo
information 2. missing or damaged high pressure safety devices 3. electrical installation not in compliance with IBC Code 4. sources of ignition in hazardous locations 5. exceeding of maximum allowable cargo quantity per tank 6. insufficient heat protection for sensitive products 7. missing closing devices for accommodation or service spaces 8. bulkhead not gastight 9. defective air locks 10. missing of defective quick-closing valves or safety valves 11. ventilation in cargo area not operable 12. pressure alarms for cargo tanks not operable 13. gas detection plant and/or toxic gas detection plant defective Load Line Convention 1. significant damage or corrosion effecting seaworthiness of vessel 2. insufficient stability 3. absence of sufficient and reliable information for loading and ballasting of the vessel
to maintain stability 4. absence or substantial deterioration of closing devices, hatch covers and watertight
and weather tight doors 5. overloading 6. absence or impossible to read draught marks or load line marks 1 as per IMO guidelines on PSC, Chapter 2.3 and Appendix I (detainable deficiencies)

6
MARPOL Annex I, Annex II 1. malfunction of oily water separator 2. remaining capacity of slop/sludge tanks insufficient for the intended voyage 3. Oil Record Book not available 4. unauthorized discharge bypass fitted 5. failure to meet requirements of 13G(4) or 13G(7) – Crude Oil Washing 6. Absence of P&A Manual 7. Cargo is not categorized 8. No Cargo Record Book 9. Transport of oil-like substances without satisfying the requirement STCW Convention 1. invalid certificate of competence or no endorsement by the flag state 2. failure to comply to safe manning requirements by the flag state 3. failure of navigational or engineering watch arrangements to conform to flag state
requirements 4. absences in a watch of a qualified person to operate equipment for safe navigation,
safety radio communications or the prevention of marine pollution 5. non compliance to sufficient rest periods

7
Appendix 3: IMO Definitions of Selected Major Ship Types2 Passenger Ship: ship that carries more than twelve passengers. Cargo Ship: any ship which is not a passenger ship. Tanker: cargo ship constructed or adapted for the carriage in bulk of liquid cargoes of an inflammable nature. Oil Tanker: a ship constructed or adapted primarily to carry oil in bulk in its cargo spaces and includes the combination carriers and any “chemical tanker” when it is carrying a cargo or part cargo of oil in bulk. For the purpose of the Condition Assessment Scheme, oil tankers are divided into three categories as follows:
Category 1: oil tanker of 20,000 tons deadweight and above carrying crude oil, fuel oil, heavy diesel oil or lubricating oil as cargo, and of 30,000 tons deadweight and above carrying oil other than the above, which does not comply with the requirements for new oil tankers as defined in regulation 1(26) of MARPOL Annex I.3 Category 2: oil tanker of 20,000 tons deadweight and above carrying crude oil, fuel oil, heavy diesel oil or lubricating oil as cargo, and of 30,000 tons deadweight and above carrying oil other than the above, which complies with the requirements for new oil tankers as defined in regulation 1(26) of MARPOL Annex I. Category 3: oil tanker of 5,000 tons deadweight and above but less than that specified for category 1 and 2.
Combination Carrier: a ship designed to carry either oil or solid cargoes in bulk. Chemical Tanker: is a cargo ship constructed or adapted and used for the carriage in bulk of any liquid product listed in either:
• Chapter 17 of the International Code for the Construction and Equipment of Ships Carrying Dangerous Chemicals in Bulk (IBC Code)
• Chapter VI of the Code for the Construction and Equipment of Ships Carrying Dangerous Chemicals in Bulk adopted by resolution A.212(VII).
Gas Carrier: a cargo ship constructed or adapted and used for the carriage in bulk of any liquefied gas or other products listed in either:
• Chapter 19 of the International Code for the Construction and Equipment of Ships Carrying Liquefied Gases in Bulk (IGC Code)
• Chapter XIX of the Code for Construction and Equipment of Ships Carrying Liquefied Gases in Bulk adopted by resolution A.328 (IX).
Bulk Carrier: a ship which is constructed generally with single deck, top-side tanks and hopper side tanks in cargo spaces, and is intended primarily to carry dry cargo in bulk, and includes such types as ore carriers and combination carriers Fishing Vessel: a vessel used for catching fish, whales, seals, walrus or other living resources of the sea. Ro-Ro Passenger: a passenger ship with ro-ro cargo spaces or special category spaces as defined in regulation II-2/3. (SOLAS). 2 All sources of definitions are taken from SOLAS and MARPOL 3 Refers to the date the vessel was built

8
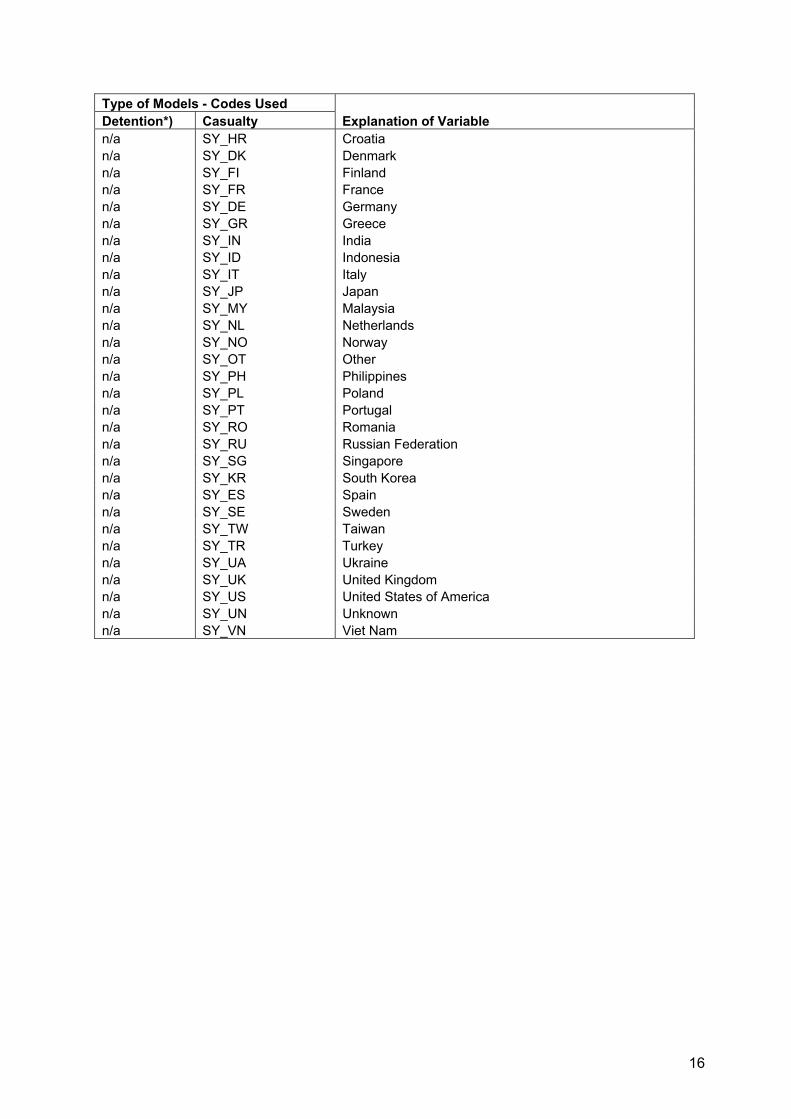
Appendix 4: Variable List and Respective Coding for Regressions The following list of variables shows a list of variables which have been used either in the probability of detention or probability of casualty models. Some variables are the same in both models while some variables only appear in one model. Due to the large size of variables in the detention models, only one ship type is shown below as an example. The detention models also use the following coding: *) Variable+ Ship Type (e.g. GC) + PSC Regime (1 for Paris MoU) Type of Models - Codes Used Detention*) Casualty Explanation of Variable IMO IMO IMO number of vessel n/a Casualty ship had casualty (split into seriousness) n/a VerySerious very serious casualty n/a Serious serious casualty n/a LessSerious less serious casualty detained detained ship was detained AgebyGC1 lnAge Age at time of inspection/casualty SizeGC1 lnTon Gross Tonnage n/a ST1_max general cargo ship n/a ST2_max dry bulk carrier n/a ST3_max container n/a ST4_max tanker n/a ST5_max passenger n/a ST6_max other ship type n/a ST7_max fishing vessel CG n/a general cargo ship (middle portion of code) DB n/a dry bulk carrier (middle portion of code) CO n/a container (middle portion of code) TA n/a tanker (middle portion of code) PA n/a passenger (middle portion of code) OT n/a other ship type (middle portion of code) n/a RS_Ins ship inspected by Rightship n/a RS_1S Rightship 1 star vessel n/a RS_2S Rightship 2 star vessel n/a RS_3S Rightship 3 star vessel n/a RS_4S Rightship 4 star vessel n/a RS_5S Rightship 5 star vessel n/a Green ship is Greenaward certified n/a DH double hull n/a STChgd ship type changed n/a FLChgd flag changed n/a CLChgd classification society changed n/a CLWd_d classification society withdrawn n/a OWChgd ownership changed 1 n/a Paris MoU (end portion of code) 2 n/a Caribbean MoU (end portion of code) 3 n/a Viña del Mar (end portion of code) 4 n/a Indian Ocean MoU (end portion of code) 5 n/a USCG (end portion of code) 6 n/a AMSA (end portion of code) n/a PMOU_av average inspection fraction Paris MoU

9
Type of Models - Codes Used Detention*) Casualty Explanation of Variable n/a CMOU_av average inspection fraction Caribbean MoU n/a VMOU_av average inspection fraction Viña del Mar MoU n/a IMOU_av average inspection fraction Indian Ocean MoU n/a USCG_av average inspection fraction USCG n/a AMSA_av average inspection fraction AMSA n/a PMOU_s number inspection fraction Paris MoU n/a CMOU_s number inspection fraction Caribbean MoU n/a IMOU_s number inspection fraction Indian Ocean MoU n/a VMOU_s number inspection fraction Viña del Mar MoU n/a USCG_s number inspection fraction USCG n/a AMSA_s number inspection fraction AMSA n/a det_PMOU detained by Paris MoU n/a det_CMOU detained by Caribbean MoU n/a det_VMOU detained by Viña del Mar MoU n/a det_IMOU detained by Indian Ocean MoU n/a det_USCG detained by USCG n/a det_AMSA detained by AMSA n/a lnTimebw time in-between inspections OWEMNGC1 OW_EMN Owner from Emerging Maritime Nation OWTMNGC1 OW_TMN Owner from Traditional Maritime Nation OWOORGC1 OW_OOR Owner from Old Open Registry OWNORGC1 OW_NOR Owner from New Open Registry OWIORGC1 OW_IOR Owner from Intern. Open Registry OWUNKGC1 OW_UNKn Owner Unknown n/a LI_FLRet Number of Legal Instruments Ratified by Flag n/a LI_OWRet Number of Legal Instr. Ratified by Owner Country FL_AFGC1 FL_AF FL_Afghanistan FL_ALGC1 FL_AL FL_Albania FL_DZGC1 FL_DZ FL_Algeria FL_AGGC1 FL_AG FL_Antigua FL_ANGC1 FL_AN FL_AntillesNetherland FL_ARGC1 FL_AR FL_Argentina FL_AUGC1 FL_AU FL_Australia FL_ATGC1 FL_AT FL_Austria FL_AZGC1 FL_AZ FL_Azerbaijan FL_BSGC1 FL_BS FL_Bahamas FL_DHGC1 FL_DH FL_Bahrain FL_BDGC1 FL_BD FL_Bangladesh FL_BBGC1 FL_BB FL_Barbados FL_BEGC1 FL_BE FL_Belgium FL_BZGC1 FL_BZ FL_Belize FL_BMGC1 FL_BM FL_Bermuda FL_BOGC1 FL_BO FL_Bolivia FL_BRGC1 FL_BR FL_Brazil FL_BGGC1 FL_BG FL_Bulgaria FL_BVIGC1 FL_BVI FL_BVI FL_KHGC1 FL_KH FL_Cambodia FL_CAGC1 FL_CA FL_Canada FL_KYGC1 FL_KY FL_CaymanIslands FL_CLGC1 FL_CL FL_Chile FL_CNGC1 FL_CN FL_China FL_COGC1 FL_CO FL_Colombia

10
Type of Models - Codes Used Detention*) Casualty Explanation of Variable FL_KMGC1 FL_KM FL_Comoros FL_HRGC1 FL_HR FL_Croatia FL_CUGC1 FL_CU FL_Cuba FL_CYGC1 FL_CY FL_Cyprus FL_DKGC1 FL_DK FL_Denmark FL_DMGC1 FL_DM FL_Dominica FL_DOGC1 FL_DO FL_DominicanRepublic FL_ECGC1 FL_EC FL_Ecuador FL_EGGC1 FL_EG FL_Egypt FL_ERGC1 FL_ER FL_Eritrea FL_EEGC1 FL_EE FL_Estonia FL_ETGC1 FL_ET FL_Ethiopia FL_FOGC1 FL_FO FL_FaroeIslands FL_FJGC1 FL_FJ FL_Fiji FL_FIGC1 FL_FI FL_Finland FL_FRGC1 FL_FR FL_France FL_GEGC1 FL_GE FL_Georgia FL_DEGC1 FL_DE FL_Germany FL_GIGC1 FL_GI FL_Gibraltar FL_GRGC1 FL_GR FL_Greece FL_GYGC1 FL_GY FL_Guyana FL_HTGC1 FL_HT FL_Haiti FL_HNGC1 FL_HN FL_Honduras FL_HKGC1 FL_HK FL_HongKong FL_ISGC1 FL_IS FL_Iceland FL_INGC1 FL_IN FL_India FL_IDGC1 FL_ID FL_Indonesia FL_IRGC1 FL_IR FL_Iran FL_IQGC1 FL_IQ FL_Iraq FL_IEGC1 FL_IE FL_Ireland FL_IMGC1 FL_IM FL_IselofMan FL_ILGC1 FL_IL FL_Israel FL_ITGC1 FL_IT FL_Italy FL_JMGC1 FL_JM FL_Jamaica FL_JPGC1 FL_JP FL_Japan FL_JOGC1 FL_JO FL_Jordan FL_KIGC1 FL_KI FL_Kiribati FL_KWGC1 FL_KW FL_Kuwait FL_LVGC1 FL_LV FL_Latvia FL_LBGC1 FL_LB FL_Lebanon FL_LRGC1 FL_LR FL_Liberia FL_LYGC1 FL_LY FL_Libya FL_LTGC1 FL_LT FL_Lithuania FL_LUGC1 FL_LU FL_Luxembourg FL_MYGC1 FL_MY FL_Malaysia FL_MVGC1 FL_MV FL_Maldives FL_MTGC1 FL_MT FL_Malta FL_MHGC1 FL_MH FL_MarshallIslands FL_MUGC1 FL_MU FL_Mauritius FL_MXGC1 FL_MX FL_Mexico FL_MDGC1 FL_MD FL_Moldovia FL_MNGC1 FL_MN FL_Mongolia

11
Type of Models - Codes Used Detention*) Casualty Explanation of Variable FL_MAGC1 FL_MA FL_Morocco FL_MMGC1 FL_MM FL_Myanmar FL_NAGC1 FL_NA FL_Namibia FL_NLGC1 FL_NL FL_Netherlands FL_NZGC1 FL_NZ FL_NewZealand FL_NIGC1 FL_NI FL_Nicaragua FL_NGGC1 FL_NG FL_Nigeria FL_NISGC1 FL_NIS FL_NIS FL_KPGC1 FL_KP FL_NorthKorea FL_NOGC1 FL_NO FL_Norway FL_OTGC1 FL_OT FL_Other FL_PKGC1 FL_PK FL_Pakistan FL_PAGC1 FL_PA FL_Panama FL_PYGC1 FL_PY FL_Paraguay FL_PEGC1 FL_PE FL_Peru FL_PHGC1 FL_PH FL_Philippines FL_PLGC1 FL_PL FL_Poland FL_PTGC1 FL_PT FL_Portugal FL_QAGC1 FL_QA FL_Quatar FL_ROGC1 FL_RO FL_Romania FL_RUGC1 FL_RU FL_RussianFed FL_ASGC1 FL_AS FL_Samoa FL_STGC1 FL_ST FL_SaoTomePrin FL_SAGC1 FL_SA FL_SaudiaArabia FL_SCGC1 FL_SC FL_Seychelles FL_SGGC1 FL_SG FL_Singapore FL_SKGC1 FL_SK FL_Slovakia FL_ZAGC1 FL_ZA FL_SouthAfrica FL_KRGC1 FL_KR FL_SouthKorea FL_ESGC1 FL_ES FL_Spain FL_LKGC1 FL_LK FL_SriLanka FL_VCGC1 FL_VC FL_StVincentGrenad FL_SDGC1 FL_SD FL_Sudan FL_SEGC1 FL_SE FL_Sweden FL_CHGC1 FL_CH FL_Switzerland FL_SYGC1 FL_SY FL_Syria FL_TWGC1 FL_TW FL_Taiwan FL_THGC1 FL_TH FL_Thailand FL_TOGC1 FL_TO FL_Tonga FL_TTGC1 FL_TT FL_TrinidadTobago FL_TNGC1 FL_TN FL_Tunisia FL_TRGC1 FL_TR FL_Turkey FL_TMGC1 FL_TM FL_Turkmenistan FL_TVGC1 FL_TV FL_Tuvalu FL_AEGC1 FL_AE FL_UAE FL_UKGC1 FL_UK FL_UK FL_UAGC1 FL_UA FL_Ukraine FL_UNGC1 FL_UN FL_Unknown FL_USGC1 FL_US FL_USA FL_VUGC1 FL_VU FL_Vanuatu FL_VEGC1 FL_VE FL_Venezuela FL_VNGC1 FL_VN FL_VietNam

12
Type of Models - Codes Used Detention*) Casualty Explanation of Variable CLABSGC1 CL_ABS CL_ABS CLBKGC1 CL_BKI CL_BiroKlasIndo CLBUKGC1 CL_BUK CL_BulgarskiKoraben CLBVGC1 CL_BV CL_BureauVeritas CLCCGC1 CL_CCS CL_ChinaClass CLCOOGC1 CL_CCO CL_ChinaCorp CLCRRGC1 CL_CRR CL_CroatianRS CLDNVGC1 CL_DNV CL_DNV CLGLGC1 CL_GL CL_GermanischerLloyd CLGBKGC1 CL_GBS CL_GuardianBS CLHELGC1 CL_HEL CL_Hellenic CLHINGC1 CL_HIN CL_HondurasInterNav CLINCGC1 CL_INC CL_Inclamar CLINRGC1 CL_INR CL_IndianRegister CLINSGC1 CL_INS CL_InterNavSurB CLIRSGC1 CL_IRS CL_InterRegShipping CLIBSGC1 CL_IBS CL_IsthmusBS CLJRSGC1 CL_JRS CL_JosonRS CLKRSGC1 CL_KRS CL_KoreanSouth CLLRGC1 CL_LR CL_LloydsUK CLNKKGC1 CL_NKK CL_NKKJapan CLNCLGC1 CL_NCL CL_NoClass CLOCLGC1 CL_OCL CL_OtherClass CLPBSGC1 CL_PBS CL_PanamaBureauS CLPMDGC1 CL_PMD CL_PanamaMDS CLPMSCG1 CL_PMS CL_PanamaMSurveyorB CLPRCGC1 CL_PRC CL_PanamaRegCorp CLPSRCG1 CL_PSR CL_PanamaShipReg CLPRSGC1 CL_PRS CL_PolskiReSt CLRSAGC1 CL_RSA CL_RegisterAlbania CLRCCGC1 CL_RCC CL_RegistroCubano CLRSCGC1 CL_RSC CL_RegShipChina CLRSKGC4 CL_RSK CL_RegShipDRKorea CLRSGGC1 CL_RSG CL_RegShipGhana CLRINGC1 CL_RIN CL_RINA CLRIPGC1 CL_RIP CL_RINAVE CLRNRGC1 CL_RNR CL_RomanianNaval CLRMSGC1 CL_RMS CL_RussianMS CLRRRGC1 CL_RRR CL_RussianRiver CLSRUGC1 CL_SRU CL_SRUkraine CLTLLGC1 CL_TLL CL_TurkishLloyd CLVRSGC1 CL_VRS CL_VietnamRS C0100GC1 Code_0100 Ship's certificates and documents C0200GC1 Code_0200 Crew certificates C0300GC1 Code_0300 Accommodation C0400GC1 Code_0400 Food and catering C0500GC1 Code_0500 Working spaces and accident prev. C0600GC1 Code_0600 Life saving appliances C0700GC1 Code_0700 Fire Safety measures C0800GC1 Code_0800 Accident prevention (ILO147) C0900GC1 Code_0900 Structural Safety C1000GC1 Code_1000 Alarm signals

13
Type of Models - Codes Used Detention*) Casualty Explanation of Variable C1100GC1 Code_1100 Cargoes C1200GC1 Code_1200 Load lines C1300GC1 Code_1300 Mooring arrangements (ILO 147) C1400GC1 Code_1400 Propulsion & auxiliary engine C1500GC1 Code_1500 Safety of navigation C1600GC1 Code_1600 Radio communications C1700GC1 Code_1700 MARPOL Annex I C1800GC1 Code_1800 Gas and chemical carriers C1900GC1 Code_1900 MARPOL Annex II C2000GC1 Code_2000 SOLAS Operational deficiencies C2100GC1 Code_2100 MARPOL related oper. deficiencies C2200GC1 Code_2200 MARPOL Annex III C2300GC1 Code_2300 MARPOL Annex V C2500GC1 Code_2500 ISM related deficiencies C2600GC1 Code_2600 Bulk carriers C2700GC1 Code_2700 Security C2900GC1 Code_2900 MARPOL Annex IV C9800GC1 Code_9800 Other def. clearly hazardous safety C9900GC1 Code_9900 Other def. not clearly hazardous PS1_BE PS1_BE PS1_Belgium PS1_CA PS1_CA PS1_Canada PS1_HR PS1_HR PS1_Croatia PS1_DK PS1_DK PS1_Denmark PS1_FI PS1_FI PS1_Finland PS1_FR PS1_FR PS1_France PS1_DE PS1_DE PS1_Germany PS1_GR PS1_GR PS1_Greece PS1_IS PS1_IS PS1_Iceland PS1_IE PS1_IE PS1_Ireland PS1_IT PS1_IT PS1_Italy PS1_NL PS1_NL PS1_Netherlands PS1_NO PS1_NO PS1_Norway PS1_PL PS1_PL PS1_Poland PS1_PT PS1_PT PS1_Portugal PS1_RU PS1_RU PS1_Russia PS1_SI PS1_SI PS1_Slovenia PS1_ES PS1_ES PS1_Spain PS1_SE PS1_SE PS1_Sweden PS1_UK PS1_UK PS1_UK PS2_AG PS2_AG PS2_Antigua PS2_AN PS2_AN PS2_AntillesNetherlands PS2_BS PS2_BS PS2_Bahamas PS2_BB PS2_BB PS2_Barbados PS2_BVI PS2_BVI PS2_BVI PS2_KY PS2_KY PS2_Cayman PS2_CU PS2_CU PS2_Cuba PS2_JM PS2_JM PS2_Jamaica PS2_VC PS2_VC PS2_StVincentGren PS2_SR PS2_SR PS2_Suriname PS2_TT PS2_TT PS2_Trinidad PS3_AR PS3_AR PS3_Argentina PS3_BR PS3_BR PS3_Brasil

14
Type of Models - Codes Used Detention*) Casualty Explanation of Variable PS3_CHI PS3_CHI PS3_Chile PS3_COL PS3_COL PS3_Colombia PS3_CUB PS3_CUB PS3_Cuba PS3_ECU PS3_ECU PS3_Ecuador PS3_HN PS3_HN PS3_Honduras PS3_MX PS3_MX PS3_Mexico PS3_PA PS3_PA PS3_Panama PS3_PE PS3_PE PS3_Peru PS3_UY PS3_UY PS3_Uruguay PS3_VE PS3_VE PS3_Venezuela PS4_ER PS4_ER PS4_Eritrea PS4_IN PS4_IN PS4_India PS4_IR PS4_IR PS4_Iran PS4_MU PS4_MU PS4_Mauritius PS4_ZA PS4_ZA PS4_SouthAfrica PS4_LK PS4_LK PS4_SriLanka PS4_SD PS4_SD PS4_Sudan PS4_TZ PS4_TZ PS4_Tanzania PS5_ANCO PS5_ANCO PS5_Anchorage_AK PS5_BALTI PS5_BALTI PS5_Baltimore_MD PS5_BATR PS5_BATR PS5_BatonRouge_LA PS5_BOST PS5_BOST PS5_Boston_MA PS5_BROW PS5_BROW PS5_Brownsville_TX PS5_BUFF PS5_BUFF PS5_Buffalo_NY PS5_CHAR PS5_CHAR PS5_Charleston_SC PS5_CHIC PS5_CHIC PS5_Chicago_IL PS5_CLEV PS5_CLEV PS5_Cleveland_OH PS5_CORP PS5_CORP PS5_CorpusChristi_TX PS5_DETR PS5_DETR PS5_Detroit_MI PS5_DULU PS5_DULU PS5_Duluth_MN PS5_GUAM PS5_GUAM PS5_Guam PS5_HAMP PS5_HAMP PS5_HamptonRoads_VA PS5_HONO PS5_HONO PS5_Honolulu_HI PS5_HOUS PS5_HOUS PS5_HoustonGalv_TX PS5_JACK PS5_JACK PS5_Jacksonville_FL PS5_JUNE PS5_JUNE PS5_Juneau_AK PS5_LCHA PS5_LCHA PS5_LakeCharles_LA PS5_LONG PS5_LONG PS5_LongIsland_NY PS5_LANG PS5_LANG PS5_LosAngeles_CA PS5_MASS PS5_MASS PS5_Massena_NY PS5_MIAM PS5_MIAM PS5_Miami_FL PS5_MOBI PS5_MOBI PS5_Mobile_AL PS5_MORG PS5_MORG PS5_MorganCity_LA PS5_NORL PS5_NORL PS5_NewOrleans_LA PS5_NEWY PS5_NEWY PS5_NewYork_NY PS5_PHIL PS5_PHIL PS5_Philadelphia_PA PS5_POAR PS5_POAR PS5_PortArthur_TX PS5_POCA PS5_POCA PS5_PortCarnaveral_FL PS5_POLA PS5_POLA PS5_PortLavaca_TX PS5_PORM PS5_PORM PS5_Portland_ME PS5_PORO PS5_PORO PS5_Portland_OR PS5_PORT PS5_PORT PS5_Portsmouth_NH

15
Type of Models - Codes Used Detention*) Casualty Explanation of Variable PS5_PROV PS5_PROV PS5_Providence_RI PS5_PUGE PS5_PUGE PS5_PugetSound_WA PS5_SAMO PS5_SAMO PS5_AmericanSamoa PS5_SAND PS5_SAND PS5_SanDiego_CL PS5_SANF PS5_SANF PS5_SanFrancisco_CL PS5_SANJ PS5_SANJ PS5_SanJuan_PR PS5_SANB PS5_SANB PS5_SantaBarbara_CL PS5_SAUL PS5_SAUL PS5_SaultMarie_MI PS5_SAVA PS5_SAVA PS5_Savannah_GA PS5_TAMP PS5_TAMP PS5_Tampa_FL PS5_TOLE PS5_TOLE PS5_Toledo_OH PS5_VALD PS5_VALD PS5_Valdez_AK PS5_WILM PS5_WILM PS5_Wilmington_NC PS5_USVI PS5_USVI PS5_USVirginIslands PS5_OTH PS5_OTH PS5_Other PS6_BELL PS6_BELL PS6_BellBay_TAS PS6_BRIS PS6_BRIS PS6_Brisbane_QLD PS6_BUNB PS6_BUNB PS6_Bunbury_WA PS6_BURN PS6_BURN PS6_Burnie_TAS PS6_CAIR PS6_CAIR PS6_Cairns_QLD PS6_DAMP PS6_DAMP PS6_Dampier_WA PS6_DARW PS6_DARW PS6_Darwin_NT PS6_DEVO PS6_DEVO PS6_Devonport_TAS PS6_ESPE PS6_ESPE PS6_Esperance_WA PS6_FREM PS6_FREM PS6_Fremantle_WA PS6_GEEL PS6_GEEL PS6_Geelong_VIC PS6_GERA PS6_GERA PS6_Geraldton_WA PS6_GLAD PS6_GLAD PS6_Gladstone_QLD PS6_GOVE PS6_GOVE PS6_Gove_NT PS6_HAYP PS6_HAYP PS6_HayPoint_QLD PS6_KURN PS6_KURN PS6_Kurnell_NSW PS6_KWIN PS6_KWIN PS6_Kwinana_WA PS6_MACK PS6_MACK PS6_Mackay_QLD PS6_MELB PS6_MELB PS6_Melborne_VIC PS6_NEWC PS6_NEWC PS6_Newcastle_NSW PS6_OTH PS6_OTH PS6_Other PS6_POAD PS6_POAD PS6_PortAdelaide_SA PS6_POBO PS6_POBO PS6_PortBotany_NSW PS6_POHE PS6_POHE PS6_PortHedland_WA PS6_POKE PS6_POKE PS6_PortKembla_NSW PS6_POWA PS6_POWA PS6_PortWalcott_WA PS6_PORT PS6_PORT PS6_Portland_VIC PS6_SYDN PS6_SYDN PS6_Sydney_NSW PS6_TOWN PS6_TOWN PS6_Townsville_QLD PS6_WALL PS6_WALL PS6_Wallaroo_SA n/a SY_AU Australia n/a SY_BE Belgium n/a SY_BR Brazil n/a SY_BG Bulgaria n/a SY_CA Canada n/a SY_CL Chile n/a SY_CN China
16
Type of Models - Codes Used Detention*) Casualty Explanation of Variable n/a SY_HR Croatia n/a SY_DK Denmark n/a SY_FI Finland n/a SY_FR France n/a SY_DE Germany n/a SY_GR Greece n/a SY_IN India n/a SY_ID Indonesia n/a SY_IT Italy n/a SY_JP Japan n/a SY_MY Malaysia n/a SY_NL Netherlands n/a SY_NO Norway n/a SY_OT Other n/a SY_PH Philippines n/a SY_PL Poland n/a SY_PT Portugal n/a SY_RO Romania n/a SY_RU Russian Federation n/a SY_SG Singapore n/a SY_KR South Korea n/a SY_ES Spain n/a SY_SE Sweden n/a SY_TW Taiwan n/a SY_TR Turkey n/a SY_UA Ukraine n/a SY_UK United Kingdom n/a SY_US United States of America n/a SY_UN Unknown n/a SY_VN Viet Nam

17
Appendix 5: Grouping of Countries of Ownership The grouping of ownership of a vessel was made according to Alderton and Winchester (1999) and is as follows: 1. Old Open Registries: Antigua and Barbuda, Bahamas, Bermuda, Cyprus, Honduras,
Liberia, Malta, Marshall Islands, Panama, St. Vincent & the Grenadines 2. New Open Registries: Barbados, Belize, Bolivia, Cambodia, Canary Islands, Cayman
Islands, Cook Islands, Equatorial Guinea, Gibraltar, Lebanon, Luxembourg, Mauritius, Myanmar, Sri Lanka, Tuvalu and Vanuatu
3. International Registries: Anguila, British Virgin Islands, Channel Islands, DIS,
Falklands, Faeroes, Hong Kong, Isle of Man, Kerguelen Islands, Macao, Madeira, NIS, Philippines, Sao Tome and Principe, Singapore, Turks and Caicos, Ukraine, Wallis and Fortuna, Netherlands Antilles
4. Traditional Maritime Nations: Argentina, Australia, Austria, Belgium, Brazil,
Canada, Chile, Denmark, Finland, France, Germany, Greece, Iceland, Ireland, Italy, Japan, Mexico, Netherlands, New Zealand, Norway, Portugal, Russia, South Africa, Spain, Sweden, Switzerland, UK, Uruguay, USA, Venezuela.
5. Emerging Maritime Nations: Albania, Algeria, Angola, Azerbaijan, Bahrain,
Bangladesh, Benin, Brunei, Bulgaria, Cameroon, Cape Verde, China, Colombia, Comoro, Congo, Costa Rica, Croatia, Cuba, Djibouti, Dominica, Dominican Republic, Egypt, El Salvador, Ecuador, Eritrea, Estonia, Ethiopia, Fiji, Gabon, Gambia, Georgia, Ghana, Grenada, Guatemala, Guinea, Guyana, Haiti, Hungary, India, Indonesia, Iran, Iraq, Israel, Jamaica, Jordan, Kazakhstan, Kenya, Kiribati, North Korea, South Korea, Kuwait, Laos, Latvia, Libya, Lithuania, Madagascar, Malaysia, Maldives, Mauritania, Micronesia, Morocco, Mozambique, Namibia, Nicaragua, Nigeria, Oman, Pakistan, Papua New Guinea, Paraguay, Peru, Poland, Qatar, Romania, St. Helena, St. Kitts & Nevis, Samoa, Saudi Arabia, Senegal, Seychelles, Sierra Leone, Slovakia, Slovenia, Solomon Islands, Somalia Republic, Sudan, Surinam, Syria, Taiwan, Tanzania, Thailand, Togo, Trinidad, Tunisia, Turkey, Turkmenistan, UAE, Vietnam, Yemen
6. Other/Unknown: Undefined by dataset, Unknown (Fairplay), Azores, Cameroon,
Greenland, Monaco, Puerto Rico, Serbia & Montenegro, St. Pierre & Miquel

18
Appendix 6: Results of Correspondence Analysis for Ship Type Selection Explained Inertia chi2 = 1.7371e+004
Dim1 0.5679 Dim2 0.1878 Dim3 0.1166 Dim4 0.0453
Xpk = x coordinates Ypk = y coordinates
General' 0.0740 -0.0587 'C0100' -0.1099 -0.0162 Bulk' 0.0506 0.1011 'C0200' -0.0276 -0.1356 Oil' -0.3927 -0.0029 'C0300' 0.0897 -0.0690
Tanker' -0.5035 -0.0768 'C0400' 0.0730 0.0101 'RoRoCargo' 0.0180 0.0549 'C0500' 0.0047 -0.0354
Other' -0.0224 -0.0881 'C0600' 0.0049 -0.0001 Chemical' -0.6786 -0.0707 'C0700' -0.0579 0.0966
Reefer' 0.0598 -0.0430 'C0800' -0.0392 0.0527 'Passenger' -0.0321 0.2328 'C0900' 0.0172 0.1157
Gas' -0.7187 -0.0144 'C1000' -0.0698 0.2267 OBO' -0.3603 0.1123 'C1100' 0.1528 -0.0307
RoRoPax' -0.0566 0.4441 'C1200' 0.1032 -0.0243 Offshore' 0.0127 -0.1609 'C1300' 0.1057 -0.0456 Mobile' -0.1659 -0.2607 'C1400' -0.0078 0.0402 Factory' 0.1349 -0.1266 'C1500' 0.1108 -0.1742 Special' 0.0873 -0.1850 'C1600' 0.0723 -0.0883
'HeavyLoad' 0.0431 0.0662 'C1700' -0.0342 -0.0681 HSPax' -0.0877 0.2967 'C1800' -2.9875 -0.3640
'Container' 0.0325 0.0296 'C1900' -1.8985 -0.4299 'C2000' 0.0143 0.1520 'C2100' -0.0006 -0.0399 'C2200' 0.1443 0.0423 'C2300' 0.0657 -0.0758 'C2500' -0.1028 0.1714
Absolute Row Contribution Relative Row Contribution General' 0.0922 0.1753 General' 0.5659 0.3559
Bulk' 0.0164 0.1983 Bulk' 0.0927 0.3703 Oil' 0.2037 0.0000 Oil' 0.9501 0.0001
Tanker' 0.1782 0.0125 Tanker' 0.9157 0.0213 'RoRoCargo' 0.0004 0.0112 'RoRoCargo' 0.0097 0.0902
Other' 0.0002 0.0095 Other' 0.0050 0.0778 Chemical' 0.3635 0.0119 Chemical' 0.9622 0.0104
Reefer' 0.0025 0.0040 Reefer' 0.0973 0.0503 'Passenger' 0.0004 0.0706 'Passenger' 0.0084 0.4386
Gas' 0.1219 0.0001 Gas' 0.8989 0.0004 OBO' 0.0152 0.0045 OBO' 0.6709 0.0652
RoRoPax' 0.0025 0.4681 RoRoPax' 0.0115 0.7086 Offshore' 0.0000 0.0152 Offshore' 0.0013 0.2069 Mobile' 0.0002 0.0012 Mobile' 0.0208 0.0514 Factory' 0.0008 0.0020 Factory' 0.1605 0.1413 Special' 0.0005 0.0070 Special' 0.0501 0.2250
'HeavyLoad' 0.0000 0.0003 'HeavyLoad' 0.0069 0.0164 HSPax' 0.0001 0.0050 HSPax' 0.0244 0.2796

19
'Container' 0.0013 0.0033 'Container' 0.0337 0.0280 Absolute Column Contribution Relative Column Contribution 'C0100' 0.0190 0.0012 'C0100' 0.3349 0.0072 'C0200' 0.0011 0.0781 'C0200' 0.0159 0.3833 'C0300' 0.0076 0.0136 'C0300' 0.1959 0.1160 'C0400' 0.0028 0.0002 'C0400' 0.1558 0.0030 'C0500' 0.0000 0.0031 'C0500' 0.0013 0.0751 'C0600' 0.0001 0.0000 'C0600' 0.0157 0.0000 'C0700' 0.0141 0.1192 'C0700' 0.2146 0.5976 'C0800' 0.0007 0.0039 'C0800' 0.0780 0.1406 'C0900' 0.0011 0.1466 'C0900' 0.0164 0.7407 'C1000' 0.0009 0.0273 'C1000' 0.0458 0.4831 'C1100' 0.0099 0.0012 'C1100' 0.3434 0.0139 'C1200' 0.0182 0.0031 'C1200' 0.2879 0.0160 'C1300' 0.0055 0.0031 'C1300' 0.1797 0.0334 'C1400' 0.0001 0.0090 'C1400' 0.0052 0.1377 'C1500' 0.0423 0.3164 'C1500' 0.2760 0.6820 'C1600' 0.0057 0.0257 'C1600' 0.2056 0.3066 'C1700' 0.0024 0.0292 'C1700' 0.0718 0.2851 'C1800' 0.7437 0.0334 'C1800' 0.9723 0.0144 'C1900' 0.1107 0.0172 'C1900' 0.7992 0.0410 'C2000' 0.0002 0.0597 'C2000' 0.0026 0.2896 'C2100' 0.0000 0.0006 'C2100' 0.0000 0.0388 'C2200' 0.0002 0.0000 'C2200' 0.0922 0.0079 'C2300' 0.0014 0.0056 'C2300' 0.1593 0.2120 'C2500' 0.0122 0.1027 'C2500' 0.2260 0.6280
QLTx = quality rows QLTy = quality columns General' 0.9218 'C0100' 0.3422
Bulk' 0.4631 'C0200' 0.3991 Oil' 0.9501 'C0300' 0.3119
Tanker' 0.9370 'C0400' 0.1588 'RoRoCargo' 0.0999 'C0500' 0.0764
Other' 0.0828 'C0600' 0.0157 Chemical' 0.9726 'C0700' 0.8122
Reefer' 0.1476 'C0800' 0.2187 'Passenger' 0.4470 'C0900' 0.7570
Gas' 0.8993 'C1000' 0.5289 OBO' 0.7362 'C1100' 0.3573
RoRoPax' 0.7201 'C1200' 0.3039 Offshore' 0.2081 'C1300' 0.2131 Mobile' 0.0722 'C1400' 0.1430 Factory' 0.3018 'C1500' 0.9580 Special' 0.2750 'C1600' 0.5122
'HeavyLoad' 0.0233 'C1700' 0.3570 HSPax' 0.3041 'C1800' 0.9867
'Container' 0.0617 'C1900' 0.8402 'C2000' 0.2921 'C2100' 0.0388 'C2200' 0.1001 'C2300' 0.3713 'C2500' 0.8540
20
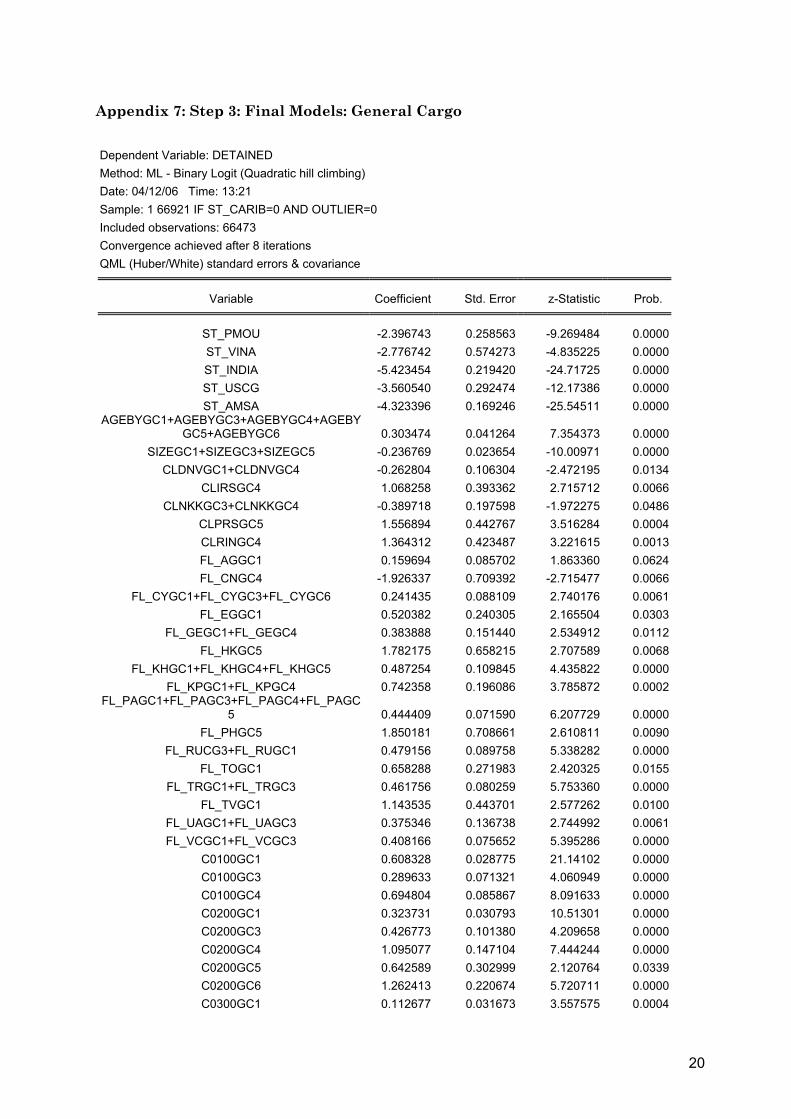
Appendix 7: Step 3: Final Models: General Cargo Dependent Variable: DETAINED Method: ML - Binary Logit (Quadratic hill climbing) Date: 04/12/06 Time: 13:21 Sample: 1 66921 IF ST_CARIB=0 AND OUTLIER=0 Included observations: 66473 Convergence achieved after 8 iterations QML (Huber/White) standard errors & covariance
Variable Coefficient Std. Error z-Statistic Prob.
ST_PMOU -2.396743 0.258563 -9.269484 0.0000ST_VINA -2.776742 0.574273 -4.835225 0.0000ST_INDIA -5.423454 0.219420 -24.71725 0.0000ST_USCG -3.560540 0.292474 -12.17386 0.0000ST_AMSA -4.323396 0.169246 -25.54511 0.0000
AGEBYGC1+AGEBYGC3+AGEBYGC4+AGEBYGC5+AGEBYGC6 0.303474 0.041264 7.354373 0.0000
SIZEGC1+SIZEGC3+SIZEGC5 -0.236769 0.023654 -10.00971 0.0000CLDNVGC1+CLDNVGC4 -0.262804 0.106304 -2.472195 0.0134
CLIRSGC4 1.068258 0.393362 2.715712 0.0066CLNKKGC3+CLNKKGC4 -0.389718 0.197598 -1.972275 0.0486
CLPRSGC5 1.556894 0.442767 3.516284 0.0004CLRINGC4 1.364312 0.423487 3.221615 0.0013FL_AGGC1 0.159694 0.085702 1.863360 0.0624FL_CNGC4 -1.926337 0.709392 -2.715477 0.0066
FL_CYGC1+FL_CYGC3+FL_CYGC6 0.241435 0.088109 2.740176 0.0061FL_EGGC1 0.520382 0.240305 2.165504 0.0303
FL_GEGC1+FL_GEGC4 0.383888 0.151440 2.534912 0.0112FL_HKGC5 1.782175 0.658215 2.707589 0.0068
FL_KHGC1+FL_KHGC4+FL_KHGC5 0.487254 0.109845 4.435822 0.0000FL_KPGC1+FL_KPGC4 0.742358 0.196086 3.785872 0.0002
FL_PAGC1+FL_PAGC3+FL_PAGC4+FL_PAGC5 0.444409 0.071590 6.207729 0.0000
FL_PHGC5 1.850181 0.708661 2.610811 0.0090FL_RUCG3+FL_RUGC1 0.479156 0.089758 5.338282 0.0000
FL_TOGC1 0.658288 0.271983 2.420325 0.0155FL_TRGC1+FL_TRGC3 0.461756 0.080259 5.753360 0.0000
FL_TVGC1 1.143535 0.443701 2.577262 0.0100FL_UAGC1+FL_UAGC3 0.375346 0.136738 2.744992 0.0061FL_VCGC1+FL_VCGC3 0.408166 0.075652 5.395286 0.0000
C0100GC1 0.608328 0.028775 21.14102 0.0000C0100GC3 0.289633 0.071321 4.060949 0.0000C0100GC4 0.694804 0.085867 8.091633 0.0000C0200GC1 0.323731 0.030793 10.51301 0.0000C0200GC3 0.426773 0.101380 4.209658 0.0000C0200GC4 1.095077 0.147104 7.444244 0.0000C0200GC5 0.642589 0.302999 2.120764 0.0339C0200GC6 1.262413 0.220674 5.720711 0.0000C0300GC1 0.112677 0.031673 3.557575 0.0004

21
C0500GC1+C0500GC3+C0500GC4+C0500GC6 -0.134908 0.040555 -3.326539 0.0009C0600GC1 0.273745 0.016976 16.12508 0.0000C0600GC3 0.285547 0.045780 6.237320 0.0000C0600GC4 0.551724 0.080190 6.880177 0.0000C0700GC1 0.286724 0.018553 15.45433 0.0000C0700GC3 0.376301 0.067764 5.553115 0.0000C0700GC4 0.595082 0.083349 7.139609 0.0000C0700GC5 0.532211 0.124600 4.271356 0.0000C0900GC1 0.264649 0.019802 13.36500 0.0000C0900GC4 0.293164 0.083018 3.531341 0.0004C0900GC5 -0.355003 0.122205 -2.904985 0.0037C0900GC6 0.381997 0.074775 5.108619 0.0000
C1000GC1+C1000GC3+C1000GC4+C1000GC5+C1000GC6 0.593258 0.096774 6.130379 0.0000C1100GC1 0.159904 0.059198 2.701185 0.0069C1100GC3 0.957218 0.234715 4.078215 0.0000
C1200GC1+C1200GC4+C1200GC5+C1200GC6 0.260164 0.022788 11.41663 0.0000C1300GC3+C1300GC4 0.445124 0.126868 3.508561 0.0005
C1400GC1+C1400GC3+C1400GC5 0.265603 0.022441 11.83583 0.0000C1500GC1+C1500GC3+C1500GC4 0.229082 0.017127 13.37514 0.0000
C1600GC1 0.388279 0.032125 12.08635 0.0000C1600GC3 0.207432 0.095971 2.161413 0.0307C1600GC4 0.971456 0.204065 4.760533 0.0000C1600GC6 0.476381 0.092952 5.125027 0.0000
C1700GC1+C1700GC4+C1700GC5+C1700GC6 0.528471 0.024906 21.21886 0.0000C2500GC1 0.469264 0.032979 14.22920 0.0000C2500GC3 0.809943 0.172625 4.691917 0.0000C2500GC5 2.245713 0.324175 6.927470 0.0000C2500GC6 1.098274 0.213912 5.134242 0.0000
OWOORGC3 -1.406355 0.529887 -2.654068 0.0080OWIORGC3+OWIORGC5 -1.283822 0.525952 -2.440949 0.0146
OWTMNGC1 -0.253373 0.053410 -4.743950 0.0000OWTMNGC3 -1.601115 0.504540 -3.173413 0.0015OWEMNGC3 -1.308722 0.510937 -2.561418 0.0104OWUNKGC1 0.404380 0.078866 5.127405 0.0000OWUNKGC3 -1.278068 0.550262 -2.322655 0.0202
PS1_BE -1.128189 0.102522 -11.00440 0.0000PS1_HR -0.642173 0.123584 -5.196264 0.0000PS1_DK -0.576984 0.136279 -4.233855 0.0000PS1_FI -0.604053 0.178547 -3.383153 0.0007PS1_FR -0.388013 0.093980 -4.128663 0.0000PS1_DE -0.873199 0.098076 -8.903262 0.0000PS1_GR -1.067856 0.097729 -10.92667 0.0000PS1_IE -0.962211 0.168072 -5.725002 0.0000
PS1_NO -0.340505 0.147174 -2.313621 0.0207PS1_NL -1.305595 0.121707 -10.72735 0.0000PS1_PL -1.319757 0.133728 -9.868933 0.0000PS1_PT -0.633462 0.099375 -6.374443 0.0000PS1_RU -1.677765 0.098799 -16.98167 0.0000PS1_ES -0.575641 0.075580 -7.616356 0.0000PS1_SE -1.364781 0.181103 -7.535948 0.0000

22
PS1_UK -1.325170 0.101397 -13.06907 0.0000PS3_AR -7.784620 1.188260 -6.551276 0.0000PS3_CHI 2.135719 0.208660 10.23540 0.0000PS3_CUB 2.103693 0.216106 9.734561 0.0000PS3_HN 1.585447 0.365438 4.338486 0.0000PS4_IR 0.406926 0.176013 2.311906 0.0208PS4_SD 1.057724 0.346769 3.050222 0.0023
PS5_NORL 0.891379 0.328429 2.714067 0.0066PS6_BRIS -0.650901 0.284299 -2.289497 0.0221PS6_CAIR -1.872774 0.792762 -2.362341 0.0182
PS6_DARW -3.263450 0.720632 -4.528594 0.0000PS6_TOWN -1.197512 0.422817 -2.832225 0.0046
Mean dependent var 0.083944 S.D. dependent var 0.277306S.E. of regression 0.212382 Akaike info criterion 0.323725Sum squared resid 2993.870 Schwarz criterion 0.337285Log likelihood -10660.48 Hannan-Quinn criter. 0.327917Avg. log likelihood -0.160373
Obs with Dep=0 60893 Total obs 66473Obs with Dep=1 5580
Dependent Variable: DETAINED Method: ML - Binary Logit (Quadratic hill climbing) Date: 04/12/06 Time: 13:21 Sample: 1 66921 IF ST_CARIB=0 AND OUTLIER=0 Included observations: 66473 Andrews and Hosmer-Lemeshow Goodness-of-Fit Tests Grouping based upon predicted risk (randomize ties)
Quantile of Risk Dep=0 Dep=1 Total H-L Low High Actual Expect Actual Expect Obs Value
1 5.E-07 0.0049 6642 6625.49 5 21.5071 6647 12.7107 2 0.0049 0.0076 6633 6605.44 14 41.5581 6647 18.3894 3 0.0076 0.0107 6612 6586.71 35 60.2907 6647 10.7060 4 0.0107 0.0147 6598 6564.38 50 83.6197 6648 13.6891 5 0.0147 0.0199 6561 6532.33 86 114.666 6647 7.29239 6 0.0199 0.0275 6536 6491.18 111 155.815 6647 13.1991 7 0.0275 0.0409 6447 6426.30 201 221.702 6648 1.99980 8 0.0409 0.0735 6228 6286.09 419 360.908 6647 9.88740 9 0.0735 0.2029 5673 5845.46 974 801.542 6647 42.1939
10 0.2029 1.0000 2963 2929.61 3685 3718.39 6648 0.68043
Total 60893 60893.0 5580 5580.00 66473 130.748
H-L Statistic: 130.7482 Prob. Chi-Sq(8) 0.0000 Andrews Statistic: 361.0461 Prob. Chi-Sq(10) 0.0000

23
Dependent Variable: DETAINED Method: ML - Binary Logit (Quadratic hill climbing) Date: 04/12/06 Time: 13:21 Sample: 1 66921 IF ST_CARIB=0 AND OUTLIER=0 Included observations: 66473 Prediction Evaluation (success cutoff C = 0.0842)
Estimated Equation Constant Probability Dep=0 Dep=1 Total Dep=0 Dep=1 Total
P(Dep=1)<=C 53334 990 54324 60893 5580 66473P(Dep=1)>C 7559 4590 12149 0 0 0
Total 60893 5580 66473 60893 5580 66473Correct 53334 4590 57924 60893 0 60893
% Correct 87.59 82.26 87.14 100.00 0.00 91.61% Incorrect 12.41 17.74 12.86 0.00 100.00 8.39Total Gain* -12.41 82.26 -4.47
Percent Gain** NA 82.26 -53.21

24
Appendix 8: Step 3: Final Models: Dry Bulk Dependent Variable: DETAINED Method: ML - Binary Logit (Quadratic hill climbing) Date: 04/13/06 Time: 10:41 Sample: 1 48103 IF ST_DB2=0 AND OUTLIER=0 Included observations: 47777 Convergence achieved after 11 iterations QML (Huber/White) standard errors & covariance
Variable Coefficient Std. Error z-Statistic Prob.
ST_DB1 -4.863602 0.460705 -10.55687 0.0000ST_DB3 -10.25991 0.951265 -10.78554 0.0000ST_DB4 -4.915276 0.494817 -9.933529 0.0000ST_DB5 -9.713906 0.773077 -12.56526 0.0000ST_DB6 -4.846630 0.467823 -10.35997 0.0000
AGEBYDB1+AGEBYDB3+AGEBYDB4+AGEBYDB5+AGEBYDB6 0.605733 0.064172 9.439227 0.0000
SIZEDB1+SIZEDB3+SIZEDB4+SIZEDB5+SIZEDB6 -0.098601 0.039425 -2.501013 0.0124
CLCRRDB5 1.273347 0.525719 2.422106 0.0154CLLRDB5 -0.964077 0.333624 -2.889710 0.0039FL_BBDB5 -4.043765 0.831707 -4.862006 0.0000FL_BRDB3 -2.921903 1.185654 -2.464380 0.0137FL_BRDB5 1.823917 0.663879 2.747363 0.0060FL_CYDB6 0.528363 0.174202 3.033043 0.0024FL_GEDB1 1.231493 0.520730 2.364934 0.0180FL_HKDB4 -2.071076 0.719395 -2.878915 0.0040FL_KHDB1 1.236079 0.343956 3.593712 0.0003FL_MTDB6 0.474747 0.208260 2.279593 0.0226FL_MYDB3 1.692650 0.658565 2.570209 0.0102FL_PHDB3 1.165037 0.506899 2.298360 0.0215FL_PLDB3 1.786038 0.611841 2.919119 0.0035
FL_TRDB1+FL_TRDB3+FL_TRDB4+FL_TRDB5+FL_TRDB6 0.272667 0.121374 2.246500 0.0247
C0100DB1+C0100DB3+C0100DB4+C0100DB5 0.492153 0.055502 8.867353 0.0000C0200DB1 0.166678 0.069387 2.402165 0.0163C0200DB3 0.437528 0.149470 2.927196 0.0034C0200DB5 2.269534 0.292007 7.772186 0.0000C0200DB6 0.943160 0.143645 6.565890 0.0000
C0300DB4+C0300DB5 0.414519 0.121660 3.407189 0.0007C0400DB6 -0.484642 0.169869 -2.853030 0.0043C0600DB1 0.272873 0.027685 9.856377 0.0000C0600DB3 0.235242 0.073153 3.215756 0.0013C0600DB4 0.376844 0.089535 4.208904 0.0000C0600DB5 0.768639 0.131290 5.854525 0.0000C0600DB6 0.101006 0.040829 2.473895 0.0134C0700DB1 0.241506 0.028153 8.578302 0.0000C0700DB3 0.267494 0.085915 3.113475 0.0018C0700DB4 0.737742 0.115981 6.360903 0.0000C0700DB5 0.726521 0.174089 4.173261 0.0000

25
C0700DB6 0.368198 0.040618 9.064800 0.0000C0800DB4 -0.759015 0.228804 -3.317317 0.0009
C0900DB1+C0900DB3+C0900DB4+C0900DB5 0.211114 0.027856 7.578800 0.0000C1100DB3 0.750629 0.322034 2.330904 0.0198
C1200DB1+C1200DB6 0.188567 0.030245 6.234700 0.0000C1400DB1+C1400DB3+C1400DB4+C1400DB6 0.232820 0.030053 7.746960 0.0000
C1500DB1+C1500DB4 0.168953 0.037561 4.498104 0.0000C1600DB1 0.201671 0.061314 3.289140 0.0010C1600DB3 0.566916 0.202119 2.804860 0.0050C1600DB4 1.058992 0.248197 4.266733 0.0000C1600DB6 0.450457 0.062530 7.203794 0.0000C1700DB1 0.524241 0.043123 12.15684 0.0000C1700DB3 0.834377 0.123995 6.729146 0.0000C1700DB4 0.893838 0.164103 5.446821 0.0000C1700DB5 0.655515 0.147198 4.453278 0.0000C1700DB6 0.724802 0.082148 8.823176 0.0000C1800DB5 2.666533 0.845398 3.154175 0.0016C2000DB5 2.289860 0.294759 7.768588 0.0000C2300DB1 0.299613 0.123344 2.429076 0.0151C2500DB1 0.599240 0.045846 13.07077 0.0000C2500DB3 0.552931 0.159583 3.464858 0.0005C2500DB5 2.256296 0.401158 5.624456 0.0000C2500DB6 1.058245 0.083928 12.60896 0.0000C2600DB1 0.506175 0.126805 3.991748 0.0001C9900DB5 1.135346 0.424252 2.676111 0.0074
OWUNKDB4 -1.256157 0.606619 -2.070750 0.0384PS1_BE -0.909947 0.162677 -5.593574 0.0000PS1_GR -1.787809 0.433777 -4.121497 0.0000PS1_IE -1.164652 0.470797 -2.473785 0.0134PS1_NL -0.995044 0.175002 -5.685912 0.0000PS1_RU -1.154220 0.184050 -6.271239 0.0000PS3_BR 3.512539 0.762958 4.603845 0.0000PS3_CHI 5.940680 0.813183 7.305467 0.0000PS3_COL 3.718919 0.928646 4.004668 0.0001PS3_CUB 5.492208 0.837512 6.557769 0.0000PS3_HN 5.199727 0.938440 5.540819 0.0000
PS5_BATR 3.158521 0.997264 3.167188 0.0015PS5_BROW 3.793653 1.198999 3.164016 0.0016PS5_CHAR 5.154124 0.690391 7.465518 0.0000PS5_CORP 4.294424 0.802039 5.354382 0.0000PS5_DULU 4.082264 0.930248 4.388360 0.0000PS5_HAMP 3.947380 0.675171 5.846485 0.0000PS5_HONO 3.711200 1.344611 2.760055 0.0058PS5_HOUS 3.933235 0.741468 5.304662 0.0000PS5_JACK 6.196477 0.750042 8.261508 0.0000PS5_LANG 4.192381 0.727509 5.762648 0.0000PS5_MOBI 4.007495 0.735921 5.445551 0.0000PS5_NORL 4.545155 0.649973 6.992837 0.0000PS5_POAR 3.910559 1.215048 3.218439 0.0013PS5_POCA 2.895390 0.895584 3.232962 0.0012PS5_POLA 4.544957 0.904334 5.025754 0.0000

26
PS5_PROV 5.430488 0.849466 6.392822 0.0000PS5_PUGE 3.702121 1.171584 3.159928 0.0016PS5_SANF 3.534287 0.828315 4.266842 0.0000PS5_SANJ 4.000131 0.799937 5.000556 0.0000PS5_SAVA 4.173261 0.782037 5.336395 0.0000PS5_WILM 4.029798 0.985652 4.088461 0.0000PS5_USVI 4.037977 1.060904 3.806167 0.0001
PS6_NEWC 0.512666 0.131240 3.906340 0.0001
Mean dependent var 0.046173 S.D. dependent var 0.209861S.E. of regression 0.167850 Akaike info criterion 0.213693Sum squared resid 1343.345 Schwarz criterion 0.231324Log likelihood -5008.805 Hannan-Quinn criter. 0.219227Avg. log likelihood -0.104837
Obs with Dep=0 45571 Total obs 47777Obs with Dep=1 2206
Dependent Variable: DETAINED Method: ML - Binary Logit (Quadratic hill climbing) Date: 04/13/06 Time: 10:41 Sample: 1 48103 IF ST_DB2=0 AND OUTLIER=0 Included observations: 47777 Andrews and Hosmer-Lemeshow Goodness-of-Fit Tests Grouping based upon predicted risk (randomize ties)
Quantile of Risk Dep=0 Dep=1 Total H-L Low High Actual Expect Actual Expect Obs Value
1 9.E-07 0.0001 4777 4776.67 0 0.33305 4777 0.33307 2 0.0001 0.0022 4775 4773.10 3 4.90243 4778 0.73902 3 0.0022 0.0042 4768 4762.62 10 15.3793 4778 1.88762 4 0.0042 0.0069 4760 4750.34 17 26.6646 4777 3.52259 5 0.0069 0.0101 4755 4737.89 23 40.1120 4778 7.36186 6 0.0101 0.0151 4742 4718.69 36 59.3077 4778 9.27496 7 0.0151 0.0208 4742 4692.63 35 84.3714 4777 29.4100 8 0.0208 0.0342 4646 4651.99 132 126.009 4778 0.29259 9 0.0342 0.0845 4473 4526.99 305 251.008 4778 12.2576
10 0.0845 1.0000 3133 3180.09 1645 1597.91 4778 2.08477
Total 45571 45571.0 2206 2206.00 47777 67.1641
H-L Statistic: 67.1641 Prob. Chi-Sq(8) 0.0000 Andrews Statistic: 4190.678 Prob. Chi-Sq(10) 0.0000
27
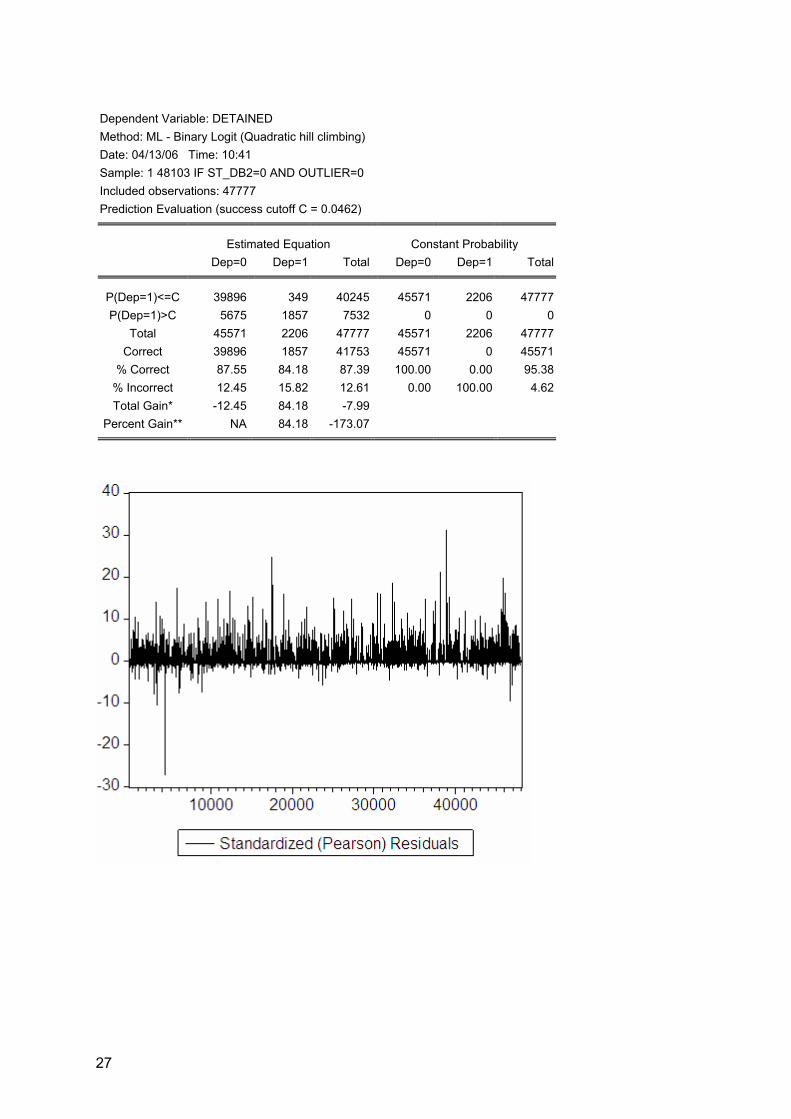
Dependent Variable: DETAINED Method: ML - Binary Logit (Quadratic hill climbing) Date: 04/13/06 Time: 10:41 Sample: 1 48103 IF ST_DB2=0 AND OUTLIER=0 Included observations: 47777 Prediction Evaluation (success cutoff C = 0.0462)
Estimated Equation Constant Probability Dep=0 Dep=1 Total Dep=0 Dep=1 Total
P(Dep=1)<=C 39896 349 40245 45571 2206 47777P(Dep=1)>C 5675 1857 7532 0 0 0
Total 45571 2206 47777 45571 2206 47777Correct 39896 1857 41753 45571 0 45571
% Correct 87.55 84.18 87.39 100.00 0.00 95.38% Incorrect 12.45 15.82 12.61 0.00 100.00 4.62Total Gain* -12.45 84.18 -7.99
Percent Gain** NA 84.18 -173.07
28
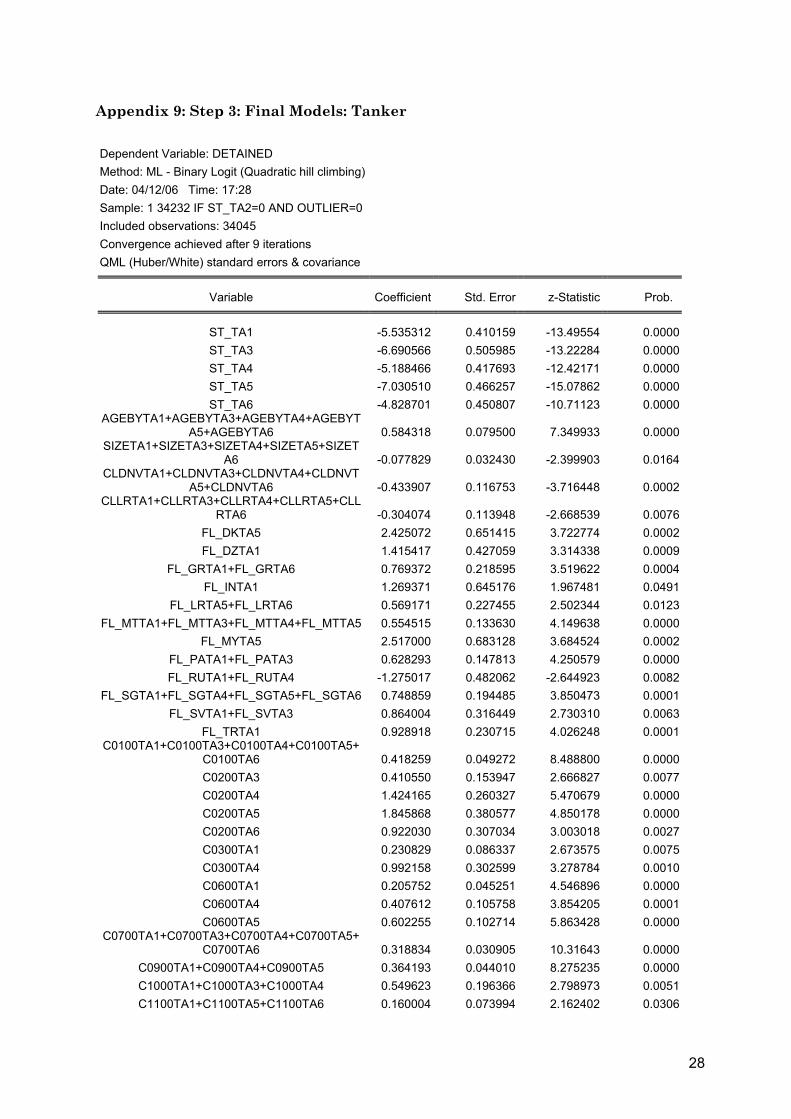
Appendix 9: Step 3: Final Models: Tanker Dependent Variable: DETAINED Method: ML - Binary Logit (Quadratic hill climbing) Date: 04/12/06 Time: 17:28 Sample: 1 34232 IF ST_TA2=0 AND OUTLIER=0 Included observations: 34045 Convergence achieved after 9 iterations QML (Huber/White) standard errors & covariance
Variable Coefficient Std. Error z-Statistic Prob.
ST_TA1 -5.535312 0.410159 -13.49554 0.0000ST_TA3 -6.690566 0.505985 -13.22284 0.0000ST_TA4 -5.188466 0.417693 -12.42171 0.0000ST_TA5 -7.030510 0.466257 -15.07862 0.0000ST_TA6 -4.828701 0.450807 -10.71123 0.0000
AGEBYTA1+AGEBYTA3+AGEBYTA4+AGEBYTA5+AGEBYTA6 0.584318 0.079500 7.349933 0.0000
SIZETA1+SIZETA3+SIZETA4+SIZETA5+SIZETA6 -0.077829 0.032430 -2.399903 0.0164
CLDNVTA1+CLDNVTA3+CLDNVTA4+CLDNVTA5+CLDNVTA6 -0.433907 0.116753 -3.716448 0.0002
CLLRTA1+CLLRTA3+CLLRTA4+CLLRTA5+CLLRTA6 -0.304074 0.113948 -2.668539 0.0076
FL_DKTA5 2.425072 0.651415 3.722774 0.0002FL_DZTA1 1.415417 0.427059 3.314338 0.0009
FL_GRTA1+FL_GRTA6 0.769372 0.218595 3.519622 0.0004FL_INTA1 1.269371 0.645176 1.967481 0.0491
FL_LRTA5+FL_LRTA6 0.569171 0.227455 2.502344 0.0123FL_MTTA1+FL_MTTA3+FL_MTTA4+FL_MTTA5 0.554515 0.133630 4.149638 0.0000
FL_MYTA5 2.517000 0.683128 3.684524 0.0002FL_PATA1+FL_PATA3 0.628293 0.147813 4.250579 0.0000FL_RUTA1+FL_RUTA4 -1.275017 0.482062 -2.644923 0.0082
FL_SGTA1+FL_SGTA4+FL_SGTA5+FL_SGTA6 0.748859 0.194485 3.850473 0.0001FL_SVTA1+FL_SVTA3 0.864004 0.316449 2.730310 0.0063
FL_TRTA1 0.928918 0.230715 4.026248 0.0001C0100TA1+C0100TA3+C0100TA4+C0100TA5+
C0100TA6 0.418259 0.049272 8.488800 0.0000C0200TA3 0.410550 0.153947 2.666827 0.0077C0200TA4 1.424165 0.260327 5.470679 0.0000C0200TA5 1.845868 0.380577 4.850178 0.0000C0200TA6 0.922030 0.307034 3.003018 0.0027C0300TA1 0.230829 0.086337 2.673575 0.0075C0300TA4 0.992158 0.302599 3.278784 0.0010C0600TA1 0.205752 0.045251 4.546896 0.0000C0600TA4 0.407612 0.105758 3.854205 0.0001C0600TA5 0.602255 0.102714 5.863428 0.0000
C0700TA1+C0700TA3+C0700TA4+C0700TA5+C0700TA6 0.318834 0.030905 10.31643 0.0000
C0900TA1+C0900TA4+C0900TA5 0.364193 0.044010 8.275235 0.0000C1000TA1+C1000TA3+C1000TA4 0.549623 0.196366 2.798973 0.0051C1100TA1+C1100TA5+C1100TA6 0.160004 0.073994 2.162402 0.0306

29
C1200TA1+C1200TA3+C1200TA4+C1200TA5+C1200TA6 0.196855 0.055233 3.564102 0.0004C1300TA1 0.504547 0.130558 3.864534 0.0001C1300TA3 0.543656 0.194147 2.800232 0.0051
C1400TA1+C1400TA3+C1400TA4+C1400TA5+C1400TA6 0.140424 0.030735 4.568870 0.0000
C1500TA1+C1500TA3+C1500TA4+C1500TA5+C1500TA6 0.168793 0.053770 3.139189 0.0017C1600TA3 -0.457937 0.171973 -2.662841 0.0077C1600TA4 1.123342 0.419671 2.676719 0.0074C1600TA6 0.595624 0.156004 3.818017 0.0001C1700TA1 0.620208 0.070545 8.791703 0.0000C1700TA3 0.300404 0.108723 2.763027 0.0057C1700TA4 1.258187 0.196260 6.410826 0.0000
C1800TA5+C1800TA6 0.795913 0.257512 3.090783 0.0020C2000TA5 1.856354 0.531754 3.491004 0.0005C2300TA1 -0.875584 0.301646 -2.902689 0.0037C2300TA6 0.963999 0.444912 2.166718 0.0303
C2500TA1+C2500TA5+C2500TA6 0.958027 0.073315 13.06732 0.0000PS1_BE -0.973391 0.314221 -3.097789 0.0019PS1_NL -0.457643 0.189581 -2.413973 0.0158PS1_RU -0.846889 0.324301 -2.611427 0.0090PS1_IT 0.802182 0.135479 5.921062 0.0000
PS1_NO 0.908834 0.298974 3.039843 0.0024PS3_CHI 2.319149 0.406718 5.702112 0.0000PS3_CUB 2.201791 0.344635 6.388761 0.0000
PS5_LANG 1.304536 0.537759 2.425874 0.0153PS5_POLA 2.179698 0.657943 3.312899 0.0009PS5_SANF 1.577417 0.438778 3.595022 0.0003PS5_SANJ 1.329240 0.473945 2.804628 0.0050PS5_SAVA 1.638115 0.524612 3.122529 0.0018PS5_USVI 1.301552 0.529656 2.457354 0.0140
Mean dependent var 0.031135 S.D. dependent var 0.173686S.E. of regression 0.140591 Akaike info criterion 0.154295Sum squared resid 671.6644 Schwarz criterion 0.170152Log likelihood -2562.481 Hannan-Quinn criter. 0.159352Avg. log likelihood -0.075267
Obs with Dep=0 32985 Total obs 34045Obs with Dep=1 1060

30
Dependent Variable: DETAINED Method: ML - Binary Logit (Quadratic hill climbing) Date: 04/12/06 Time: 17:28 Sample: 1 34232 IF ST_TA2=0 AND OUTLIER=0 Included observations: 34045 Andrews and Hosmer-Lemeshow Goodness-of-Fit Tests Grouping based upon predicted risk (randomize ties)
Quantile of Risk Dep=0 Dep=1 Total H-L Low High Actual Expect Actual Expect Obs Value
1 0.0002 0.0011 3404 3401.53 0 2.47066 3404 2.47245 2 0.0011 0.0017 3403 3400.11 2 4.88934 3405 1.70990 3 0.0017 0.0025 3404 3396.80 0 7.20099 3404 7.21626 4 0.0025 0.0036 3401 3394.69 4 10.3067 3405 3.87082 5 0.0036 0.0054 3395 3388.99 9 15.0106 3404 2.41746 6 0.0054 0.0080 3397 3382.62 8 22.3764 3405 9.29764 7 0.0080 0.0121 3373 3370.38 31 33.6224 3404 0.20658 8 0.0121 0.0196 3359 3352.87 46 52.1292 3405 0.73186 9 0.0196 0.0450 3298 3304.82 106 99.1808 3404 0.48293
10 0.0450 1.0000 2551 2592.19 854 812.813 3405 2.74147
Total 32985 32985.0 1060 1060.00 34045 31.1474
H-L Statistic: 31.1474 Prob. Chi-Sq(8) 0.0001 Andrews Statistic: 6562.7804 Prob. Chi-Sq(10) 0.0000
Dependent Variable: DETAINED Method: ML - Binary Logit (Quadratic hill climbing) Date: 04/12/06 Time: 17:28 Sample: 1 34232 IF ST_TA2=0 AND OUTLIER=0 Included observations: 34045 Prediction Evaluation (success cutoff C = 0.0312)
Estimated Equation Constant Probability Dep=0 Dep=1 Total Dep=0 Dep=1 Total
P(Dep=1)<=C 29293 142 29435 32985 1060 34045P(Dep=1)>C 3692 918 4610 0 0 0
Total 32985 1060 34045 32985 1060 34045Correct 29293 918 30211 32985 0 32985
% Correct 88.81 86.60 88.74 100.00 0.00 96.89% Incorrect 11.19 13.40 11.26 0.00 100.00 3.11Total Gain* -11.19 86.60 -8.15
Percent Gain** NA 86.60 -261.70

31

32
Appendix 10: Step 3: Final Models: Container Dependent Variable: DETAINED Method: ML - Binary Logit (Quadratic hill climbing) Date: 04/12/06 Time: 13:52 Sample: 1 18273 IF ST_CO2=0 AND OUTLIER=0 Included observations: 18211 Convergence achieved after 9 iterations QML (Huber/White) standard errors & covariance
Variable Coefficient Std. Error z-Statistic Prob.
ST_CO1 -3.314751 0.777403 -4.263877 0.0000ST_CO3 -4.604093 0.812864 -5.664041 0.0000ST_CO4 -4.003957 0.760576 -5.264378 0.0000ST_CO5 -7.255512 0.944948 -7.678210 0.0000ST_CO6 -3.855125 0.867522 -4.443838 0.0000
AGEBYCO1+AGEBYCO3+AGEBYCO4+AGEBYCO5+AGEBYCO6 0.399090 0.100698 3.963224 0.0001
SIZECO1+SIZECO3+SIZECO4+SIZECO5+SIZECO6 -0.234550 0.075783 -3.095044 0.0020
CLDNVCO5 1.624808 0.604100 2.689635 0.0072CLGLCO5 1.168670 0.544606 2.145900 0.0319
CLKRSCO1 1.518730 0.577507 2.629802 0.0085CLLRCO3 -3.746199 1.447404 -2.588219 0.0096
CLNKKCO5 1.608657 0.633728 2.538402 0.0111FL_AECO1 1.834057 0.601684 3.048205 0.0023
FL_GRCO1+FL_GRCO5 0.864207 0.403136 2.143710 0.0321FL_PACO6 0.751744 0.334081 2.250185 0.0244FL_SVCO5 3.110014 0.639569 4.862670 0.0000
C0100CO1+C0100CO3+C0100CO4+C0100CO5+C0100CO6 0.430801 0.080231 5.369531 0.0000C0200CO3 0.779165 0.192860 4.040057 0.0001C0200CO4 2.088648 0.466835 4.474056 0.0000C0200CO5 2.026444 0.369552 5.483518 0.0000C0200CO6 1.280295 0.285648 4.482076 0.0000C0300CO6 -2.040599 0.894815 -2.280470 0.0226
C0400CO1+C0400CO6 0.419840 0.143674 2.922170 0.0035C0600CO1+C0600CO3+C0600CO4+C0600CO5
+C0600CO6 0.341900 0.056925 6.006123 0.0000C0700CO4 0.556971 0.210317 2.648239 0.0081C0700CO5 1.074654 0.191472 5.612597 0.0000C0700CO6 0.513815 0.127318 4.035685 0.0001C0900CO1 0.316889 0.074006 4.281924 0.0000C0900CO3 0.607121 0.120382 5.043295 0.0000C0900CO4 0.992812 0.252719 3.928523 0.0001C0900CO6 0.682726 0.212296 3.215912 0.0013
C1200CO1+C1200CO3+C1200CO4+C1200CO5+C1200CO6 0.527114 0.080427 6.553939 0.0000
C1400CO1+C1400CO3+C1400CO5 0.496323 0.063345 7.835286 0.0000C1600CO1+C1600CO3+C1600CO5+C1600CO6 0.706465 0.120606 5.857616 0.0000C1700CO1+C1700CO4+C1700CO5+C1700CO6 0.755629 0.092480 8.170691 0.0000
C2100CO1+C2100CO3 1.226981 0.340824 3.600047 0.0003

33
C2500CO1 1.062322 0.123474 8.603605 0.0000C2500CO5 0.822388 0.289862 2.837167 0.0046C2500CO6 2.899858 0.416603 6.960726 0.0000
OWOORCO1+OWOORCO5 1.855869 0.375055 4.948251 0.0000PS1_BE -2.284398 0.572662 -3.989083 0.0001PS1_DE -0.644273 0.309791 -2.079700 0.0376PS1_ES -0.861510 0.402300 -2.141462 0.0322PS1_NL -1.226030 0.459249 -2.669642 0.0076PS1_PL -5.910341 1.765251 -3.348159 0.0008PS1_PT -1.014073 0.380828 -2.662811 0.0077PS1_UK -2.009466 0.501136 -4.009824 0.0001PS3_CHI 1.640829 0.390182 4.205294 0.0000
PS5_CHAR 3.307899 0.622088 5.317414 0.0000PS5_HOUS 1.991272 0.840023 2.370498 0.0178PS5_JACK 2.503537 0.766680 3.265426 0.0011PS5_LANG 2.132072 0.585276 3.642846 0.0003PS5_PUGE 1.873799 0.730002 2.566843 0.0103PS5_SANJ 2.271206 0.586286 3.873891 0.0001PS5_SAVA 1.818636 0.718386 2.531560 0.0114PS6_MELB 1.095316 0.422420 2.592956 0.0095PS6_SYDN 1.408712 0.615070 2.290329 0.0220PS6_POBO 1.018581 0.349593 2.913617 0.0036
Mean dependent var 0.023392 S.D. dependent var 0.151151S.E. of regression 0.122979 Akaike info criterion 0.123128Sum squared resid 274.5452 Schwarz criterion 0.148001Log likelihood -1063.139 Hannan-Quinn criter. 0.131303Avg. log likelihood -0.058379
Obs with Dep=0 17785 Total obs 18211Obs with Dep=1 426

34
Dependent Variable: DETAINED Method: ML - Binary Logit (Quadratic hill climbing) Date: 04/12/06 Time: 13:52 Sample: 1 18273 IF ST_CO2=0 AND OUTLIER=0 Included observations: 18211 Andrews and Hosmer-Lemeshow Goodness-of-Fit Tests Grouping based upon predicted risk (randomize ties)
Quantile of Risk Dep=0 Dep=1 Total H-L Low High Actual Expect Actual Expect Obs Value
1 1.E-05 0.0004 1821 1820.60 0 0.39931 1821 0.39939 2 0.0004 0.0009 1821 1819.79 0 1.21397 1821 1.21478 3 0.0009 0.0016 1821 1818.73 0 2.27098 1821 2.27382 4 0.0016 0.0025 1821 1817.18 0 3.81798 1821 3.82600 5 0.0025 0.0037 1819 1815.46 2 5.54358 1821 2.27205 6 0.0037 0.0056 1816 1812.75 5 8.24782 1821 1.28474 7 0.0056 0.0082 1812 1808.57 9 12.4298 1821 0.95289 8 0.0082 0.0125 1810 1802.45 11 18.5480 1821 3.10322 9 0.0125 0.0278 1782 1788.05 39 32.9458 1821 1.13303
10 0.0278 1.0000 1462 1481.42 360 340.583 1822 1.36151
Total 17785 17785.0 426 426.000 18211 17.8214
H-L Statistic: 17.8214 Prob. Chi-Sq(8) 0.0226 Andrews Statistic: 6807.503 Prob. Chi-Sq(10) 0.0000
Dependent Variable: DETAINED Method: ML - Binary Logit (Quadratic hill climbing) Date: 04/12/06 Time: 13:52 Sample: 1 18273 IF ST_CO2=0 AND OUTLIER=0 Included observations: 18211 Prediction Evaluation (success cutoff C = 0.024)
Estimated Equation Constant Probability Dep=0 Dep=1 Total Dep=0 Dep=1 Total
P(Dep=1)<=C 16094 60 16154 17785 426 18211P(Dep=1)>C 1691 366 2057 0 0 0
Total 17785 426 18211 17785 426 18211Correct 16094 366 16460 17785 0 17785
% Correct 90.49 85.92 90.38 100.00 0.00 97.66% Incorrect 9.51 14.08 9.62 0.00 100.00 2.34Total Gain* -9.51 85.92 -7.28
Percent Gain** NA 85.92 -311.03

35

36
Appendix 11: Step 1: Results of Regressions: Passenger Vessels Dependent Variable: DETAINED Method: ML - Binary Logit (Quadratic hill climbing) Date: 04/12/06 Time: 10:52 Sample: 1 6118 Included observations: 6118 Convergence achieved after 9 iterations QML (Huber/White) standard errors & covariance
Variable Coefficient Std. Error z-Statistic Prob.
ST_PA1 -3.890047 0.722440 -5.384597 0.0000ST_PA3 -4.017614 0.932956 -4.306328 0.0000ST_PA4 -2.581474 0.897105 -2.877560 0.0040ST_PA5 -5.140974 0.705674 -7.285198 0.0000ST_PA6 -3.070255 0.922434 -3.328429 0.0009LNAGE 0.379143 0.130987 2.894505 0.0038LNSIZE -0.266163 0.058338 -4.562441 0.0000CL_IBS 2.528660 0.642884 3.933308 0.0001FL_UA 1.333388 0.522104 2.553873 0.0107C0100S 0.381253 0.104339 3.653982 0.0003C0200S 0.520087 0.119328 4.358477 0.0000C0600S 0.180514 0.053974 3.344458 0.0008C0700S 0.143179 0.040379 3.545888 0.0004C0800S 0.424934 0.154150 2.756634 0.0058C0900S 0.131048 0.041988 3.121065 0.0018C1700S 0.522460 0.106176 4.920714 0.0000C2500S 0.341149 0.116281 2.933830 0.0033PS1_DK 1.312464 0.483531 2.714330 0.0066PS1_DE 1.136637 0.421763 2.694966 0.0070PS1_GR 1.812856 0.371036 4.885927 0.0000PS1_IT 1.466290 0.270606 5.418549 0.0000
PS1_NO 2.022123 0.568614 3.556233 0.0004PS1_ES 1.437482 0.408665 3.517503 0.0004
PS5_CORP 2.995867 0.871895 3.436041 0.0006PS5_JACK 2.927490 0.722331 4.052836 0.0001PS5_PORM 3.029211 0.886602 3.416651 0.0006
Mean dependent var 0.034488 S.D. dependent var 0.182495S.E. of regression 0.150989 Akaike info criterion 0.184638Sum squared resid 138.8830 Schwarz criterion 0.213192Log likelihood -538.8064 Hannan-Quinn criter. 0.194544Avg. log likelihood -0.088069
Obs with Dep=0 5907 Total obs 6118Obs with Dep=1 211

37
Dependent Variable: DETAINED Method: ML - Binary Logit (Quadratic hill climbing) Date: 04/12/06 Time: 10:52 Sample: 1 6118 Included observations: 6118 Andrews and Hosmer-Lemeshow Goodness-of-Fit Tests Grouping based upon predicted risk (randomize ties)
Quantile of Risk Dep=0 Dep=1 Total H-L Low High Actual Expect Actual Expect Obs Value
1 0.0003 0.0007 611 610.704 0 0.29585 611 0.29599 2 0.0007 0.0010 611 611.493 1 0.50651 612 0.48122 3 0.0010 0.0019 612 611.111 0 0.88919 612 0.89048 4 0.0019 0.0040 609 610.206 3 1.79449 612 0.81222 5 0.0040 0.0063 609 608.845 3 3.15517 612 0.00767 6 0.0063 0.0098 610 606.184 1 4.81648 611 3.04813 7 0.0098 0.0167 605 604.079 7 7.92130 612 0.10856 8 0.0167 0.0307 602 598.008 10 13.9915 612 1.16535 9 0.0307 0.0624 582 585.651 30 26.3486 612 0.52877
10 0.0625 1.0000 456 460.719 156 151.281 612 0.19555
Total 5907 5907.00 211 211.000 6118 7.53394
H-L Statistic: 7.5339 Prob. Chi-Sq(8) 0.4803 Andrews Statistic: 1194.704 Prob. Chi-Sq(10) 0.0000
Dependent Variable: DETAINED Method: ML - Binary Logit (Quadratic hill climbing) Date: 04/12/06 Time: 10:52 Sample: 1 6118 Included observations: 6118 Prediction Evaluation (success cutoff C = 0.0345)
Estimated Equation Constant Probability Dep=0 Dep=1 Total Dep=0 Dep=1 Total
P(Dep=1)<=C 4994 28 5022 5907 211 6118P(Dep=1)>C 913 183 1096 0 0 0
Total 5907 211 6118 5907 211 6118Correct 4994 183 5177 5907 0 5907
% Correct 84.54 86.73 84.62 100.00 0.00 96.55% Incorrect 15.46 13.27 15.38 0.00 100.00 3.45Total Gain* -15.46 86.73 -11.93
Percent Gain** NA 86.73 -345.97

38

39
Appendix 12: Step 1: Results of Regressions: Other Ship Types
Dependent Variable: DETAINED Method: ML - Binary Logit (Quadratic hill climbing) Date: 04/12/06 Time: 11:11 Sample: 1 10077 IF OUTLIER=0 Included observations: 10073 Convergence achieved after 8 iterations QML (Huber/White) standard errors & covariance
Variable Coefficient Std. Error z-Statistic Prob.
ST_OT1 -6.883984 0.422584 -16.29022 0.0000ST_OT3 -8.466110 0.593436 -14.26626 0.0000ST_OT4 -4.405082 0.465133 -9.470582 0.0000ST_OT5 -7.184651 0.392313 -18.31356 0.0000ST_OT6 -6.395696 0.550852 -11.61056 0.0000LNAGE 0.609421 0.124318 4.902099 0.0000CL_GL -0.765959 0.365430 -2.096048 0.0361
CL_NCL 1.231356 0.236801 5.199963 0.0000FL_AG 1.177324 0.374456 3.144092 0.0017FL_CY 0.684888 0.306411 2.235189 0.0254FL_VC 0.940171 0.244227 3.849573 0.0001FL_UA 1.709392 0.445812 3.834337 0.0001C0100S 0.536713 0.073369 7.315290 0.0000C0200S 0.748906 0.119644 6.259473 0.0000C0400S 0.465803 0.234115 1.989633 0.0466C0600S 0.189598 0.053331 3.555099 0.0004C0700S 0.469129 0.074097 6.331291 0.0000C1100S 0.461109 0.139448 3.306664 0.0009C1400S 0.418814 0.058910 7.109414 0.0000C1700S 0.427365 0.078831 5.421298 0.0000C2500S 0.752588 0.131418 5.726669 0.0000PS1_IT 1.739326 0.350807 4.958067 0.0000
PS3_CHI 2.947174 0.572770 5.145474 0.0000PS3_MX 3.194675 0.842992 3.789684 0.0002PS3_PA 3.503819 0.656842 5.334341 0.0000
PS5_HOUS 0.905284 0.349862 2.587546 0.0097PS5_JACK 2.065930 0.326899 6.319788 0.0000PS5_MOBI 0.837545 0.344516 2.431076 0.0151PS5_PHIL 1.189509 0.397842 2.989907 0.0028PS5_SANF 1.230329 0.430642 2.856968 0.0043PS5_WILM 1.546897 0.581667 2.659419 0.0078PS5_OTH 1.290303 0.374795 3.442691 0.0006
Mean dependent var 0.037129 S.D. dependent var 0.189087S.E. of regression 0.156133 Akaike info criterion 0.190012Sum squared resid 244.7751 Schwarz criterion 0.212941Log likelihood -924.9935 Hannan-Quinn criter. 0.197770Avg. log likelihood -0.091829
40
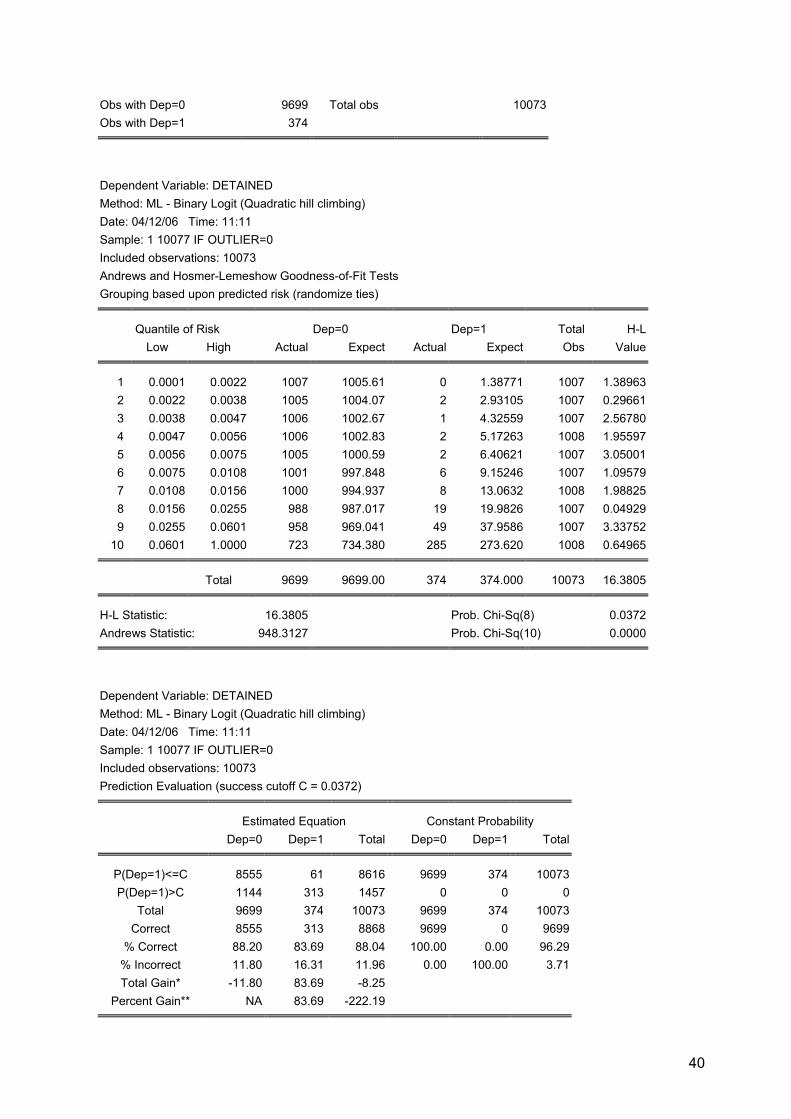
Obs with Dep=0 9699 Total obs 10073Obs with Dep=1 374
Dependent Variable: DETAINED Method: ML - Binary Logit (Quadratic hill climbing) Date: 04/12/06 Time: 11:11 Sample: 1 10077 IF OUTLIER=0 Included observations: 10073 Andrews and Hosmer-Lemeshow Goodness-of-Fit Tests Grouping based upon predicted risk (randomize ties)
Quantile of Risk Dep=0 Dep=1 Total H-L Low High Actual Expect Actual Expect Obs Value
1 0.0001 0.0022 1007 1005.61 0 1.38771 1007 1.38963 2 0.0022 0.0038 1005 1004.07 2 2.93105 1007 0.29661 3 0.0038 0.0047 1006 1002.67 1 4.32559 1007 2.56780 4 0.0047 0.0056 1006 1002.83 2 5.17263 1008 1.95597 5 0.0056 0.0075 1005 1000.59 2 6.40621 1007 3.05001 6 0.0075 0.0108 1001 997.848 6 9.15246 1007 1.09579 7 0.0108 0.0156 1000 994.937 8 13.0632 1008 1.98825 8 0.0156 0.0255 988 987.017 19 19.9826 1007 0.04929 9 0.0255 0.0601 958 969.041 49 37.9586 1007 3.33752
10 0.0601 1.0000 723 734.380 285 273.620 1008 0.64965
Total 9699 9699.00 374 374.000 10073 16.3805
H-L Statistic: 16.3805 Prob. Chi-Sq(8) 0.0372 Andrews Statistic: 948.3127 Prob. Chi-Sq(10) 0.0000
Dependent Variable: DETAINED Method: ML - Binary Logit (Quadratic hill climbing) Date: 04/12/06 Time: 11:11 Sample: 1 10077 IF OUTLIER=0 Included observations: 10073 Prediction Evaluation (success cutoff C = 0.0372)
Estimated Equation Constant Probability Dep=0 Dep=1 Total Dep=0 Dep=1 Total
P(Dep=1)<=C 8555 61 8616 9699 374 10073 P(Dep=1)>C 1144 313 1457 0 0 0
Total 9699 374 10073 9699 374 10073 Correct 8555 313 8868 9699 0 9699
% Correct 88.20 83.69 88.04 100.00 0.00 96.29 % Incorrect 11.80 16.31 11.96 0.00 100.00 3.71 Total Gain* -11.80 83.69 -8.25
Percent Gain** NA 83.69 -222.19

41

42
Appendix 13: Step 1: Results of Regressions: Caribbean MoU Classification Table(c)
Observed Predicted
Selected Cases(a) Unselected Cases(b)
detained_new Percentage Correct detained_new
Percentage Correct
0 1 0 1 Step 1 detained_new 0 450 23 95.1 191 8 96.0 1 2 20 90.9 6 8 57.1 Overall Percentage 94.9 93.4
a Selected cases validate EQ 1, b Unselected cases validate NE 1, c The cut value is .050 Contingency Table for Hosmer and Lemeshow Test
detained_new = 0 detained_new = 1 Observed Expected Observed Expected Total
1 206 205.957 0 .043 2062 65 64.960 0 .040 653 68 67.832 0 .168 684 9 9.931 1 .069 105 96 95.582 1 1.418 97
Step 1
6 29 28.738 20 20.262 49 Model Summary
Step -2 Log
likelihood Cox & Snell R Square
Nagelkerke R Square
1 56.271(a) .221 .725a Estimation terminated at iteration number 9 because parameter estimates changed by less than .001. Omnibus Tests of Model Coefficients Chi-square df Sig.
Step 123.731 8 .000Block 123.731 8 .000
Step 1
Model 123.731 8 .000 Variables in the Equation B S.E. Wald Sig. Exp(B) Step CL_GermanischerLloyd 2.537 1.333 3.621 .057 12.647 Code_0100 1.131 .417 7.373 .007 3.100 Code_0200 2.176 .752 8.386 .004 8.815 Code_1200 1.497 .468 10.240 .001 4.467 Code_1400 1.477 .575 6.594 .010 4.381 Code_1500 3.215 .839 14.695 .000 24.910 OW_TraditionalMN -4.270 1.360 9.860 .002 .014 OW_EmergingMN -3.194 1.537 4.320 .038 .041 Constant -4.210 .690 37.246 .000 .015
43
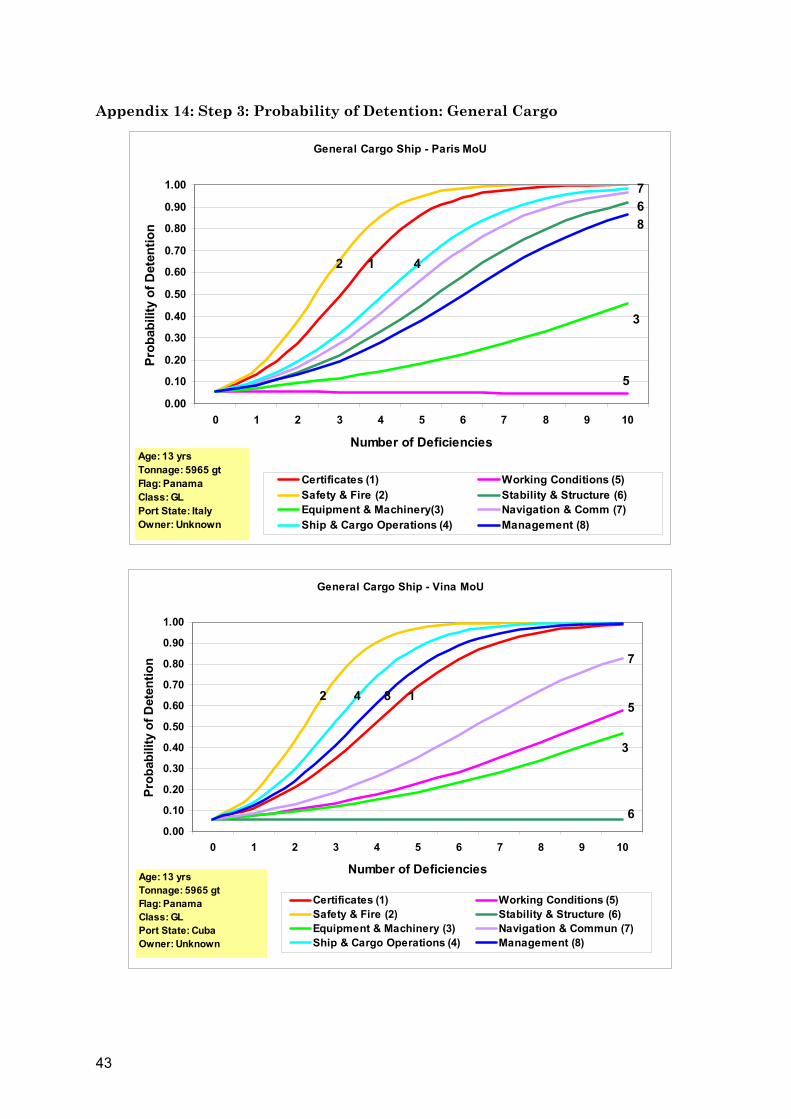
Appendix 14: Step 3: Probability of Detention: General Cargo
General Cargo Ship - Paris MoU
0.00
0.10
0.20
0.30
0.40
0.50
0.60
0.70
0.80
0.90
1.00
0 1 2 3 4 5 6 7 8 9 10
Number of Deficiencies
Prob
abili
ty o
f Det
entio
n
Certificates (1) Working Conditions (5)Safety & Fire (2) Stability & Structure (6)Equipment & Machinery(3) Navigation & Comm (7)Ship & Cargo Operations (4) Management (8)
Age: 13 yrsTonnage: 5965 gtFlag: PanamaClass: GLPort State: ItalyOwner: Unknown
2
3
1 4
5
67
8
General Cargo Ship - Vina MoU
0.00
0.10
0.20
0.30
0.40
0.50
0.60
0.70
0.80
0.90
1.00
0 1 2 3 4 5 6 7 8 9 10
Number of Deficiencies
Prob
abili
ty o
f Det
entio
n
Certificates (1) Working Conditions (5)Safety & Fire (2) Stability & Structure (6)Equipment & Machinery (3) Navigation & Commun (7)Ship & Cargo Operations (4) Management (8)
Age: 13 yrsTonnage: 5965 gtFlag: PanamaClass: GLPort State: CubaOwner: Unknown
12
3
45
6
7
8

44
General Cargo Ship - USCG
0.00
0.10
0.20
0.30
0.40
0.50
0.60
0.70
0.80
0.90
1.00
0 1 2 3 4 5 6 7 8 9 10
Number of Deficiencies
Prob
abili
ty o
f Det
entio
n
Certificates (1) Working Conditions (5)Safety & Fire (2) Stability & Structure (6)Equipment & Machinery (3) Navigation & Commun (7)Ship & Cargo Operations (4) Management (8)
Age: 13 yrsTonnage: 5965 gtFlag: PanamaClass: GLPort State: New OrleansOwner: Unknown
1
2
3
4
56
78
General Cargo Ship - AMSA
0.00
0.10
0.20
0.30
0.40
0.50
0.60
0.70
0.80
0.90
1.00
0 1 2 3 4 5 6 7 8 9 10
Number of Deficiencies
Prob
abili
ty o
f Det
entio
n
Certificates (1) Working Conditions (5)Safety & Fire (2) Stability & Structure (6)Equipment & Machinery (3) Navigation & Commun (7)Ship & Cargo Operations (4) Management (8)
Age: 13 yrsTonnage: 5965 gtFlag: PanamaClass: GLPort State: BrisbaneOwner: Unknown
1
2
3
4
5
6
78

45
Appendix 15: Step 3: Probability of Detention: Dry Bulk
Dry Bulk - Paris MoU
0.00
0.10
0.20
0.30
0.40
0.50
0.60
0.70
0.80
0.90
1.00
0 1 2 3 4 5 6 7 8 9 10
Number of Deficiencies
Prob
abili
ty o
f Det
entio
n
Certificates (1) Working Conditions (5)Safety & Fire (2) Stability & Structure (6)Equipment & Machinery (3) Navigation & Commun (7)Ship & Cargo Operations (4) Management (8)
Age: 13 yrsTonnage: 38995 gtFlag: MaltaClass: GLPort State: FranceOwner: EMN
1
2
3
4
5
6
7
8
Dry Bulk - Vina MoU
0.00
0.10
0.20
0.30
0.40
0.50
0.60
0.70
0.80
0.90
1.00
0 1 2 3 4 5 6 7 8 9 10
Number of Deficiencies
Prob
abili
ty o
f Det
entio
n
Certificates (1) Working Conditions (5)Safety & Fire (2) Stability & Structure (6)Equipment & Machinery (3) Navigation & Commun (7)Ship & Cargo Operations (4) Management (8)
Age: 13 yrsTonnage: 38995 gtFlag: MaltaClass: GLPort State: BrazilOwner: EMN
8
1
2
3
4
7

46
Dry Bulk - Indian Ocean MoU
0.00
0.10
0.20
0.30
0.40
0.50
0.60
0.70
0.80
0.90
1.00
0 1 2 3 4 5 6 7 8 9 10
Number of Deficiencies
Prob
abili
ty o
f Det
entio
n
Certificates (1) Working Conditions (5)Safety & Fire (2) Stability & Structure (6)Equipment & Machinery (3) Navigation & Commun (7)Ship & Cargo Operations (4) Management (8)
Age: 13 yrsTonnage: 38995 gtFlag: MaltaClass: GLPort State: South AfricaOwner: EMN
12
3
4
56
7
8
Dry Bulk - USCG
-0.20
0.00
0.20
0.40
0.60
0.80
1.00
0 1 2 3 4 5 6 7 8 9 10
Number of Deficiencies
Prob
abili
ty o
f Det
entio
n
Certificates (1) Working Conditions (5)Safety & Fire (2) Stability & Structure (6)Equipment & Machinery (3) Navigation & Commun (7)Ship & Cargo Operations (4) Management (8)
Age: 13 yrsTonnage: 38995 gtFlag: MaltaClass: GLPort State: MiamiOwner: EMN
12
4

47
Appendix 16: Step 3: Probability of Detention: Tanker
Tanker - Vina MoU
0.00
0.10
0.20
0.30
0.40
0.50
0.60
0.70
0.80
0.90
1.00
0 1 2 3 4 5 6 7 8 9 10
Number of Deficiencies
Prob
abili
ty o
f Det
entio
n
Certificates (1) Working Conditions (5)Safety & Fire (2) Stability & Structure (6)Equipment & Machinery (3) Navigation & Commun (7)Ship & Cargo Operations (4) Management (8)
Age: 10 yrsTonnage: 28909 gtFlag: PanamaClass: GLPort State: ChileOwner: TMN
1
2
3
4
5
6
78
Tanker - Indian Ocean MoU
0.00
0.10
0.20
0.30
0.40
0.50
0.60
0.70
0.80
0.90
1.00
0 1 2 3 4 5 6 7 8 9 10
Number of Deficiencies
Prob
abili
ty o
f Det
entio
n
Certificates (1) Working Conditions (5)Safety & Fire (2) Stability & Structure (6)Equipment & Machinery (3) Navigation & Commun (7)Ship & Cargo Operations (4) Management (8)
Age: 10 yrsTonnage: 28909 gtFlag: PanamaClass: GLPort State: South AfricaOwner: TMN
12, 4, 7
5
6
38

48
Tanker - USCG
0.00
0.10
0.20
0.30
0.40
0.50
0.60
0.70
0.80
0.90
1.00
0 1 2 3 4 5 6 7 8 9 10
Number of Deficiencies
Prob
abili
ty o
f Det
entio
n
Certificates (1) Working Conditions (5)Safety & Fire (2) Stability & Structure (6)Equipment & Machinery (3) Navigation & Commun (7)Ship & Cargo Operations (4) Management (8)
Age: 10 yrsTonnage: 28909 gtFlag: PanamaClass: GLPort State: HoustonOwner: TMN
12
3
4 8
7
6
Tanker - AMSA
0.00
0.10
0.20
0.30
0.40
0.50
0.60
0.70
0.80
0.90
1.00
0 1 2 3 4 5 6 7 8 9 10
Number of Deficiencies
Prob
abili
ty o
f Det
entio
n
Certificates (1) Working Conditions (5)Safety & Fire (2) Stability & Structure (6)Equipment & Machinery (3) Navigation & Commun (7)Ship & Cargo Operations (4) Management (8)
Age: 10 yrsTonnage: 28909 gtFlag: PanamaClass: GLPort State: BrisbaneOwner: TMN
1
2
6,3,5
84
7
49
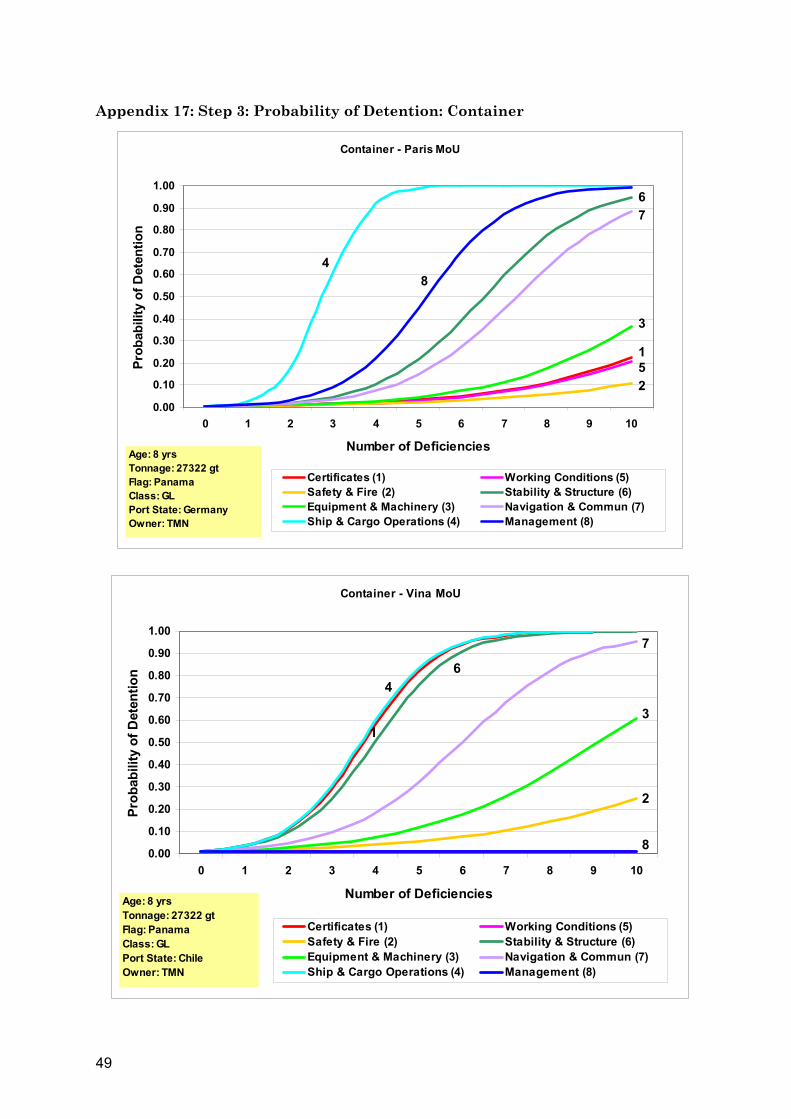
Appendix 17: Step 3: Probability of Detention: Container
Container - Paris MoU
0.00
0.10
0.20
0.30
0.40
0.50
0.60
0.70
0.80
0.90
1.00
0 1 2 3 4 5 6 7 8 9 10
Number of Deficiencies
Prob
abili
ty o
f Det
entio
n
Certificates (1) Working Conditions (5)Safety & Fire (2) Stability & Structure (6)Equipment & Machinery (3) Navigation & Commun (7)Ship & Cargo Operations (4) Management (8)
Age: 8 yrsTonnage: 27322 gtFlag: PanamaClass: GLPort State: GermanyOwner: TMN
1
2
3
4
5
67
8
Container - Vina MoU
0.00
0.10
0.20
0.30
0.40
0.50
0.60
0.70
0.80
0.90
1.00
0 1 2 3 4 5 6 7 8 9 10
Number of Deficiencies
Prob
abili
ty o
f Det
entio
n
Certificates (1) Working Conditions (5)Safety & Fire (2) Stability & Structure (6)Equipment & Machinery (3) Navigation & Commun (7)Ship & Cargo Operations (4) Management (8)
Age: 8 yrsTonnage: 27322 gtFlag: PanamaClass: GLPort State: ChileOwner: TMN
1
2
3
46
7
8

50
Container - Indian Ocean MoU
0.00
0.10
0.20
0.30
0.40
0.50
0.60
0.70
0.80
0.90
1.00
0 1 2 3 4 5 6 7 8 9 10
Number of Deficiencies
Prob
abili
ty o
f Det
entio
n
Certificates (1) Working Conditions (5)Safety & Fire (2) Stability & Structure (6)Equipment & Machinery (3) Navigation & Commun (7)Ship & Cargo Operations (4) Management (8)
Age: 8 yrsTonnage: 27322 gtFlag: PanamaClass: GLPort State: IranOwner: TMN
1
2
46
8
Container - AMSA
0.00
0.10
0.20
0.30
0.40
0.50
0.60
0.70
0.80
0.90
1.00
0 1 2 3 4 5 6 7 8 9 10
Number of Deficiencies
Prob
abili
ty o
f Det
entio
n
Certificates (1) Working Conditions (5)Safety & Fire (2) Stability & Structure (6)Equipment & Machinery (3) Navigation & Commun (7)Ship & Cargo Operations (4) Management (8)
Age: 8 yrsTonnage: 27322 gtFlag: PanamaClass: GLPort State: Port BotanyOwner: TMN
12
3
4
5
68

51
Appendix 18: LM Test for Very Serious Casualties Tonnage Dependent Variable: BRMR_Y Method: Least Squares Date: 05/11/06 Time: 23:15 Sample: 1 47169 IF EXCESSOB=0 AND ST7_MAX=0 AND OUTLIER=0 AND CMOU_S=0 Included observations: 38076
Variable Coefficient Std. Error t-Statistic Prob.
FAC -1.361108 0.545723 -2.494137 0.0126ST1_MAX*FAC 0.778387 0.194644 3.999026 0.0001
LNTON*FAC -0.449967 0.100681 -4.469252 0.0000LNAGE*FAC 0.256059 0.089978 2.845795 0.0044
CLWD_D*FAC 0.472311 0.203908 2.316295 0.0205CLCHGD*FAC -0.478080 0.241530 -1.979379 0.0478OWCHGD*FAC 3.753590 0.761337 4.930262 0.0000CL_RNR*FAC 1.967802 0.791299 2.486800 0.0129FL_AG*FAC 1.028536 0.469510 2.190659 0.0285FL_BG*FAC 1.290962 0.783771 1.647117 0.0995FL_BZ*FAC 0.829271 0.353460 2.346155 0.0190FL_TR*FAC 0.504822 0.305642 1.651681 0.0986
OW_EMN*FAC 0.806087 0.238956 3.373377 0.0007OW_TMN*FAC 1.111524 0.273993 4.056759 0.0000OW_IOR*FAC 0.931463 0.320292 2.908166 0.0036OW_OOR*FAC 1.876627 0.446509 4.202888 0.0000
SY_KR*FAC 0.631551 0.420017 1.503630 0.1327SY_NO*FAC 0.735646 0.375644 1.958358 0.0502SY_UN*FAC 2.570107 0.530377 4.845812 0.0000
LI_FLRET*FAC -0.033462 0.013931 -2.401985 0.0163RS_INS*FAC -0.571063 0.182827 -3.123517 0.0018AMSA_S*FAC -1.050391 0.266198 -3.945904 0.0001IMOU_S*FAC -1.305526 0.342302 -3.813958 0.0001PMOU_S*FAC -0.382504 0.085432 -4.477263 0.0000USCG_S*FAC -1.025581 0.251547 -4.077092 0.0000VMOU_S*FAC -0.346312 0.117173 -2.955573 0.0031
LNTON*(-XB)*FAC 0.085733 0.016986 5.047259 0.0000
R-squared 0.000645 Mean dependent var 0.004893Adjusted R-squared -0.000039 S.D. dependent var 0.950329S.E. of regression 0.950348 Akaike info criterion 2.736731Sum squared resid 34349.90 Schwarz criterion 2.742794Log likelihood -52053.00 Durbin-Watson stat 1.871794

52
Age Dependent Variable: BRMR_Y Method: Least Squares Date: 05/11/06 Time: 23:21 Sample: 1 47169 IF EXCESSOB=0 AND ST7_MAX=0 AND OUTLIER=0 AND CMOU_S=0 Included observations: 38076
Variable Coefficient Std. Error t-Statistic Prob.
FAC 0.809542 0.520551 1.555162 0.1199ST1_MAX*FAC -0.496444 0.174625 -2.842918 0.0045
LNTON*FAC 0.147913 0.059624 2.480777 0.0131LNAGE*FAC 0.165110 0.085700 1.926591 0.0540
CLWD_D*FAC -0.205618 0.189997 -1.082216 0.2792CLCHGD*FAC 0.265909 0.234107 1.135847 0.2560OWCHGD*FAC -2.129391 0.577153 -3.689475 0.0002CL_RNR*FAC -1.113987 0.748194 -1.488901 0.1365FL_AG*FAC -0.670327 0.452134 -1.482585 0.1382FL_BG*FAC -0.668855 0.763096 -0.876502 0.3808FL_BZ*FAC -0.539366 0.342280 -1.575802 0.1151FL_TR*FAC -0.324981 0.301973 -1.076191 0.2818
OW_EMN*FAC -0.489567 0.220287 -2.222410 0.0263OW_TMN*FAC -0.710166 0.249947 -2.841267 0.0045OW_IOR*FAC -0.578825 0.303549 -1.906856 0.0565OW_OOR*FAC -1.083118 0.382319 -2.833023 0.0046
SY_KR*FAC -0.614768 0.430522 -1.427961 0.1533SY_NO*FAC -0.476987 0.365988 -1.303285 0.1925SY_UN*FAC -1.630392 0.440520 -3.701058 0.0002
LI_FLRET*FAC 0.020322 0.013307 1.527239 0.1267RS_INS*FAC 0.349586 0.172224 2.029839 0.0424AMSA_S*FAC 0.619145 0.231486 2.674661 0.0075IMOU_S*FAC 0.908718 0.312149 2.911165 0.0036PMOU_S*FAC 0.222707 0.069441 3.207120 0.0013USCG_S*FAC 0.586517 0.209840 2.795071 0.0052VMOU_S*FAC 0.206786 0.107447 1.924538 0.0543
LNAGE*(-XB)*FAC -0.130285 0.033647 -3.872119 0.0001
R-squared 0.000369 Mean dependent var 0.004893Adjusted R-squared -0.000314 S.D. dependent var 0.950329S.E. of regression 0.950478 Akaike info criterion 2.737007Sum squared resid 34359.37 Schwarz criterion 2.743070Log likelihood -52058.24 Durbin-Watson stat 1.871407
53
Appendix 19: Estimation Results of Greene Model, Very Serious Casualties Age and Tonnage LogL: LL1 Method: Maximum Likelihood (Marquardt) Date: 05/13/06 Time: 00:31 Sample: 1 47169 IF EXCESSOB=0 AND ST7_MAX=0 AND OUTLIER=0 AND CMOU_S=0 Included observations: 38076 Evaluation order: By observation Estimation settings: tol= 1.0e-05, derivs=accurate numeric Initial Values: BETA(1)=0.41130, BETA(2)=0.52333, BETA(3)=0.51187, BETA(4)=0.69811, BETA(5)=0.07680, BETA(6)=0.74075, BETA(7)=0.95502, BETA(8)=0.81404, BETA(9)=0.07958, BETA(10)=0.85638, BETA(11)=0.62122, BETA(12)=0.41764, BETA(13)=0.57133, BETA(14)=0.99269, BETA(15)=0.69978, BETA(16)=0.10224, BETA(17)=0.85978, BETA(18)=0.55634, BETA(19)=0.30227, BETA(20)=0.20892, BETA(21)=0.42523, BETA(22)=0.59285, BETA(23)=0.29655, BETA(24)=0.68481, BETA(25)=0.93063, BETA(26)=0.08356, GAM(1)=0.00349, GAM(2)=0.28542 Convergence achieved after 189 iterations
Coefficient Std. Error z-Statistic Prob.
BETA(1) -5.014612 0.721928 -6.946135 0.0000BETA(2) 1.955363 0.405091 4.826969 0.0000BETA(3) -0.935205 0.230269 -4.061357 0.0000BETA(4) 0.754552 0.164262 4.593579 0.0000BETA(5) 1.146784 0.403194 2.844252 0.0045BETA(6) -1.009336 0.425415 -2.372592 0.0177BETA(7) 9.008728 1.609522 5.597144 0.0000BETA(8) 4.700616 1.273900 3.689941 0.0002BETA(9) 2.650216 0.778979 3.402168 0.0007BETA(10) 2.955407 1.713680 1.724596 0.0846BETA(11) 2.143534 0.619450 3.460385 0.0005BETA(12) 1.086505 0.544248 1.996342 0.0459BETA(13) 1.969195 0.456945 4.309481 0.0000BETA(14) 2.651248 0.526253 5.037971 0.0000BETA(15) 2.290799 0.612264 3.741522 0.0002BETA(16) 4.190399 0.831645 5.038686 0.0000BETA(17) 1.432996 0.765205 1.872697 0.0611BETA(18) 1.908346 0.708711 2.692699 0.0071BETA(19) 6.501460 1.107278 5.871568 0.0000BETA(20) -0.084136 0.024775 -3.396006 0.0007BETA(21) -1.424921 0.370641 -3.844483 0.0001BETA(22) -2.607840 0.529732 -4.922940 0.0000BETA(23) -3.914086 0.788980 -4.960946 0.0000BETA(24) -0.949919 0.182783 -5.196977 0.0000BETA(25) -2.456774 0.467197 -5.258536 0.0000

54
BETA(26) -0.942375 0.233599 -4.034150 0.0001GAM(1) 0.080157 0.017731 4.520697 0.0000GAM(2) -0.048332 0.035069 -1.378193 0.1681
Log likelihood -1293.243 Akaike info criterion 0.069400Avg. log likelihood -0.033965 Schwarz criterion 0.075686Number of Coefs. 28 Hannan-Quinn criter. 0.071394
Tonnage Only LogL: LL1 Method: Maximum Likelihood (Marquardt) Date: 05/12/06 Time: 00:59 Sample: 1 47169 IF EXCESSOB=0 AND ST7_MAX=0 AND OUTLIER=0 AND CMOU_S=0 Included observations: 38076 Evaluation order: By observation Estimation settings: tol= 1.0e-05, derivs=accurate numeric Initial Values: BETA(1)=0.66868, BETA(2)=0.64867, BETA(3)=0.64281, BETA(4)=0.82909, BETA(5)=0.29897, BETA(6)=0.51628, BETA(7)=0.78892, BETA(8)=0.28128, BETA(9)=0.86711, BETA(10)=0.79424, BETA(11)=0.30990, BETA(12)=0.46415, BETA(13)=0.33391, BETA(14)=0.02463, BETA(15)=0.79715, BETA(16)=0.20055, BETA(17)=0.69548, BETA(18)=0.92699, BETA(19)=0.97617, BETA(20)=0.55996, BETA(21)=0.92988, BETA(22)=0.46306, BETA(23)=0.31914, BETA(24)=0.72321, BETA(25)=0.27320, BETA(26)=0.75714, GAM(1)=0.31511 Convergence achieved after 112 iterations
Coefficient Std. Error z-Statistic Prob.
BETA(1) -4.968107 0.846124 -5.871607 0.0000BETA(2) 2.449522 0.439826 5.569297 0.0000BETA(3) -1.240318 0.267346 -4.639370 0.0000BETA(4) 0.686511 0.165193 4.155816 0.0000BETA(5) 1.470035 0.481397 3.053688 0.0023BETA(6) -1.243165 0.516467 -2.407057 0.0161BETA(7) 11.41535 1.629473 7.005550 0.0000BETA(8) 5.983110 1.499014 3.991364 0.0001BETA(9) 3.300294 0.893889 3.692063 0.0002BETA(10) 3.704389 2.184891 1.695457 0.0900BETA(11) 2.667721 0.735841 3.625403 0.0003BETA(12) 1.364804 0.667685 2.044083 0.0409BETA(13) 2.405654 0.505676 4.757300 0.0000BETA(14) 3.243644 0.555757 5.836446 0.0000BETA(15) 2.858932 0.676138 4.228328 0.0000BETA(16) 5.240314 0.856515 6.118183 0.0000BETA(17) 1.902673 0.898725 2.117080 0.0343BETA(18) 2.373656 0.865118 2.743737 0.0061BETA(19) 8.186691 1.094707 7.478430 0.0000

55
BETA(20) -0.104756 0.028347 -3.695439 0.0002BETA(21) -1.780047 0.412698 -4.313193 0.0000BETA(22) -3.344526 0.564716 -5.922494 0.0000BETA(23) -5.086684 0.833368 -6.103765 0.0000BETA(24) -1.222197 0.190369 -6.420162 0.0000BETA(25) -3.122190 0.483228 -6.461111 0.0000BETA(26) -1.235696 0.269779 -4.580395 0.0000GAM(1) 0.091619 0.017580 5.211461 0.0000
Log likelihood -1294.314 Akaike info criterion 0.069404Avg. log likelihood -0.033993 Schwarz criterion 0.075465Number of Coefs. 27 Hannan-Quinn criter. 0.071327
Greene Program Used ' HPROBIT1.PRG (1.0 - 6/29/98) ' example program for EViews LogL object ' revised for version 5.0 (3/26/2004) ' Estimate probit specification with multiplicative heterogeneity. '' Example 19.7 (p. 890) of Greene, William H. (1997) Econometric Analysis, ' 3rd edition, Prentice-Hall. coef(26) beta rnd (beta) coef(1) gam rnd (gam) ' specify the likelihood logl ll1 ll1.append @logl logl1 ll1.append index = (beta(1)+beta(2)*st1_max+beta(3)*lnton+beta(4)*lnage+beta(5)*clwd_d+beta(6)*clchgd+beta(7)*owchgd+beta(8)*cl_rnr+beta(9)*fl_ag+beta(10)*fl_bg+beta(11)*fl_bz+beta(12)*fl_tr+beta(13)*ow_emn+beta(14)*ow_tmn+beta(15)*ow_ior+beta(16)*ow_oor+beta(17)*sy_kr+beta(18)*sy_no+beta(19)*sy_un+beta(20)*li_flret+beta(21)*rs_ins+beta(22)*amsa_s+beta(23)*imou_s+beta(24)*pmou_s+beta(25)*uscg_s+beta(26)*vmou_s)/exp(gam(1)*lnton) ll1.append logl1 = casualty*log(@clogistic(index))+(1-casualty)*log(1-@clogistic(index)) ' carry out MLE and display results ll1.ml(showopts, m=1000, c=1e-5) show ll1.output Note: for the model with age and tonnage, the last term of the index is changed to the following term: exp(gam(1)*lnton) + gam(2)*lnage and coef (1) is changed to coef (2) for gam

56
Appendix 20: Average Probabilities of Corrected versus Uncorrected Model Tonnage Groups
0.00 0.02 0.04 0.06 0.08 0.10 0.12 0.14
0
2
4
6
8
10
12
14
16
18
20
22
24
26
28
30
32
34
36
38
40
42
Tonn
age
Gro
ups
Probability of VS Casualty
CorrectedUncorrected
For an explanation on the groups in detail, please refer to Error! Reference source not found.
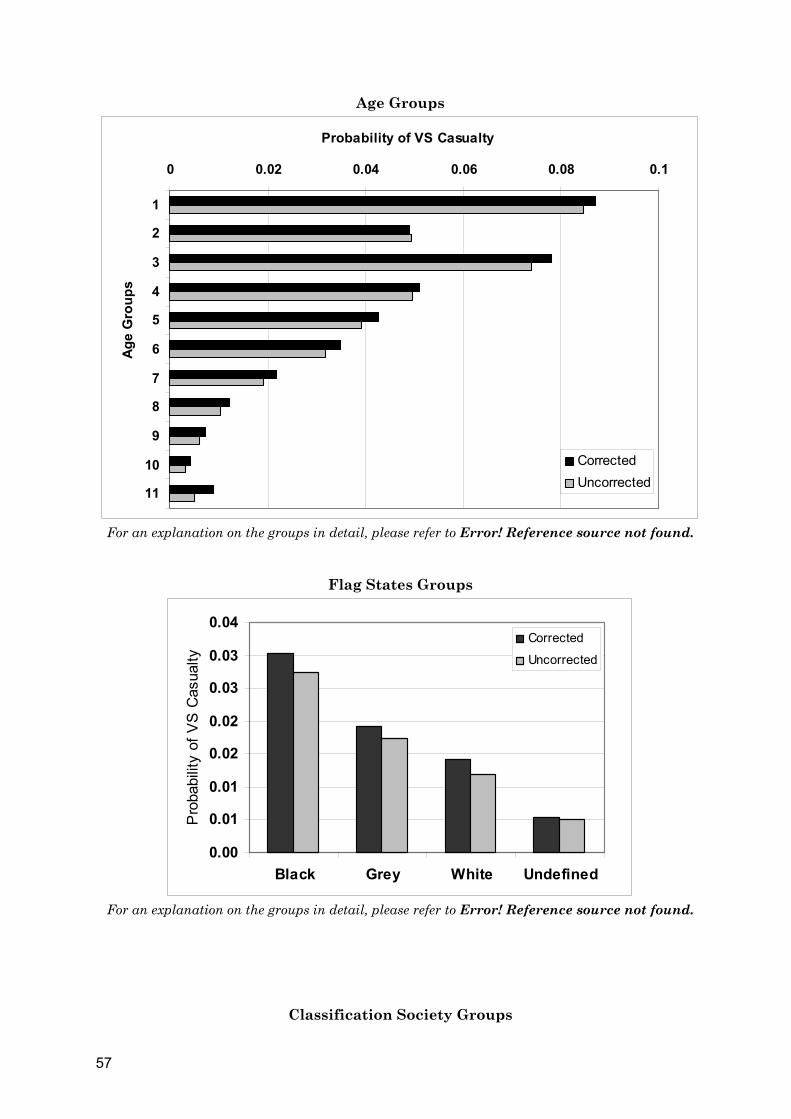
57
Age Groups
0 0.02 0.04 0.06 0.08 0.1
1
2
3
4
5
6
7
8
9
10
11
Age
Gro
ups
Probability of VS Casualty
CorrectedUncorrected
For an explanation on the groups in detail, please refer to Error! Reference source not found.
Flag States Groups
0.00
0.01
0.01
0.02
0.02
0.03
0.03
0.04
Black Grey White Undefined
Pro
babi
lity
of V
S C
asua
lty
Corrected
Uncorrected
For an explanation on the groups in detail, please refer to Error! Reference source not found.
Classification Society Groups

58
0.000.010.010.020.020.030.030.04
NIACS IACS Unknown
Prob
abili
ty o
f VS
Cas
ualty
Corrected Uncorrected
For an explanation on the groups in detail, please refer to Error! Reference source not found.
Ownership Groups
0.00
0.02
0.04
0.06
0.08
0.10
0.12
0.14
EMN TMN OOR NOR IOR Unknown
Pro
babi
lity
of V
S C
asua
lty
CorrectedUncorrected
For an explanation on the groups in detail, please refer to Error! Reference source not found.
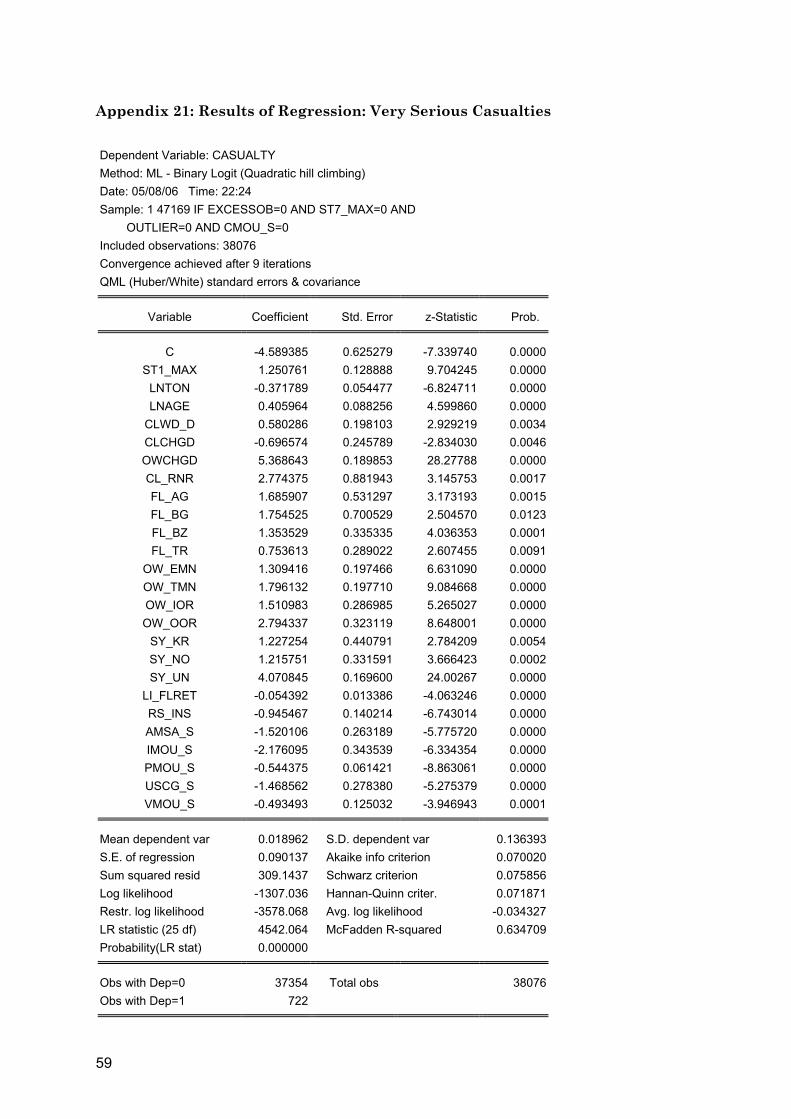
59
Appendix 21: Results of Regression: Very Serious Casualties Dependent Variable: CASUALTY Method: ML - Binary Logit (Quadratic hill climbing) Date: 05/08/06 Time: 22:24 Sample: 1 47169 IF EXCESSOB=0 AND ST7_MAX=0 AND OUTLIER=0 AND CMOU_S=0 Included observations: 38076 Convergence achieved after 9 iterations QML (Huber/White) standard errors & covariance
Variable Coefficient Std. Error z-Statistic Prob.
C -4.589385 0.625279 -7.339740 0.0000ST1_MAX 1.250761 0.128888 9.704245 0.0000
LNTON -0.371789 0.054477 -6.824711 0.0000LNAGE 0.405964 0.088256 4.599860 0.0000
CLWD_D 0.580286 0.198103 2.929219 0.0034CLCHGD -0.696574 0.245789 -2.834030 0.0046OWCHGD 5.368643 0.189853 28.27788 0.0000CL_RNR 2.774375 0.881943 3.145753 0.0017FL_AG 1.685907 0.531297 3.173193 0.0015FL_BG 1.754525 0.700529 2.504570 0.0123FL_BZ 1.353529 0.335335 4.036353 0.0001FL_TR 0.753613 0.289022 2.607455 0.0091
OW_EMN 1.309416 0.197466 6.631090 0.0000OW_TMN 1.796132 0.197710 9.084668 0.0000OW_IOR 1.510983 0.286985 5.265027 0.0000OW_OOR 2.794337 0.323119 8.648001 0.0000
SY_KR 1.227254 0.440791 2.784209 0.0054SY_NO 1.215751 0.331591 3.666423 0.0002SY_UN 4.070845 0.169600 24.00267 0.0000
LI_FLRET -0.054392 0.013386 -4.063246 0.0000RS_INS -0.945467 0.140214 -6.743014 0.0000AMSA_S -1.520106 0.263189 -5.775720 0.0000IMOU_S -2.176095 0.343539 -6.334354 0.0000PMOU_S -0.544375 0.061421 -8.863061 0.0000USCG_S -1.468562 0.278380 -5.275379 0.0000VMOU_S -0.493493 0.125032 -3.946943 0.0001
Mean dependent var 0.018962 S.D. dependent var 0.136393S.E. of regression 0.090137 Akaike info criterion 0.070020Sum squared resid 309.1437 Schwarz criterion 0.075856Log likelihood -1307.036 Hannan-Quinn criter. 0.071871Restr. log likelihood -3578.068 Avg. log likelihood -0.034327LR statistic (25 df) 4542.064 McFadden R-squared 0.634709Probability(LR stat) 0.000000
Obs with Dep=0 37354 Total obs 38076Obs with Dep=1 722

60
Dependent Variable: CASUALTY Method: ML - Binary Logit (Quadratic hill climbing) Date: 05/08/06 Time: 22:24 Sample: 1 47169 IF EXCESSOB=0 AND ST7_MAX=0 AND OUTLIER=0 AND CMOU_S=0 Included observations: 38076 Andrews and Hosmer-Lemeshow Goodness-of-Fit Tests Grouping based upon predicted risk (randomize ties)
Quantile of Risk Dep=0 Dep=1 Total H-L Low High Actual Expect Actual Expect Obs Value
1 0.0000 6.E-08 3807 3807.00 0 3.7E-05 3807 3.7E-05 2 6.E-08 5.E-06 3808 3808.00 0 0.00477 3808 0.00477 3 5.E-06 7.E-05 3807 3806.90 0 0.09870 3807 0.09870 4 7.E-05 0.0004 3806 3807.21 2 0.79211 3808 1.84230 5 0.0004 0.0010 3801 3805.32 7 2.68493 3808 6.93985 6 0.0010 0.0018 3800 3801.68 7 5.32050 3807 0.53091 7 0.0018 0.0032 3793 3798.67 15 9.33058 3808 3.45329 8 0.0032 0.0060 3792 3790.28 15 16.7211 3807 0.17793 9 0.0060 0.0137 3782 3774.80 26 33.2042 3808 1.57682
10 0.0137 0.9998 3158 3154.16 650 653.843 3808 0.02727
Total 37354 37354.0 722 722.000 38076 14.6519
H-L Statistic: 14.6519 Prob. Chi-Sq(8) 0.0663Andrews Statistic: 5583.790 Prob. Chi-Sq(10) 0.0000
Dependent Variable: CASUALTY Method: ML - Binary Logit (Quadratic hill climbing) Date: 05/08/06 Time: 22:24 Sample: 1 47169 IF EXCESSOB=0 AND ST7_MAX=0 AND OUTLIER=0 AND CMOU_S=0 Included observations: 38076 Prediction Evaluation (success cutoff C = 0.0189)
Estimated Equation Constant Probability Dep=0 Dep=1 Total Dep=0 Dep=1 Total
P(Dep=1)<=C 34936 82 35018 0 0 0P(Dep=1)>C 2418 640 3058 37354 722 38076
Total 37354 722 38076 37354 722 38076Correct 34936 640 35576 0 722 722
% Correct 93.53 88.64 93.43 0.00 100.00 1.90% Incorrect 6.47 11.36 6.57 100.00 0.00 98.10Total Gain* 93.53 -11.36 91.54
Percent Gain** 93.53 NA 93.31

61
-10
0
10
20
30
40
50
60
10000 20000 30000 40000
Standardized (Pearson) Residuals
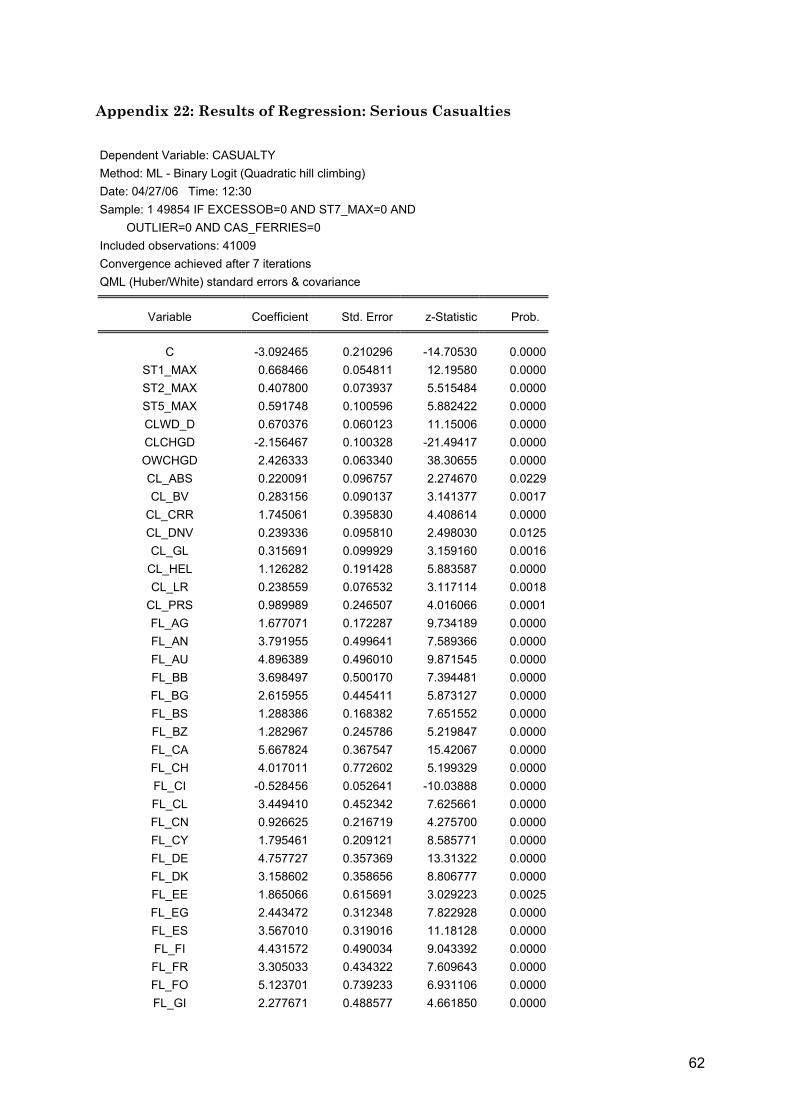
62
Appendix 22: Results of Regression: Serious Casualties Dependent Variable: CASUALTY Method: ML - Binary Logit (Quadratic hill climbing) Date: 04/27/06 Time: 12:30 Sample: 1 49854 IF EXCESSOB=0 AND ST7_MAX=0 AND OUTLIER=0 AND CAS_FERRIES=0 Included observations: 41009 Convergence achieved after 7 iterations QML (Huber/White) standard errors & covariance
Variable Coefficient Std. Error z-Statistic Prob.
C -3.092465 0.210296 -14.70530 0.0000ST1_MAX 0.668466 0.054811 12.19580 0.0000ST2_MAX 0.407800 0.073937 5.515484 0.0000ST5_MAX 0.591748 0.100596 5.882422 0.0000CLWD_D 0.670376 0.060123 11.15006 0.0000CLCHGD -2.156467 0.100328 -21.49417 0.0000OWCHGD 2.426333 0.063340 38.30655 0.0000CL_ABS 0.220091 0.096757 2.274670 0.0229CL_BV 0.283156 0.090137 3.141377 0.0017
CL_CRR 1.745061 0.395830 4.408614 0.0000CL_DNV 0.239336 0.095810 2.498030 0.0125CL_GL 0.315691 0.099929 3.159160 0.0016
CL_HEL 1.126282 0.191428 5.883587 0.0000CL_LR 0.238559 0.076532 3.117114 0.0018
CL_PRS 0.989989 0.246507 4.016066 0.0001FL_AG 1.677071 0.172287 9.734189 0.0000FL_AN 3.791955 0.499641 7.589366 0.0000FL_AU 4.896389 0.496010 9.871545 0.0000FL_BB 3.698497 0.500170 7.394481 0.0000FL_BG 2.615955 0.445411 5.873127 0.0000FL_BS 1.288386 0.168382 7.651552 0.0000FL_BZ 1.282967 0.245786 5.219847 0.0000FL_CA 5.667824 0.367547 15.42067 0.0000FL_CH 4.017011 0.772602 5.199329 0.0000FL_CI -0.528456 0.052641 -10.03888 0.0000FL_CL 3.449410 0.452342 7.625661 0.0000FL_CN 0.926625 0.216719 4.275700 0.0000FL_CY 1.795461 0.209121 8.585771 0.0000FL_DE 4.757727 0.357369 13.31322 0.0000FL_DK 3.158602 0.358656 8.806777 0.0000FL_EE 1.865066 0.615691 3.029223 0.0025FL_EG 2.443472 0.312348 7.822928 0.0000FL_ES 3.567010 0.319016 11.18128 0.0000FL_FI 4.431572 0.490034 9.043392 0.0000FL_FR 3.305033 0.434322 7.609643 0.0000FL_FO 5.123701 0.739233 6.931106 0.0000FL_GI 2.277671 0.488577 4.661850 0.0000

63
FL_GR 2.731950 0.191291 14.28165 0.0000FL_HK 2.556422 0.385528 6.630958 0.0000FL_IE 4.447324 0.450956 9.861982 0.0000FL_IM 4.530595 0.429767 10.54198 0.0000FL_IN 2.327092 0.250481 9.290498 0.0000FL_IT 2.416283 0.237086 10.19159 0.0000FL_JP 3.117043 0.282379 11.03850 0.0000FL_KH 1.320022 0.204835 6.444315 0.0000FL_KR 2.678093 0.222986 12.01015 0.0000FL_KW 2.518723 0.538670 4.675820 0.0000FL_LR 0.773762 0.164247 4.710973 0.0000FL_MH 2.317475 0.404445 5.730006 0.0000FL_MT 4.398416 0.319629 13.76100 0.0000FL_MY 1.576575 0.320774 4.914909 0.0000FL_NIS 4.540584 0.401066 11.32129 0.0000FL_NL 4.063273 0.356062 11.41170 0.0000FL_NO 5.137925 0.383828 13.38600 0.0000FL_NZ 5.063607 0.692862 7.308243 0.0000FL_PA 0.888314 0.114369 7.767070 0.0000FL_PL 2.155938 0.429161 5.023608 0.0000FL_PT 2.495289 0.373013 6.689548 0.0000FL_SE 4.451411 0.424953 10.47507 0.0000FL_SG 3.946599 0.406321 9.713013 0.0000FL_TO 1.792702 0.596090 3.007434 0.0026FL_UK 5.129702 0.356429 14.39192 0.0000FL_US 4.360653 0.325468 13.39810 0.0000FL_VC 1.008740 0.160391 6.289266 0.0000
OW_EMN 0.998902 0.127474 7.836136 0.0000OW_IOR 1.707517 0.161042 10.60291 0.0000OW_OOR 2.596296 0.162111 16.01559 0.0000OW_TMN 1.968789 0.160918 12.23472 0.0000LI_FLRET -0.124485 0.010146 -12.26910 0.0000
LI_OWRET -0.036024 0.008848 -4.071546 0.0000SY_AR 1.511256 0.460342 3.282900 0.0010SY_BG 1.387078 0.247395 5.606738 0.0000SY_BR 1.829303 0.250725 7.296056 0.0000SY_CA 0.911227 0.230245 3.957638 0.0001SY_CN 0.701901 0.153577 4.570359 0.0000SY_DE 0.948511 0.093630 10.13044 0.0000SY_DK 1.023127 0.168166 6.084046 0.0000SY_ES 0.859322 0.162852 5.276711 0.0000SY_FI 1.025017 0.181672 5.642145 0.0000SY_FR 1.454359 0.207273 7.016644 0.0000SY_GR 1.793982 0.278736 6.436137 0.0000SY_HR 1.470937 0.201326 7.306258 0.0000SY_IT 1.081655 0.195505 5.532619 0.0000SY_JP 0.574232 0.077664 7.393845 0.0000SY_KR 0.993873 0.109156 9.105032 0.0000SY_NL 0.927623 0.116488 7.963272 0.0000SY_NO 1.488261 0.118315 12.57879 0.0000SY_OT 1.838009 0.183975 9.990551 0.0000

64
SY_PL 0.764665 0.178705 4.278919 0.0000SY_RO 1.277681 0.160963 7.937723 0.0000SY_RU 0.796697 0.168806 4.719605 0.0000SY_SE 1.380393 0.200647 6.879717 0.0000SY_TR 1.610577 0.186590 8.631655 0.0000SY_UK 1.195786 0.137620 8.689071 0.0000SY_US 0.886520 0.196212 4.518162 0.0000
AMSA_S -0.172419 0.025038 -6.886212 0.0000PMOU_S 0.045986 0.007260 6.334319 0.0000USCG_S 0.029542 0.009051 3.264050 0.0011
Mean dependent var 0.077983 S.D. dependent var 0.268148S.E. of regression 0.231704 Akaike info criterion 0.398456Sum squared resid 2196.387 Schwarz criterion 0.419059Log likelihood -8072.138 Hannan-Quinn criter. 0.404970Restr. log likelihood -11228.88 Avg. log likelihood -0.196838LR statistic (97 df) 6313.485 McFadden R-squared 0.281127Probability(LR stat) 0.000000
Obs with Dep=0 37811 Total obs 41009Obs with Dep=1 3198
Dependent Variable: CASUALTY Method: ML - Binary Logit (Quadratic hill climbing) Date: 04/27/06 Time: 12:30 Sample: 1 49854 IF EXCESSOB=0 AND ST7_MAX=0 AND OUTLIER=0 AND CAS_FERRIES=0 Included observations: 41009 Andrews and Hosmer-Lemeshow Goodness-of-Fit Tests Grouping based upon predicted risk (randomize ties)
Quantile of Risk Dep=0 Dep=1 Total H-L Low High Actual Expect Actual Expect Obs Value
1 7.E-05 0.0067 4079 4083.85 21 16.1519 4100 1.46097 2 0.0067 0.0109 4061 4063.68 40 37.3179 4101 0.19454 3 0.0109 0.0160 4031 4046.42 70 54.5770 4101 4.41720 4 0.0160 0.0215 4034 4024.63 67 76.3722 4101 1.17196 5 0.0215 0.0291 3974 3997.56 127 103.443 4101 5.50328 6 0.0291 0.0426 3949 3955.05 152 145.950 4101 0.26008 7 0.0426 0.0594 3915 3896.16 186 204.842 4101 1.82419 8 0.0594 0.0999 3777 3785.32 324 315.677 4101 0.23772 9 0.0999 0.1917 3560 3529.82 541 571.183 4101 1.85300
10 0.1918 0.9986 2431 2428.51 1670 1672.49 4101 0.00624
Total 37811 37811.0 3198 3198.00 41009 16.9292
H-L Statistic: 16.9292 Prob. Chi-Sq(8) 0.0309 Andrews Statistic: 33.2464 Prob. Chi-Sq(10) 0.0002

65
Dependent Variable: CASUALTY Method: ML - Binary Logit (Quadratic hill climbing) Date: 04/27/06 Time: 12:30 Sample: 1 49854 IF EXCESSOB=0 AND ST7_MAX=0 AND OUTLIER=0 AND CAS_FERRIES=0 Included observations: 41009 Prediction Evaluation (success cutoff C = 0.078)
Estimated Equation Constant Probability Dep=0 Dep=1 Total Dep=0 Dep=1 Total
P(Dep=1)<=C 30198 819 31017 37811 3198 41009P(Dep=1)>C 7613 2379 9992 0 0 0
Total 37811 3198 41009 37811 3198 41009Correct 30198 2379 32577 37811 0 37811
% Correct 79.87 74.39 79.44 100.00 0.00 92.20% Incorrect 20.13 25.61 20.56 0.00 100.00 7.80Total Gain* -20.13 74.39 -12.76
Percent Gain** NA 74.39 -163.66
-4
0
4
8
12
16
20
10001 20000 30000 40000
Standardized (Pearson) Residuals

66
Appendix 23: Results of Regressions: Less Serious Casualties Dependent Variable: CASUALTY Method: ML - Binary Logit (Quadratic hill climbing) Date: 04/27/06 Time: 10:38 Sample: 1 48470 IF EXCESSOB=0 AND ST7_MAX=0 AND OUTLIER=0 AND CAS_FERRIES=0 Included observations: 39929 Convergence achieved after 8 iterations QML (Huber/White) standard errors & covariance
Variable Coefficient Std. Error z-Statistic Prob.
C -5.662095 0.431350 -13.12645 0.0000ST1_MAX 0.845100 0.072206 11.70397 0.0000ST2_MAX 0.824041 0.089573 9.199675 0.0000ST3_MAX 0.723681 0.099356 7.283716 0.0000ST5_MAX 0.821732 0.117352 7.002274 0.0000CLWD_D 0.430677 0.077533 5.554728 0.0000CLCHGD -2.029244 0.122660 -16.54367 0.0000OWCHGD 2.158379 0.076610 28.17358 0.0000CL_ABS 1.204653 0.295476 4.076985 0.0000CL_BV 1.457173 0.292212 4.986704 0.0000
CL_CCS 1.311247 0.329339 3.981447 0.0001CL_CRR 3.706405 0.498327 7.437704 0.0000CL_DNV 1.402495 0.295897 4.739813 0.0000CL_GL 1.236372 0.295490 4.184141 0.0000
CL_HEL 2.506026 0.337051 7.435146 0.0000CL_KRS 1.974537 0.346740 5.694581 0.0000CL_LR 1.317811 0.287180 4.588793 0.0000
CL_NCL 1.102077 0.284640 3.871832 0.0001CL_NKK 1.169648 0.293507 3.985080 0.0001CL_PRS 2.362387 0.416834 5.667447 0.0000CL_RIN 1.079326 0.380013 2.840238 0.0045CL_RMS 1.532007 0.318685 4.807282 0.0000CL_RRR 1.711612 0.561667 3.047382 0.0023CL_TLL 1.342912 0.514616 2.609543 0.0091CL_VRS 2.256384 0.495766 4.551311 0.0000FL_AE 4.149804 0.433652 9.569437 0.0000FL_AG 1.838566 0.278182 6.609221 0.0000FL_AN 5.608286 0.725942 7.725529 0.0000FL_AU 5.631484 0.723772 7.780747 0.0000FL_BB 4.933665 0.626587 7.873869 0.0000FL_BE 3.893763 0.766928 5.077092 0.0000FL_BG 2.685595 0.764053 3.514931 0.0004FL_BS 1.759789 0.275944 6.377345 0.0000FL_BZ 2.119129 0.317121 6.682398 0.0000FL_CA 6.898436 0.567459 12.15672 0.0000FL_CH 5.370431 0.909441 5.905199 0.0000FL_CI -0.620512 0.083064 -7.470320 0.0000FL_CL 3.994457 0.798261 5.003948 0.0000

67
FL_CN 0.777765 0.318388 2.442818 0.0146FL_CY 2.544963 0.333703 7.626440 0.0000FL_DE 5.972199 0.570626 10.46605 0.0000FL_DK 3.153448 0.386906 8.150430 0.0000FL_DZ 1.267793 0.430365 2.945859 0.0032FL_EE 2.484665 0.581987 4.269282 0.0000FL_EG 2.697314 0.473018 5.702354 0.0000FL_ES 3.974581 0.506615 7.845370 0.0000FL_FI 6.080535 0.741642 8.198752 0.0000FL_FR 4.397584 0.605152 7.266913 0.0000FL_FO 7.237445 1.059427 6.831470 0.0000FL_GI 2.484202 0.676733 3.670873 0.0002FL_GR 3.742477 0.314934 11.88337 0.0000FL_HK 3.350857 0.556536 6.020920 0.0000FL_IE 5.284034 0.654636 8.071714 0.0000FL_IM 5.420643 0.650410 8.334199 0.0000FL_IN 3.044888 0.363502 8.376536 0.0000FL_IR 1.197281 0.364148 3.287893 0.0010FL_IT 3.305025 0.403428 8.192352 0.0000FL_JP 5.178334 0.436476 11.86395 0.0000FL_KH 2.007363 0.292492 6.862967 0.0000FL_KR 2.740739 0.366186 7.484554 0.0000FL_KW 3.304806 0.540381 6.115694 0.0000FL_LR 1.044934 0.258157 4.047670 0.0001FL_LU 4.551713 0.803656 5.663762 0.0000FL_MA 1.587842 0.533334 2.977199 0.0029FL_MH 3.340688 0.611796 5.460458 0.0000FL_MT 5.942110 0.556128 10.68479 0.0000FL_MY 2.382863 0.358829 6.640672 0.0000FL_NIS 6.008787 0.626406 9.592484 0.0000FL_NL 5.154772 0.581143 8.870055 0.0000FL_NO 5.967297 0.626447 9.525626 0.0000FL_NZ 5.648706 0.969468 5.826603 0.0000FL_PA 1.200002 0.202225 5.933991 0.0000FL_PT 2.273818 0.523192 4.346050 0.0000FL_RO 1.583088 0.473523 3.343211 0.0008FL_RU 0.975368 0.298556 3.266955 0.0011FL_SE 5.650561 0.675426 8.365922 0.0000FL_SG 4.701044 0.647508 7.260205 0.0000FL_ST 2.780440 0.428527 6.488363 0.0000FL_TR 0.756630 0.298769 2.532494 0.0113FL_UK 6.162960 0.587306 10.49361 0.0000FL_US 4.881812 0.484951 10.06662 0.0000FL_VC 1.452105 0.243401 5.965899 0.0000FL_VU 1.599494 0.479847 3.333343 0.0009
OW_EMN 1.929815 0.191901 10.05632 0.0000OW_IOR 2.442122 0.214462 11.38722 0.0000OW_OOR 2.777308 0.225334 12.32530 0.0000OW_TMN 2.641438 0.181311 14.56851 0.0000LI_FLRET -0.180436 0.016916 -10.66689 0.0000
SY_BE 2.213023 0.344335 6.426948 0.0000
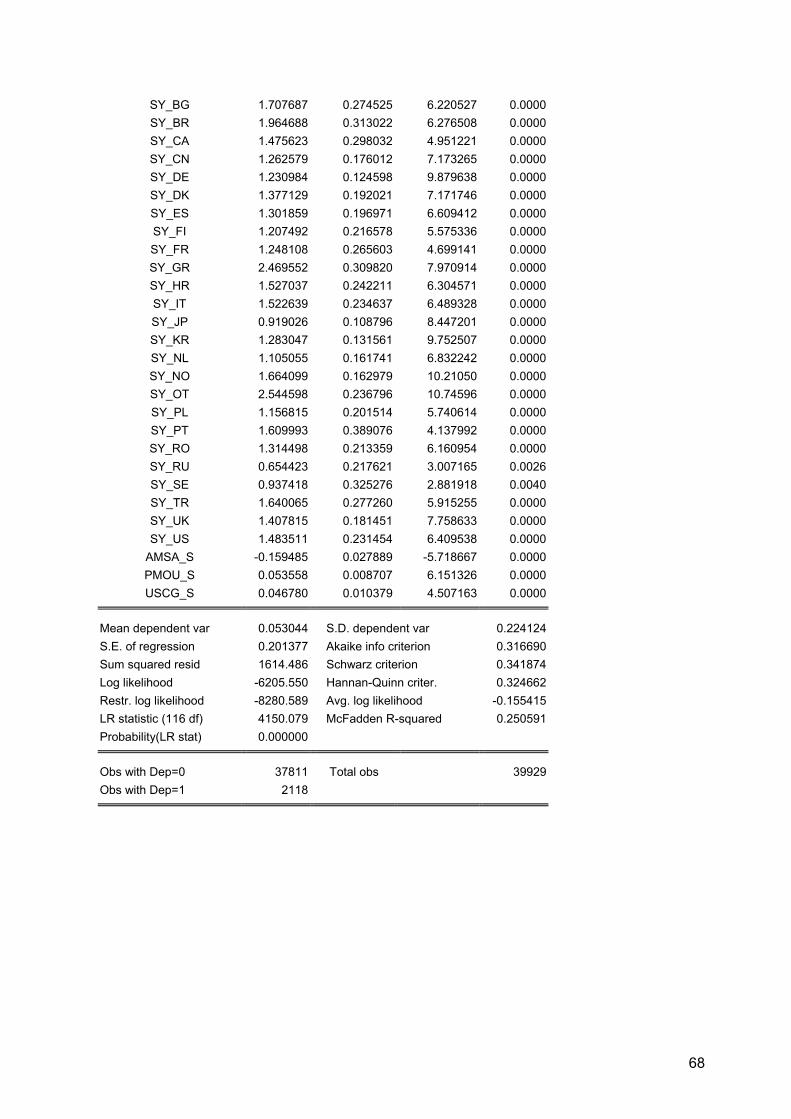
68
SY_BG 1.707687 0.274525 6.220527 0.0000SY_BR 1.964688 0.313022 6.276508 0.0000SY_CA 1.475623 0.298032 4.951221 0.0000SY_CN 1.262579 0.176012 7.173265 0.0000SY_DE 1.230984 0.124598 9.879638 0.0000SY_DK 1.377129 0.192021 7.171746 0.0000SY_ES 1.301859 0.196971 6.609412 0.0000SY_FI 1.207492 0.216578 5.575336 0.0000SY_FR 1.248108 0.265603 4.699141 0.0000SY_GR 2.469552 0.309820 7.970914 0.0000SY_HR 1.527037 0.242211 6.304571 0.0000SY_IT 1.522639 0.234637 6.489328 0.0000SY_JP 0.919026 0.108796 8.447201 0.0000SY_KR 1.283047 0.131561 9.752507 0.0000SY_NL 1.105055 0.161741 6.832242 0.0000SY_NO 1.664099 0.162979 10.21050 0.0000SY_OT 2.544598 0.236796 10.74596 0.0000SY_PL 1.156815 0.201514 5.740614 0.0000SY_PT 1.609993 0.389076 4.137992 0.0000SY_RO 1.314498 0.213359 6.160954 0.0000SY_RU 0.654423 0.217621 3.007165 0.0026SY_SE 0.937418 0.325276 2.881918 0.0040SY_TR 1.640065 0.277260 5.915255 0.0000SY_UK 1.407815 0.181451 7.758633 0.0000SY_US 1.483511 0.231454 6.409538 0.0000
AMSA_S -0.159485 0.027889 -5.718667 0.0000PMOU_S 0.053558 0.008707 6.151326 0.0000USCG_S 0.046780 0.010379 4.507163 0.0000
Mean dependent var 0.053044 S.D. dependent var 0.224124S.E. of regression 0.201377 Akaike info criterion 0.316690Sum squared resid 1614.486 Schwarz criterion 0.341874Log likelihood -6205.550 Hannan-Quinn criter. 0.324662Restr. log likelihood -8280.589 Avg. log likelihood -0.155415LR statistic (116 df) 4150.079 McFadden R-squared 0.250591Probability(LR stat) 0.000000
Obs with Dep=0 37811 Total obs 39929Obs with Dep=1 2118

69
Dependent Variable: CASUALTY Method: ML - Binary Logit (Quadratic hill climbing) Date: 04/27/06 Time: 10:38 Sample: 1 48470 IF EXCESSOB=0 AND ST7_MAX=0 AND OUTLIER=0 AND CAS_FERRIES=0 Included observations: 39929 Andrews and Hosmer-Lemeshow Goodness-of-Fit Tests Grouping based upon predicted risk (randomize ties)
Quantile of Risk Dep=0 Dep=1 Total H-L Low High Actual Expect Actual Expect Obs Value
1 1.E-05 0.0020 3991 3987.56 1 4.43652 3992 2.66488 2 0.0020 0.0047 3974 3979.50 19 13.4998 3993 2.24851 3 0.0047 0.0083 3962 3966.64 31 26.3609 3993 0.82183 4 0.0083 0.0135 3946 3950.09 47 42.9095 3993 0.39417 5 0.0135 0.0204 3912 3927.14 81 65.8568 3993 3.54046 6 0.0204 0.0319 3877 3889.60 116 103.400 3993 1.57617 7 0.0319 0.0479 3814 3834.32 179 158.676 3993 2.71099 8 0.0479 0.0741 3773 3758.92 220 234.076 3993 0.89910 9 0.0742 0.1210 3626 3607.65 367 385.351 3993 0.96730
10 0.1210 0.9941 2936 2909.57 1057 1083.43 3993 0.88507
Total 37811 37811.0 2118 2118.00 39929 16.7085
H-L Statistic: 16.7085 Prob. Chi-Sq(8) 0.0333 Andrews Statistic: 74.1985 Prob. Chi-Sq(10) 0.0000
Dependent Variable: CASUALTY Method: ML - Binary Logit (Quadratic hill climbing) Date: 04/27/06 Time: 10:38 Sample: 1 48470 IF EXCESSOB=0 AND ST7_MAX=0 AND OUTLIER=0 AND CAS_FERRIES=0 Included observations: 39929 Prediction Evaluation (success cutoff C = 0.053)
Estimated Equation Constant Probability Dep=0 Dep=1 Total Dep=0 Dep=1 Total
P(Dep=1)<=C 28769 542 29311 0 0 0P(Dep=1)>C 9042 1576 10618 37811 2118 39929
Total 37811 2118 39929 37811 2118 39929Correct 28769 1576 30345 0 2118 2118
% Correct 76.09 74.41 76.00 0.00 100.00 5.30% Incorrect 23.91 25.59 24.00 100.00 0.00 94.70Total Gain* 76.09 -25.59 70.69
Percent Gain** 76.09 NA 74.65

70
-4
0
4
8
12
16
20
24
28
32
10009 20000 30000 40000
Standardized (Pearson) Residuals

71
Appendix 24: Results of Regression: Fishing Fleet (above 400gt) Dependent Variable: CASUALTY Method: ML - Binary Logit (Quadratic hill climbing) Date: 05/04/06 Time: 18:28 Sample: 1 6666 IF FISH_CAS=0 AND OUTLIER2=0 Included observations: 6289 Convergence achieved after 7 iterations QML (Huber/White) standard errors & covariance
Variable Coefficient Std. Error z-Statistic Prob.
C -4.453866 0.152841 -29.14046 0.0000CLWD_D 10.25721 1.915184 5.355734 0.0000OWCHGD 5.227738 0.602226 8.680697 0.0000
CL_BV 0.738830 0.354451 2.084435 0.0371CL_CCO 3.299891 1.137701 2.900490 0.0037FL_BZ 1.647911 0.563364 2.925124 0.0034FL_CA 2.611569 0.458237 5.699162 0.0000FL_DE 3.018409 0.792268 3.809832 0.0001FL_FR 2.375173 0.451581 5.259680 0.0000FL_GR 3.620932 0.807403 4.484664 0.0000FL_NL 2.664820 0.358722 7.428656 0.0000FL_NO 1.483681 0.337163 4.400490 0.0000FL_US 1.304832 0.413060 3.158942 0.0016
OW_UNKN -2.714024 0.398907 -6.803655 0.0000SY_UN 7.812672 0.993658 7.862533 0.0000
PSC_INSP -6.007325 1.416856 -4.239897 0.0000
Mean dependent var 0.025441 S.D. dependent var 0.157474S.E. of regression 0.124985 Akaike info criterion 0.147310Sum squared resid 97.99257 Schwarz criterion 0.164474Log likelihood -447.2170 Hannan-Quinn criter. 0.153257Restr. log likelihood -745.3686 Avg. log likelihood -0.071111LR statistic (15 df) 596.3032 McFadden R-squared 0.400006Probability(LR stat) 0.000000
Obs with Dep=0 6129 Total obs 6289Obs with Dep=1 160

72
Dependent Variable: CASUALTY Method: ML - Binary Logit (Quadratic hill climbing) Date: 05/04/06 Time: 18:28 Sample: 1 6666 IF FISH_CAS=0 AND OUTLIER2=0 Included observations: 6289 Andrews and Hosmer-Lemeshow Goodness-of-Fit Tests Grouping based upon predicted risk (randomize ties)
Quantile of Risk Dep=0 Dep=1 Total HL Low High Actual Expect Actual Expect Obs Value
1 2.E-06 0.0008 626 627.588 2 0.41164 628 6.13297 2 0.0008 0.0008 628 628.515 1 0.48455 629 0.54873 3 0.0008 0.0034 629 628.161 0 0.83897 629 0.84009 4 0.0034 0.0115 623 623.076 6 5.92412 629 0.00098 5 0.0115 0.0115 625 621.767 4 7.23333 629 1.46212 6 0.0115 0.0115 617 621.767 12 7.23333 629 3.17772 7 0.0115 0.0115 625 621.767 4 7.23333 629 1.46212 8 0.0115 0.0115 624 621.767 5 7.23333 629 0.69757 9 0.0115 0.0411 612 615.415 17 13.5855 629 0.87713
10 0.0411 1.0000 520 519.178 109 109.822 629 0.00745
Total 6129 6129.00 160 160.000 6289 15.2069
H-L Statistic: 15.2069 Prob. Chi-Sq(8) 0.0552Andrews Statistic: 456.6065 Prob. Chi-Sq(10) 0.0000
Dependent Variable: CASUALTY Method: ML - Binary Logit (Quadratic hill climbing) Date: 05/04/06 Time: 18:28 Sample: 1 6666 IF FISH_CAS=0 AND OUTLIER2=0 Included observations: 6289 Prediction Evaluation (success cutoff C = 0.025)
Estimated Equation Constant Probability Dep=0 Dep=1 Total Dep=0 Dep=1 Total
P(Dep=1)<=C 5515 46 5561 0 0 0P(Dep=1)>C 614 114 728 6129 160 6289
Total 6129 160 6289 6129 160 6289Correct 5515 114 5629 0 160 160
% Correct 89.98 71.25 89.51 0.00 100.00 2.54% Incorrect 10.02 28.75 10.49 100.00 0.00 97.46Total Gain* 89.98 -28.75 86.96
Percent Gain** 89.98 NA 89.23

73

74
Appendix 25: Probability of Casualty per DoC Country of Residence
Probability of Casualty (Very Serious and Serious)
0.000 0.005 0.010 0.015 0.020 0.025 0.030
Cyprus
Azerbaijan
Isle of Man
Denmark
Canada
Sweden
Irish Republic
Monaco
United Kingdom
Norway
Unknown
Latvia
Australia
Germany
Malta
Netherlands
Lithuania
UAE
Thailand
USA
Hong Kong
Malaysia
Italy
Croatia
Brazil
Switzerland
Greece
India
Philippines
Spain
Singapore
Belgium
Bahamas
Chile

75
Appendix 26: LM-Test Type I (Very Serious) and Type II Models Type I: Very Serious Casualties - Age Dependent Variable: BRMR_Y Method: Least Squares Date: 05/30/06 Time: 17:18 Sample: 1 6007 IF ST5_MAX=0 AND CMOU_AV=0 Included observations: 5826
Variable Coefficient Std. Error t-Statistic Prob.
FAC 3.816158 2.248451 1.697239 0.0897ST3_MAX*FAC -0.688024 0.594013 -1.158263 0.2468
LNAGE*FAC 0.856866 0.472976 1.811650 0.0701LNTON*FAC -0.342561 0.191535 -1.788503 0.0737OWCHD*FAC -0.459591 0.345862 -1.328829 0.1840RS_2S*FAC 0.691854 0.415730 1.664189 0.0961RS_3S*FAC 0.883220 0.549765 1.606540 0.1082RS_4S*FAC 1.328754 0.836747 1.588000 0.1123RS_5S*FAC 1.275832 1.062454 1.200835 0.2299
VMOU_AV*FAC 1.042776 0.671201 1.553597 0.1203CL_CRR*FAC -1.752671 1.456234 -1.203565 0.2288CL_RIP*FAC -2.790060 1.865696 -1.495453 0.1349CL_RNR*FAC -3.035841 1.982525 -1.531301 0.1257FL_AG*FAC -1.002843 0.662349 -1.514070 0.1301FL_BB*FAC -1.377179 1.395092 -0.987160 0.3236FL_BR*FAC -2.577928 1.834607 -1.405166 0.1600FL_DK*FAC -0.843540 0.706944 -1.193220 0.2328FL_KR*FAC -1.396368 1.033025 -1.351728 0.1765FL_LT*FAC -1.874441 1.325640 -1.413989 0.1574FL_TR*FAC -0.956142 0.640660 -1.492433 0.1356
C_1800S*FAC -0.344962 0.286488 -1.204106 0.2286LI_OWRET*FAC -0.067387 0.051240 -1.315138 0.1885OW_OUK*FAC -2.249439 1.318023 -1.706677 0.0879
LNAGE*(-XB)*FAC -0.224472 0.116523 -1.926428 0.0541
R-squared 0.000619 Mean dependent var 0.004756Adjusted R-squared -0.003342 S.D. dependent var 1.069765S.E. of regression 1.071551 Akaike info criterion 2.980202Sum squared resid 6661.980 Schwarz criterion 3.007679Log likelihood -8657.329 Durbin-Watson stat 2.062138

76
Type I: Very Serious Casualties - Tonnage Dependent Variable: BRMR_Y Method: Least Squares Date: 05/30/06 Time: 17:21 Sample: 1 6007 IF ST5_MAX=0 AND CMOU_AV=0 Included observations: 5826
Variable Coefficient Std. Error t-Statistic Prob.
FAC -4.277321 2.510763 -1.703594 0.0885ST3_MAX*FAC 1.262280 0.822057 1.535514 0.1247
LNAGE*FAC -0.302720 0.227535 -1.330430 0.1834LNTON*FAC 0.107195 0.091181 1.175628 0.2398OWCHD*FAC 0.615127 0.411925 1.493297 0.1354RS_2S*FAC -0.875860 0.510625 -1.715272 0.0863RS_3S*FAC -1.219137 0.715719 -1.703375 0.0886RS_4S*FAC -2.330176 1.326461 -1.756687 0.0790RS_5S*FAC -2.911103 1.756744 -1.657102 0.0976
VMOU_AV*FAC -1.207598 0.754851 -1.599782 0.1097CL_CRR*FAC 1.966090 1.544596 1.272883 0.2031CL_RIP*FAC 3.119344 2.033283 1.534142 0.1250CL_RNR*FAC 3.425904 2.182950 1.569392 0.1166FL_AG*FAC 1.187037 0.752388 1.577692 0.1147FL_BB*FAC 1.578585 1.462801 1.079153 0.2806FL_BR*FAC 3.345773 2.177136 1.536777 0.1244FL_DK*FAC 1.070293 0.794926 1.346404 0.1782FL_KR*FAC 1.899741 1.249839 1.519988 0.1286FL_LT*FAC 2.178138 1.466937 1.484821 0.1376FL_TR*FAC 1.070821 0.698779 1.532416 0.1255
C_1800S*FAC 0.445996 0.325958 1.368263 0.1713LI_OWRET*FAC 0.085394 0.058852 1.450997 0.1468OW_OUK*FAC 2.841596 1.629914 1.743403 0.0813
LNTON*(-XB)*FAC 0.099291 0.052795 1.880703 0.0601
R-squared 0.000589 Mean dependent var 0.004756Adjusted R-squared -0.003372 S.D. dependent var 1.069765S.E. of regression 1.071567 Akaike info criterion 2.980232Sum squared resid 6662.180 Schwarz criterion 3.007709Log likelihood -8657.416 Durbin-Watson stat 2.062354

77
Type II: Combined Model - Age Dependent Variable: BRMR_Y Method: Least Squares Date: 06/23/06 Time: 14:45 Sample: 1 52150 Included observations: 52150
Variable Coefficient Std. Error t-Statistic Prob.
FAC 0.802483 0.542158 1.480166 0.1388ST1_MAX*FAC -0.055114 0.104687 -0.526465 0.5986ST3_MAX*FAC -0.191784 0.160979 -1.191359 0.2335ST4_MAX*FAC -0.065201 0.123207 -0.529198 0.5967ST5_MAX*FAC -0.464292 0.276618 -1.678459 0.0933
LNAGE*FAC 0.282333 0.142524 1.980942 0.0476LNTON*FAC -0.101391 0.059035 -1.717479 0.0859
ST_CHDGC*FAC -0.112992 0.085962 -1.314434 0.1887RS_2S*FAC 0.231018 0.130246 1.773708 0.0761RS_3S*FAC 0.260911 0.151103 1.726713 0.0842RS_4S*FAC 0.495869 0.268861 1.844333 0.0651RS_5S*FAC 0.618580 0.374182 1.653152 0.0983
DH*FAC -0.072933 0.138917 -0.525011 0.5996LNTIMEBW*FAC -0.024097 0.025575 -0.942221 0.3461
CL_BV*FAC 0.076292 0.101528 0.751431 0.4524CL_HEL*FAC 0.465924 0.628728 0.741058 0.4587FL_AG*FAC -0.103477 0.130718 -0.791607 0.4286FL_BH*FAC -0.488965 1.499745 -0.326032 0.7444FL_BS*FAC -0.074702 0.126477 -0.590642 0.5548FL_CA*FAC -0.660126 0.471895 -1.398884 0.1619FL_DE*FAC -0.159733 0.254910 -0.626624 0.5309FL_GI*FAC -0.219494 0.356653 -0.615428 0.5383FL_IM*FAC -0.123927 0.280042 -0.442530 0.6581FL_KR*FAC -0.212736 0.422223 -0.503848 0.6144FL_RU*FAC 0.280691 0.304270 0.922507 0.3563FL_ST*FAC -0.413538 0.622629 -0.664181 0.5066
OW_EMN*FAC 0.065538 0.085435 0.767110 0.4430C_0400S3*FAC 0.135533 0.264393 0.512620 0.6082C_0700S1*FAC -0.011850 0.012397 -0.955919 0.3391C_0900S3*FAC -0.019664 0.028536 -0.689103 0.4908C_1200S1*FAC 0.013908 0.018527 0.750688 0.4528C_1200S4*FAC -0.032308 0.041020 -0.787596 0.4309C_1400S2*FAC -0.010947 0.010645 -1.028362 0.3038C_2000S1*FAC 0.026954 0.037100 0.726527 0.4675C_2500S1*FAC -0.010139 0.020403 -0.496968 0.6192C_2500S4*FAC -0.029720 0.045217 -0.657285 0.5110AMSA_AV*FAC 0.093556 0.175380 0.533446 0.5937IMOU_AV*FAC 0.322921 0.286854 1.125730 0.2603USCG_AV*FAC 0.084551 0.132922 0.636097 0.5247VMOU_AV*FAC 0.181581 0.181086 1.002733 0.3160
LNAGE*(-XB)*FAC -0.078366 0.037127 -2.110739 0.0348
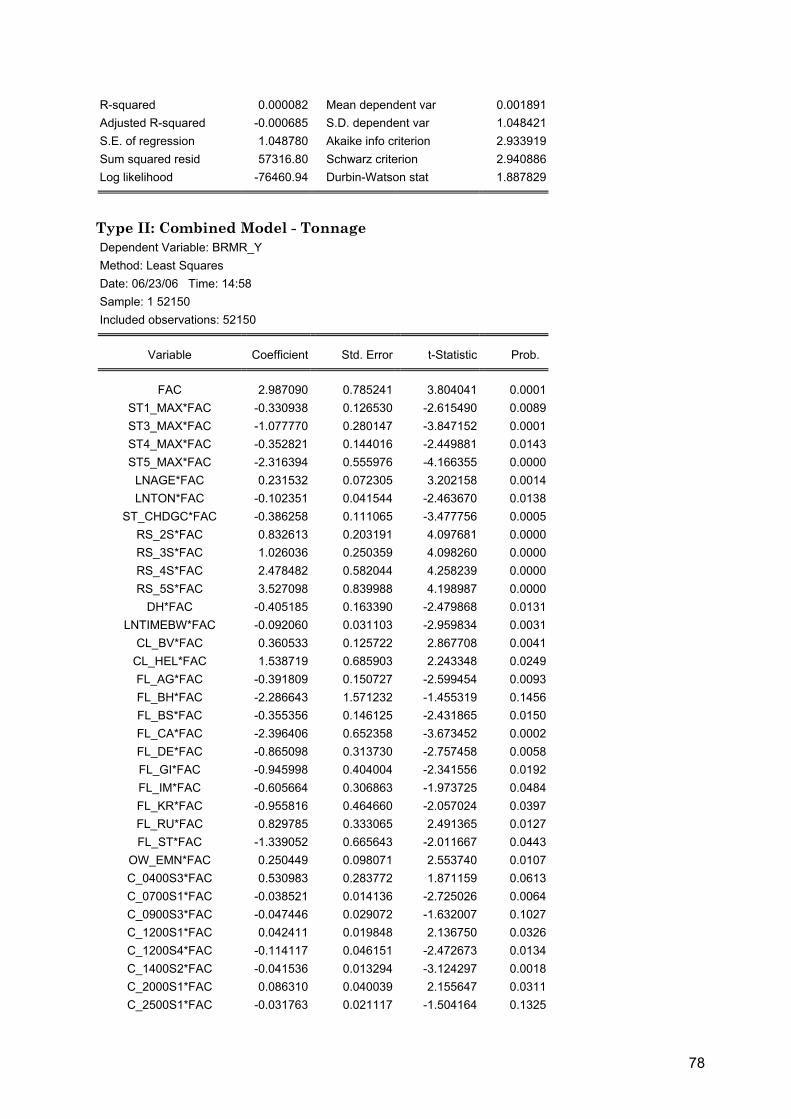
78
R-squared 0.000082 Mean dependent var 0.001891Adjusted R-squared -0.000685 S.D. dependent var 1.048421S.E. of regression 1.048780 Akaike info criterion 2.933919Sum squared resid 57316.80 Schwarz criterion 2.940886Log likelihood -76460.94 Durbin-Watson stat 1.887829
Type II: Combined Model - Tonnage Dependent Variable: BRMR_Y Method: Least Squares Date: 06/23/06 Time: 14:58 Sample: 1 52150 Included observations: 52150
Variable Coefficient Std. Error t-Statistic Prob.
FAC 2.987090 0.785241 3.804041 0.0001ST1_MAX*FAC -0.330938 0.126530 -2.615490 0.0089ST3_MAX*FAC -1.077770 0.280147 -3.847152 0.0001ST4_MAX*FAC -0.352821 0.144016 -2.449881 0.0143ST5_MAX*FAC -2.316394 0.555976 -4.166355 0.0000
LNAGE*FAC 0.231532 0.072305 3.202158 0.0014LNTON*FAC -0.102351 0.041544 -2.463670 0.0138
ST_CHDGC*FAC -0.386258 0.111065 -3.477756 0.0005RS_2S*FAC 0.832613 0.203191 4.097681 0.0000RS_3S*FAC 1.026036 0.250359 4.098260 0.0000RS_4S*FAC 2.478482 0.582044 4.258239 0.0000RS_5S*FAC 3.527098 0.839988 4.198987 0.0000
DH*FAC -0.405185 0.163390 -2.479868 0.0131LNTIMEBW*FAC -0.092060 0.031103 -2.959834 0.0031
CL_BV*FAC 0.360533 0.125722 2.867708 0.0041CL_HEL*FAC 1.538719 0.685903 2.243348 0.0249FL_AG*FAC -0.391809 0.150727 -2.599454 0.0093FL_BH*FAC -2.286643 1.571232 -1.455319 0.1456FL_BS*FAC -0.355356 0.146125 -2.431865 0.0150FL_CA*FAC -2.396406 0.652358 -3.673452 0.0002FL_DE*FAC -0.865098 0.313730 -2.757458 0.0058FL_GI*FAC -0.945998 0.404004 -2.341556 0.0192FL_IM*FAC -0.605664 0.306863 -1.973725 0.0484FL_KR*FAC -0.955816 0.464660 -2.057024 0.0397FL_RU*FAC 0.829785 0.333065 2.491365 0.0127FL_ST*FAC -1.339052 0.665643 -2.011667 0.0443
OW_EMN*FAC 0.250449 0.098071 2.553740 0.0107C_0400S3*FAC 0.530983 0.283772 1.871159 0.0613C_0700S1*FAC -0.038521 0.014136 -2.725026 0.0064C_0900S3*FAC -0.047446 0.029072 -1.632007 0.1027C_1200S1*FAC 0.042411 0.019848 2.136750 0.0326C_1200S4*FAC -0.114117 0.046151 -2.472673 0.0134C_1400S2*FAC -0.041536 0.013294 -3.124297 0.0018C_2000S1*FAC 0.086310 0.040039 2.155647 0.0311C_2500S1*FAC -0.031763 0.021117 -1.504164 0.1325

79
C_2500S4*FAC -0.094432 0.048091 -1.963593 0.0496AMSA_AV*FAC 0.474735 0.201463 2.356430 0.0185IMOU_AV*FAC 1.207106 0.367651 3.283291 0.0010USCG_AV*FAC 0.245800 0.138647 1.772845 0.0763VMOU_AV*FAC 0.755109 0.235039 3.212695 0.0013
LNTON*(-XB)*FAC -0.096752 0.022141 -4.369893 0.0000
R-squared 0.000363 Mean dependent var 0.001891Adjusted R-squared -0.000404 S.D. dependent var 1.048421S.E. of regression 1.048633 Akaike info criterion 2.933638Sum squared resid 57300.70 Schwarz criterion 2.940605Log likelihood -76453.61 Durbin-Watson stat 1.888229

80
Appendix 27: Matching Models: Type I Models 6 months- Very Serious Dependent Variable: TOTALCAS Method: ML - Binary Logit (Quadratic hill climbing) Date: 05/30/06 Time: 16:23 Sample: 1 6007 IF ST5_MAX=0 AND CMOU_AV=0 Included observations: 5826 Convergence achieved after 7 iterations QML (Huber/White) standard errors & covariance
Variable Coefficient Std. Error z-Statistic Prob.
C -8.131409 0.966171 -8.416118 0.0000ST3_MAX 1.315392 0.456566 2.881057 0.0040
LNAGE -0.366059 0.119815 -3.055207 0.0022LNTON 0.475650 0.065115 7.304805 0.0000OWCHD 0.702768 0.245771 2.859440 0.0042RS_2S -1.001358 0.194661 -5.144104 0.0000RS_3S -1.344727 0.287850 -4.671626 0.0000RS_4S -2.499658 0.408670 -6.116572 0.0000RS_5S -3.005631 0.765229 -3.927752 0.0001
VMOU_AV -1.381298 0.353008 -3.912941 0.0001CL_CRR 2.738680 0.775992 3.529261 0.0004CL_RIP 4.005732 0.909348 4.405061 0.0000CL_RNR 4.173554 0.903595 4.618832 0.0000FL_AG 1.488832 0.390656 3.811107 0.0001FL_BB 2.060601 0.785528 2.623204 0.0087FL_BR 3.683345 1.176175 3.131631 0.0017FL_DK 1.325811 0.509765 2.600825 0.0093FL_KR 2.127879 0.777016 2.738528 0.0062FL_LT 2.762602 0.868769 3.179903 0.0015FL_TR 1.381422 0.366013 3.774246 0.0002
C_1800S 0.503767 0.174895 2.880395 0.0040LI_OWRET 0.102830 0.034406 2.988733 0.0028OW_OUK 3.363223 0.570478 5.895451 0.0000
Mean dependent var 0.027635 S.D. dependent var 0.163938S.E. of regression 0.157107 Akaike info criterion 0.218708Sum squared resid 143.2335 Schwarz criterion 0.245040Log likelihood -614.0955 Hannan-Quinn criter. 0.227866Restr. log likelihood -736.5324 Avg. log likelihood -0.105406LR statistic (22 df) 244.8738 McFadden R-squared 0.166234Probability(LR stat) 0.000000
Obs with Dep=0 5665 Total obs 5826Obs with Dep=1 161

81
Dependent Variable: TOTALCAS Method: ML - Binary Logit (Quadratic hill climbing) Date: 05/30/06 Time: 16:23 Sample: 1 6007 IF ST5_MAX=0 AND CMOU_AV=0 Included observations: 5826 Andrews and Hosmer-Lemeshow Goodness-of-Fit Tests Grouping based upon predicted risk (randomize ties)
Quantile of Risk Dep=0 Dep=1 Total H-L Low High Actual Expect Actual Expect Obs Value
1 0.0003 0.0027 580 581.031 2 0.96937 582 1.09758 2 0.0027 0.0048 581 580.811 2 2.18867 583 0.01633 3 0.0048 0.0065 578 578.706 4 3.29357 582 0.15238 4 0.0065 0.0090 576 578.525 7 4.47538 583 1.43518 5 0.0090 0.0129 577 576.723 6 6.27668 583 0.01233 6 0.0129 0.0185 570 572.990 12 9.01004 582 1.00782 7 0.0185 0.0243 575 570.580 8 12.4197 583 1.60702 8 0.0243 0.0370 567 564.260 15 17.7401 582 0.43655 9 0.0370 0.0658 562 553.671 21 29.3294 583 2.49081
10 0.0662 0.8278 499 507.703 84 75.2971 583 1.15507
Total 5665 5665.00 161 161.000 5826 9.41107
H-L Statistic: 9.4111 Prob. Chi-Sq(8) 0.3088Andrews Statistic: 11.4298 Prob. Chi-Sq(10) 0.3250
Dependent Variable: TOTALCAS Method: ML - Binary Logit (Quadratic hill climbing) Date: 05/30/06 Time: 16:23 Sample: 1 6007 IF ST5_MAX=0 AND CMOU_AV=0 Included observations: 5826 Prediction Evaluation (success cutoff C = 0.0276)
Estimated Equation Constant Probability Dep=0 Dep=1 Total Dep=0 Dep=1 Total
P(Dep=1)<=C 4188 46 4234 0 0 0P(Dep=1)>C 1477 115 1592 5665 161 5826
Total 5665 161 5826 5665 161 5826Correct 4188 115 4303 0 161 161
% Correct 73.93 71.43 73.86 0.00 100.00 2.76% Incorrect 26.07 28.57 26.14 100.00 0.00 97.24Total Gain* 73.93 -28.57 71.10
Percent Gain** 73.93 NA 73.12
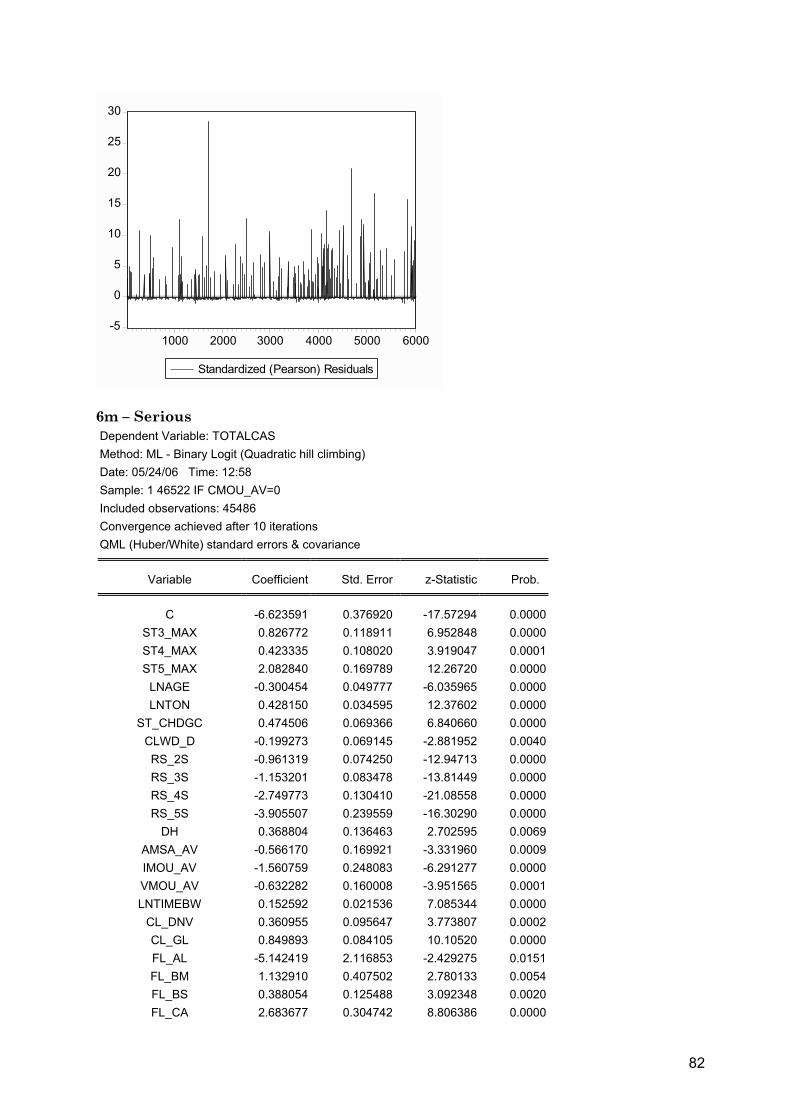
82
-5
0
5
10
15
20
25
30
1000 2000 3000 4000 5000 6000
Standardized (Pearson) Residuals
6m – Serious Dependent Variable: TOTALCAS Method: ML - Binary Logit (Quadratic hill climbing) Date: 05/24/06 Time: 12:58 Sample: 1 46522 IF CMOU_AV=0 Included observations: 45486 Convergence achieved after 10 iterations QML (Huber/White) standard errors & covariance
Variable Coefficient Std. Error z-Statistic Prob.
C -6.623591 0.376920 -17.57294 0.0000ST3_MAX 0.826772 0.118911 6.952848 0.0000ST4_MAX 0.423335 0.108020 3.919047 0.0001ST5_MAX 2.082840 0.169789 12.26720 0.0000
LNAGE -0.300454 0.049777 -6.035965 0.0000LNTON 0.428150 0.034595 12.37602 0.0000
ST_CHDGC 0.474506 0.069366 6.840660 0.0000CLWD_D -0.199273 0.069145 -2.881952 0.0040RS_2S -0.961319 0.074250 -12.94713 0.0000RS_3S -1.153201 0.083478 -13.81449 0.0000RS_4S -2.749773 0.130410 -21.08558 0.0000RS_5S -3.905507 0.239559 -16.30290 0.0000
DH 0.368804 0.136463 2.702595 0.0069AMSA_AV -0.566170 0.169921 -3.331960 0.0009IMOU_AV -1.560759 0.248083 -6.291277 0.0000VMOU_AV -0.632282 0.160008 -3.951565 0.0001LNTIMEBW 0.152592 0.021536 7.085344 0.0000
CL_DNV 0.360955 0.095647 3.773807 0.0002CL_GL 0.849893 0.084105 10.10520 0.0000FL_AL -5.142419 2.116853 -2.429275 0.0151FL_BM 1.132910 0.407502 2.780133 0.0054FL_BS 0.388054 0.125488 3.092348 0.0020FL_CA 2.683677 0.304742 8.806386 0.0000
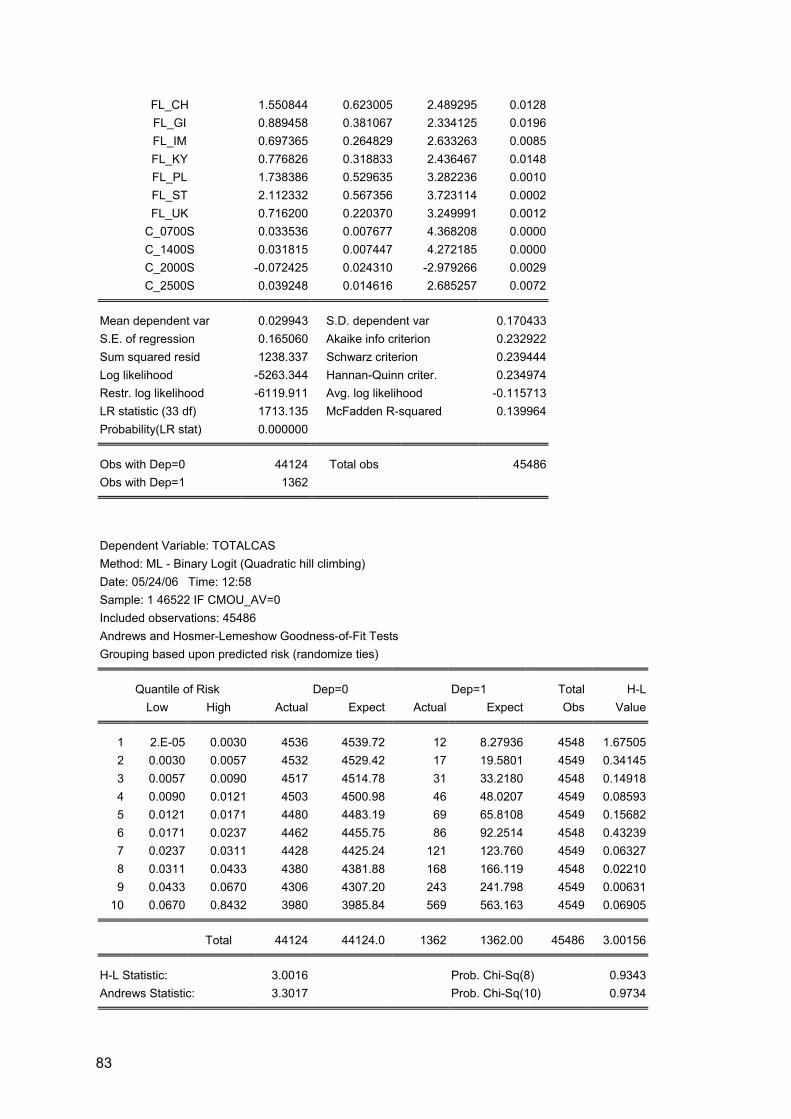
83
FL_CH 1.550844 0.623005 2.489295 0.0128FL_GI 0.889458 0.381067 2.334125 0.0196FL_IM 0.697365 0.264829 2.633263 0.0085FL_KY 0.776826 0.318833 2.436467 0.0148FL_PL 1.738386 0.529635 3.282236 0.0010FL_ST 2.112332 0.567356 3.723114 0.0002FL_UK 0.716200 0.220370 3.249991 0.0012
C_0700S 0.033536 0.007677 4.368208 0.0000C_1400S 0.031815 0.007447 4.272185 0.0000C_2000S -0.072425 0.024310 -2.979266 0.0029C_2500S 0.039248 0.014616 2.685257 0.0072
Mean dependent var 0.029943 S.D. dependent var 0.170433S.E. of regression 0.165060 Akaike info criterion 0.232922Sum squared resid 1238.337 Schwarz criterion 0.239444Log likelihood -5263.344 Hannan-Quinn criter. 0.234974Restr. log likelihood -6119.911 Avg. log likelihood -0.115713LR statistic (33 df) 1713.135 McFadden R-squared 0.139964Probability(LR stat) 0.000000
Obs with Dep=0 44124 Total obs 45486Obs with Dep=1 1362
Dependent Variable: TOTALCAS Method: ML - Binary Logit (Quadratic hill climbing) Date: 05/24/06 Time: 12:58 Sample: 1 46522 IF CMOU_AV=0 Included observations: 45486 Andrews and Hosmer-Lemeshow Goodness-of-Fit Tests Grouping based upon predicted risk (randomize ties)
Quantile of Risk Dep=0 Dep=1 Total H-L Low High Actual Expect Actual Expect Obs Value
1 2.E-05 0.0030 4536 4539.72 12 8.27936 4548 1.67505 2 0.0030 0.0057 4532 4529.42 17 19.5801 4549 0.34145 3 0.0057 0.0090 4517 4514.78 31 33.2180 4548 0.14918 4 0.0090 0.0121 4503 4500.98 46 48.0207 4549 0.08593 5 0.0121 0.0171 4480 4483.19 69 65.8108 4549 0.15682 6 0.0171 0.0237 4462 4455.75 86 92.2514 4548 0.43239 7 0.0237 0.0311 4428 4425.24 121 123.760 4549 0.06327 8 0.0311 0.0433 4380 4381.88 168 166.119 4548 0.02210 9 0.0433 0.0670 4306 4307.20 243 241.798 4549 0.00631
10 0.0670 0.8432 3980 3985.84 569 563.163 4549 0.06905
Total 44124 44124.0 1362 1362.00 45486 3.00156
H-L Statistic: 3.0016 Prob. Chi-Sq(8) 0.9343 Andrews Statistic: 3.3017 Prob. Chi-Sq(10) 0.9734

84
Dependent Variable: TOTALCAS Method: ML - Binary Logit (Quadratic hill climbing) Date: 05/24/06 Time: 12:58 Sample: 1 46522 IF CMOU_AV=0 Included observations: 45486 Prediction Evaluation (success cutoff C = 0.029943)
Estimated Equation Constant Probability Dep=0 Dep=1 Total Dep=0 Dep=1 Total
P(Dep=1)<=C 30886 363 31249 0 0 0P(Dep=1)>C 13238 999 14237 44124 1362 45486
Total 44124 1362 45486 44124 1362 45486Correct 30886 999 31885 0 1362 1362
% Correct 70.00 73.35 70.10 0.00 100.00 2.99% Incorrect 30.00 26.65 29.90 100.00 0.00 97.01Total Gain* 70.00 -26.65 67.10
Percent Gain** 70.00 NA 69.18
-10
0
10
20
30
40
50
60
70
10000 20000 30000 40000
Standardized (Pearson) Residuals

85
6 month - Less Serious Dependent Variable: TOTALCAS Method: ML - Binary Logit (Quadratic hill climbing) Date: 05/22/06 Time: 12:04 Sample: 1 28008 IF CMOU_AV=0 Included observations: 27411 Convergence achieved after 10 iterations QML (Huber/White) standard errors & covariance
Variable Coefficient Std. Error z-Statistic Prob.
C -7.425953 0.355822 -20.86983 0.0000ST3_MAX 0.462733 0.136248 3.396253 0.0007ST4_MAX 0.443063 0.116058 3.817600 0.0001ST5_MAX 1.733403 0.184055 9.417846 0.0000
DET_AMSA 0.764803 0.191423 3.995350 0.0001LNTON 0.337702 0.037472 9.012093 0.0000OWCHD 0.277172 0.102161 2.713082 0.0067
ST_CHDGC 0.579459 0.084296 6.874060 0.0000AMSA_AV -0.973242 0.233935 -4.160317 0.0000IMOU_AV -1.545097 0.355240 -4.349452 0.0000VMOU_AV -0.494673 0.205342 -2.409021 0.0160LNTIMEBW 0.114478 0.025498 4.489647 0.0000
RS_3S -0.306589 0.099377 -3.085114 0.0020RS_4S -0.365418 0.100622 -3.631608 0.0003RS_5S -0.493139 0.147355 -3.346597 0.0008CL_INC 2.281758 0.920734 2.478194 0.0132CL_LR 0.250316 0.099454 2.516892 0.0118FL_BB 1.022071 0.380614 2.685325 0.0072FL_BH 4.362188 1.385884 3.147585 0.0016FL_CA 2.533080 0.443200 5.715434 0.0000FL_EG 1.934990 0.435610 4.442022 0.0000FL_GE -3.507990 1.084069 -3.235948 0.0012FL_IR 1.136576 0.388430 2.926079 0.0034FL_SY -3.049523 1.054591 -2.891665 0.0038FL_UK 0.818191 0.240268 3.405333 0.0007
C_0900S 0.024972 0.007878 3.170072 0.0015C_1400S 0.023392 0.010582 2.210591 0.0271C_1700S 0.047355 0.015966 2.965966 0.0030OW_TMN 0.285909 0.086792 3.294167 0.0010
Mean dependent var 0.031374 S.D. dependent var 0.174330S.E. of regression 0.171646 Akaike info criterion 0.260000Sum squared resid 806.7374 Schwarz criterion 0.268695Log likelihood -3534.435 Hannan-Quinn criter. 0.262802Restr. log likelihood -3823.486 Avg. log likelihood -0.128942LR statistic (28 df) 578.1021 McFadden R-squared 0.075599Probability(LR stat) 0.000000
Obs with Dep=0 26551 Total obs 27411Obs with Dep=1 860

86
Dependent Variable: TOTALCAS Method: ML - Binary Logit (Quadratic hill climbing) Date: 05/22/06 Time: 12:04 Sample: 1 28008 IF CMOU_AV=0 Included observations: 27411 Andrews and Hosmer-Lemeshow Goodness-of-Fit Tests Grouping based upon predicted risk (randomize ties)
Quantile of Risk Dep=0 Dep=1 Total H-L Low High Actual Expect Actual Expect Obs Value
1 2.E-05 0.0095 2735 2728.26 6 12.7367 2741 3.57983 2 0.0095 0.0140 2706 2707.51 35 33.4913 2741 0.06881 3 0.0140 0.0168 2710 2698.70 31 42.2964 2741 3.06429 4 0.0168 0.0199 2693 2690.90 48 50.0994 2741 0.08961 5 0.0199 0.0235 2679 2681.69 62 59.3053 2741 0.12514 6 0.0235 0.0282 2674 2670.29 67 70.7110 2741 0.19991 7 0.0282 0.0345 2630 2656.03 111 84.9708 2741 8.22864 8 0.0345 0.0426 2635 2636.12 106 104.883 2741 0.01236 9 0.0426 0.0580 2599 2606.74 142 134.265 2741 0.46857
10 0.0580 0.8180 2490 2474.76 252 267.241 2742 0.96305
Total 26551 26551.0 860 860.000 27411 16.8002
H-L Statistic: 16.8002 Prob. Chi-Sq(8) 0.0323 Andrews Statistic: 36.3934 Prob. Chi-Sq(10) 0.0001
Dependent Variable: TOTALCAS Method: ML - Binary Logit (Quadratic hill climbing) Date: 05/22/06 Time: 12:04 Sample: 1 28008 IF CMOU_AV=0 Included observations: 27411 Prediction Evaluation (success cutoff C = 0.03137)
Estimated Equation Constant Probability Dep=0 Dep=1 Total Dep=0 Dep=1 Total
P(Dep=1)<=C 17708 313 18021 0 0 0P(Dep=1)>C 8843 547 9390 26551 860 27411
Total 26551 860 27411 26551 860 27411Correct 17708 547 18255 0 860 860
% Correct 66.69 63.60 66.60 0.00 100.00 3.14% Incorrect 33.31 36.40 33.40 100.00 0.00 96.86Total Gain* 66.69 -36.40 63.46
Percent Gain** 66.69 NA 65.52
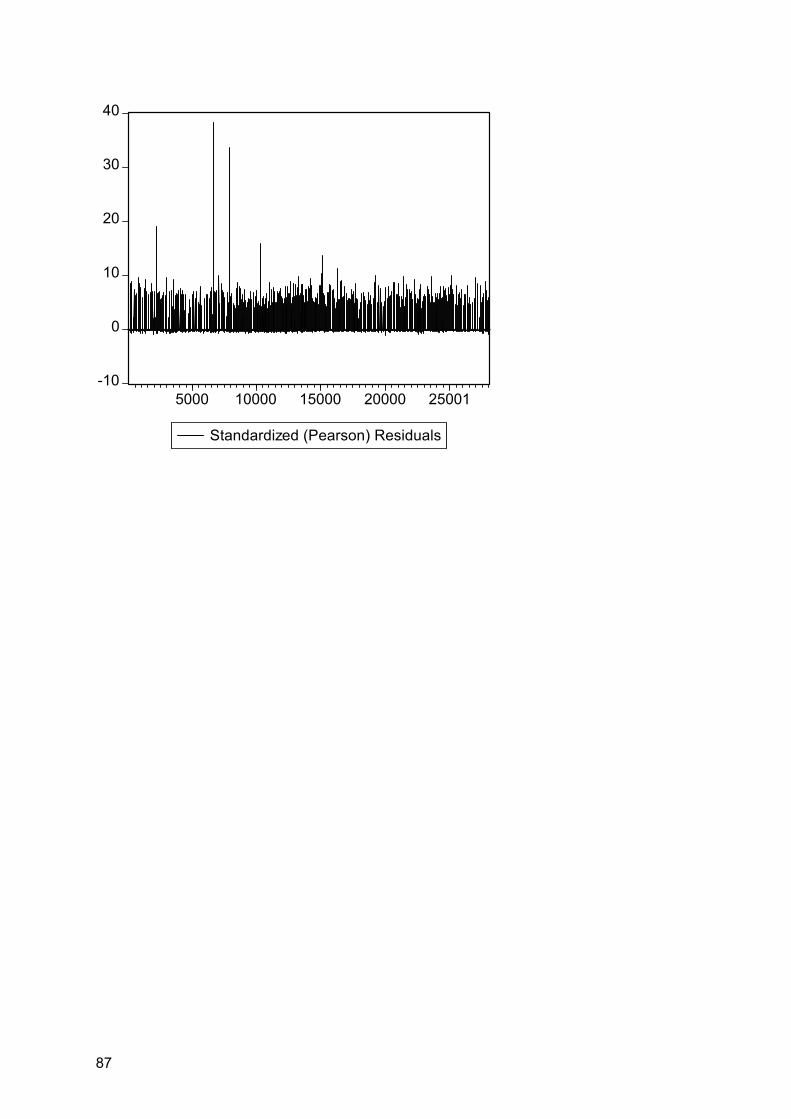
87
-10
0
10
20
30
40
5000 10000 15000 20000 25001
Standardized (Pearson) Residuals

88
Appendix 28: Matching Models: Type II Model Very Serious and Serious Combined Dependent Variable: TOTALCAS Method: ML - Binary Logit (Quadratic hill climbing) Date: 06/22/06 Time: 22:52 Sample: 1 52150 Included observations: 52150 Convergence achieved after 7 iterations QML (Huber/White) standard errors & covariance
Variable Coefficient Std. Error z-Statistic Prob.
C -6.459764 0.417999 -15.45403 0.0000ST1_MAX 0.310843 0.104659 2.970046 0.0030ST3_MAX 1.152232 0.124555 9.250785 0.0000ST4_MAX 0.348282 0.114469 3.042589 0.0023ST5_MAX 2.446845 0.163026 15.00895 0.0000
LNAGE -0.274650 0.045661 -6.015006 0.0000LNTON 0.453563 0.038683 11.72519 0.0000
ST_CHDGC 0.466394 0.066705 6.991895 0.0000RS_2S -0.979696 0.068677 -14.26520 0.0000RS_3S -1.183811 0.080034 -14.79134 0.0000RS_4S -2.771417 0.122720 -22.58320 0.0000RS_5S -3.879339 0.226207 -17.14952 0.0000
DH 0.439719 0.131212 3.351204 0.0008LNTIMEBW 0.110732 0.019175 5.774709 0.0000
CL_BV -0.424477 0.090092 -4.711605 0.0000CL_HEL -1.864871 0.571568 -3.262727 0.0011FL_AG 0.472199 0.119882 3.938857 0.0001FL_BH 2.534354 0.988805 2.563048 0.0104FL_BS 0.373358 0.117892 3.166960 0.0015FL_CA 2.664072 0.321357 8.290062 0.0000FL_DE 0.962096 0.228742 4.206037 0.0000FL_GI 1.086758 0.355024 3.061083 0.0022FL_IM 0.699019 0.263999 2.647808 0.0081FL_KR 1.039287 0.399637 2.600580 0.0093FL_RU -1.114659 0.263470 -4.230681 0.0000FL_ST 1.704192 0.538017 3.167544 0.0015
OW_EMN -0.282571 0.076981 -3.670639 0.0002C_0400S3 -0.614959 0.222312 -2.766198 0.0057C_0700S1 0.049588 0.010973 4.518925 0.0000C_0900S3 0.065725 0.021861 3.006474 0.0026C_1200S1 -0.052770 0.015964 -3.305644 0.0009C_1200S4 0.126155 0.034439 3.663143 0.0002C_1400S2 0.046748 0.007643 6.116191 0.0000C_2000S1 -0.111775 0.030128 -3.709996 0.0002C_2500S1 0.041474 0.016796 2.469206 0.0135C_2500S4 0.119394 0.041185 2.898938 0.0037AMSA_AV -0.518260 0.165448 -3.132458 0.0017
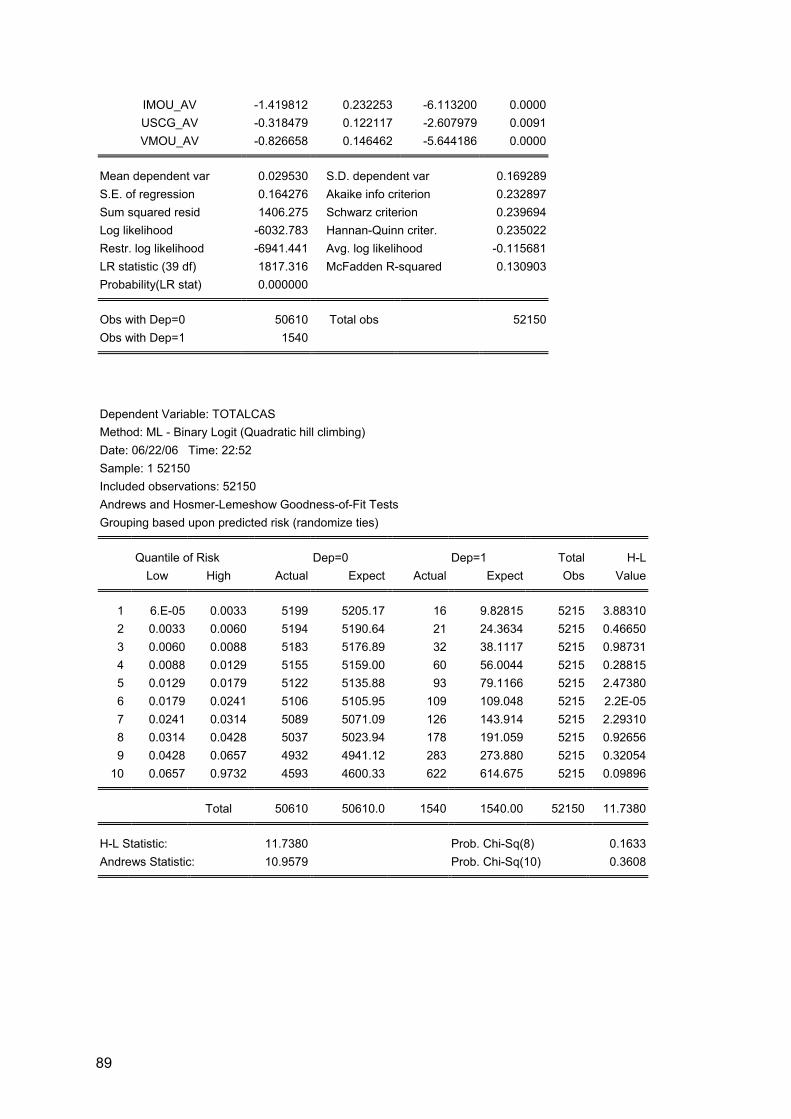
89
IMOU_AV -1.419812 0.232253 -6.113200 0.0000USCG_AV -0.318479 0.122117 -2.607979 0.0091VMOU_AV -0.826658 0.146462 -5.644186 0.0000
Mean dependent var 0.029530 S.D. dependent var 0.169289S.E. of regression 0.164276 Akaike info criterion 0.232897Sum squared resid 1406.275 Schwarz criterion 0.239694Log likelihood -6032.783 Hannan-Quinn criter. 0.235022Restr. log likelihood -6941.441 Avg. log likelihood -0.115681LR statistic (39 df) 1817.316 McFadden R-squared 0.130903Probability(LR stat) 0.000000
Obs with Dep=0 50610 Total obs 52150Obs with Dep=1 1540
Dependent Variable: TOTALCAS Method: ML - Binary Logit (Quadratic hill climbing) Date: 06/22/06 Time: 22:52 Sample: 1 52150 Included observations: 52150 Andrews and Hosmer-Lemeshow Goodness-of-Fit Tests Grouping based upon predicted risk (randomize ties)
Quantile of Risk Dep=0 Dep=1 Total H-L Low High Actual Expect Actual Expect Obs Value
1 6.E-05 0.0033 5199 5205.17 16 9.82815 5215 3.88310 2 0.0033 0.0060 5194 5190.64 21 24.3634 5215 0.46650 3 0.0060 0.0088 5183 5176.89 32 38.1117 5215 0.98731 4 0.0088 0.0129 5155 5159.00 60 56.0044 5215 0.28815 5 0.0129 0.0179 5122 5135.88 93 79.1166 5215 2.47380 6 0.0179 0.0241 5106 5105.95 109 109.048 5215 2.2E-05 7 0.0241 0.0314 5089 5071.09 126 143.914 5215 2.29310 8 0.0314 0.0428 5037 5023.94 178 191.059 5215 0.92656 9 0.0428 0.0657 4932 4941.12 283 273.880 5215 0.32054
10 0.0657 0.9732 4593 4600.33 622 614.675 5215 0.09896
Total 50610 50610.0 1540 1540.00 52150 11.7380
H-L Statistic: 11.7380 Prob. Chi-Sq(8) 0.1633 Andrews Statistic: 10.9579 Prob. Chi-Sq(10) 0.3608
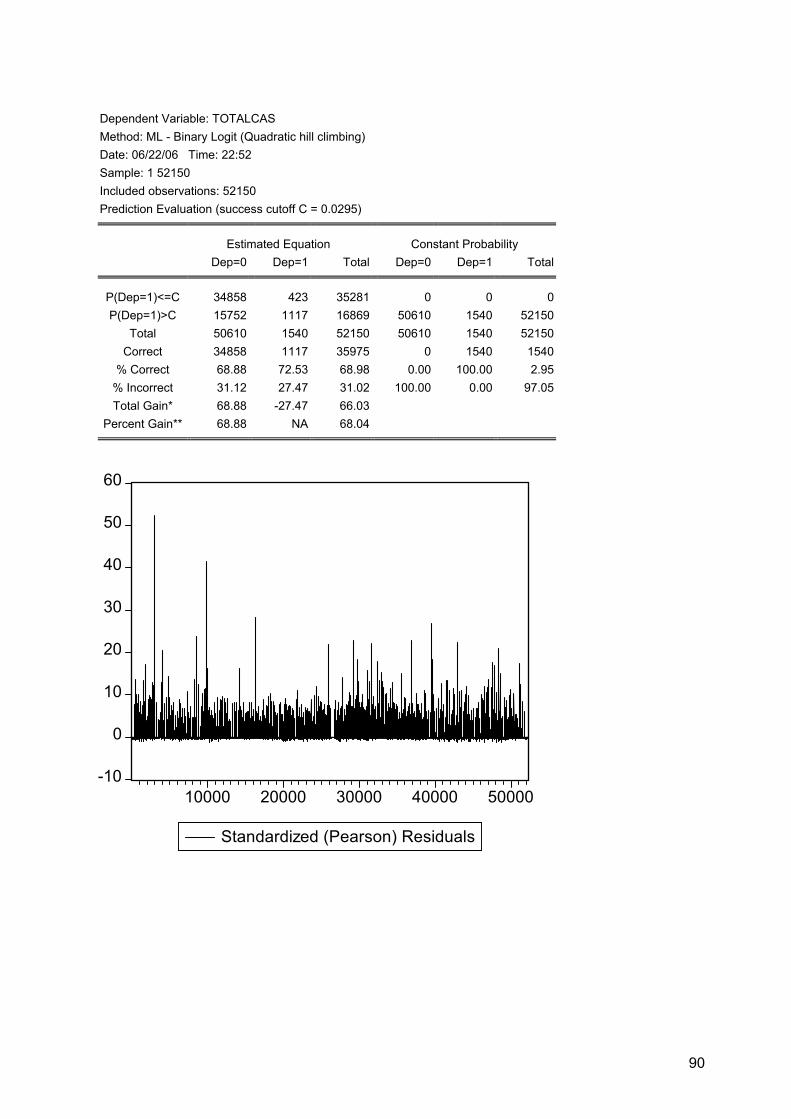
90
Dependent Variable: TOTALCAS Method: ML - Binary Logit (Quadratic hill climbing) Date: 06/22/06 Time: 22:52 Sample: 1 52150 Included observations: 52150 Prediction Evaluation (success cutoff C = 0.0295)
Estimated Equation Constant Probability Dep=0 Dep=1 Total Dep=0 Dep=1 Total
P(Dep=1)<=C 34858 423 35281 0 0 0P(Dep=1)>C 15752 1117 16869 50610 1540 52150
Total 50610 1540 52150 50610 1540 52150Correct 34858 1117 35975 0 1540 1540
% Correct 68.88 72.53 68.98 0.00 100.00 2.95% Incorrect 31.12 27.47 31.02 100.00 0.00 97.05Total Gain* 68.88 -27.47 66.03
Percent Gain** 68.88 NA 68.04
-10
0
10
20
30
40
50
60
10000 20000 30000 40000 50000
Standardized (Pearson) Residuals

91
Appendix 29: LM Test: Type III Models Fire/Explosion Tonnage Dependent Variable: BRMR_Y Method: Least Squares Date: 05/31/06 Time: 11:15 Sample: 1 6218 IF CMOU_AV=0 AND ST3_MAX=0 Included observations: 5675
Variable Coefficient Std. Error t-Statistic Prob.
FAC 3.096052 2.851226 1.085867 0.2776ST1_MAX*FAC 0.926331 0.853471 1.085369 0.2778ST2_MAX*FAC 0.960204 0.895525 1.072225 0.2837ST4_MAX*FAC 0.876841 0.827890 1.059127 0.2896
LNTON*FAC -0.155338 0.158336 -0.981067 0.3266OW_EMN*FAC 0.844088 0.798600 1.056959 0.2906OW_TMN*FAC 0.437090 0.435238 1.004255 0.3153OW_IOR*FAC 1.154002 1.129190 1.021973 0.3068
ST_CHDGC*FAC -0.320626 0.331008 -0.968636 0.3328IMOU_AV*FAC 1.161316 1.198474 0.968995 0.3326VMOU_AV*FAC 0.899939 0.908426 0.990657 0.3219LNTIMEBW*FAC -0.111826 0.115127 -0.971331 0.3314
FL_BG*FAC -1.617296 1.595029 -1.013960 0.3106C_1400S*FAC -0.035910 0.036208 -0.991770 0.3214C_1800S*FAC -0.234127 0.241923 -0.967776 0.3332
LNTON*(-XB)*FAC -0.083227 0.073513 -1.132148 0.2576
R-squared 0.000226 Mean dependent var -0.000103Adjusted R-squared -0.002424 S.D. dependent var 0.988561S.E. of regression 0.989758 Akaike info criterion 2.820103Sum squared resid 5543.674 Schwarz criterion 2.838834Log likelihood -7986.041 Durbin-Watson stat 1.953133
Wrecked/Stranded/Grounded Age Dependent Variable: BRMR_Y Method: Least Squares Date: 05/30/06 Time: 22:13 Sample: 1 19131 IF CMOU_AV=0 AND ST5_MAX=0 AND ST5_MAX=0 Included observations: 18600
Variable Coefficient Std. Error t-Statistic Prob.
FAC 0.156277 0.192608 0.811375 0.4172ST1_MAX*FAC 0.071050 0.031129 2.282418 0.0225ST2_MAX*FAC 0.067233 0.029557 2.274659 0.0229

92
DET_AMSA*FAC -0.040433 0.049176 -0.822201 0.4110LNTON*FAC -0.018231 0.018131 -1.005513 0.3147LNAGE*FAC 0.085997 0.039433 2.180819 0.0292OWCHD*FAC -0.028728 0.023295 -1.233213 0.2175
ST_CHDGC*FAC -0.041397 0.030272 -1.367487 0.1715AMSA_AV*FAC 0.083611 0.072560 1.152301 0.2492IMOU_AV*FAC 0.125406 0.081172 1.544942 0.1224
CL_LR*FAC -0.045160 0.025192 -1.792631 0.0730FL_BM*FAC -0.259467 0.177691 -1.460216 0.1442FL_IM*FAC -0.040411 0.075706 -0.533781 0.5935FL_RU*FAC 0.097281 0.083196 1.169301 0.2423FL_UK*FAC -0.121256 0.068763 -1.763386 0.0779
C_0700S*FAC -0.001538 0.002164 -0.711027 0.4771C_1000S*FAC -0.019906 0.017924 -1.110590 0.2668C_1400S*FAC -0.003465 0.002365 -1.465588 0.1428
LNAGE*(-XB)*FAC -0.027083 0.013742 -1.970839 0.0488
R-squared 0.000587 Mean dependent var -1.48E-13Adjusted R-squared -0.000381 S.D. dependent var 0.160131S.E. of regression 0.160161 Akaike info criterion -0.824248Sum squared resid 476.6338 Schwarz criterion -0.816249Log likelihood 7684.509 Durbin-Watson stat 1.906424
Tonnage Dependent Variable: BRMR_Y Method: Least Squares Date: 05/30/06 Time: 22:18 Sample: 1 19131 IF CMOU_AV=0 AND ST5_MAX=0 AND ST5_MAX=0 Included observations: 18600
Variable Coefficient Std. Error t-Statistic Prob.
FAC 0.785217 0.341382 2.300111 0.0215ST1_MAX*FAC 0.137705 0.043500 3.165632 0.0015ST2_MAX*FAC 0.164673 0.051731 3.183255 0.0015
DET_AMSA*FAC -0.147034 0.068045 -2.160819 0.0307LNTON*FAC -0.000483 0.010015 -0.048235 0.9615LNAGE*FAC -0.050594 0.024485 -2.066275 0.0388OWCHD*FAC -0.074916 0.031244 -2.397808 0.0165
ST_CHDGC*FAC -0.112035 0.044446 -2.520706 0.0117AMSA_AV*FAC 0.293536 0.117397 2.500373 0.0124IMOU_AV*FAC 0.289128 0.110300 2.621290 0.0088
CL_LR*FAC -0.099497 0.035234 -2.823880 0.0047FL_BM*FAC -0.558821 0.224304 -2.491351 0.0127FL_IM*FAC -0.202903 0.103530 -1.959851 0.0500FL_RU*FAC 0.206305 0.097293 2.120447 0.0340FL_UK*FAC -0.331594 0.114365 -2.899429 0.0037
C_0700S*FAC -0.004267 0.002503 -1.705048 0.0882C_1000S*FAC -0.048190 0.022207 -2.170057 0.0300

93
C_1400S*FAC -0.005912 0.002623 -2.254248 0.0242LNTON*(-XB)*FAC -0.023044 0.007890 -2.920527 0.0035
R-squared 0.000837 Mean dependent var -1.48E-13Adjusted R-squared -0.000131 S.D. dependent var 0.160131S.E. of regression 0.160141 Akaike info criterion -0.824498Sum squared resid 476.5147 Schwarz criterion -0.816499Log likelihood 7686.833 Durbin-Watson stat 1.906463
Collision/Contact Age Dependent Variable: BRMR_Y Method: Least Squares Date: 05/30/06 Time: 21:48 Sample: 1 23254 IF CMOU_AV=0 AND ST6_MAX=0 Included observations: 22329
Variable Coefficient Std. Error t-Statistic Prob.
FAC -0.607202 0.854825 -0.710323 0.4775ST1_MAX*FAC -0.318448 0.384232 -0.828789 0.4072ST2_MAX*FAC -0.320912 0.386051 -0.831268 0.4058ST3_MAX*FAC -0.269751 0.360442 -0.748389 0.4542ST4_MAX*FAC -0.263790 0.343996 -0.766841 0.4432
LNTON*FAC 0.073409 0.089489 0.820313 0.4120LNAGE*FAC -0.168408 0.177503 -0.948758 0.3428
C_0900S*FAC 0.006767 0.011950 0.566276 0.5712C_2100S*FAC -0.062268 0.144537 -0.430810 0.6666C_2500S*FAC 0.013557 0.024830 0.545995 0.5851
ST_CHDGC*FAC 0.127889 0.158941 0.804632 0.4210AMSA_AV*FAC -0.142339 0.278291 -0.511476 0.6090IMOU_AV*FAC -0.212939 0.387633 -0.549331 0.5828VMOU_AV*FAC -0.155418 0.290754 -0.534533 0.5930
CL_BV*FAC 0.082962 0.176251 0.470703 0.6379CL_DNV*FAC 0.085382 0.179435 0.475835 0.6342CL_GL*FAC 0.107528 0.178628 0.601969 0.5472CL_LR*FAC 0.153876 0.201849 0.762333 0.4459
CL_NKK*FAC 0.082130 0.172115 0.477181 0.6332CL_TLL*FAC 0.324735 0.526211 0.617119 0.5372FL_GI*FAC 0.174485 0.469608 0.371555 0.7102FL_KY*FAC 0.172906 0.441715 0.391441 0.6955
LNAGE*(-XB)*FAC 0.066550 0.066316 1.003527 0.3156
R-squared 0.000045 Mean dependent var -8.31E-05Adjusted R-squared -0.000941 S.D. dependent var 1.005635S.E. of regression 1.006108 Akaike info criterion 2.851085Sum squared resid 22579.31 Schwarz criterion 2.859339Log likelihood -31807.94 Durbin-Watson stat 1.908377

94
Tonnage Dependent Variable: BRMR_Y Method: Least Squares Date: 05/30/06 Time: 21:53 Sample: 1 23254 IF CMOU_AV=0 AND ST6_MAX=0 Included observations: 22329
Variable Coefficient Std. Error t-Statistic Prob.
FAC 2.398870 1.656344 1.448292 0.1475ST1_MAX*FAC 1.094541 0.736331 1.486480 0.1372ST2_MAX*FAC 1.181894 0.790078 1.495921 0.1347ST3_MAX*FAC 0.836628 0.589076 1.420239 0.1556ST4_MAX*FAC 0.920799 0.632245 1.456396 0.1453
LNTON*FAC -0.038124 0.057078 -0.667932 0.5042LNAGE*FAC -0.250617 0.171200 -1.463880 0.1432
C_0900S*FAC -0.019789 0.016100 -1.229150 0.2190C_2100S*FAC 0.197589 0.182151 1.084754 0.2780C_2500S*FAC -0.036984 0.031614 -1.169868 0.2421
ST_CHDGC*FAC -0.427042 0.290532 -1.469865 0.1416AMSA_AV*FAC 0.595048 0.451329 1.318435 0.1874IMOU_AV*FAC 0.730147 0.570624 1.279559 0.2007VMOU_AV*FAC 0.632690 0.475423 1.330793 0.1833
CL_BV*FAC -0.259189 0.228034 -1.136622 0.2557CL_DNV*FAC -0.312453 0.255567 -1.222587 0.2215CL_GL*FAC -0.368885 0.276907 -1.332160 0.1828CL_LR*FAC -0.551158 0.377899 -1.458480 0.1447
CL_NKK*FAC -0.260178 0.225627 -1.153133 0.2489CL_TLL*FAC -0.966813 0.747382 -1.293599 0.1958FL_GI*FAC -0.649875 0.604051 -1.075861 0.2820FL_KY*FAC -0.650373 0.583329 -1.114933 0.2649
LNTON*(-XB)*FAC -0.070640 0.045418 -1.555322 0.1199
R-squared 0.000108 Mean dependent var -8.31E-05Adjusted R-squared -0.000878 S.D. dependent var 1.005635S.E. of regression 1.006076 Akaike info criterion 2.851021Sum squared resid 22577.88 Schwarz criterion 2.859276Log likelihood -31807.23 Durbin-Watson stat 1.908578
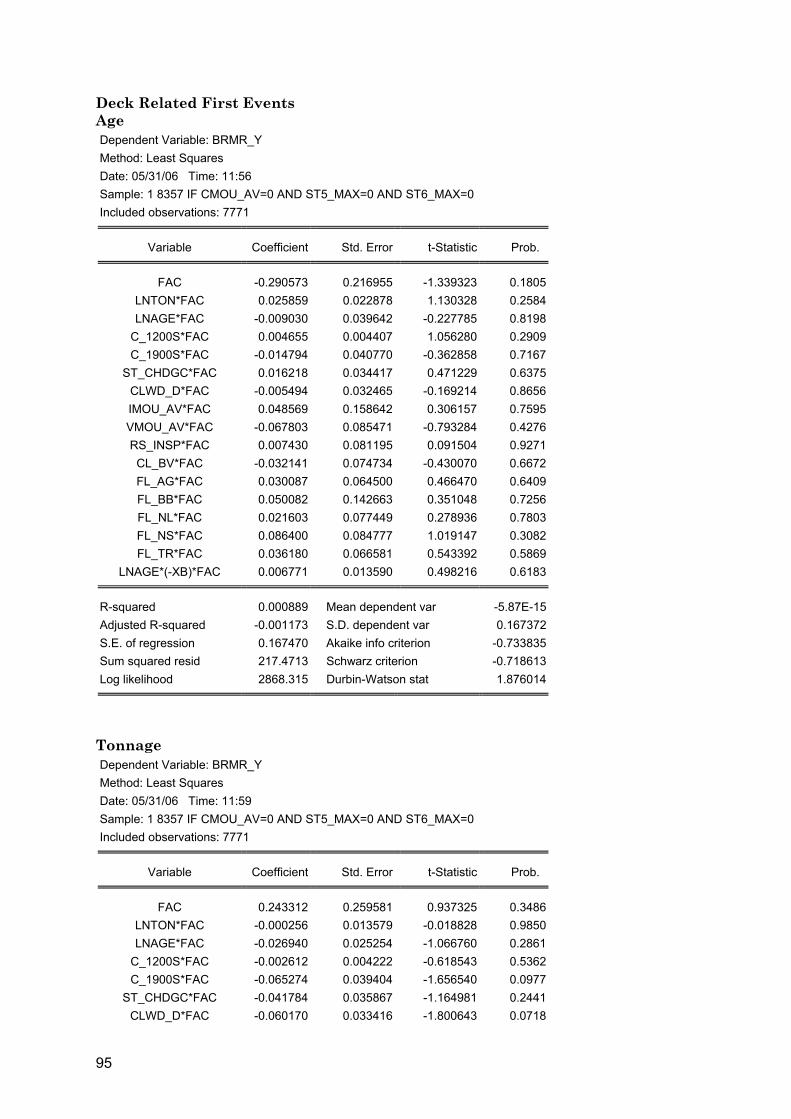
95
Deck Related First Events Age Dependent Variable: BRMR_Y Method: Least Squares Date: 05/31/06 Time: 11:56 Sample: 1 8357 IF CMOU_AV=0 AND ST5_MAX=0 AND ST6_MAX=0 Included observations: 7771
Variable Coefficient Std. Error t-Statistic Prob.
FAC -0.290573 0.216955 -1.339323 0.1805LNTON*FAC 0.025859 0.022878 1.130328 0.2584LNAGE*FAC -0.009030 0.039642 -0.227785 0.8198
C_1200S*FAC 0.004655 0.004407 1.056280 0.2909C_1900S*FAC -0.014794 0.040770 -0.362858 0.7167
ST_CHDGC*FAC 0.016218 0.034417 0.471229 0.6375CLWD_D*FAC -0.005494 0.032465 -0.169214 0.8656IMOU_AV*FAC 0.048569 0.158642 0.306157 0.7595VMOU_AV*FAC -0.067803 0.085471 -0.793284 0.4276RS_INSP*FAC 0.007430 0.081195 0.091504 0.9271CL_BV*FAC -0.032141 0.074734 -0.430070 0.6672FL_AG*FAC 0.030087 0.064500 0.466470 0.6409FL_BB*FAC 0.050082 0.142663 0.351048 0.7256FL_NL*FAC 0.021603 0.077449 0.278936 0.7803FL_NS*FAC 0.086400 0.084777 1.019147 0.3082FL_TR*FAC 0.036180 0.066581 0.543392 0.5869
LNAGE*(-XB)*FAC 0.006771 0.013590 0.498216 0.6183
R-squared 0.000889 Mean dependent var -5.87E-15Adjusted R-squared -0.001173 S.D. dependent var 0.167372S.E. of regression 0.167470 Akaike info criterion -0.733835Sum squared resid 217.4713 Schwarz criterion -0.718613Log likelihood 2868.315 Durbin-Watson stat 1.876014
Tonnage Dependent Variable: BRMR_Y Method: Least Squares Date: 05/31/06 Time: 11:59 Sample: 1 8357 IF CMOU_AV=0 AND ST5_MAX=0 AND ST6_MAX=0 Included observations: 7771
Variable Coefficient Std. Error t-Statistic Prob.
FAC 0.243312 0.259581 0.937325 0.3486LNTON*FAC -0.000256 0.013579 -0.018828 0.9850LNAGE*FAC -0.026940 0.025254 -1.066760 0.2861
C_1200S*FAC -0.002612 0.004222 -0.618543 0.5362C_1900S*FAC -0.065274 0.039404 -1.656540 0.0977
ST_CHDGC*FAC -0.041784 0.035867 -1.164981 0.2441CLWD_D*FAC -0.060170 0.033416 -1.800643 0.0718

96
IMOU_AV*FAC 0.297172 0.163836 1.813835 0.0697VMOU_AV*FAC 0.066930 0.091390 0.732356 0.4640RS_INSP*FAC 0.153095 0.081322 1.882578 0.0598CL_BV*FAC 0.087826 0.075419 1.164509 0.2443FL_AG*FAC -0.071357 0.065929 -1.082338 0.2791FL_BB*FAC -0.170930 0.148684 -1.149616 0.2503FL_NL*FAC -0.093856 0.079392 -1.182190 0.2372FL_NS*FAC -0.047023 0.085780 -0.548183 0.5836FL_TR*FAC -0.072301 0.067188 -1.076098 0.2819
LNTON*(-XB)*FAC -0.009672 0.004756 -2.033650 0.0420
R-squared 0.001389 Mean dependent var -5.87E-15Adjusted R-squared -0.000671 S.D. dependent var 0.167372S.E. of regression 0.167428 Akaike info criterion -0.734336Sum squared resid 217.3624 Schwarz criterion -0.719114Log likelihood 2870.262 Durbin-Watson stat 1.875529
Engine Related First Events Age Dependent Variable: BRMR_Y Method: Least Squares Date: 05/30/06 Time: 22:37 Sample: 1 27079 Included observations: 27079
Variable Coefficient Std. Error t-Statistic Prob.
FAC -0.344573 0.960055 -0.358910 0.7197ST1_MAX*FAC -0.032034 0.122330 -0.261862 0.7934ST5_MAX*FAC 0.101521 0.297301 0.341476 0.7327
DET_AMSA*FAC 0.037739 0.235424 0.160302 0.8726DET_USCG*FAC -0.024448 0.153848 -0.158911 0.8737
LNTON*FAC 0.023245 0.069450 0.334698 0.7379LNAGE*FAC -0.074277 0.182448 -0.407113 0.6839
ST_CHDGC*FAC 0.037491 0.118671 0.315921 0.7521PMOU_AV*FAC 0.060002 0.210048 0.285660 0.7751USCG_AV*FAC 0.052137 0.239443 0.217745 0.8276LNTIMEBW*FAC 0.006542 0.036453 0.179454 0.8576
CL_DNV*FAC 0.022422 0.130787 0.171442 0.8639CL_GL*FAC 0.017996 0.110230 0.163257 0.8703CL_LR*FAC 0.025808 0.123779 0.208497 0.8348FL_BB*FAC 0.075488 0.432535 0.174524 0.8615FL_PA*FAC -0.025606 0.151126 -0.169438 0.8655FL_RU*FAC -0.117518 0.471316 -0.249341 0.8031FL_UK*FAC 0.049978 0.252050 0.198284 0.8428
C_0400S*FAC -0.010052 0.046209 -0.217534 0.8278C_0700S*FAC 0.003550 0.012477 0.284545 0.7760C_1400S*FAC 0.005211 0.015244 0.341821 0.7325C_1700S*FAC 0.003106 0.019009 0.163398 0.8702

97
C_2000S*FAC -0.005667 0.034924 -0.162260 0.8711LNAGE*(-XB)*FAC 0.026194 0.061081 0.428831 0.6680
R-squared 0.000003 Mean dependent var -0.001900 Adjusted R-squared -0.000847 S.D. dependent var 0.978978 S.E. of regression 0.979392 Akaike info criterion 2.797117 Sum squared resid 25951.41 Schwarz criterion 2.804391 Log likelihood -37847.57 Durbin-Watson stat 1.883404
Tonnage Dependent Variable: BRMR_Y Method: Least Squares Date: 05/30/06 Time: 22:40 Sample: 1 27079 Included observations: 27079
Variable Coefficient Std. Error t-Statistic Prob.
FAC 0.853480 1.717190 0.497021 0.6192ST1_MAX*FAC 0.066313 0.159747 0.415112 0.6781ST5_MAX*FAC -0.305586 0.612350 -0.499038 0.6178
DET_AMSA*FAC -0.094761 0.283948 -0.333725 0.7386DET_USCG*FAC 0.053150 0.175453 0.302928 0.7619
LNTON*FAC 0.005418 0.044641 0.121376 0.9034LNAGE*FAC -0.035126 0.088393 -0.397381 0.6911
ST_CHDGC*FAC -0.075092 0.164709 -0.455907 0.6485PMOU_AV*FAC -0.143957 0.317143 -0.453919 0.6499USCG_AV*FAC -0.163142 0.374440 -0.435696 0.6631LNTIMEBW*FAC -0.015314 0.044233 -0.346205 0.7292
CL_DNV*FAC -0.056625 0.161666 -0.350260 0.7261CL_GL*FAC -0.044178 0.132478 -0.333471 0.7388CL_LR*FAC -0.067887 0.169143 -0.401362 0.6882FL_BB*FAC -0.156483 0.495927 -0.315536 0.7524FL_PA*FAC 0.074478 0.199063 0.374145 0.7083FL_RU*FAC 0.209400 0.554915 0.377355 0.7059FL_UK*FAC -0.162426 0.383074 -0.424007 0.6716
C_0400S*FAC 0.021103 0.056743 0.371903 0.7100C_0700S*FAC -0.007265 0.016757 -0.433557 0.6646C_1400S*FAC -0.010685 0.022442 -0.476127 0.6340C_1700S*FAC -0.007054 0.022168 -0.318189 0.7503C_2000S*FAC 0.013391 0.041267 0.324493 0.7456
LNTON*(-XB)*FAC -0.019114 0.036613 -0.522060 0.6016
R-squared 0.000006 Mean dependent var -0.001900Adjusted R-squared -0.000844 S.D. dependent var 0.978978S.E. of regression 0.979391 Akaike info criterion 2.797114Sum squared resid 25951.33 Schwarz criterion 2.804387Log likelihood -37847.52 Durbin-Watson stat 1.883431
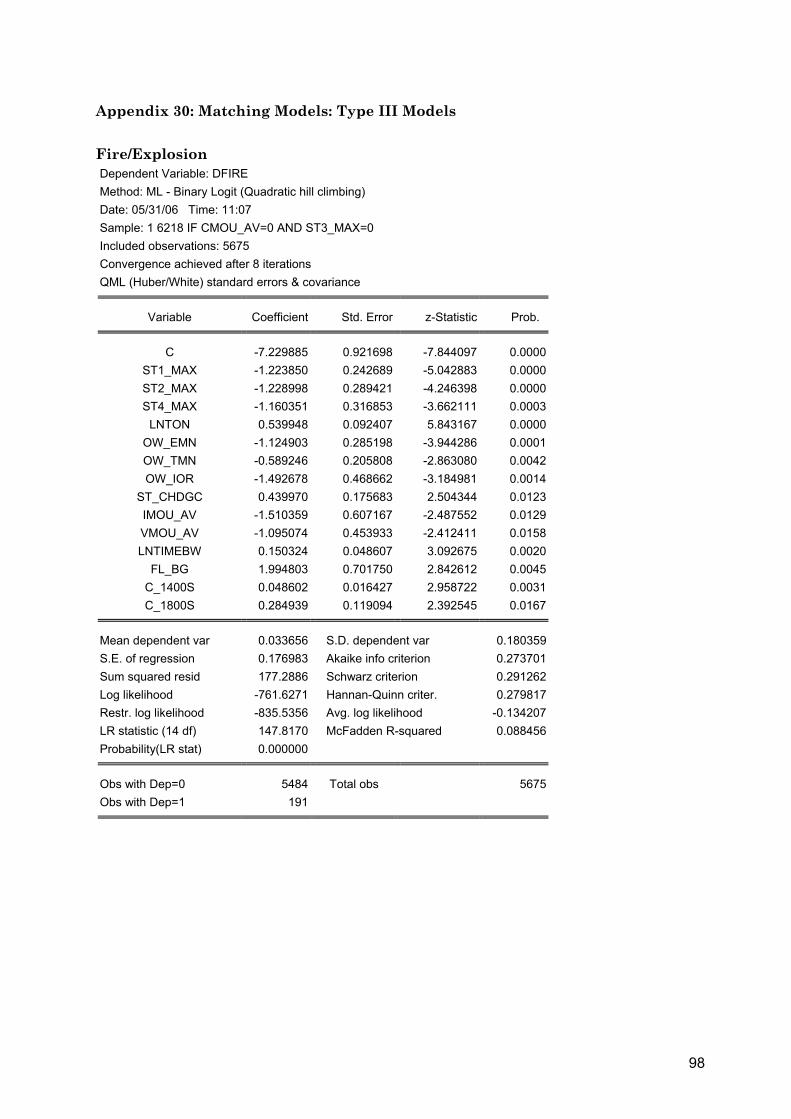
98
Appendix 30: Matching Models: Type III Models Fire/Explosion Dependent Variable: DFIRE Method: ML - Binary Logit (Quadratic hill climbing) Date: 05/31/06 Time: 11:07 Sample: 1 6218 IF CMOU_AV=0 AND ST3_MAX=0 Included observations: 5675 Convergence achieved after 8 iterations QML (Huber/White) standard errors & covariance
Variable Coefficient Std. Error z-Statistic Prob.
C -7.229885 0.921698 -7.844097 0.0000ST1_MAX -1.223850 0.242689 -5.042883 0.0000ST2_MAX -1.228998 0.289421 -4.246398 0.0000ST4_MAX -1.160351 0.316853 -3.662111 0.0003
LNTON 0.539948 0.092407 5.843167 0.0000OW_EMN -1.124903 0.285198 -3.944286 0.0001OW_TMN -0.589246 0.205808 -2.863080 0.0042OW_IOR -1.492678 0.468662 -3.184981 0.0014
ST_CHDGC 0.439970 0.175683 2.504344 0.0123IMOU_AV -1.510359 0.607167 -2.487552 0.0129VMOU_AV -1.095074 0.453933 -2.412411 0.0158LNTIMEBW 0.150324 0.048607 3.092675 0.0020
FL_BG 1.994803 0.701750 2.842612 0.0045C_1400S 0.048602 0.016427 2.958722 0.0031C_1800S 0.284939 0.119094 2.392545 0.0167
Mean dependent var 0.033656 S.D. dependent var 0.180359S.E. of regression 0.176983 Akaike info criterion 0.273701Sum squared resid 177.2886 Schwarz criterion 0.291262Log likelihood -761.6271 Hannan-Quinn criter. 0.279817Restr. log likelihood -835.5356 Avg. log likelihood -0.134207LR statistic (14 df) 147.8170 McFadden R-squared 0.088456Probability(LR stat) 0.000000
Obs with Dep=0 5484 Total obs 5675Obs with Dep=1 191

99
Dependent Variable: DFIRE Method: ML - Binary Logit (Quadratic hill climbing) Date: 05/31/06 Time: 11:07 Sample: 1 6218 IF CMOU_AV=0 AND ST3_MAX=0 Included observations: 5675 Andrews and Hosmer-Lemeshow Goodness-of-Fit Tests Grouping based upon predicted risk (randomize ties)
Quantile of Risk Dep=0 Dep=1 Total H-L Low High Actual Expect Actual Expect Obs Value
1 0.0002 0.0082 566 564.446 1 2.55361 567 0.94949 2 0.0082 0.0123 560 562.022 8 5.97841 568 0.69087 3 0.0123 0.0157 555 559.019 12 7.98093 567 2.05283 4 0.0157 0.0183 563 558.303 5 9.69703 568 2.31465 5 0.0184 0.0238 554 555.318 13 11.6820 567 0.15182 6 0.0238 0.0293 553 552.916 15 15.0838 568 0.00048 7 0.0293 0.0371 546 548.234 21 18.7657 567 0.27512 8 0.0372 0.0466 550 544.349 18 23.6514 568 1.40903 9 0.0467 0.0679 530 535.587 37 31.4132 567 1.05190
10 0.0679 0.5048 507 503.806 61 64.1940 568 0.17916
Total 5484 5484.00 191 191.000 5675 9.07536
H-L Statistic: 9.0754 Prob. Chi-Sq(8) 0.3360 Andrews Statistic: 13.4956 Prob. Chi-Sq(10) 0.1973
Dependent Variable: DFIRE Method: ML - Binary Logit (Quadratic hill climbing) Date: 05/31/06 Time: 11:07 Sample: 1 6218 IF CMOU_AV=0 AND ST3_MAX=0 Included observations: 5675 Prediction Evaluation (success cutoff C = 0.03365)
Estimated Equation Constant Probability Dep=0 Dep=1 Total Dep=0 Dep=1 Total
P(Dep=1)<=C 3654 64 3718 0 0 0P(Dep=1)>C 1830 127 1957 5484 191 5675
Total 5484 191 5675 5484 191 5675Correct 3654 127 3781 0 191 191
% Correct 66.63 66.49 66.63 0.00 100.00 3.37% Incorrect 33.37 33.51 33.37 100.00 0.00 96.63Total Gain* 66.63 -33.51 63.26
Percent Gain** 66.63 NA 65.46

100
-4
0
4
8
12
16
1000 2002 3000 4000 5001 6002
Standardized (Pearson) Residuals
Wrecked/Stranded/Grounded Dependent Variable: DWSG Method: ML - Binary Logit (Quadratic hill climbing) Date: 05/26/06 Time: 18:59 Sample: 1 19131 IF CMOU_AV=0 AND ST5_MAX=0 AND ST5_MAX=0 Included observations: 18600 Convergence achieved after 8 iterations QML (Huber/White) standard errors & covariance
Variable Coefficient Std. Error z-Statistic Prob.
C -7.733199 0.717113 -10.78379 0.0000ST1_MAX -0.531549 0.164562 -3.230080 0.0012ST2_MAX -0.600987 0.137824 -4.360537 0.0000
DET_AMSA 0.684428 0.246508 2.776491 0.0055LNTON 0.414156 0.063435 6.528846 0.0000LNAGE 0.264708 0.076264 3.470938 0.0005OWCHD 0.339034 0.119542 2.836110 0.0046
ST_CHDGC 0.604921 0.112651 5.369877 0.0000AMSA_AV -1.337353 0.352355 -3.795474 0.0001IMOU_AV -1.296433 0.370949 -3.494909 0.0005
CL_LR 0.396235 0.125791 3.149952 0.0016FL_BM 2.314809 0.984986 2.350095 0.0188FL_IM 1.095883 0.437259 2.506258 0.0122FL_RU -1.188837 0.409279 -2.904710 0.0037FL_UK 1.386813 0.357793 3.876016 0.0001
C_0700S 0.023768 0.011421 2.081060 0.0374C_1000S 0.263622 0.086601 3.044095 0.0023

101
C_1400S 0.022311 0.011088 2.012256 0.0442
Mean dependent var 0.026989 S.D. dependent var 0.162056S.E. of regression 0.160204 Akaike info criterion 0.232718Sum squared resid 476.9137 Schwarz criterion 0.240296Log likelihood -2146.278 Hannan-Quinn criter. 0.235206Restr. log likelihood -2308.547 Avg. log likelihood -0.115391LR statistic (17 df) 324.5370 McFadden R-squared 0.070290Probability(LR stat) 0.000000
Obs with Dep=0 18098 Total obs 18600Obs with Dep=1 502
Dependent Variable: DWSG Method: ML - Binary Logit (Quadratic hill climbing) Date: 05/26/06 Time: 18:59 Sample: 1 19131 IF CMOU_AV=0 AND ST5_MAX=0 AND ST5_MAX=0 Included observations: 18600 Prediction Evaluation (success cutoff C = 0.02698)
Estimated Equation Constant Probability Dep=0 Dep=1 Total Dep=0 Dep=1 Total
P(Dep=1)<=C 12135 179 12314 0 0 0P(Dep=1)>C 5963 323 6286 18098 502 18600
Total 18098 502 18600 18098 502 18600Correct 12135 323 12458 0 502 502
% Correct 67.05 64.34 66.98 0.00 100.00 2.70% Incorrect 32.95 35.66 33.02 100.00 0.00 97.30Total Gain* 67.05 -35.66 64.28
Percent Gain** 67.05 NA 66.06

102
Dependent Variable: DWSG Method: ML - Binary Logit (Quadratic hill climbing) Date: 05/26/06 Time: 18:59 Sample: 1 19131 IF CMOU_AV=0 AND ST5_MAX=0 AND ST5_MAX=0 Included observations: 18600 Andrews and Hosmer-Lemeshow Goodness-of-Fit Tests Grouping based upon predicted risk (randomize ties)
Quantile of Risk Dep=0 Dep=1 Total H-L Low High Actual Expect Actual Expect Obs Value
1 0.0003 0.0076 1849 1852.20 11 7.79651 1860 1.32182 2 0.0076 0.0119 1833 1841.11 27 18.8918 1860 3.51564 3 0.0119 0.0139 1846 1835.88 14 24.1208 1860 4.30236 4 0.0139 0.0163 1830 1832.06 30 27.9425 1860 0.15381 5 0.0163 0.0193 1828 1827.05 32 32.9470 1860 0.02771 6 0.0193 0.0236 1825 1820.28 35 39.7250 1860 0.57426 7 0.0236 0.0293 1809 1811.04 51 48.9649 1860 0.08687 8 0.0293 0.0374 1808 1798.52 52 61.4755 1860 1.51041 9 0.0374 0.0535 1783 1776.79 77 83.2099 1860 0.48514
10 0.0535 0.4445 1687 1703.07 173 156.926 1860 1.79813
Total 18098 18098.0 502 502.000 18600 13.7762
H-L Statistic: 13.7762 Prob. Chi-Sq(8) 0.0878 Andrews Statistic: 19.5736 Prob. Chi-Sq(10) 0.0336
-5
0
5
10
15
20
25
30
5000 10000 15000
Standardized (Pearson) Residuals

103
Collision/Contact Dependent Variable: DCOCO Method: ML - Binary Logit (Quadratic hill climbing) Date: 05/26/06 Time: 17:44 Sample: 1 23254 IF CMOU_AV=0 AND ST6_MAX=0 Included observations: 22329 Convergence achieved after 6 iterations QML (Huber/White) standard errors & covariance
Variable Coefficient Std. Error z-Statistic Prob.
C -7.067282 0.664045 -10.64278 0.0000ST1_MAX -1.621938 0.225563 -7.190606 0.0000ST2_MAX -1.711995 0.220717 -7.756526 0.0000ST3_MAX -1.241333 0.245229 -5.061941 0.0000ST4_MAX -1.341532 0.225556 -5.947671 0.0000
LNTON 0.416932 0.058917 7.076635 0.0000LNAGE 0.362874 0.055431 6.546457 0.0000
C_0900S 0.031497 0.008968 3.512042 0.0004C_2100S -0.309480 0.121664 -2.543730 0.0110C_2500S 0.062421 0.023477 2.658779 0.0078
ST_CHDGC 0.680648 0.097255 6.998552 0.0000AMSA_AV -0.853452 0.230808 -3.697669 0.0002IMOU_AV -1.170421 0.334437 -3.499672 0.0005VMOU_AV -0.915033 0.229946 -3.979340 0.0001
CL_BV 0.394910 0.157638 2.505171 0.0122CL_DNV 0.470664 0.160140 2.939085 0.0033CL_GL 0.583936 0.142099 4.109364 0.0000CL_LR 0.829407 0.133258 6.224067 0.0000
CL_NKK 0.411940 0.154476 2.666698 0.0077CL_TLL 1.652974 0.428944 3.853593 0.0001FL_GI 1.052753 0.438834 2.398978 0.0164FL_KY 1.019645 0.400478 2.546071 0.0109
Mean dependent var 0.030812 S.D. dependent var 0.172812S.E. of regression 0.170507 Akaike info criterion 0.258502Sum squared resid 648.5264 Schwarz criterion 0.266397Log likelihood -2864.040 Hannan-Quinn criter. 0.261071Restr. log likelihood -3071.429 Avg. log likelihood -0.128265LR statistic (21 df) 414.7769 McFadden R-squared 0.067522Probability(LR stat) 0.000000
Obs with Dep=0 21641 Total obs 22329Obs with Dep=1 688

104
Dependent Variable: DCOCO Method: ML - Binary Logit (Quadratic hill climbing) Date: 05/26/06 Time: 17:44 Sample: 1 23254 IF CMOU_AV=0 AND ST6_MAX=0 Included observations: 22329 Andrews and Hosmer-Lemeshow Goodness-of-Fit Tests Grouping based upon predicted risk (randomize ties)
Quantile of Risk Dep=0 Dep=1 Total H-L Low High Actual Expect Actual Expect Obs Value
1 0.0009 0.0109 2219 2215.81 13 16.1947 2232 0.63482 2 0.0109 0.0138 2198 2205.22 35 27.7845 2233 1.89744 3 0.0138 0.0166 2208 2199.10 25 33.8971 2233 2.37127 4 0.0166 0.0195 2197 2192.80 36 40.1987 2233 0.44659 5 0.0195 0.0228 2181 2185.96 52 47.0371 2233 0.53490 6 0.0228 0.0268 2177 2177.76 56 55.2437 2233 0.01062 7 0.0268 0.0328 2160 2166.71 73 66.2922 2233 0.69950 8 0.0328 0.0420 2152 2150.31 81 82.6904 2233 0.03588 9 0.0420 0.0592 2125 2122.02 108 110.984 2233 0.08444
10 0.0592 0.7821 2024 2025.32 209 207.677 2233 0.00929
Total 21641 21641.0 688 688.000 22329 6.72475
H-L Statistic: 6.7247 Prob. Chi-Sq(8) 0.5666 Andrews Statistic: 8.3372 Prob. Chi-Sq(10) 0.5959
Dependent Variable: DCOCO Method: ML - Binary Logit (Quadratic hill climbing) Date: 05/26/06 Time: 17:44 Sample: 1 23254 IF CMOU_AV=0 AND ST6_MAX=0 Included observations: 22329 Prediction Evaluation (success cutoff C = 0.030811)
Estimated Equation Constant Probability Dep=0 Dep=1 Total Dep=0 Dep=1 Total
P(Dep=1)<=C 14693 265 14958 0 0 0P(Dep=1)>C 6948 423 7371 21641 688 22329
Total 21641 688 22329 21641 688 22329Correct 14693 423 15116 0 688 688
% Correct 67.89 61.48 67.70 0.00 100.00 3.08% Incorrect 32.11 38.52 32.30 100.00 0.00 96.92Total Gain* 67.89 -38.52 64.62
Percent Gain** 67.89 NA 66.67

105
-5
0
5
10
15
20
25
5000 10000 15000 20000
Standardized (Pearson) Residuals
Deck Related First Events Dependent Variable: DDECK Method: ML - Binary Logit (Quadratic hill climbing) Date: 05/31/06 Time: 11:33 Sample: 1 8357 IF CMOU_AV=0 AND ST5_MAX=0 AND ST6_MAX=0 Included observations: 7771 Convergence achieved after 8 iterations QML (Huber/White) standard errors & covariance
Variable Coefficient Std. Error z-Statistic Prob.
C -8.198026 0.948578 -8.642441 0.0000LNTON 0.536441 0.073247 7.323709 0.0000LNAGE 0.360412 0.111891 3.221106 0.0013
C_1200S 0.070160 0.017665 3.971639 0.0001C_1900S 0.514635 0.174084 2.956239 0.0031
ST_CHDGC 0.540449 0.164759 3.280230 0.0010CLWD_D 0.532854 0.151507 3.517021 0.0004IMOU_AV -2.336155 0.581131 -4.020016 0.0001VMOU_AV -1.206711 0.455764 -2.647665 0.0081RS_INSP -1.434488 0.353287 -4.060399 0.0000
CL_BV -1.182662 0.355922 -3.322807 0.0009FL_AG 0.972321 0.329541 2.950534 0.0032FL_BB 2.191105 0.693409 3.159903 0.0016FL_NL 1.125001 0.384359 2.926955 0.0034FL_NS 1.296348 0.393428 3.295003 0.0010FL_TR 1.040046 0.308477 3.371548 0.0007
Mean dependent var 0.029983 S.D. dependent var 0.170552S.E. of regression 0.167993 Akaike info criterion 0.251942Sum squared resid 218.8597 Schwarz criterion 0.266268

106
Log likelihood -962.9202 Hannan-Quinn criter. 0.256853Restr. log likelihood -1046.629 Avg. log likelihood -0.123912LR statistic (15 df) 167.4185 McFadden R-squared 0.079980Probability(LR stat) 0.000000
Obs with Dep=0 7538 Total obs 7771Obs with Dep=1 233
Dependent Variable: DDECK Method: ML - Binary Logit (Quadratic hill climbing) Date: 05/31/06 Time: 11:33 Sample: 1 8357 IF CMOU_AV=0 AND ST5_MAX=0 AND ST6_MAX=0 Included observations: 7771 Andrews and Hosmer-Lemeshow Goodness-of-Fit Tests Grouping based upon predicted risk (randomize ties)
Quantile of Risk Dep=0 Dep=1 Total H-L Low High Actual Expect Actual Expect Obs Value
1 0.0002 0.0061 775 774.733 2 2.26670 777 0.03147 2 0.0061 0.0107 768 770.295 9 6.70473 777 0.79259 3 0.0107 0.0140 764 767.428 13 9.57184 777 1.24311 4 0.0140 0.0179 766 764.724 11 12.2764 777 0.13484 5 0.0179 0.0217 767 761.587 10 15.4128 777 1.93941 6 0.0217 0.0267 756 758.216 21 18.7836 777 0.26801 7 0.0267 0.0347 753 753.325 24 23.6751 777 0.00460 8 0.0347 0.0442 744 746.604 33 30.3958 777 0.23220 9 0.0443 0.0618 738 736.172 39 40.8275 777 0.08634
10 0.0619 0.3995 707 704.915 71 73.0854 778 0.06568
Total 7538 7538.00 233 233.000 7771 4.79825
H-L Statistic: 4.7982 Prob. Chi-Sq(8) 0.7789 Andrews Statistic: 9.2049 Prob. Chi-Sq(10) 0.5128

107
Dependent Variable: DDECK Method: ML - Binary Logit (Quadratic hill climbing) Date: 05/31/06 Time: 11:33 Sample: 1 8357 IF CMOU_AV=0 AND ST5_MAX=0 AND ST6_MAX=0 Included observations: 7771 Prediction Evaluation (success cutoff C = 0.02998)
Estimated Equation Constant Probability Dep=0 Dep=1 Total Dep=0 Dep=1 Total
P(Dep=1)<=C 4934 75 5009 0 0 0P(Dep=1)>C 2604 158 2762 7538 233 7771
Total 7538 233 7771 7538 233 7771Correct 4934 158 5092 0 233 233
% Correct 65.46 67.81 65.53 0.00 100.00 3.00% Incorrect 34.54 32.19 34.47 100.00 0.00 97.00Total Gain* 65.46 -32.19 62.53
Percent Gain** 65.46 NA 64.46
-4
0
4
8
12
16
20
1000 2000 3000 4000 5000 6002 7000 8000
Standardized (Pearson) Residuals

108
Engine Related First Events Dependent Variable: DENG Method: ML - Binary Logit (Quadratic hill climbing) Date: 05/26/06 Time: 17:03 Sample: 1 27079 Included observations: 27079 Convergence achieved after 8 iterations QML (Huber/White) standard errors & covariance
Variable Coefficient Std. Error z-Statistic Prob.
C -8.147009 0.576580 -14.12989 0.0000ST1_MAX -0.414850 0.115153 -3.602603 0.0003ST5_MAX 1.583319 0.189842 8.340188 0.0000
DET_AMSA 0.520215 0.212531 2.447720 0.0144DET_USCG -0.316929 0.116563 -2.718949 0.0065
LNTON 0.322429 0.050952 6.328103 0.0000LNAGE 0.183819 0.058603 3.136709 0.0017
ST_CHDGC 0.466723 0.084339 5.533884 0.0000PMOU_AV 0.822478 0.157007 5.238488 0.0000USCG_AV 0.854522 0.207726 4.113693 0.0000LNTIMEBW 0.093861 0.027306 3.437371 0.0006
CL_DNV 0.327837 0.126642 2.588692 0.0096CL_GL 0.264476 0.106413 2.485374 0.0129CL_LR 0.362008 0.110516 3.275622 0.0011FL_BB 1.033412 0.403574 2.560653 0.0104FL_PA -0.393960 0.145391 -2.709660 0.0067FL_RU -1.432597 0.386218 -3.709297 0.0002FL_UK 0.921571 0.236530 3.896206 0.0001
C_0400S -0.124567 0.039619 -3.144153 0.0017C_0700S 0.043168 0.009199 4.692785 0.0000C_1400S 0.064510 0.010054 6.416617 0.0000C_1700S 0.044865 0.017112 2.621925 0.0087C_2000S -0.080135 0.031397 -2.552318 0.0107
Mean dependent var 0.030245 S.D. dependent var 0.171263S.E. of regression 0.168400 Akaike info criterion 0.250030Sum squared resid 767.2715 Schwarz criterion 0.257000Log likelihood -3362.283 Hannan-Quinn criter. 0.252278Restr. log likelihood -3671.702 Avg. log likelihood -0.124166LR statistic (22 df) 618.8387 McFadden R-squared 0.084271Probability(LR stat) 0.000000
Obs with Dep=0 26260 Total obs 27079Obs with Dep=1 819

109
Dependent Variable: DENG Method: ML - Binary Logit (Quadratic hill climbing) Date: 05/26/06 Time: 17:03 Sample: 1 27079 Included observations: 27079 Andrews and Hosmer-Lemeshow Goodness-of-Fit Tests Grouping based upon predicted risk (randomize ties)
Quantile of Risk Dep=0 Dep=1 Total H-L Low High Actual Expect Actual Expect Obs Value
1 0.0003 0.0071 2700 2696.19 7 10.8127 2707 1.34978 2 0.0071 0.0127 2682 2680.16 26 27.8400 2708 0.12287 3 0.0127 0.0161 2673 2668.63 35 39.3694 2708 0.49210 4 0.0161 0.0190 2661 2660.75 47 47.2456 2708 0.00130 5 0.0190 0.0223 2651 2652.45 57 55.5454 2708 0.03889 6 0.0223 0.0266 2650 2642.24 58 65.7631 2708 0.93923 7 0.0266 0.0319 2622 2629.35 86 78.6508 2708 0.70726 8 0.0319 0.0405 2616 2611.29 92 96.7052 2708 0.23741 9 0.0405 0.0571 2562 2579.13 146 128.867 2708 2.39163
10 0.0571 0.9919 2443 2439.80 265 268.201 2708 0.04239
Total 26260 26260.0 819 819.000 27079 6.32286
H-L Statistic: 6.3229 Prob. Chi-Sq(8) 0.6111 Andrews Statistic: 22.1248 Prob. Chi-Sq(10) 0.0145
Dependent Variable: DENG Method: ML - Binary Logit (Quadratic hill climbing) Date: 05/26/06 Time: 17:03 Sample: 1 27079 Included observations: 27079 Prediction Evaluation (success cutoff C = 0.031)
Estimated Equation Constant Probability Dep=0 Dep=1 Total Dep=0 Dep=1 Total
P(Dep=1)<=C 18308 303 18611 26260 819 27079P(Dep=1)>C 7952 516 8468 0 0 0
Total 26260 819 27079 26260 819 27079Correct 18308 516 18824 26260 0 26260
% Correct 69.72 63.00 69.52 100.00 0.00 96.98% Incorrect 30.28 37.00 30.48 0.00 100.00 3.02Total Gain* -30.28 63.00 -27.46
Percent Gain** NA 63.00 -907.94

110
-4
0
4
8
12
16
20
24
5000 10000 15000 20000 25000
Standardized (Pearson) Residuals