Embed Size (px)
Citation preview

A study of its implementation in India and comparison of LCR across Indian Banks
Under the Guidance of: Mr. Samir Doshi Vice President, IndusInd Bank Dr. V S Kaveri Consulting Professor, NIBM

IndusInd Bank
• Conceptualized by Mr.Srichand P. Hinduja
• Started in 1994
• Initial capital base of 100 Crore INR The dawn
• Fifth largest private bank in India by market capitalization
• Has 801 branches and 1487 ATMs as on 31st March, 2015
• Is included in NIFTY 50
Current Standing
• One of the reputed banking brands; Ranked 19th amongst the Top 50 Most Valuable Indian Brands 2014 as per the BrandZ
• Brand statement 'You desire, We Deliver' Brand
• My Account My Number, Choice Money ATMs, Check-on-Cheque, Cash-on-Mobile, Direct Connect, Quick Redeem Service and 365 Days Banking.
• Video Branch
Innovations

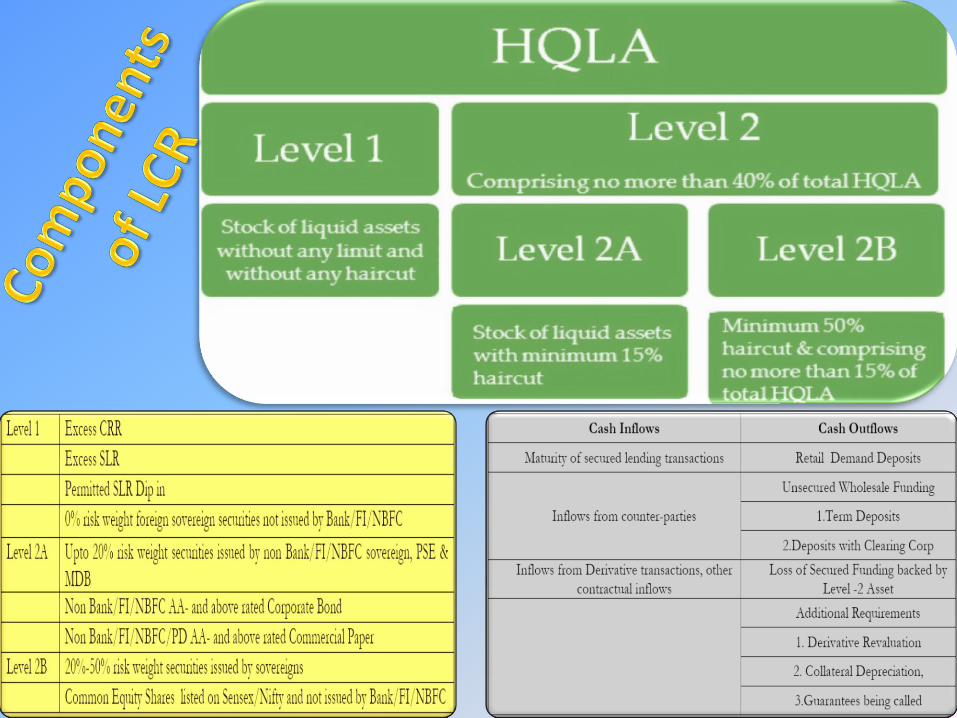
Liquidity Coverage Ratio
The Liquidity Coverage Ratio (‘LCR’) states that at minimum and on an ongoing basis, the banks must maintain an adequate level of unencumbered High Quality Liquid Assets (HQLA) that can be converted into cash to meet its liquidity needs for a 30 calendar day time horizon under severe liquidity stress scenario.
LCR = ≥ 100%
LCR
Total Net Cash outflow
HQLA

Why LCR was introduced? During the early “liquidity phase” of the financial crisis that began in 2007, many banks – despite adequate capital levels – still experienced difficulties because they did not manage their liquidity in a prudent manner. The crisis drove home the importance of liquidity to the proper functioning of financial markets and the banking sector.
2008
BCBS introduces "Sound Principles"
Dec, 2010
BCBS issues Original Standards on LCR
January 7, 2013
BCBS issues Final Standards on LCR
June 9, 2014
RBI issues final guidelines on LCR
Milestones in Implementation of LCR

LCR: Compliance timeline in major economies
Jan 1, 2015 Jan 1, 2016 Jan 1, 2017 Jan 1, 2018 Jan 1, 2019
BCBS LCR Framework 60% 70% 80% 90% 100%
EU CRD IV 60% 70% 80% 100% 100%
U.S. LCR Proposal 80% 90% 100% 100% 100%
LCR: Implementation Timeline in India
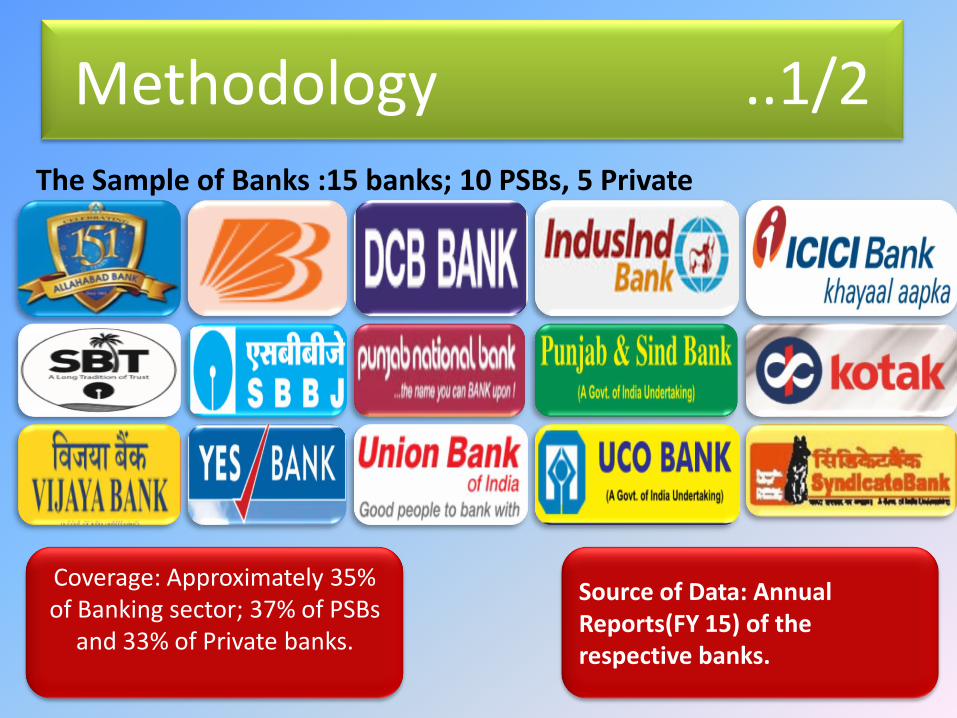
Methodology ..1/2
The Sample of Banks :15 banks; 10 PSBs, 5 Private
Coverage: Approximately 35% of Banking sector; 37% of PSBs
and 33% of Private banks.
Source of Data: Annual Reports(FY 15) of the respective banks.

Banks are classified as Compliant (LCR>=60%) and Non Compliant (LCR<60%)
Composition of Total Cash Outflows, Total Cash Inflows
Comparison Study of LCR by Bank Groups(PSBs Vs Private Banks)
Comparison Study of LCR across Banks using Stata
As the banks of various size are involved in the diverse sample, all the components of LCR are normalized by the Total Assets of the respective bank.
Comparison of LCR of IndusInd bank with that of other Banks
Methodology ..2/2

All the banks in the sample are
compliant.
34%
13%
53%
60% to 79.99%
80% to 100%
Greater than 100%
More than half of the banks are already compliant with 100% requirement.
4 Banks have LCR less than 70%(next hurdle).
The Breakup of Banks based their LCR.
# of Compliant Vs Non Compliant banks

104.76%
87.28%
99.82%
0.00%
20.00%
40.00%
60.00%
80.00%
100.00%
120.00%
Public Sector Banks
Private Sector Banks
All Banks
LCR
Avg LCR
For PSBs, the LCR ranges from 67.28 %( Vijaya Bank) to as high as 143.53 %( Syndicate Bank)
In case of Private Banks, LCR ranges from 61.74 %( IndusInd Bank Limited) to 111.13 % (DCB Ltd).
Range of LCR by Bank Group
Ave
rage
LC
R b
y B
ank
Gro
up

R² = 0.3587
0
0.2
0.4
0.6
0.8
1
1.2
1.4
1.6
0 0.02 0.04 0.06 0.08 0.1 0.12 0.14 0.16
LCR
Percentage of Weighted Wholesale Funding
LCR
Scatter Plot of Normalised Wholesale Funding to the LCR

23%
61%
7%
4% 5%
Retail & Small Business
Wholesale funding
Derivatives, Debt and Credit and liquidity
Other contractual funding obligations
Other contingent funding obligations
Composition of Total Cash Outflows
Composition of Total Cash Inflows

3.49%
8.94%
1.51% 0.71% 0.70%
1.64%
10.06%
7.13%
2.80%
0.18% 0.00%
2.00%
4.00%
6.00%
8.00%
10.00%
12.00%
All Banks
IndusInd Bank
At 6.93%, IndusInd bank’s Total HQLA (weighted) as a percentage of Total Assets is lowest among the Sample. IndusInd bank’s Total Cash outflow as a percentage of its total Assets is the highest among the banks analyzed. The Bank has healthy Cash inflows. Lower proportion of HQLA is led to lower value of LCR.
Normalised Outflows of IndusInd Bank Vs
Other banks

Conclusions & Recommendations …1/2
All the banks analyzed have met the minimum requirement with ease.
As it stands out right now, most banks are already on course to meet the final requirement of maintaining 100% LCR.
With the economy picking up, there will be increase in the demand for credit. Therefore, going forward active balance sheet management is required to meet the future requirement milestones.
Banks must improve their CASA, and reduce their dependency on the wholesale funding to improve their LCR values.
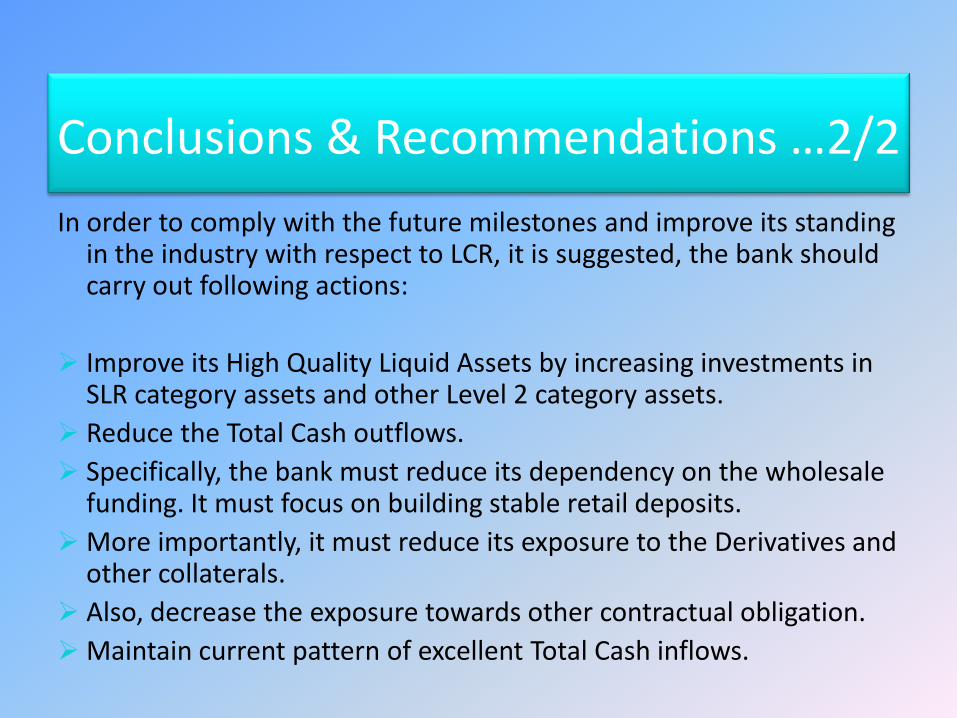
Conclusions & Recommendations …2/2
In order to comply with the future milestones and improve its standing in the industry with respect to LCR, it is suggested, the bank should carry out following actions:
Improve its High Quality Liquid Assets by increasing investments in SLR category assets and other Level 2 category assets.
Reduce the Total Cash outflows.
Specifically, the bank must reduce its dependency on the wholesale funding. It must focus on building stable retail deposits.
More importantly, it must reduce its exposure to the Derivatives and other collaterals.
Also, decrease the exposure towards other contractual obligation.
Maintain current pattern of excellent Total Cash inflows.

Scope for Future Study
A Study similar to this can be undertaken every year to analyze whether the banks are compliant with the guidelines.
The study can be further deepened to further analyze the changes in the composition of HQLA, Cash outflows, Cash Inflows over the years.