Embed Size (px)
Citation preview
Pharm Biomed Res 2015; 1 (3): 47
Pharmaceutical and Biomedical Research
Liquid chromatography–tandem mass spectrometry (LC-MS) method
for the assignment of enalapril and enalaprilat in human plasma
Hossein Danafar
1,2*, Mehrdad Hamidi
3
1Pharmaceutical Nanotechnology Research Center, Zanjan University of Medical Sciences, Zanjan, Iran 2Department of Pharmaceutics, School of Pharmacy, Zanjan University of Medical Sciences, Zanjan, Iran 3Department of Pharmaceutics, School of Pharmacy, Zanjan University of Medical Sciences, Zanjan, Iran
Received: Oct 21, 2015, Revised: Nov 7, 2015, Accepted: Nov 11, 2015
Introduction
Enalapril, N-((1S)-1-(ethoxycarbonyl)-
3-phenylpropyl)-l-proline (Fig.1A),
belongs to the series of substituted N-
carboxymethyl dipeptides. Enalapril is a
prodrug which is hydrolyzed after
absorption forming the active
angiotensin converting enzyme (ACE)
inhibitor. The active form, enalaprilat
(Fig. 1B), is a major metabolite of
enalapril and has been shown to be
effective in the treatment of
hypertension and congestive heart
failure without causing any significant
side effects (1–4). Enalapril and
enalaprilat are often determined
simultaneously in biological
fluids.Therefore, the simultaneous
detection of enalapril and enalaprilat
in human plasma is of prime
importance for pharmacokinetic studies.
Several analytical methods have
been reported for determination of
enalapril and enalaprilat in biological
samples, including gas
chromatography–mass spectrometry
(GC–MS) (5), radioimmunoassay (RIA)
(6) and enzyme kinetics (7). Recently,
liquid chromatography–mass
Abstract
A rapid and sensitive liquid chromatography–tandem mass spectrometry (LC-MS)
method was developed for the determination of enalapril and enalaprilat in human
plasma. Detection of analytes was achieved by tandem mass spectrometry with
electrospray ionization (ESI) interface in positive ion mode which was operated under
the multiple-reaction monitoring mode. Sample pretreatment was involved in a one-
step protein precipitation (PPT) with per chloric acid of plasma. The reconstituted
samples were chromatographed on C18 column by pumping methanol: water: acid
formic 74:24:2 (v/v) at a flow rate of 0.2 mL/min. Each plasma sample was
chromatographed within1.25 min. The standard curves were found to be linear in the
range of 0.1–20 ng/mL of enalapril and enalaprilat with mean correlation coefficient of
≥0.999 for each analyte. The intra-day and inter-day precision and accuracy results
were well within the acceptable limits. The limit of quantification (LOQ) was 0.1ng/ml
for enalapril and enalaprilat. The lower limit of detection (LOD) was 0.08 ng/ml for
enalapril and enalaprilat.
Keywords: Enalapril, enalaprilat, LC-MS, human plasma
Original Article
PBR
Available online at http://pbr.mazums.ac.ir
Pharm Biomed Res 2015; 1(3): 47-58 DOI: 10.18869/acadpub.pbr.1.3.47
* E-mail: [email protected]
Dow
nloa
ded
from
pbr
.maz
ums.
ac.ir
at 6
:14
+04
30 o
n F
riday
Jun
e 1s
t 201
8
[ DO
I: 10
.188
69/a
cadp
ub.p
br.1
.3.4
7 ]
Danafar et al.
Pharm Biomed Res, 2015; 1 (3): 48
spectrometry, LC–MS/MS (8,9) and
LC–MS (10,11), was used in the
determination of enalapril and
enalaprilat. But the long analysis time
(>3.5 min), large volume of plasma
sample (>0.5 mL), or low extraction
recovery may not meet the requirement
for high throughput, speed and
sensitivity in bio sample analysis.for
quantitative analysis. Although these
problems could be solved by using
both low pH and high column
temperature, (12,13) these reported
HPLC methods are not adequate
forpharmacokinetic studies due to
relatively high detection limits(14-
16).A simple method that can
simultaneously determine enalapril and
enalaprilat in human plasma was
required.The pervious our work was
described determination of ezetimibe
by LC–MS method in human plasma
(17). Our aim was to develop and
validate a simple and rapid LC–MS
method for the quantification of
enalaprilat and enalapril in human
plasma. The developed assay method
was successfully applied to the
determination of enalapril and
enalaprilat in human plasma by LC-MS.
Materials and methods
Materials
Enalaprilat and enalapril maleate USP
Reference standards (USPC Inc.,
Rockville, MD) were kindly donated by
Dr Abidi Pharmaceutical Co. (Tehran,
Iran). Other chemicals and solvents
were from chemical lab or HPLC purity
grades, whenever needed, and were
purchased locally. Drug-free human
plasma was provided by Iranian Blood
Transfusion Organization after routine
safety evaluations.
Instrumentation and operating
conditions
Liquid chromatography
Liquid chromatography was performed
using Agilent LC-1200 HPLC system
consisting of an autosampler (Agilent,
USA). The column was a Zorbax XDB-
ODS C18 column (2.1mm×30mm, 3.5
µm) and was operated at 25◦C. The
mobile phase consisted of methanol:
water: formic acid 74:24:2 (v/v) was set
at a flow rate of 0.2 ml/min.
Mass spectrometry
Mass spectrometric detection was
performed using Agilent LCMS-6410
quadrupole mass spectrometer with
anelectrospray ionization (ESI)
interface. The ESI source was set at
positive ionization mode. The mass
selective detector was used in the
multiple reaction monitoring (MRM)
Figure 1 Chemical structures for (A) enalapril and (B) enalaprilat
Dow
nloa
ded
from
pbr
.maz
ums.
ac.ir
at 6
:14
+04
30 o
n F
riday
Jun
e 1s
t 201
8
[ DO
I: 10
.188
69/a
cadp
ub.p
br.1
.3.4
7 ]
Enalapril assay in plasma
Pharm Biomed Res 2015; 1 (3): 49
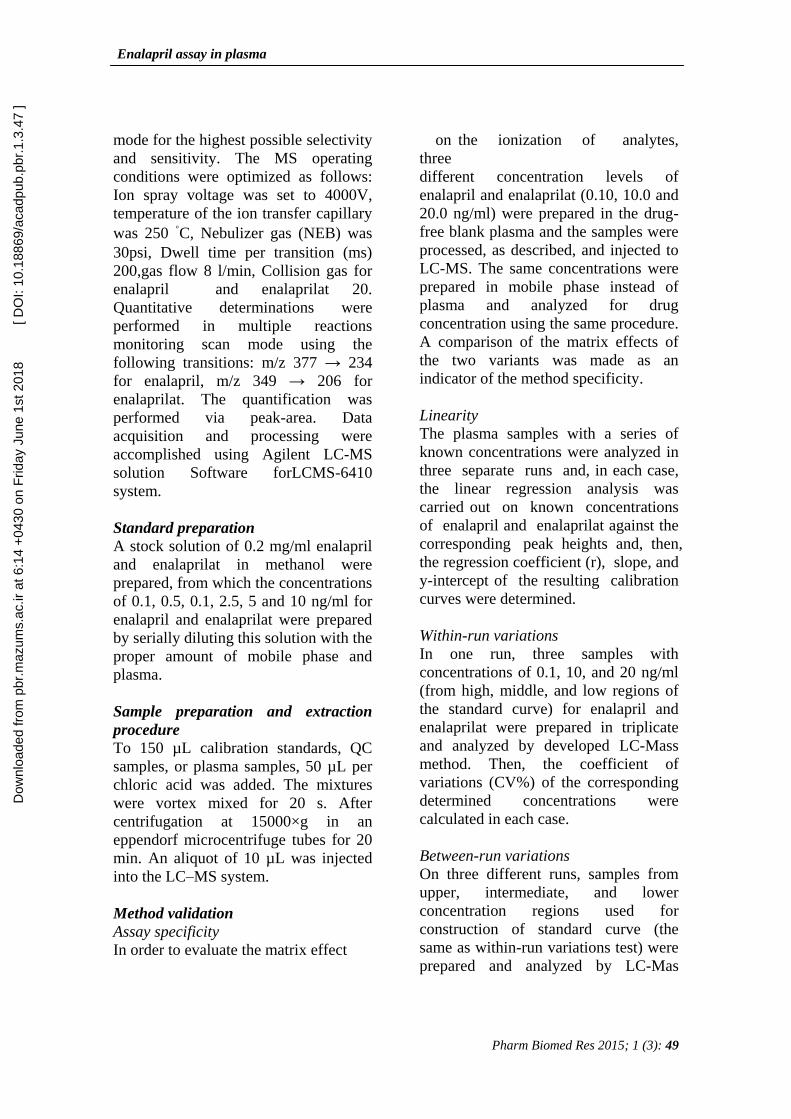
mode for the highest possible selectivity
and sensitivity. The MS operating
conditions were optimized as follows:
Ion spray voltage was set to 4000V,
temperature of the ion transfer capillary
was 250 ◦C, Nebulizer gas (NEB) was
30psi, Dwell time per transition (ms)
200,gas flow 8 l/min, Collision gas for
enalapril and enalaprilat 20.
Quantitative determinations were
performed in multiple reactions
monitoring scan mode using the
following transitions: m/z 377 → 234
for enalapril, m/z 349 → 206 for
enalaprilat. The quantification was
performed via peak-area. Data
acquisition and processing were
accomplished using Agilent LC-MS
solution Software forLCMS-6410
system.
Standard preparation
A stock solution of 0.2 mg/ml enalapril
and enalaprilat in methanol were
prepared, from which the concentrations
of 0.1, 0.5, 0.1, 2.5, 5 and 10 ng/ml for
enalapril and enalaprilat were prepared
by serially diluting this solution with the
proper amount of mobile phase and
plasma.
Sample preparation and extraction
procedure
To 150 µL calibration standards, QC
samples, or plasma samples, 50 µL per
chloric acid was added. The mixtures
were vortex mixed for 20 s. After
centrifugation at 15000×g in an
eppendorf microcentrifuge tubes for 20
min. An aliquot of 10 µL was injected
into the LC–MS system.
Method validation
Assay specificity
In order to evaluate the matrix effect
on the ionization of analytes,
three
different concentration levels of
enalapril and enalaprilat (0.10, 10.0 and
20.0 ng/ml) were prepared in the drug-
free blank plasma and the samples were
processed, as described, and injected to
LC-MS. The same concentrations were
prepared in mobile phase instead of
plasma and analyzed for drug
concentration using the same procedure.
A comparison of the matrix effects of
the two variants was made as an
indicator of the method specificity.
Linearity
The plasma samples with a series of
known concentrations were analyzed in
three separate runs and, in each case,
the linear regression analysis was
carried out on known concentrations
of enalapril and enalaprilat against the
corresponding peak heights and, then,
the regression coefficient (r), slope, and
y-intercept of the resulting calibration
curves were determined.
Within-run variations
In one run, three samples with
concentrations of 0.1, 10, and 20 ng/ml
(from high, middle, and low regions of
the standard curve) for enalapril and
enalaprilat were prepared in triplicate
and analyzed by developed LC-Mass
method. Then, the coefficient of
variations (CV%) of the corresponding
determined concentrations were
calculated in each case.
Between-run variations
On three different runs, samples from
upper, intermediate, and lower
concentration regions used for
construction of standard curve (the
same as within-run variations test) were
prepared and analyzed by LC-Mas
Dow
nloa
ded
from
pbr
.maz
ums.
ac.ir
at 6
:14
+04
30 o
n F
riday
Jun
e 1s
t 201
8
[ DO
I: 10
.188
69/a
cadp
ub.p
br.1
.3.4
7 ]
Danafar et al.
Pharm Biomed Res, 2015; 1(3): 50
method. Then, the corresponding CV%
values were calculated.
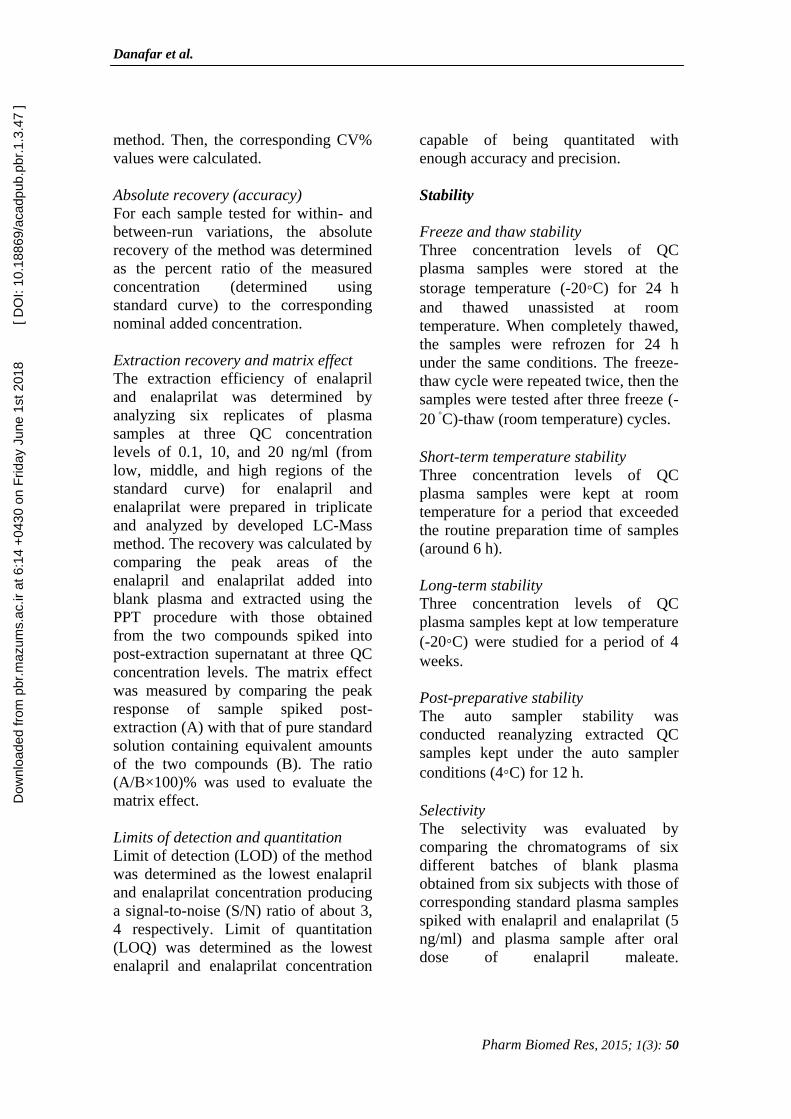
Absolute recovery (accuracy)
For each sample tested for within- and
between-run variations, the absolute
recovery of the method was determined
as the percent ratio of the measured
concentration (determined using
standard curve) to the corresponding
nominal added concentration.
Extraction recovery and matrix effect
The extraction efficiency of enalapril
and enalaprilat was determined by
analyzing six replicates of plasma
samples at three QC concentration
levels of 0.1, 10, and 20 ng/ml (from
low, middle, and high regions of the
standard curve) for enalapril and
enalaprilat were prepared in triplicate
and analyzed by developed LC-Mass
method. The recovery was calculated by
comparing the peak areas of the
enalapril and enalaprilat added into
blank plasma and extracted using the
PPT procedure with those obtained
from the two compounds spiked into
post-extraction supernatant at three QC
concentration levels. The matrix effect
was measured by comparing the peak
response of sample spiked post-
extraction (A) with that of pure standard
solution containing equivalent amounts
of the two compounds (B). The ratio
(A/B×100)% was used to evaluate the
matrix effect.
Limits of detection and quantitation
Limit of detection (LOD) of the method
was determined as the lowest enalapril
and enalaprilat concentration producing
a signal-to-noise (S/N) ratio of about 3,
4 respectively. Limit of quantitation
(LOQ) was determined as the lowest
enalapril and enalaprilat concentration
capable of being quantitated with
enough accuracy and precision.
Stability
Freeze and thaw stability
Three concentration levels of QC
plasma samples were stored at the
storage temperature (-20◦C) for 24 h
and thawed unassisted at room
temperature. When completely thawed,
the samples were refrozen for 24 h
under the same conditions. The freeze-
thaw cycle were repeated twice, then the
samples were tested after three freeze (-
20 ◦C)-thaw (room temperature) cycles.
Short-term temperature stability
Three concentration levels of QC
plasma samples were kept at room
temperature for a period that exceeded
the routine preparation time of samples
(around 6 h).
Long-term stability
Three concentration levels of QC
plasma samples kept at low temperature
(-20◦C) were studied for a period of 4
weeks.
Post-preparative stability
The auto sampler stability was
conducted reanalyzing extracted QC
samples kept under the auto sampler
conditions (4◦C) for 12 h.
Selectivity
The selectivity was evaluated by
comparing the chromatograms of six
different batches of blank plasma
obtained from six subjects with those of
corresponding standard plasma samples
spiked with enalapril and enalaprilat (5
ng/ml) and plasma sample after oral
dose of enalapril maleate.
Dow
nloa
ded
from
pbr
.maz
ums.
ac.ir
at 6
:14
+04
30 o
n F
riday
Jun
e 1s
t 201
8
[ DO
I: 10
.188
69/a
cadp
ub.p
br.1
.3.4
7 ]

Enalapril assay in plasma
Pharm Biomed Res 2015; 1 (3): 51
Results and discussion
Sample preparation
Liquid–liquid extraction (LLE) and
solid-phase extraction (SPE) are
techniques often used in the preparation
of biological samples for their ability to
improve the sensitivity and robustness
of assay. SPE was employed in the
extract of enalapril and enalaprilat from
plasma samples (9) in which the
recoveries were not reported . LLE was
also reported in the literature (8) for the
sample pretreatment of enalapril and
enalaprilat in human plasma, the
recoveries were only around 65% and
24% for the two compounds,
respectively. The significantly different
extraction recoveries for enalapril and
enalaprilat are due to the difference in
hydrophobic character between them.
The recoveries of enalapril and
enalaprilat with protein precipitation
were increased to compare with LLE
(10), but the sensitivity was not
satisfactory without a concentrate
procedure. In the present method, a
protein precipitation method was
adopted which provided high recovery
for both analytes. Under the optimal
LC–MS conditions, the obtained
sensitivity was higher than that reported
in the literature (10). Therefore no
further concentration procedure was
needed; the sample preparation
procedure was simplified. Both
methanol and HClO4 could be taken as
the protein precipitant. They provided
equivalent extraction recovery. HClO4
was chosen as the precipitant for its
better compatibility with mobile phase.
LC–MS condition optimization
LC–MS operation parameters were
carefully optimized for determination of
enalapril and enalaprilat. The mass
spectrometer was tuned in both positive
and negative ionization modes with ESI
for both enalapril and enalaprilat
containing secondary amino and
carboxy groups. Both signal intensity
and ratio of signal to noise obtained in
positive ionization mode were much
greater than those in negative ionization
mode. Parameters such as desolation
temperature, ESI source temperature,
capillary and cone voltage, flow rate of
desolation gas and cone gas were
optimized to obtain highest intensity of
protonated molecules of the two
compounds. The product ion scan spec-
tra showed high abundance fragment
ions at m/z 234 and 206 for enalapril
and enalaprilat, respectively. The
collision gas pressure and collision
energy of collision-induced
decomposition CI were optimized for
maximum response of the fragmentation
of the two compounds. Multiple
reaction monitoring (MRM) using the
precursor → product ion transition of
m/z 377 → m/z 234, m/z349 → m/z
206 was employed for quantification of
enalapril and enalaprilat, respectively.
The multiple-reaction monitoring
mode(MRM)(+) chromatograms
extracted from supplemented plasma are
depicted in Fig.2 as shown, the retention
times of enalapril and enalaprilat were
1.23 min. The total HPLC–MS analysis
time was 1.25 min per sample.
Method validation
Assay specificity
As it is clearly evident from the typical
chromatograms of the developed
method shown in Fig.2, there are no
discernible interferences between the
matrix factors and the analyte. This, in
turn, ensures obtaining reliable results
from the method for determination of
Dow
nloa
ded
from
pbr
.maz
ums.
ac.ir
at 6
:14
+04
30 o
n F
riday
Jun
e 1s
t 201
8
[ DO
I: 10
.188
69/a
cadp
ub.p
br.1
.3.4
7 ]
Danafar et al.
Pharm Biomed Res, 2015; 1 (3): 52
(A)
(B)
(D)
(C)
(E)
(F)
(G)
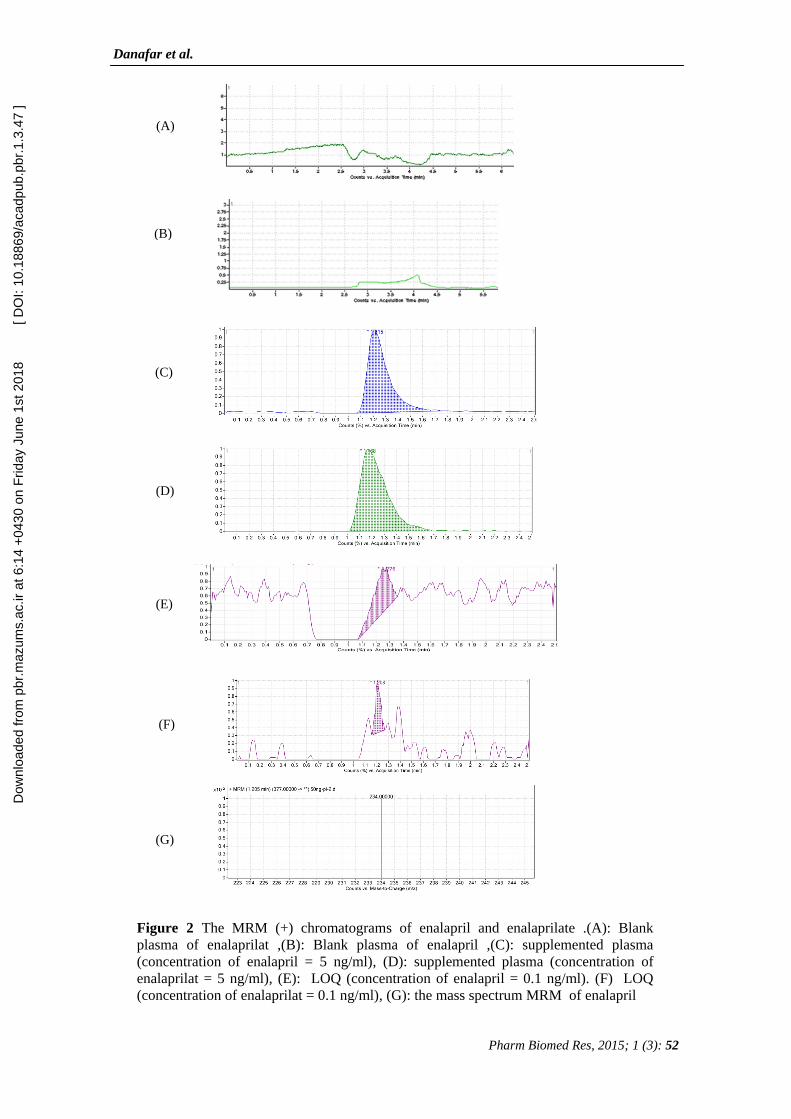
Figure 2 The MRM (+) chromatograms of enalapril and enalaprilate .(A): Blank
plasma of enalaprilat ,(B): Blank plasma of enalapril ,(C): supplemented plasma
(concentration of enalapril = 5 ng/ml), (D): supplemented plasma (concentration of
enalaprilat = 5 ng/ml), (E): LOQ (concentration of enalapril = 0.1 ng/ml). (F) LOQ
(concentration of enalaprilat = 0.1 ng/ml), (G): the mass spectrum MRM of enalapril
Dow
nloa
ded
from
pbr
.maz
ums.
ac.ir
at 6
:14
+04
30 o
n F
riday
Jun
e 1s
t 201
8
[ DO
I: 10
.188
69/a
cadp
ub.p
br.1
.3.4
7 ]
Enalapril assay in plasma
Pharm Biomed Res 2015; 1 (3): 53
biological concentrations of enalapril
and enalaprilat.
Linearity and LOQ The method produced linear responses
throughout the enalapril and enalaprilat.
Concentration range of 0.1-10 ng/ml for
enalapril and enalaprilat, which is
suitable for intended purposes. A typical
linear regression equation of the method
was: y = 2867 x + 1132, for enalapril
and y = 456.2 x + 121,for enalaprilat,
with x and y representing concentration
(in ng/ml) and peak height (in arbitrary
units), respectively, and the regression
coefficient (r) of 0.999. The LLOQ for
the two compounds was 0.1 ng/ml in
plasma corresponded to an on-column
sensitivity of 1.06 pg, which was lower
than those reported in literature (5–9,11).
The lower limit of detection for
enalapril and enalaprilat were 0.08
ng/ml. Figures 2 E, F show the
chromatogram of an extracted sample
that contained (LOQ) of enalapril and
enalaprilat. Figures 2 C, D show the
chromatogram ofan extracted sample
that contained of enalapril and
enalaprilat with concentrations of
5ng/ml. Figure 2 G show the
precursor → product ion transition of
m/z 377 → m/z 234 of enalapril.
Within-run variations and accuracy
The within-run variations of the
developed LC-Mass method as well as
the corresponding absolute recoveries
are shown in tables 1and 2.
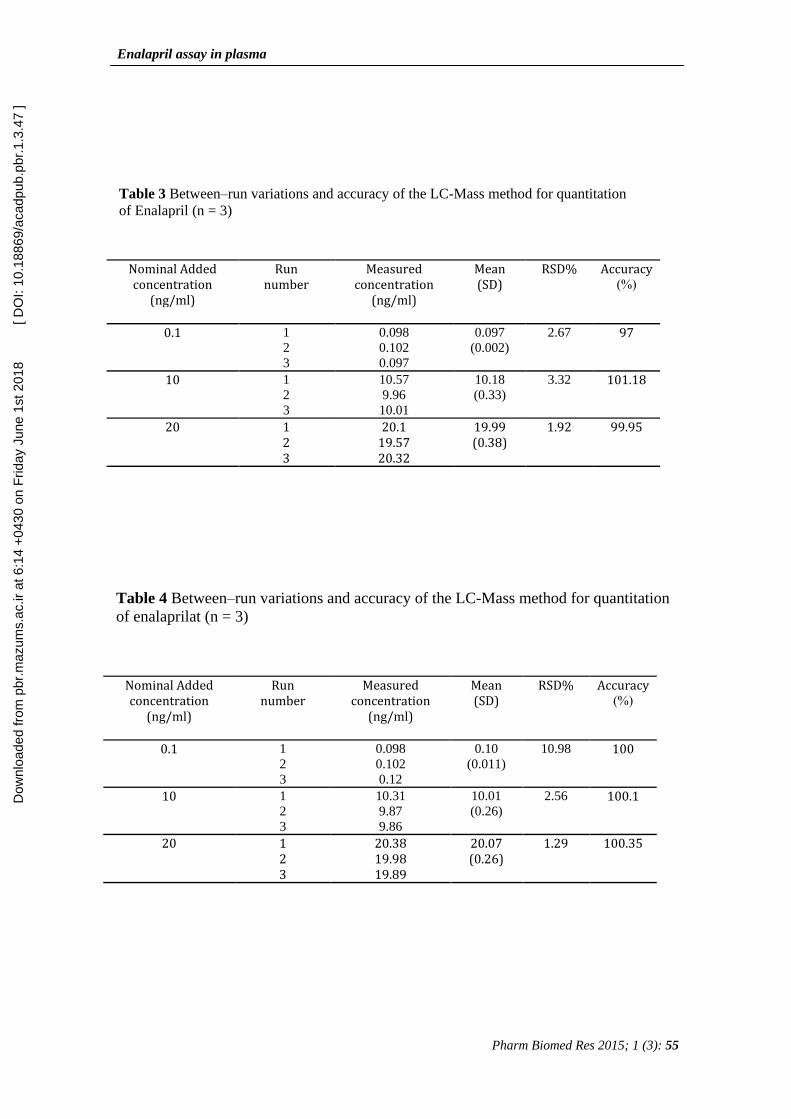
Between-run variations and accuracy
The between-run variations of the
developed LC-Mass method as well as
the corresponding absolute recoveries
are shown in table 3and 4.
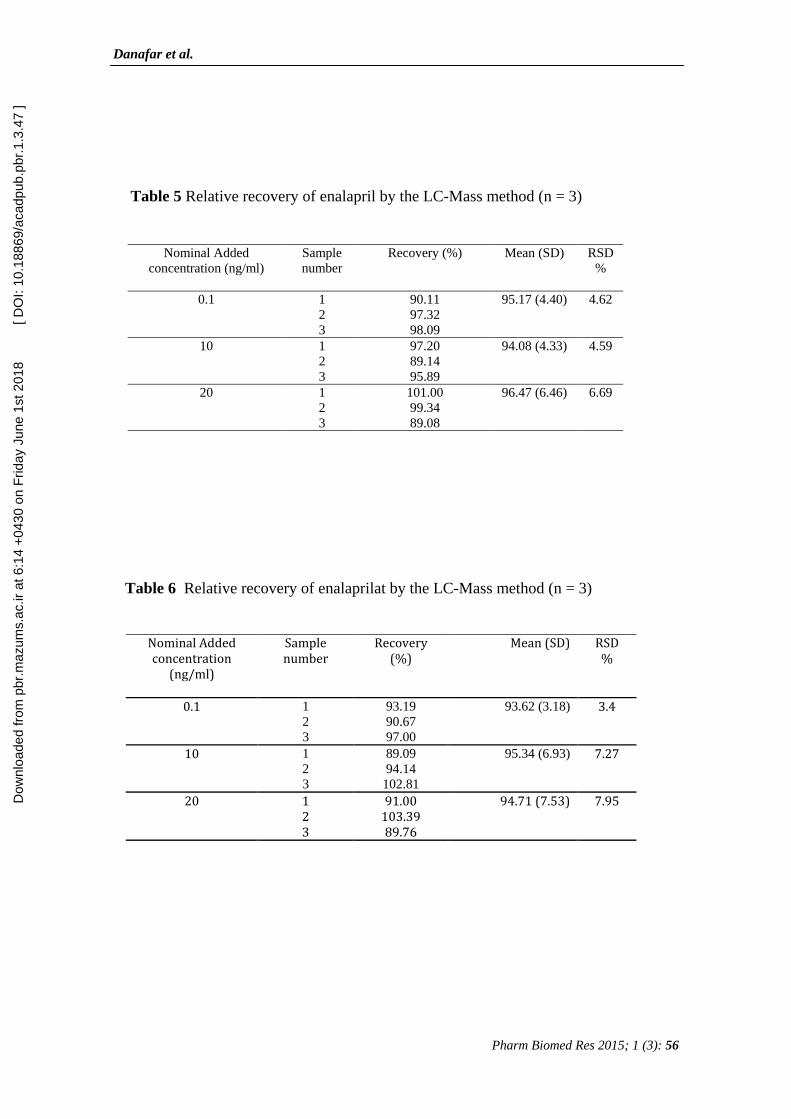
Extraction recovery
The extraction recovery determined for
enalapril and enalapril at were shown to
be consistent, precise and reproducible.
Data were shown below in Table 5,6.
The extraction recoveries from QC
samples at low, middle and high
concentrations were 95.17±4.4%,
94.08±4.33%, 96.47±6.46% for
enalapril and 93.62±3.18%,
95.34±6.93%, 94.71±7.53% for
enalaprilat, respectively. The recoveries
were much higher than those reported in
the literature (8, 10) for the two
compounds. In terms of matrix effect,
all the ratios defined as in Section 2
were between 85% and 115%. No
significant matrix effect for enalapril
and enalaprilat was observed indicating
that no co-eluting substance could
influence the ionization of the analytes.
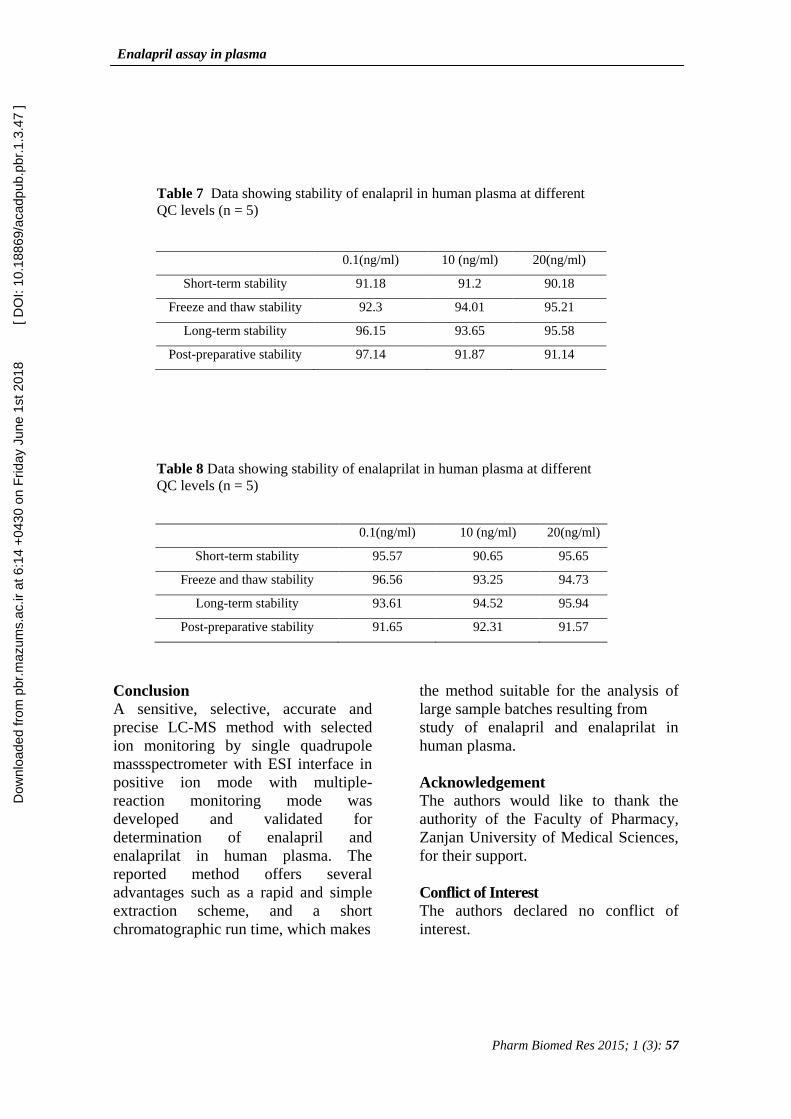
Stability
Tables 7 and 8 summarizes the freeze
and thaw stability, short-term stability,
long-term stability and post-preparative
stability data enalapril and enalaprilat.
All the results showed the stability
behavior during these tests and there
were no stability related problems
during the samples routine analysis for
thepharmacokinetic, bioavailability or
bioequivalence studies. The stability of
working solutions was tested at room
temperature for 6 h. Based on the results
obtained, these working solutions were
stable within 6 h.
Selectivity
Selectivity was determined by
comparing the chromatograms of six
different batches of blank human
plasma with the corresponding spiked
plasma. As shown in Fig.2, no
interference from endogenous substance
was observed at the retention time of
enalapril, and enlaprilat.
Dow
nloa
ded
from
pbr
.maz
ums.
ac.ir
at 6
:14
+04
30 o
n F
riday
Jun
e 1s
t 201
8
[ DO
I: 10
.188
69/a
cadp
ub.p
br.1
.3.4
7 ]

Danafar et al.
Pharm Biomed Res, 2015; 1 (3): 54
Accuracy
)%( RSD% Mean (SD) Measured
concentration (ng/ml)
Sample
number
Nominal Added concentration
(ng/ml)
98 3.55 0.098
(0.0035)
0.099
0.095
0.102
1
2
3
0.1
99.2 2.4 9.92 (0.24) 9.65
10.12
10.01
1
2
3
10
99.9 0.6 19.98 (0.12) 20.11 19.87 19.96
1 2 3
20
Table 1 Within–run variations and accuracy of the LC-Mass method for quantitation of
enalapril (n = 3)
Accuracy
)%( RSD% Mean (SD) Measured
concentration (ng/ml)
Sample
number
Nominal Added concentration
(ng/ml)
100 11.47 0.1 (0.012) 0.098
0.12
0.10
1
2
3
0.1
100.4 1.86 10.04 (0.18) 10.25
9.89
9.98
1
2
3
10
101.9 3.73 20.38(0.76) 19.51 21.02 20.58
1 2 3
20
Table 2 Within–run variations and accuracy of the LC-Mass method for quantitation of
enalaprilat (n = 3)
Dow
nloa
ded
from
pbr
.maz
ums.
ac.ir
at 6
:14
+04
30 o
n F
riday
Jun
e 1s
t 201
8
[ DO
I: 10
.188
69/a
cadp
ub.p
br.1
.3.4
7 ]
Enalapril assay in plasma
Pharm Biomed Res 2015; 1 (3): 55
Accuracy
)%( RSD% Mean
(SD)
Measured concentration
(ng/ml)
Run number
Nominal Added concentration
(ng/ml)
97 2.67 0.097
(0.002)
0.098
0.102
0.097
1
2
3
0.1
101.18 3.32 10.18
(0.33)
10.57
9.96
10.01
1
2
3
10
99.95 1.92 19.99 (0.38)
20.1 19.57 20.32
1 2 3
20
Table 3 Between–run variations and accuracy of the LC-Mass method for quantitation
of Enalapril (n = 3)
Accuracy
)%( RSD% Mean
(SD)
Measured concentration
(ng/ml)
Run number
Nominal Added concentration
(ng/ml)
100 10.98 0.10
(0.011)
0.098
0.102
0.12
1
2
3
0.1
100.1 2.56 10.01
(0.26)
10.31
9.87
9.86
1
2
3
10
100.35 1.29 20.07 (0.26)
20.38 19.98 19.89
1 2 3
20
Table 4 Between–run variations and accuracy of the LC-Mass method for quantitation
of enalaprilat (n = 3)
Dow
nloa
ded
from
pbr
.maz
ums.
ac.ir
at 6
:14
+04
30 o
n F
riday
Jun
e 1s
t 201
8
[ DO
I: 10
.188
69/a
cadp
ub.p
br.1
.3.4
7 ]
Danafar et al.
Pharm Biomed Res 2015; 1 (3): 56
RSD
%
Mean (SD) Recovery (%) Sample
number
Nominal Added
concentration (ng/ml)
4.62 95.17 (4.40) 90.11
97.32
98.09
1
2
3
0.1
4.59 94.08 (4.33) 97.20
89.14
95.89
1
2
3
10
6.69 96.47 (6.46) 101.00
99.34
89.08
1
2
3
20
Table 5 Relative recovery of enalapril by the LC-Mass method (n = 3)
RSD
% Mean (SD) Recovery
(%)
Sample number
Nominal Added concentration
(ng/ml)
3.4 93.62 (3.18) 93.19
90.67
97.00
1
2
3
0.1
7.27 95.34 (6.93) 89.09
94.14
102.81
1
2
3
10
7.95 94.71 (7.53) 91.00 103.39 89.76
1 2 3
20
Table 6 Relative recovery of enalaprilat by the LC-Mass method (n = 3)
Dow
nloa
ded
from
pbr
.maz
ums.
ac.ir
at 6
:14
+04
30 o
n F
riday
Jun
e 1s
t 201
8
[ DO
I: 10
.188
69/a
cadp
ub.p
br.1
.3.4
7 ]
Enalapril assay in plasma
Pharm Biomed Res 2015; 1 (3): 57
Conclusion
A sensitive, selective, accurate and
precise LC-MS method with selected
ion monitoring by single quadrupole
massspectrometer with ESI interface in
positive ion mode with multiple-
reaction monitoring mode was
developed and validated for
determination of enalapril and
enalaprilat in human plasma. The
reported method offers several
advantages such as a rapid and simple
extraction scheme, and a short
chromatographic run time, which makes
the method suitable for the analysis of
large sample batches resulting from
study of enalapril and enalaprilat in
human plasma.
Acknowledgement
The authors would like to thank the
authority of the Faculty of Pharmacy,
Zanjan University of Medical Sciences,
for their support.
Conflict of Interest
The authors declared no conflict of
interest.
0.1(ng/ml) 10 (ng/ml) 20(ng/ml)
Short-term stability 91.18 91.2 90.18
Freeze and thaw stability 92.3 94.01 95.21
Long-term stability 96.15 93.65 95.58
Post-preparative stability 97.14 91.87 91.14
Table 7 Data showing stability of enalapril in human plasma at different
QC levels (n = 5)
0.1(ng/ml) 10 (ng/ml) 20(ng/ml)
Short-term stability 95.57 90.65 95.65
Freeze and thaw stability 96.56 93.25 94.73
Long-term stability 93.61 94.52 95.94
Post-preparative stability 91.65 92.31 91.57
Table 8 Data showing stability of enalaprilat in human plasma at different
QC levels (n = 5)
Dow
nloa
ded
from
pbr
.maz
ums.
ac.ir
at 6
:14
+04
30 o
n F
riday
Jun
e 1s
t 201
8
[ DO
I: 10
.188
69/a
cadp
ub.p
br.1
.3.4
7 ]
Danafar et al.
Pharm Biomed Res 2015; 1 (3): 58
References 1. Tabacova SA, Kimmel CA. Enalapril:
pharmacokinetic/ dynamic inferences for
comparative developmental toxicity.
Reprod Toxicol 2001;15:467–78.
2. Smith DH. Treatment of hypertension with
an angiotensin II-receptor antagonist
compared with an angiotensin-converting
enzyme inhibitor: a review of clinical
studies of telmisartan and enalapril. Clin
Ther 2002;24:1484–501.
3. Niopas I, Daftsios AC, Nikolaidis N.
Bioequivalence study of two brands of
enalapril tablets after single oral
administration to healthy volunteers. Int J
Clin Pharmacol Ther 2003;41:226–30.
4. Tabacova SA, Kimmel CA. Optimization
of processing parameters for the mycelial
growth. Int J Cariol 2005;25:237–2.
5. Shioya H, Shimojo M, Kawahara Y.
Determination of enalapril and its active
metabolite enalaprilat in plasma and urine
by gas chromatography/mass spectrometry.
Biomed Chromatogr 1992;6:59–62.
6. Worland PJ, Jarrott B, Radioimmunoassay
for the quantitation of lisinopril and
enaprilat. J Pharm Sci 1986;75:512–6.
7. Thongnopnua P, Poeaknapo C. Liquid
chromatographic separation and UV
determination of certain antihypertensive
agents. J Pharm Biomed Anal
2005;37:763–9.
8. Gu Q, Chen XY, Zhong DF, Wang YW.
Quantification of enalapril in human
plasma by liquid chromatography –tandem
mass spectrometry. J Chromatogr B
2004;813: 337–42.
9. Lee J, Son J, Lee M, Lee KT, Kim DH.
Simultaneous quantitation of enalapril and
enalaprilat in human plasma by 96-well
solid-phase extraction and liquid
chromatography/tandem mass
spectrometry. Rapid Commun Mass
Spectrom 2003;17:1157–62.
10. Liu C, Yang LH, Ding L, Bian XJ.
Simultaneous quantitation of enalapril and
enalaprilat in human plasma by liquid
chromatography/tandem mass
spectrometry. Chin J Clin Pharm
2006;15:34–7.
11. Yoon KH, Kim W, Park J, Kim H.
Quantification of enalapril in human
plasma by liquid chromatography –tandem
mass spectrometry. J Bull Korean Chem
Soc 2004;25:878–80.
12. Trabelsi H, Bouabdallah S, Sabbah S,
Raouafi F, Bouzouita K. Study of the cis-
trans isomerization of enalapril by
reversed-phase liquid chromatography. J
Chromatogr A 2000;871:189-99.
13. Kocijan A, Grahek R, Kocjan D, Kralj LZ.
Simultaneous quantitation of enalapril and
enalaprilat in human plasma by 96-well
solid-phase extraction and liquid
chromatography/tandem mass
spectrometry. J Chromatogr B
2001;755:229-39.
14. Walily AFME, Belal SF, Heaba EA, Kersh
AE. Simultaneous determination of
enalapril maleate and hydrochlorothiazide
by first-derivative ultraviolet
spectrophotometry and high-performance
liquid chromatography. J Pharm Biomed
Anal 1995;13:851-6.
15. Qin XZ, Joe DM, Dominic PI.
Determination and rotamer separation
enalapril maleate by capillary
electrophoresis. J Chromatogr A
1995;707:245-55.
16. Tajerzadeh H, Hamidi M. A simple HPLC
method for quantitation of enalaprilat. J
Pharm Biomed Anal 2001;24:675-880.
17. Danafar H, Hamidi M. A Rapid and
Sensitive LC–MS Method for
Determination of Ezetimibe Concentration
in Human Plasma: Application to a
Bioequivalence Study. Chromatographia
2013;76:1667-75.
Dow
nloa
ded
from
pbr
.maz
ums.
ac.ir
at 6
:14
+04
30 o
n F
riday
Jun
e 1s
t 201
8
[ DO
I: 10
.188
69/a
cadp
ub.p
br.1
.3.4
7 ]