Embed Size (px)
Citation preview

Journal of Chromatography B, 729 (1999) 103–110
Liquid chromatographic determination of ethyl alcohol inbody fluids
*Sergio Pellegrino , Franca Sallio Bruno, Michele PetraruloToxicology and Pharmacology Unit, Laboratory of Clinical Chemistry, Mauriziano Umberto I Hospital, Largo Turati 62, 10128 Turin,
Italy
Received 4 January 1999; received in revised form 19 March 1999; accepted 23 March 1999
Abstract
A high-performance liquid chromatographic technique for ethyl alcohol determination in body fluids is proposed. Ethylalcohol is quantitatively converted into acetaldehyde-phenylhydrazone by oxidation in the presence of alcohol dehydro-genase, nicotinamide–adenine dinucleotide and phenylhydrazine. The derivative is suitable for reversed-phase liquidchromatography and ultraviolet detection at 276 nm. The limits of linearity, detection and quantification as well as accuracyand reproducibility were investigated in water, serum and whole blood. Analytical responses were linear within the 0.008 to5 g/ l range, and the limit of quantification was 0.02 g/ l both in aqueous standard and in biological matrix assays. Meananalytical recovery of ethyl alcohol in blood serum averaged 98.264.2%, imprecision (CV%) at 0.80 g/ l was 2.2%, and thelimit of quantification was 0.02 g/ l. Serum concentrations of persons that avoided alcoholic beverages for a week were lessthan the limit of quantification. Ethyl alcohol concentrations in serum and whole blood compared well with those obtainedby headspace gas chromatography. This simple and reliable procedure, which was also used for a urine assay, could besuitable for validation of the screening procedures used to monitor ethanol abuse. 1999 Elsevier Science B.V. All rightsreserved.
Keywords: Ethyl alcohol
1. Introduction be emphasised that blood ethanol determinationscarried out in the hospital laboratory for diagnostic
The determination of ethyl alcohol in blood, urine, purposes can subsequently assume forensic relevancesaliva and breath in man has become increasingly as evidence of intoxication.important for clinical, forensic and administrative Enzymatic–spectrophotometric or gas chromato-purposes; in particular, accurate ethanol determi- graphic procedures are currently employed. Thenation is required in law enforcement, with specific alcohol dehydrogenase (ADH, EC 1.1.1.1) spectro-application to automobile traffic violations. It should photometric method is commonly used for measuring
ethanol in biological samples. In the presence ofnicotinamide–adenine dinucleotide (NAD) and*Corresponding author. Tel.: 139-11-508-0374; fax: 139-11-508-ADH, the oxidation of ethanol produces acetal-0390.
E-mail address: [email protected] (S. Pellegrino) dehyde and reduced NAD (NADH), which is de-
0378-4347/99/$ – see front matter 1999 Elsevier Science B.V. All rights reserved.PI I : S0378-4347( 99 )00131-0

104 S. Pellegrino et al. / J. Chromatogr. B 729 (1999) 103 –110
tected spectrophotometrically. An alkaline pH and In this paper, a HPLC procedure for the quantita-the presence of a carbonyl-trapping agent (i.e. tive determination of ethyl alcohol in biologicalsemicarbazide) allow the oxidation to proceed [1]. fluids is described. It is based on the ADH–NAD-This method is used for routine screening purposes, mediated conversion of ethanol into acetaldehydehowever, to achieve legal defensibility, ‘positive’ that, in the presence of phenylhydrazine, is convertedresults should be confirmed using a second, more in turn into acetaldehyde-phenylhydrazone. This isspecific test [2]. suitable for reversed-phase liquid chromatographic
Gas chromatography (GC), which is widely used separation with detection by UV absorption [7].in the forensic medicine environment, is particularlyadvisable for the confirmation of enzyme-reaction-based assays [3]. However, GC has encountered only 2. Experimentallimited favour in clinical chemistry and emergencytoxicology. 2.1. Reagents and chemicals
High-performance liquid chromatography (HPLC)is widely employed in clinical chemistry and clinical Alcohol dehydrogenase (ADH, EC 1.1.1.1) fromtoxicology laboratories, and the availability of a bakers yeast (300–400 kU/g protein, lyophilisedreliable application for the confirmation of ethanol powder), phenylhydrazine and anhydrous sodiumscreening data would be appreciated in these en- pyrophosphate were purchased from Sigma (St.vironments. Louis, MO, USA). NAD lithium salt was purchased
The first application of a HPLC assay for the from Boehringer (Mannheim, Germany). Aqueousdetermination of ethyl alcohol in blood used electro- standard solutions of ethyl alcohol (0.5–4.0 g/ l)chemical detection to determine precolumn-gener- were from Merck (Darmstadt, Germany). Deion-ated NADH from ADH-catalyzed ethyl alcohol ised–distilled water was used.oxidation [4]. Because the inherent selectivity limit Solutions containing 480 mmol / l phenylhydrazineof the enzymatic assay, i.e., nonspecific production were prepared fresh before use by diluting 50 ml ofof NADH, could not be obviated by the use of this concentrated amine with 1.0 ml of water. TheHPLC procedure, its accuracy and reliability do not following reagents were stored at 48C until use:differ greatly from that of the spectrophotometric ADH suspension, 7500 U dissolved in 5 ml of watermethod. A further application of a HPLC assay for (stable for one month); aqueous solution of NAD (50ethyl alcohol in blood used a post-column enzymatic mmol / l, prepared weekly); aqueous solution ofreaction with electrochemical detection. The alcohol, Na P O (75 mmol / l), brought to pH 9.2 with4 2 7
separated on the column, is converted by immobil- concentrated hydrochloric acid (prepared monthly)..ised alcohol oxidase from Candida boidinii into Aqueous KH PO (14.70 mmol / l; A) and K HPO ?2 4 2 4
acetaldehyde, with the formation of a stoichiometric 3H O (8.76 mmol / l; B) solutions and HPLC-grade2
amount of hydrogen peroxide, which was detected acetonitrile (C) were used in the preparation of thevia oxidation at a platinum electrode [5]. This mobile phase. The work-environment was checkedprocedure can hardly be used for routine purposes, for the absence of ethanol solutions before reagentmainly because of the limited life of the enzymatic preparation and assays.reactor [2]. In a recently described HPLC procedurewith pre-column enzyme-mediated derivatisation of 2.2. Samplesethanol, deproteinised blood was reacted with ADH–NAD and then with cyclohexanedione reagents, to Blood serum and heparinised whole blood sam-obtain a fluorescent derivative of acetaldehyde [6]. ples, drawn into vacuum tubes (Becton DickinsonThe procedure is laborious and time-consuming: it Vacutainer Systems, NJ, USA), and postmortemrequires the deproteinisation of blood, the enzymatic whole blood samples were collected, stored atconversion of ethanol into acetaldehyde, a 60-min- 2208C and analyzed within two weeks. Ethyl al-long derivatisation reaction at 708C and a complex cohol concentrations in samples from 14 healthyinjection system. subjects who had been free from alcohol consump-

S. Pellegrino et al. / J. Chromatogr. B 729 (1999) 103 –110 105
tion for at least one week were taken as ‘negative’ elsewhere [8,9]. In order to investigate the lower andcontrol data. Forty-eight serum specimens from upper limits of linearity (LOL), detection (LOD) andpersons that ingested alcoholic beverages and eight quantitation (LOQ) of ethanol in water, a series ofpostmortem blood samples were also analyzed with aqueous standard solutions containing progressivelythe proposed method, in parallel with headspace lower concentrations of ethyl alcohol, ranging be-gas-chromatography. tween 10.0 and 0.002 g/ l, was prepared. Each
specimen was processed in triplicate and the ana-2.3. Sample preparation lytical responses were corrected for the mean of the
reagent blanks.To 1.0 ml of pyrophosphate buffer, placed in a The corrected mean analytical responses of aque-
1.5-ml capped glass vial, 40 ml of phenylhydrazine ous matrix against theoretical ethanol concentrationssolution, 80 ml of NAD solution and 20 ml (30 U) of were plotted. A range of concentrations that gave aADH suspension were added and the mixture was linear curve was selected and a linear equation wasshaken for 10 s. A 20-ml volume of sample, standard computed by least squares regression. The criterionor water was added, the mixture was mixed again to determine the LOL in water required that the firstand incubated at room temperature. After an incuba- point beyond the range of linearity should deviate bytion time of 30 min, 10 ml aliquots of the mixture more than 10% (arbitrarily selected) from a targetwere injected into the column. value predicted by the linear regression.
Endogenous acetaldehyde, when needed, was ana- Likewise, the LOD was the lowest observed meanlyzed by following the same procedure, but omitting concentration that did not deviate from the targetthe addition of both ADH and NAD to the otherwise value by more than 10%.complete reaction mixture. Once the lowest detectable concentration was
determined, ten replicates of this concentration were2.4. Chromatographic conditions analyzed and the mean and standard deviation were
determined. The limit of quantification (LOQ) wasThe chromatographic apparatus was from Hitachi calculated as the LOD plus ten times the SD [9].
(Tokio, Japan) and consisted of an L-6200 solvent Subsequently, a set of aqueous ethanol concentra-delivery module, an L-4250 UV–Vis detector, an tions, selected within the range of linearity, was usedAS-2000 autosampling injector and a D-2500 as the calibrating standards for the assays of bio-Chromato-Integrator. The detector was set at 276 logical samples.nm, 0.002 a.u.f.s., and the integrator input was set at Selected negative (i.e. no detectable difference128 mV, full scale. An octadecylsilyl (25034 mm) with reagent blank) serum and postmortem wholeLiChrospher 100 RP-18 5 mm column (Merck) was blood samples were used to obtain specimens con-used throughout, with a 434 mm LiChrospher 100 taining known and progressively lower concentra-RP-18 5 mm (Merck) guard column. The isocratic tions of ethanol in the range between 10.0 and 0.002elution was performed at a flow-rate of 1.5 ml /min, g / l: the LOL, LOD and LOQ were determined byat room temperature, using a ternary mixture of following the procedure described above for a waterA–B–C (15:45:40, v /v). Peak area was used to matrix.quantify the analytical response. Results were calcu-lated by using a five-point external standard cali- 2.6. Comparison procedurebration, including a reagent blank. Samples withethanol concentrations exceeding 4.0 g/ l were di- A Fractovap GI 450 gas chromatograph (Carloluted four-fold and reanalysed. Erba, Milan, Italy) equipped with a flame-ionisation
detector, a head-space autosampler and an integrator2.5. Analytical validation was used. Gas-chromatographic conditions were as
follows: glass column (2 m34 mm I.D.) packed withThe experimental approach to the analytical vali- 60 /80 mesh Carbopack B coated with 5% Carbowax
dation is essentially based on schemes reported 20M; carrier gas, nitrogen; flow-rate, 50 ml /min;

106 S. Pellegrino et al. / J. Chromatogr. B 729 (1999) 103 –110
column temperature, 958C; injector and detector and the virtual absence of interfering peaks, anytemperatures, 1508C. Serum samples and standards wavelength in the range between 250 and 320 nmwere diluted with an equal volume of water con- could be suitable for the assay. In this work, the peaktaining n-propanol, 10 g/ l (internal standard), and area of the more retained isomer, measured at 276were allowed to sit in the autosampler for 3 h at nm, was chosen as the analytical signal because of608C before the injection of 100 ml of vapor [3]. its higher response.
The conversion of ethyl alcohol into acetaldehyde-phenylhydrazone in the presence of ADH and
3. Results phenylhydrazine was found to take place, givingraise to the above isomers (Fig. 2). Apart from some
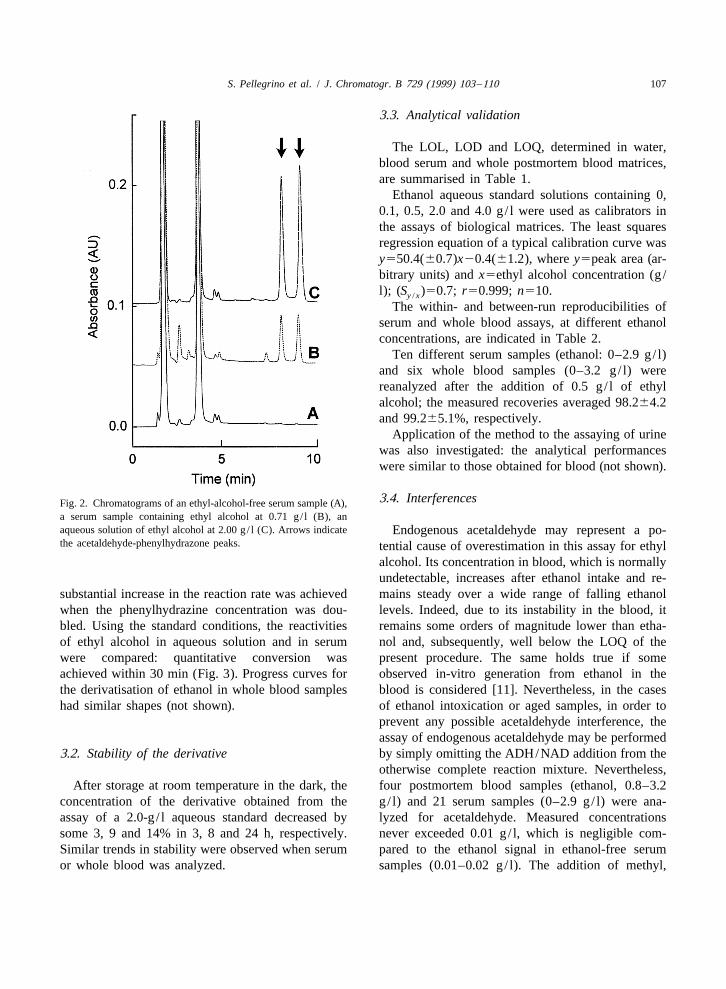
3.1. Enzyme reaction additional peaks eluting within the first 3 min of thechromatographic run, the chromatographic traces of
Phenylhydrazine reacts with activated carbonyl serum, whole blood or urine samples did not differgroups to form the corresponding UV-absorbing from that of aqueous standards. The peak area ratiosphenylhydrazones [7,10]; reaction with acetaldehyde, of the two isomers were the same as that measuredin the presence of the pyrophosphate buffer at pH with the reaction of acetaldehyde, and were in-9.2, produces two syn- and anti-diastereoisomers that dependent of the different kind of matrix analyzed.are suitable for reversed-phase liquid chromatog- No carryover was observed after consecutive runs ofraphy. Using the above chromatographic conditions, samples containing elevated ethanol concentrations.they were resolved, giving two distinct peaks. The The time-course of the derivatisation was monitoredUV absorption spectrum for each isomer was as- by analyzing a serum sample containing ethanol,sessed by repeating runs at different wavelengths and 1.52 g/ l, and by varying the amount of enzymeplotting the corresponding peak areas. Although between 7.5 and 75 U. Apart from the amount ofshifted by some 5–10 nm, the two spectra were of enzyme, the operative conditions were those de-similar shape: l of the less-retained isomer was scribed above. By using 15 or more units of enzyme,max
272 nm, whereas that of the more retained one was the reaction rates had similar shapes; during the first276 nm (Fig. 1). 30 min, the derivative concentration increased, but
Because of the high absorption of the derivative afterwards, it remained stable for at least 3 h. No
Fig. 1. Ultraviolet absorption spectra of the less retained (dashed line) and more retained (unbroken line) acetaldehyde-phenylhydrazonestereoisomers.
S. Pellegrino et al. / J. Chromatogr. B 729 (1999) 103 –110 107
3.3. Analytical validation
The LOL, LOD and LOQ, determined in water,blood serum and whole postmortem blood matrices,are summarised in Table 1.
Ethanol aqueous standard solutions containing 0,0.1, 0.5, 2.0 and 4.0 g/ l were used as calibrators inthe assays of biological matrices. The least squaresregression equation of a typical calibration curve wasy550.4(60.7)x20.4(61.2), where y5peak area (ar-bitrary units) and x5ethyl alcohol concentration (g /l); (S )50.7; r50.999; n510.y / x
The within- and between-run reproducibilities ofserum and whole blood assays, at different ethanolconcentrations, are indicated in Table 2.
Ten different serum samples (ethanol: 0–2.9 g/ l)and six whole blood samples (0–3.2 g/ l) werereanalyzed after the addition of 0.5 g/ l of ethylalcohol; the measured recoveries averaged 98.264.2and 99.265.1%, respectively.
Application of the method to the assaying of urinewas also investigated: the analytical performanceswere similar to those obtained for blood (not shown).
3.4. InterferencesFig. 2. Chromatograms of an ethyl-alcohol-free serum sample (A),a serum sample containing ethyl alcohol at 0.71 g/ l (B), anaqueous solution of ethyl alcohol at 2.00 g/ l (C). Arrows indicate Endogenous acetaldehyde may represent a po-the acetaldehyde-phenylhydrazone peaks. tential cause of overestimation in this assay for ethyl
alcohol. Its concentration in blood, which is normallyundetectable, increases after ethanol intake and re-
substantial increase in the reaction rate was achieved mains steady over a wide range of falling ethanolwhen the phenylhydrazine concentration was dou- levels. Indeed, due to its instability in the blood, itbled. Using the standard conditions, the reactivities remains some orders of magnitude lower than etha-of ethyl alcohol in aqueous solution and in serum nol and, subsequently, well below the LOQ of thewere compared: quantitative conversion was present procedure. The same holds true if someachieved within 30 min (Fig. 3). Progress curves for observed in-vitro generation from ethanol in thethe derivatisation of ethanol in whole blood samples blood is considered [11]. Nevertheless, in the caseshad similar shapes (not shown). of ethanol intoxication or aged samples, in order to
prevent any possible acetaldehyde interference, theassay of endogenous acetaldehyde may be performed
3.2. Stability of the derivative by simply omitting the ADH/NAD addition from theotherwise complete reaction mixture. Nevertheless,
After storage at room temperature in the dark, the four postmortem blood samples (ethanol, 0.8–3.2concentration of the derivative obtained from the g/ l) and 21 serum samples (0–2.9 g/ l) were ana-assay of a 2.0-g / l aqueous standard decreased by lyzed for acetaldehyde. Measured concentrationssome 3, 9 and 14% in 3, 8 and 24 h, respectively. never exceeded 0.01 g/ l, which is negligible com-Similar trends in stability were observed when serum pared to the ethanol signal in ethanol-free serumor whole blood was analyzed. samples (0.01–0.02 g/ l). The addition of methyl,

108 S. Pellegrino et al. / J. Chromatogr. B 729 (1999) 103 –110
Fig. 3. Progress curves for ethyl alcohol derivatisation. The reaction was carried out as described in the text. Analysis of an aqueousstandard solution, 1.0 g / l (s), a serum sample containing 1.52 g/ l of ethyl alcohol (d) and of the same serum supplemented with 1.00 g/ lof ethyl alcohol (j).
Table 1Ranges of linearity (n53) and limits of detection and quantification (n510)
Sample Investigated Range of LOD LOQmatrix conc. range linearity (g / l)
(g / l) (g / l) (g / l) SD (g/ l) CV (%)
Water 0.002–10.0 0.008–6.0 0.0082 0.0012 14.7 0.020Blood serum 0.002–10.0 0.008–5.0 0.0074 0.0010 13.7 0.017Whole blood 0.002–10.0 0.008–5.0 0.0076 0.0009 11.9 0.017
Table 2aReproducibility for the replicate assays of serum and whole blood samples spiked with known concentrations of ethanol
Theoretical Blood serum Whole bloodconcentration(g / l) Found Within-run Between-run Found Within-run Between-run
(g / l) CV CV (g/ l) CV CV(%) (%) (%) (%)
0.02 0.02 8.1 9.4 0.02 9.1 9.50.20 0.20 3.7 4.1 0.21 4.0 4.20.80 0.80 2.2 2.8 0.78 2.3 2.71.00 1.01 1.9 2.4 1.02 2.0 2.35.00 4.86 4.2 5.3 4.90 3.9 5.1
a Replicate assays comprised five independent assays of frozen stored samples carried out within the batch and on different days.

S. Pellegrino et al. / J. Chromatogr. B 729 (1999) 103 –110 109
Fig. 4. Comparison between ethanol concentrations in serum (d) and in postmortem whole blood (h) measured by HPLC ( y) andheadspace GC (x) techniques. Least-squares regression equations for serum [y50.986(60.014)x10.013(60.020); S 50.088 g/ l; r50.995;y / x
n548) and whole blood ( y50.970(60.020)x10.016(60.020); S 50.055 g/ l; r50.999; n58) specimens. Straight line is y5x.y / x
n-propyl, isopropyl and n-butyl alcohols (0.5 g / l [4], by which any inherent unspecificity of theeach) to a pooled serum sample did not affect the enzyme reaction could not be obviated. Nevertheless,ethanol assay. The same held true when serum was other HPLC procedures, which used immobilisedspiked with the most common short chain aldehydes enzyme for post-column reaction, are not very usefulor a-keto acids (formaldehyde, glyoxylic acid, for routine purposes, mainly because of the need forpyruvic and b-hydroxy pyruvic acids, a-ketobutyric periodical enzyme reaction coil preparation and itsand a-ketovaleric acids). limited stability [2], whereas our procedure uses
stable reagents and reproducible conditions of re-3.5. Comparison procedure action.
When the reliability of the chromatographic meth-Forty-eight serum samples from persons that had od is compared to that of the enzyme–spectrophoto-
consumed alcohol and eight postmortem blood sam- metric one, it can be observed that both use aples were analysed by using the HPLC procedure, specific enzyme reaction, but, with the former meth-and were reanalysed using headspace gas-chromatog- od, the analytical marker is resolved chromatograph-raphy: there was a close correspondence (Fig. 4). ically from any potential interference, which is an
additional selectivity factor.A further factor substantiates the reliability of the
4. Discussion procedure, i.e., the reproducibility, recovery data andextension of the linear ranges for water, serum and
Previous liquid chromatographic applications for whole blood assays are similar.assaying ethanol in biological fluids were affected by Although the criterion adopted for establishing theeither inaccuracy [4] or costly and tedious reagent LOLs and LODs [8,9] is restrictive, the dynamicpreparation [5–6]. The present liquid chromato- range of linearity is extended enough (the uppergraphic determination of ethyl alcohol is more LOL is some 300-fold higher than the LOQ): thespecific than the former HPLC method that used upper LOLs exceed the highest ethanol blood con-precolumn-generated NADH as the analytical marker centrations that are usually encountered in a toxicol-

110 S. Pellegrino et al. / J. Chromatogr. B 729 (1999) 103 –110
ogy laboratory and the LOQs are well below the Referenceslegislative and symptomatology thresholds [12].
The proposed method, however, does not allow [1] E. Bernt, I. Gutmann, in: H.U. Bergmeyer (Ed.), 2nd ed,Methods of Enzymatic Analysis, Vol. 3, Academic Press,the determination of other alcohols, and this may beNew York, 1974, p. 1499.a limitation in situations that are clinically similar to
[2] F. Tagliaro, G. Lubli, S. Ghielmi, D. Franchi, M. Marigo, J.ethanol intoxication. Chromatogr. 580 (1992) 161.
In conclusion, although the present procedure is [3] Z. Penton, Clin. Chem. 31 (1985) 439.not properly based on different analytical methods, [4] G.C. Davis, L.H. Karey, P.T. Kissinger, J. Liq. Chromatogr.
2 (1979) 663.as it should be for a confirmatory method, it fulfils[5] F. Tagliaro, R. Dorizzi, S. Ghielmi, M. Marigo, J. Chroma-the need for a simple and reliable liquid chromato-
togr. 566 (1987) 333.graphic assay for ethyl alcohol in body fluids and can [6] H.M. Chen, C.M. Peterson, Alcohol 11 (1994) 577.be proposed as a valid alternative to the traditional [7] M. Petrarulo, S. Pellegrino, O. Bianco, M. Marangella, F.GC techniques used in clinical toxicology. Linari, E. Mentasti, J. Chromatogr. 432 (1988) 37.
[8] D.A. Armbruster, M.D. Tillman, L.M. Hubbs, Clin. Chem.40 (1994) 1233.
[9] S.B. Needleman, R.W. Romberg, J. Anal. Toxicol. 14 (1990)Acknowledgements 34.
[10] M. Petrarulo, P. Facchini, E. Cerelli, M. Marangella, F.We thank the following: Prof. Paolo Tappero of Linari, Clin. Chem. 41 (1995) 1518.
[11] M.A. Korsten, S. Shohei, L. Feinman, C.S. Lieber, N. Engl.`the Istituto di Scienze Medico-Forensi, Universita diJ. Med. 292 (1975) 386.Torino (Turin), for his assistance with the GC
[12] A.W. Jones, Clin. Chem. 39 (1993) 1837.analysis; Dr. Donatella Moscato of the LaboratorioBaldi e Riberi, Azienda Ospedaliera San GiovanniBattista (Turin), for her valuable technical assistance,and the ‘Fogolar della Famea Furlana di Turin’(Turin) for kind collaboration in the study.