Embed Size (px)
Citation preview
©2012 Waters Corporation 1
Convergence Chromatography: Solving Complex Chromatographic Challenges
John Van Antwerp
©2013 Waters Corporation 2
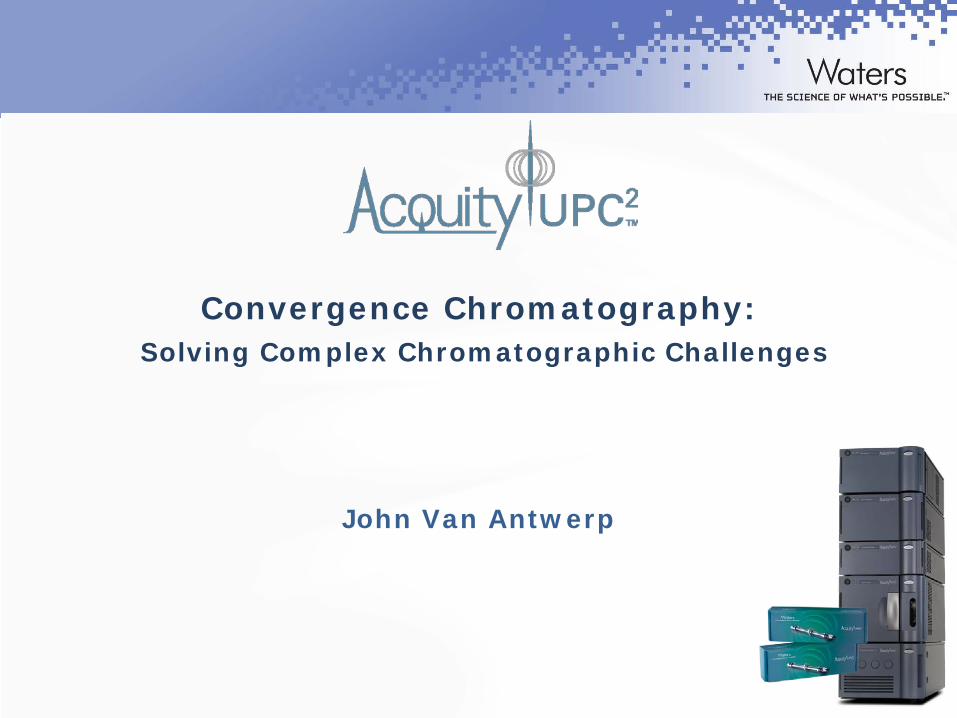
What is Convergence Chromatography: Why The Name?
Giddings, J.C. (1965) A critical evaluation of the theory of gas chromatography. In Gas Chromatography. 1964, edited by A. Goldup, p. 3-24. Elsevier, Amsterdam
In this article Dr. Giddings stated “One of the most interesting features of ultra high pressure gas chromatography would be convergence with classical liquid chromatography.”
Prof. Calvin Giddings (1930-1996)
©2012 Waters Corporation 3
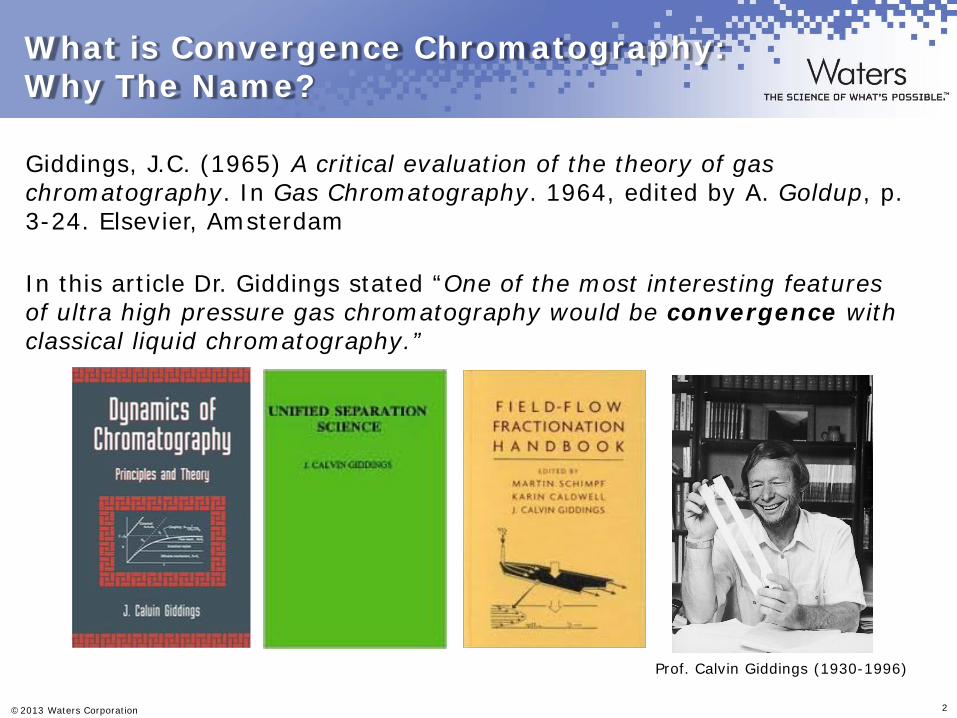
Evolution of Separation Technology
Gas Chromatography Liquid Chromatography Convergence Chromatography
GC
Capillary GC
HPLC
UPLC
SFC
UPC2
©2013 Waters Corporation 4
UPLC and UPC2
SPEED SENSITIVITY RESOLUTION
SIMPLICITY SIMILARITY
ORTHOGONALITY
©2012 Waters Corporation 5
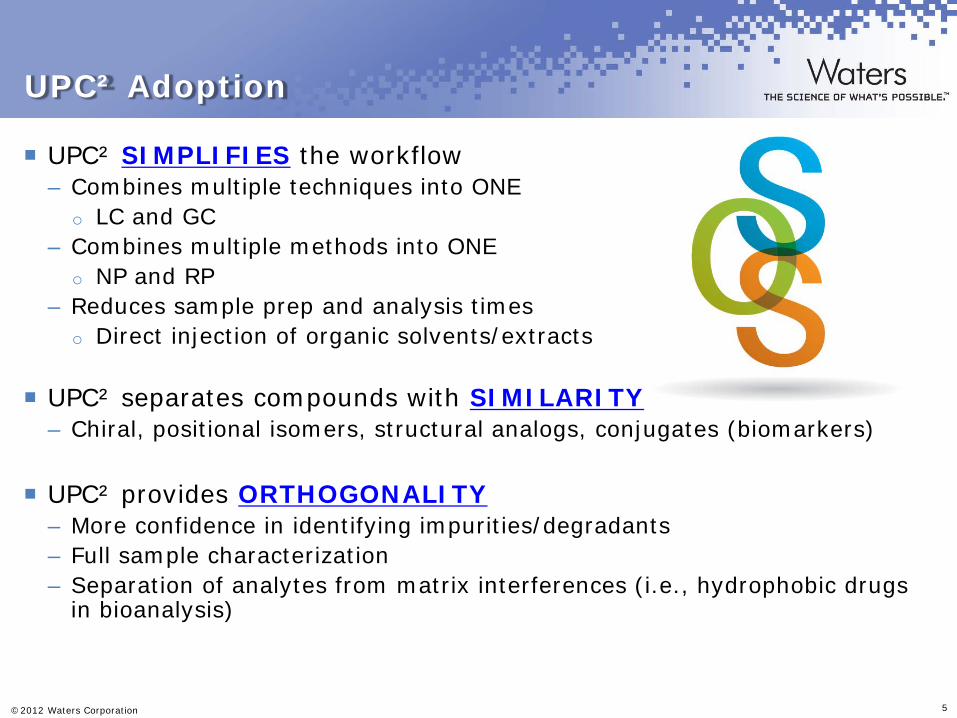
UPC² Adoption
UPC² SIMPLIFIES the workflow – Combines multiple techniques into ONE
o LC and GC – Combines multiple methods into ONE
o NP and RP – Reduces sample prep and analysis times
o Direct injection of organic solvents/extracts
UPC² separates compounds with SIMILARITY – Chiral, positional isomers, structural analogs, conjugates (biomarkers)
UPC² provides ORTHOGONALITY – More confidence in identifying impurities/degradants – Full sample characterization – Separation of analytes from matrix interferences (i.e., hydrophobic drugs
in bioanalysis)
©2012 Waters Corporation 6
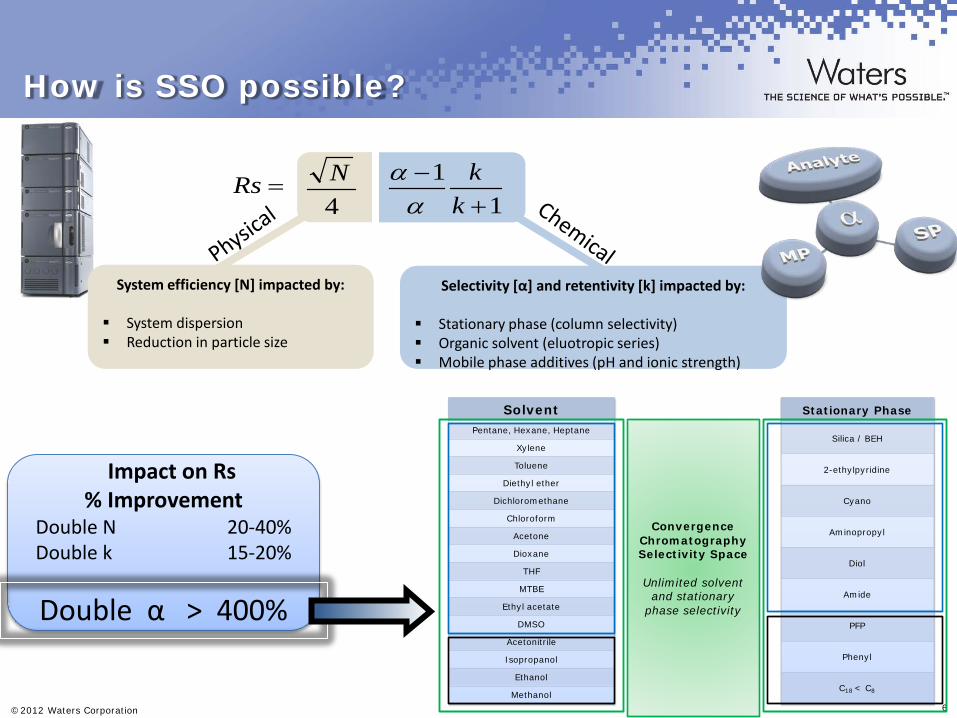
How is SSO possible?
11
+−
kk
αα
4N=Rs
Selectivity [α] and retentivity [k] impacted by:
Stationary phase (column selectivity) Organic solvent (eluotropic series) Mobile phase additives (pH and ionic strength)
System efficiency [N] impacted by:
System dispersion Reduction in particle size
Impact on Rs % Improvement
Double N 20-40% Double k 15-20%
Double α > 400%
ConvergenceChromatography Selectivity Space
Unlimited solvent and stationary
phase selectivity
SolventPentane, Hexane, Heptane
Xylene
Toluene
Diethyl ether
Dichloromethane
Chloroform
Acetone
Dioxane
THF
MTBE
Ethyl acetate
DMSO
Acetonitrile
Isopropanol
Ethanol
Methanol
Stationary Phase
Silica / BEH
2-ethylpyridine
Cyano
Aminopropyl
Diol
Amide
PFP
Phenyl
C18 < C8

©2012 Waters Corporation 7
UPC2 Adoption
SIMPLICITY SIMILARITY
ORTHOGONALITY
SIMPLICITY
©2012 Waters Corporation 8
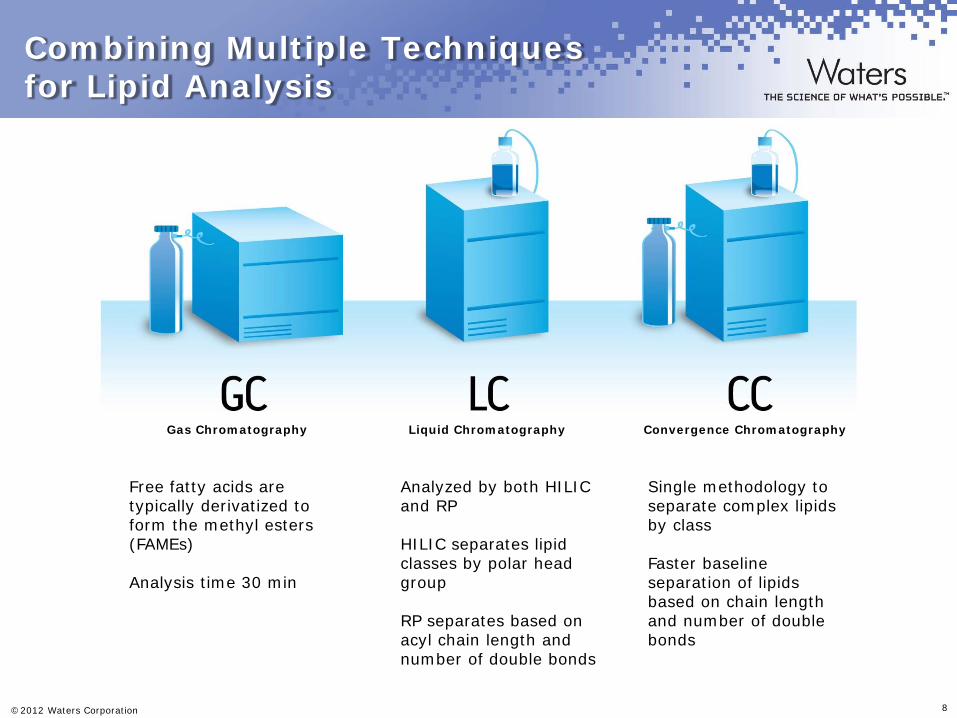
Combining Multiple Techniques for Lipid Analysis
Gas Chromatography Liquid Chromatography Convergence Chromatography
Free fatty acids are typically derivatized to form the methyl esters (FAMEs) Analysis time 30 min
Analyzed by both HILIC and RP HILIC separates lipid classes by polar head group RP separates based on acyl chain length and number of double bonds
Single methodology to separate complex lipids by class Faster baseline separation of lipids based on chain length and number of double bonds
©2012 Waters Corporation 9
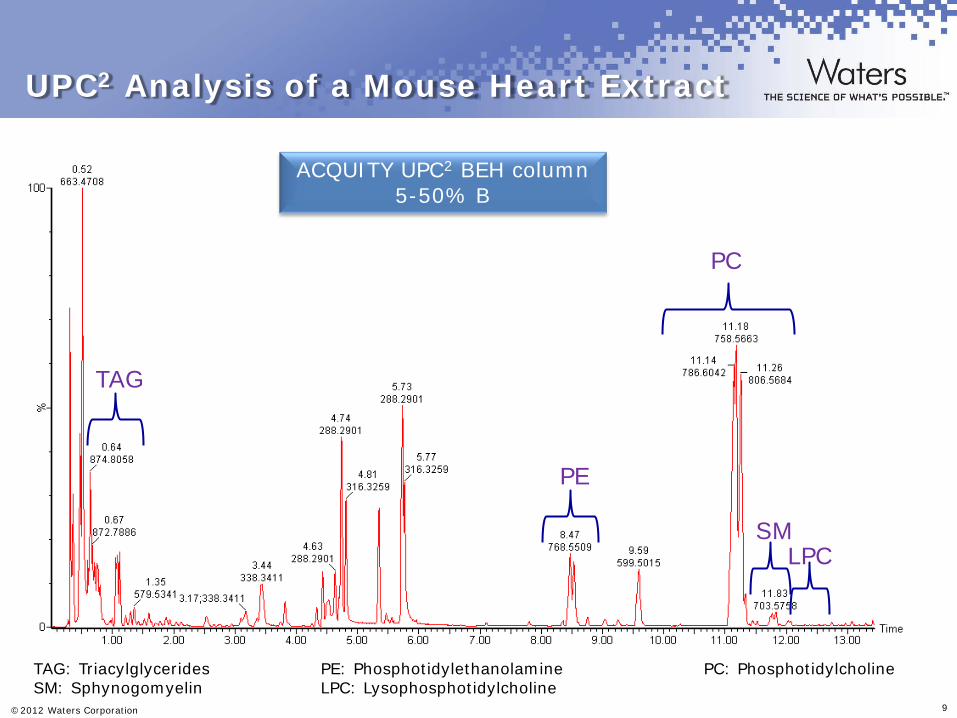
UPC2 Analysis of a Mouse Heart Extract
PC
SM LPC
PE
TAG
TAG: Triacylglycerides PE: Phosphotidylethanolamine PC: Phosphotidylcholine SM: Sphynogomyelin LPC: Lysophosphotidylcholine
ACQUITY UPC2 BEH column 5-50% B
©2012 Waters Corporation 10
Time0.60 0.70 0.80 0.90 1.00 1.10 1.20 1.30 1.40 1.50 1.60 1.70 1.80 1.90 2.00 2.10 2.20 2.30 2.40 2.50 2.60 2.70 2.80 2.90 3.00 3.10
%
0
100
0.60 0.70 0.80 0.90 1.00 1.10 1.20 1.30 1.40 1.50 1.60 1.70 1.80 1.90 2.00 2.10 2.20 2.30 2.40 2.50 2.60 2.70 2.80 2.90 3.00 3.10
%
0
100
8:0
14:0
16:0
18:0
20:0
22:0
24:0
10:0
12:0
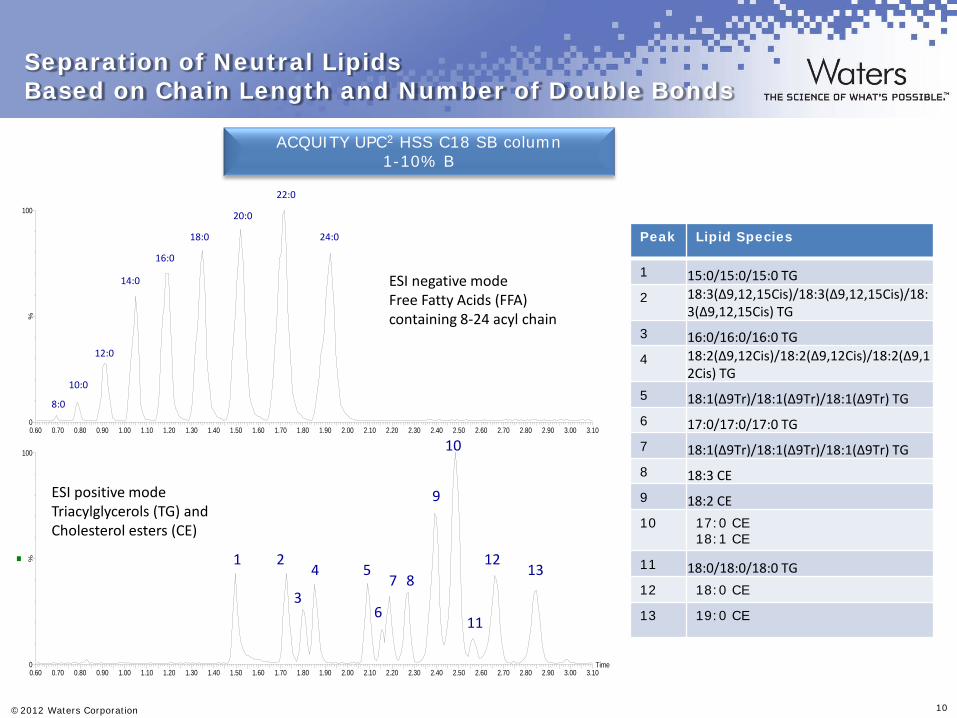
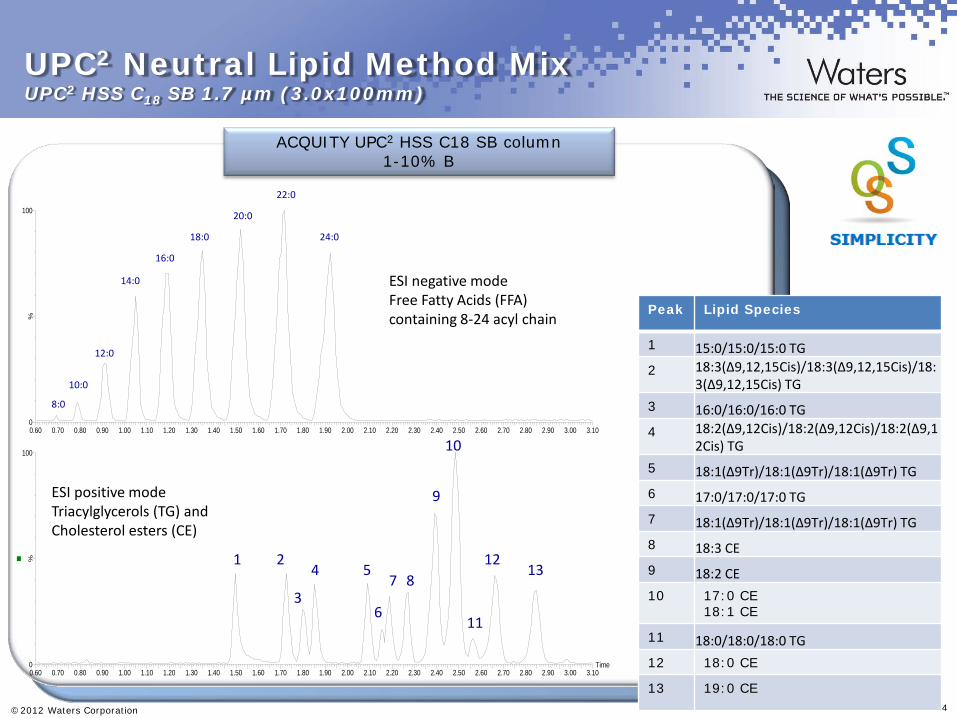
ESI negative mode Free Fatty Acids (FFA) containing 8-24 acyl chain
ESI positive mode Triacylglycerols (TG) and Cholesterol esters (CE)
1 7
2 8
3
4 5
6 11
10
13 12
9
Peak Lipid Species
1 15:0/15:0/15:0 TG 2 18:3(∆9,12,15Cis)/18:3(∆9,12,15Cis)/18:
3(∆9,12,15Cis) TG 3 16:0/16:0/16:0 TG 4 18:2(∆9,12Cis)/18:2(∆9,12Cis)/18:2(∆9,1
2Cis) TG 5 18:1(∆9Tr)/18:1(∆9Tr)/18:1(∆9Tr) TG 6 17:0/17:0/17:0 TG 7 18:1(∆9Tr)/18:1(∆9Tr)/18:1(∆9Tr) TG 8 18:3 CE 9 18:2 CE 10 17:0 CE
18:1 CE
11 18:0/18:0/18:0 TG 12 18:0 CE
13 19:0 CE
Separation of Neutral Lipids Based on Chain Length and Number of Double Bonds
ACQUITY UPC2 HSS C18 SB column 1-10% B
©2012 Waters Corporation 11
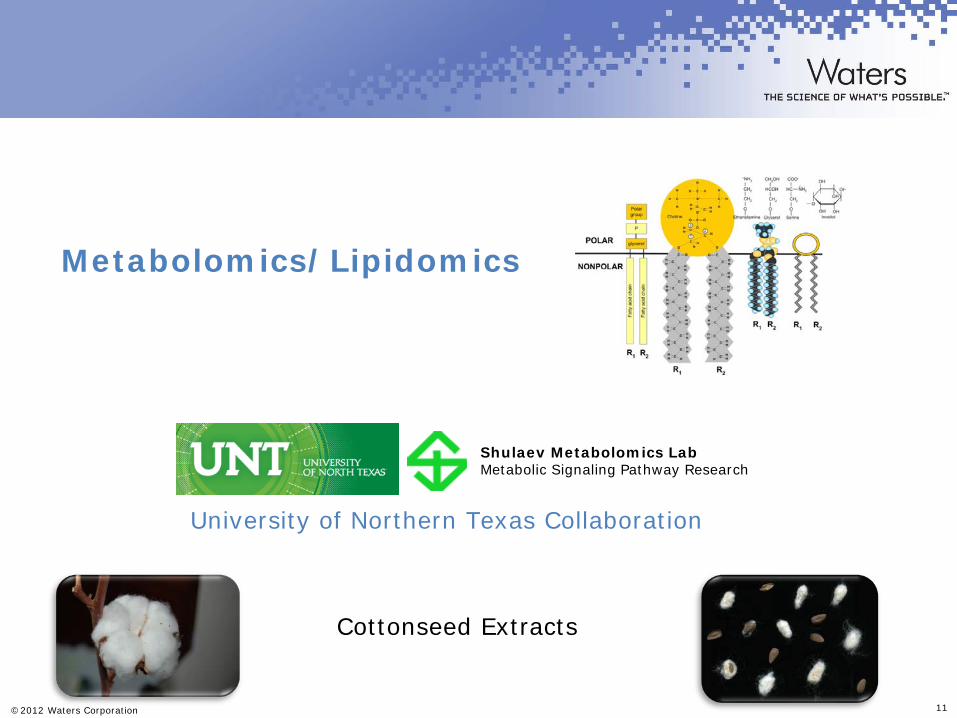
Metabolomics/Lipidomics
University of Northern Texas Collaboration
Shulaev Metabolomics Lab Metabolic Signaling Pathway Research
Cottonseed Extracts
©2012 Waters Corporation 12
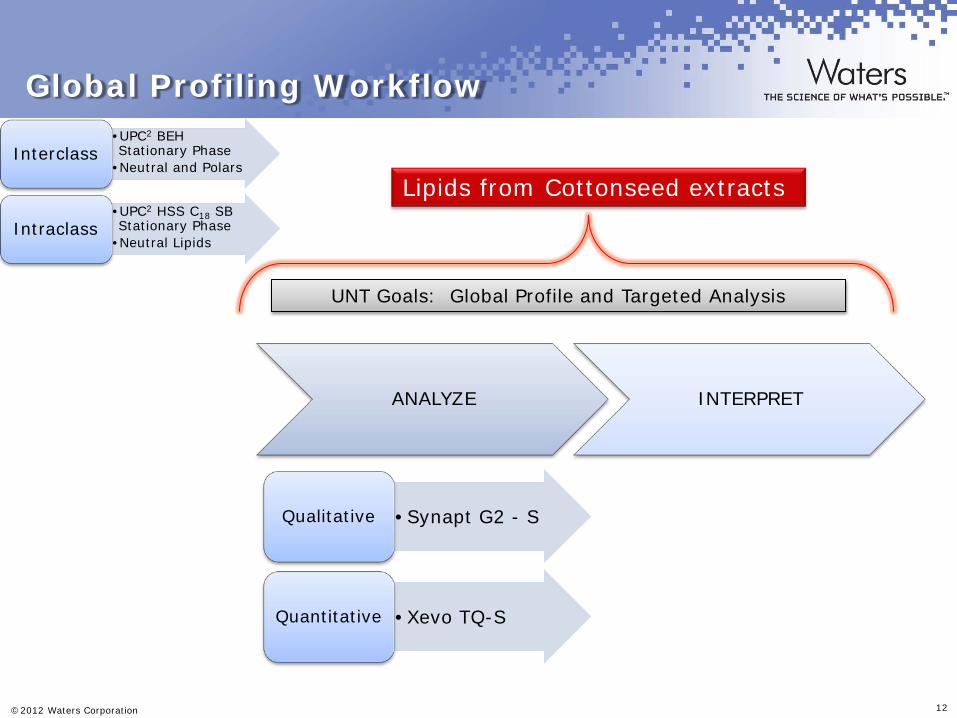
Global Profiling Workflow
ANALYZE INTERPRET
UNT Goals: Global Profile and Targeted Analysis
Lipids from Cottonseed extracts
•UPC2 BEH Stationary Phase
•Neutral and Polars Interclass
•UPC2 HSS C18 SB Stationary Phase
•Neutral Lipids Intraclass
•Synapt G2 - S Qualitative
•Xevo TQ-S Quantitative
©2012 Waters Corporation 13
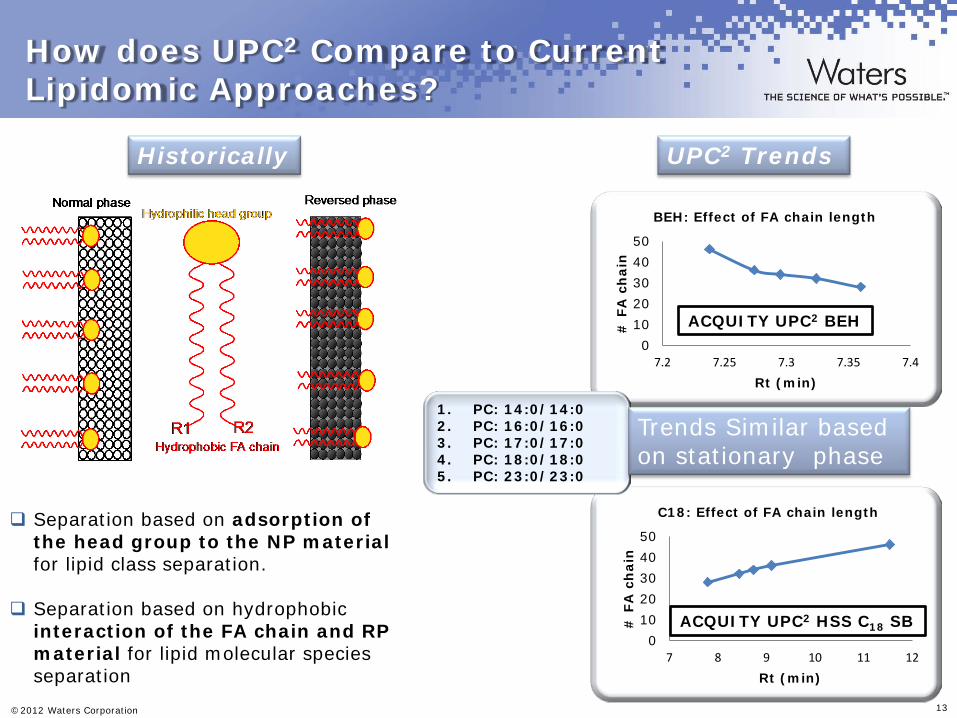
How does UPC2 Compare to Current Lipidomic Approaches?
Separation based on adsorption of the head group to the NP material for lipid class separation.
Separation based on hydrophobic interaction of the FA chain and RP material for lipid molecular species separation
Historically UPC2 Trends
01020304050
7.2 7.25 7.3 7.35 7.4
# F
A c
hai
n
Rt (min)
BEH: Effect of FA chain length
01020304050
7 8 9 10 11 12
# F
A c
hai
n
Rt (min)
C18: Effect of FA chain length
1. PC: 14:0/14:0 2. PC: 16:0/16:0 3. PC: 17:0/17:0 4. PC: 18:0/18:0 5. PC: 23:0/23:0
ACQUITY UPC2 BEH
ACQUITY UPC2 HSS C18 SB
Trends Similar based on stationary phase
©2012 Waters Corporation 14
Time0.60 0.70 0.80 0.90 1.00 1.10 1.20 1.30 1.40 1.50 1.60 1.70 1.80 1.90 2.00 2.10 2.20 2.30 2.40 2.50 2.60 2.70 2.80 2.90 3.00 3.10
%
0
100
0.60 0.70 0.80 0.90 1.00 1.10 1.20 1.30 1.40 1.50 1.60 1.70 1.80 1.90 2.00 2.10 2.20 2.30 2.40 2.50 2.60 2.70 2.80 2.90 3.00 3.10
%
0
100
8:0
14:0
16:0
18:0
20:0
22:0
24:0
10:0
12:0
ESI negative mode Free Fatty Acids (FFA) containing 8-24 acyl chain
ESI positive mode Triacylglycerols (TG) and Cholesterol esters (CE)
1 7
2 8
3
4 5
6 11
10
13 12
9
Peak Lipid Species
1 15:0/15:0/15:0 TG 2 18:3(∆9,12,15Cis)/18:3(∆9,12,15Cis)/18:
3(∆9,12,15Cis) TG 3 16:0/16:0/16:0 TG 4 18:2(∆9,12Cis)/18:2(∆9,12Cis)/18:2(∆9,1
2Cis) TG 5 18:1(∆9Tr)/18:1(∆9Tr)/18:1(∆9Tr) TG 6 17:0/17:0/17:0 TG 7 18:1(∆9Tr)/18:1(∆9Tr)/18:1(∆9Tr) TG 8 18:3 CE 9 18:2 CE 10 17:0 CE
18:1 CE
11 18:0/18:0/18:0 TG 12 18:0 CE
13 19:0 CE
UPC2 Neutral Lipid Method Mix UPC2 HSS C18 SB 1.7 µm (3.0x100mm)
ACQUITY UPC2 HSS C18 SB column 1-10% B
©2012 Waters Corporation 15
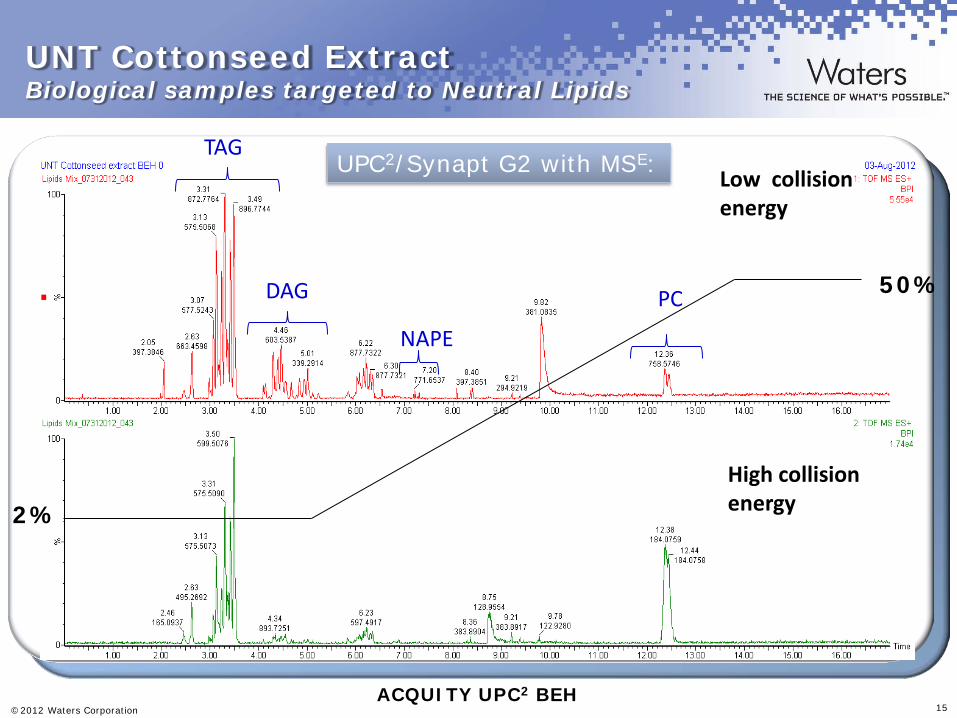
UNT Cottonseed Extract Biological samples targeted to Neutral Lipids
ACQUITY UPC2 BEH
Low collision energy
High collision energy
PC
TAG
DAG
NAPE
50%
2%
UPC2/Synapt G2 with MSE:
©2012 Waters Corporation 16
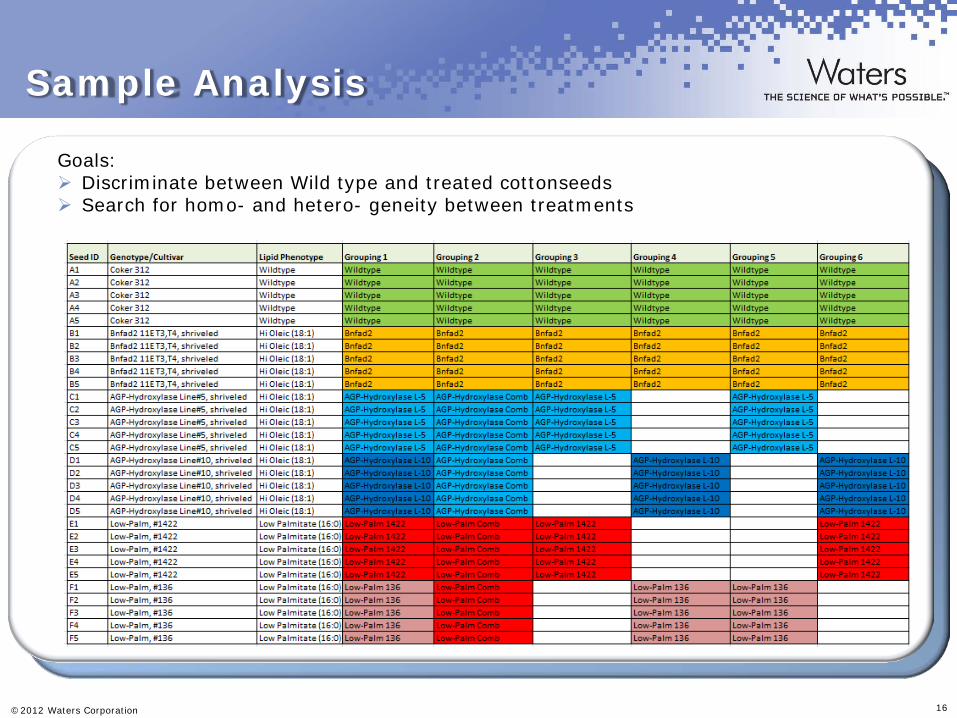
Sample Analysis
Goals: Discriminate between Wild type and treated cottonseeds Search for homo- and hetero- geneity between treatments
©2013 Waters Corporation 17
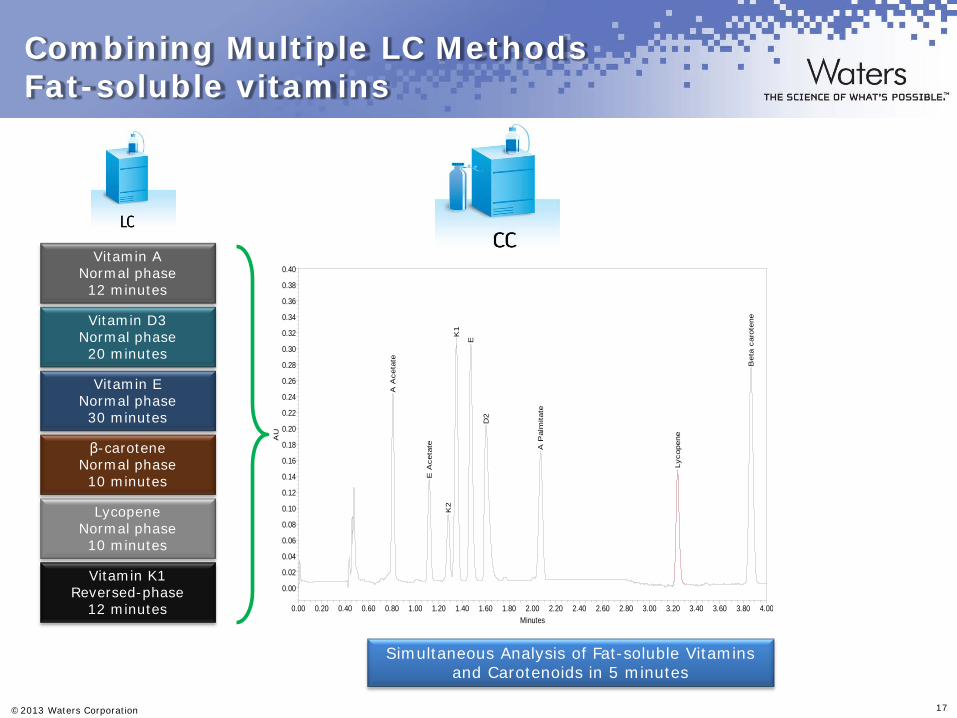
Combining Multiple LC Methods Fat-soluble vitamins
Vitamin A Normal phase 12 minutes
Vitamin D3 Normal phase 20 minutes
Vitamin E Normal phase 30 minutes
Vitamin K1 Reversed-phase
12 minutes
β-carotene Normal phase 10 minutes
Lycopene Normal phase 10 minutes
Simultaneous Analysis of Fat-soluble Vitamins and Carotenoids in 5 minutes
A A
ceta
te
E A
ceta
te
K2
K1
E
D2
A P
alm
itate
Lyco
pene
Bet
a ca
rote
ne
AU
0.00
0.02
0.04
0.06
0.08
0.10
0.12
0.14
0.16
0.18
0.20
0.22
0.24
0.26
0.28
0.30
0.32
0.34
0.36
0.38
0.40
Minutes0.00 0.20 0.40 0.60 0.80 1.00 1.20 1.40 1.60 1.80 2.00 2.20 2.40 2.60 2.80 3.00 3.20 3.40 3.60 3.80 4.00
©2013 Waters Corporation 18
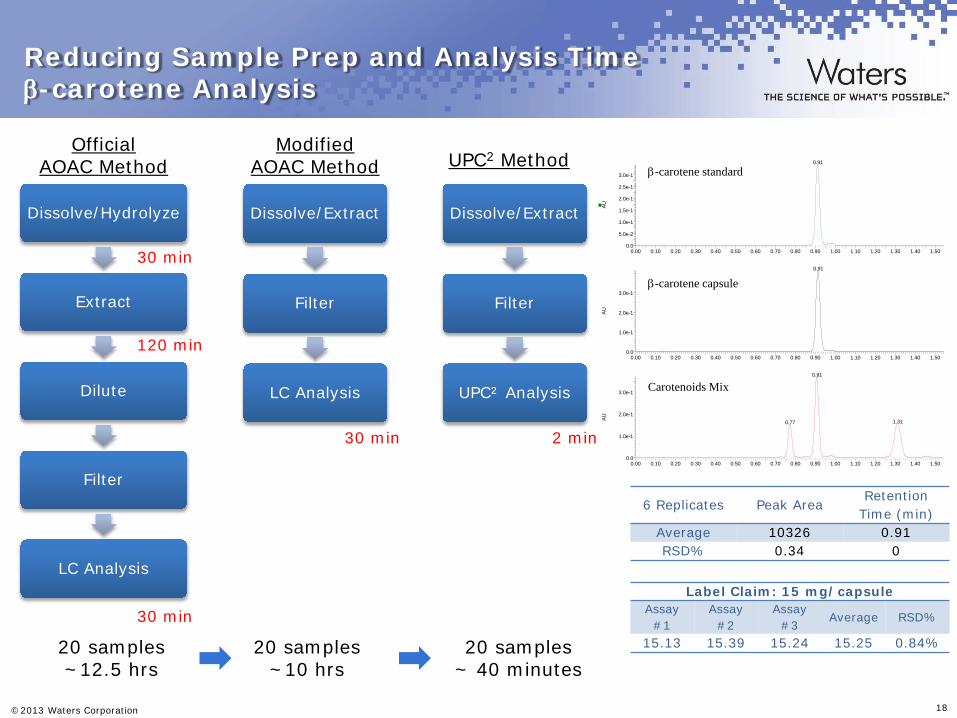
Official AOAC Method
Reducing Sample Prep and Analysis Time β-carotene Analysis
Dissolve/Hydrolyze
Extract
Dilute
Filter
LC Analysis
Modified AOAC Method
30 min
120 min
30 min
20 samples ~12.5 hrs
Dissolve/Extract
Filter
LC Analysis
30 min
20 samples ~10 hrs
UPC2 Method
Dissolve/Extract
Filter
UPC² Analysis
2 min
20 samples ~ 40 minutes
0.00 0.10 0.20 0.30 0.40 0.50 0.60 0.70 0.80 0.90 1.00 1.10 1.20 1.30 1.40 1.50
AU
0.0
1.0e-1
2.0e-1
3.0e-1
0.00 0.10 0.20 0.30 0.40 0.50 0.60 0.70 0.80 0.90 1.00 1.10 1.20 1.30 1.40 1.50
AU
0.0
1.0e-1
2.0e-1
3.0e-1
0.00 0.10 0.20 0.30 0.40 0.50 0.60 0.70 0.80 0.90 1.00 1.10 1.20 1.30 1.40 1.50
AU
0.0
5.0e-2
1.0e-1
1.5e-1
2.0e-1
2.5e-1
3.0e-1
0.91
0.91
0.91
0.77 1.31
β-carotene standard
β-carotene capsule
Carotenoids Mix
6 Replicates Peak Area Retention
Time (min) Average 10326 0.91 RSD% 0.34 0
Label Claim: 15 mg/capsule Assay
#1 Assay
#2 Assay
#3 Average RSD%
15.13 15.39 15.24 15.25 0.84%
©2013 Waters Corporation 19
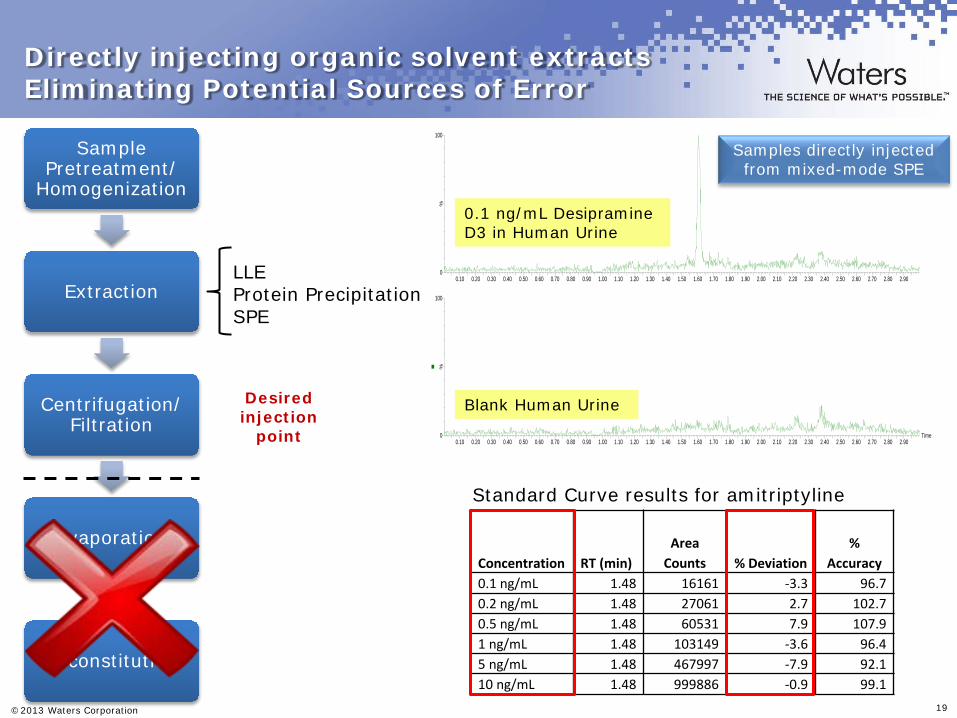
Directly injecting organic solvent extracts Eliminating Potential Sources of Error
Sample Pretreatment/
Homogenization
Extraction
Centrifugation/ Filtration
Evaporation
Reconstitution
Desired injection
point
LLE Protein Precipitation SPE
Time0.10 0.20 0.30 0.40 0.50 0.60 0.70 0.80 0.90 1.00 1.10 1.20 1.30 1.40 1.50 1.60 1.70 1.80 1.90 2.00 2.10 2.20 2.30 2.40 2.50 2.60 2.70 2.80 2.90
%0
100
0.10 0.20 0.30 0.40 0.50 0.60 0.70 0.80 0.90 1.00 1.10 1.20 1.30 1.40 1.50 1.60 1.70 1.80 1.90 2.00 2.10 2.20 2.30 2.40 2.50 2.60 2.70 2.80 2.90
%
0
100
Blank Human Urine
0.1 ng/mL Desipramine D3 in Human Urine
Samples directly injected from mixed-mode SPE
Concentration RT (min) Area
Counts % Deviation %
Accuracy 0.1 ng/mL 1.48 16161 -3.3 96.7 0.2 ng/mL 1.48 27061 2.7 102.7 0.5 ng/mL 1.48 60531 7.9 107.9 1 ng/mL 1.48 103149 -3.6 96.4 5 ng/mL 1.48 467997 -7.9 92.1 10 ng/mL 1.48 999886 -0.9 99.1
Standard Curve results for amitriptyline
©2013 Waters Corporation 20
Analysis of Non-Ionic Surfactants
©2013 Waters Corporation 21
Background
•Non-ionic surfactants are used in cosmetics, industrial materials, and
many other products.
•Their composition has to be monitored because the differences in
ethoxy chain length affect the viscosity, solubility, polarity, and other
characteristics of the mixture
©2013 Waters Corporation 22
Current separation methods for non-ionic surfactants
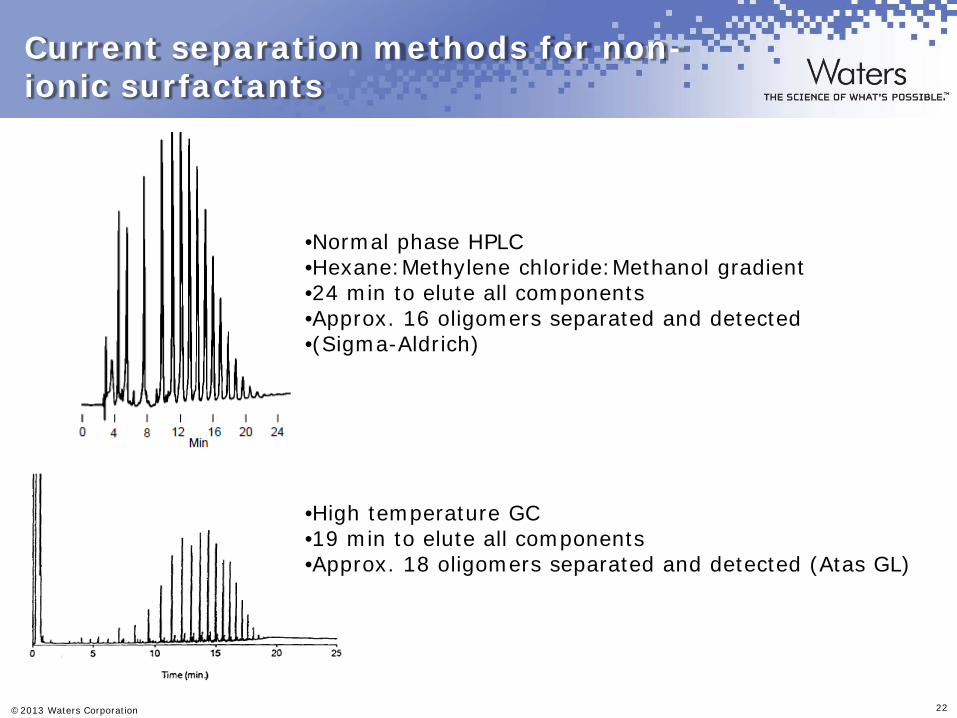
•Normal phase HPLC •Hexane:Methylene chloride:Methanol gradient •24 min to elute all components •Approx. 16 oligomers separated and detected •(Sigma-Aldrich)
•High temperature GC •19 min to elute all components •Approx. 18 oligomers separated and detected (Atas GL)
©2013 Waters Corporation 23
Purpose/Competitive Technology
•Typically analyzed by HPLC, SFC, GC •Analysis by GC and HPLC very time-consuming
•SFC uses high column temperatures which can limit analysis of thermally labile compounds
•HPLC might require derivatization for non-UV absorbing surfactants
•Incomplete baseline separation for oligomers in some cases
©2013 Waters Corporation 24
Sample Set Id: 1462 SampleName: Triton X-100 Date Acquired: 6/21/2012 8:54:56 AM EDT Injection Id: 1522
Peak1 -
0.2
71
Peak2 -
0.4
55
Peak3 -
0.5
74
Peak4 -
0.6
62
Peak5 -
0.7
33
Peak6 -
0.7
92
Peak7 -
0.8
41
Peak8 -
0.8
84
Peak9 -
0.9
21
Peak10 -
0.9
54
Peak11 -
0.9
85
Peak12 -
1.0
13
Peak13 -
1.0
41
Peak14 -
1.0
67
Peak15 -
1.0
93
Peak16 -
1.1
19
Peak17 -
1.1
58
Peak18 -
1.1
88
Peak19 -
1.2
17
Peak20 -
1.2
48
AU
0.00
0.10
0.20
0.30
0.40
0.50
0.60
0.70
0.80
0.90
1.00
1.10
1.20
1.30
Minutes0.10 0.15 0.20 0.25 0.30 0.35 0.40 0.45 0.50 0.55 0.60 0.65 0.70 0.75 0.80 0.85 0.90 0.95 1.00 1.05 1.10 1.15 1.20 1.25 1.30 1.35 1.40 1.45 1.50
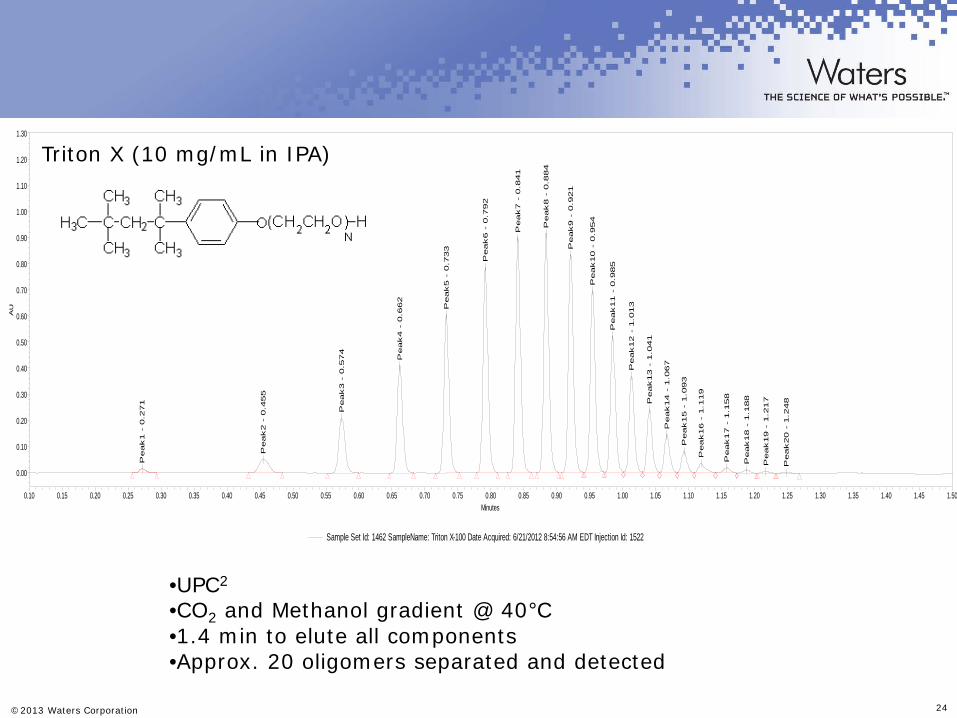
Triton X (10 mg/mL in IPA)
•UPC2
•CO2 and Methanol gradient @ 40°C •1.4 min to elute all components •Approx. 20 oligomers separated and detected
©2013 Waters Corporation 25
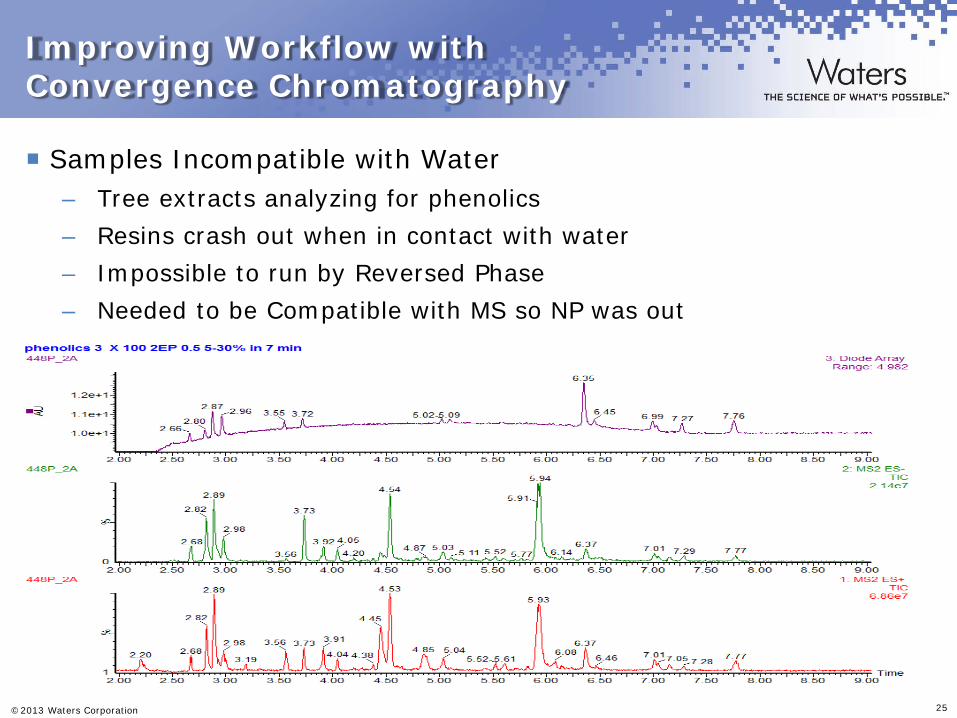
Improving Workflow with Convergence Chromatography
Samples Incompatible with Water – Tree extracts analyzing for phenolics – Resins crash out when in contact with water – Impossible to run by Reversed Phase – Needed to be Compatible with MS so NP was out
©2013 Waters Corporation 26
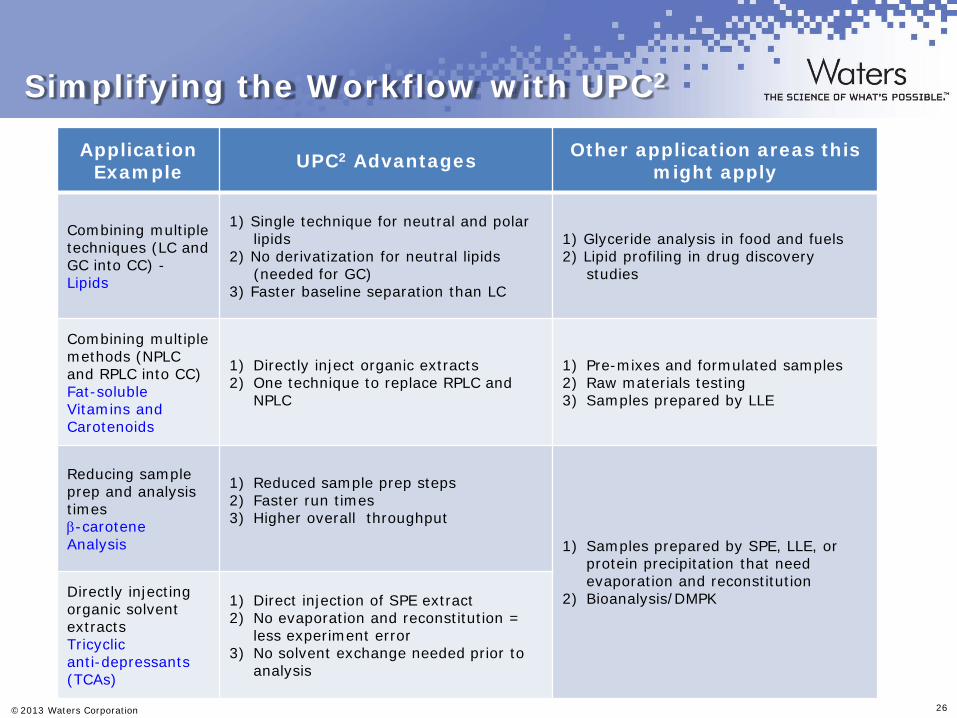
Simplifying the Workflow with UPC2
Application Example UPC2 Advantages Other application areas this
might apply
Combining multiple techniques (LC and GC into CC) - Lipids
1) Single technique for neutral and polar lipids
2) No derivatization for neutral lipids (needed for GC)
3) Faster baseline separation than LC
1) Glyceride analysis in food and fuels 2) Lipid profiling in drug discovery
studies
Combining multiple methods (NPLC and RPLC into CC) Fat-soluble Vitamins and Carotenoids
1) Directly inject organic extracts 2) One technique to replace RPLC and
NPLC
1) Pre-mixes and formulated samples 2) Raw materials testing 3) Samples prepared by LLE
Reducing sample prep and analysis times β-carotene Analysis
1) Reduced sample prep steps 2) Faster run times 3) Higher overall throughput
1) Samples prepared by SPE, LLE, or
protein precipitation that need evaporation and reconstitution
2) Bioanalysis/DMPK Directly injecting organic solvent extracts Tricyclic anti-depressants (TCAs)
1) Direct injection of SPE extract 2) No evaporation and reconstitution =
less experiment error 3) No solvent exchange needed prior to
analysis

©2013 Waters Corporation 27
UPC2 Adoption
SIMPLICITY SIMILARITY
ORTHOGONALITY
SIMILARITY
©2013 Waters Corporation 28
Structural Similarity
Isomers and structural analogs can be challenging to separate due to small differences in structure, or due to their chirality.
In this section we will look at applications that are of interest due to their structural similarity using UPC2, including: 1. Chiral Separations (Enantiomers & diastereomers) 2. Positional isomers (differ in location of functional groups) 3. Structural analogs Biomarkers (conjugated/unconjugated) Drugs (metabolites, impurities, degradants)
©2013 Waters Corporation 29
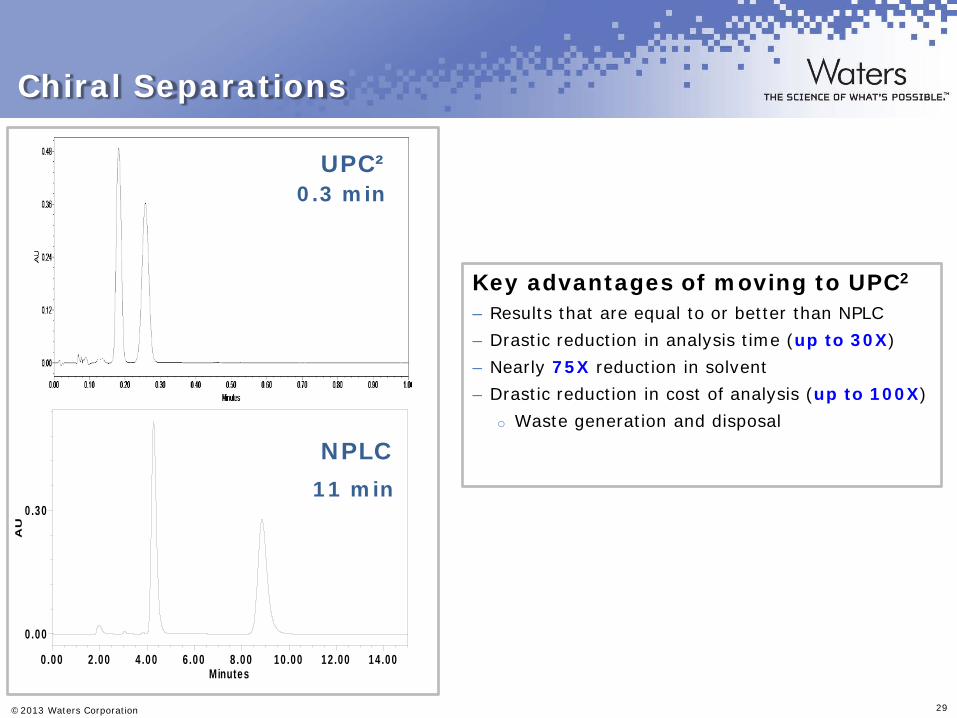
Chiral Separations
Key advantages of moving to UPC2
– Results that are equal to or better than NPLC – Drastic reduction in analysis time (up to 30X) – Nearly 75X reduction in solvent – Drastic reduction in cost of analysis (up to 100X)
o Waste generation and disposal
AU
0.00
0.30
Minutes0.00 2.00 4.00 6.00 8.00 10.00 12.00 14.00
UPC²
NPLC 11 min
0.3 min
©2012 Waters Corporation 30
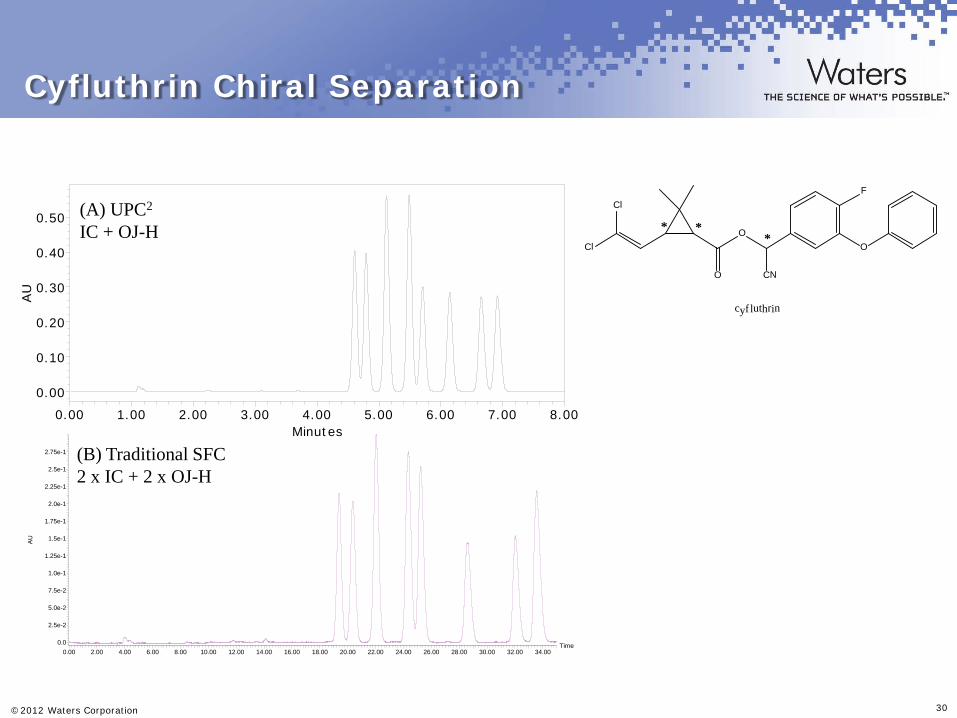
Cyfluthrin Chiral Separation
AU
0.00
0.10
0.20
0.30
0.40
0.50
Minutes0.00 1.00 2.00 3.00 4.00 5.00 6.00 7.00 8.00
Time0.00 2.00 4.00 6.00 8.00 10.00 12.00 14.00 16.00 18.00 20.00 22.00 24.00 26.00 28.00 30.00 32.00 34.00
AU
0.0
2.5e-2
5.0e-2
7.5e-2
1.0e-1
1.25e-1
1.5e-1
1.75e-1
2.0e-1
2.25e-1
2.5e-1
2.75e-1
(A) UPC2 IC + OJ-H
(B) Traditional SFC 2 x IC + 2 x OJ-H
cyfluthrin
Cl
Cl
O
O
CN
O
**
*
F
©2013 Waters Corporation 31
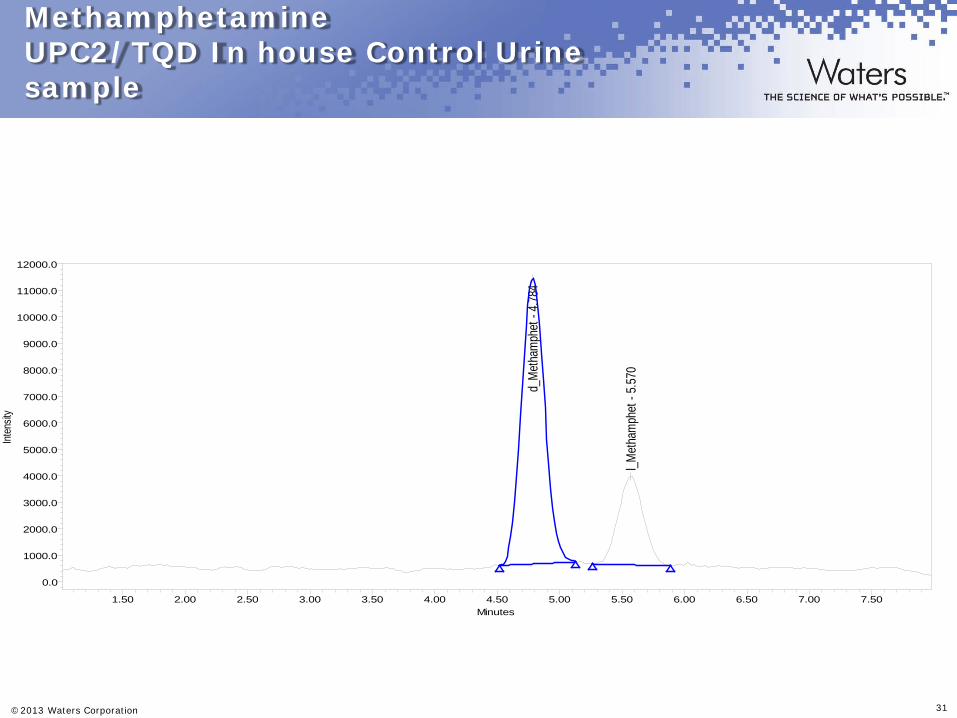
Methamphetamine UPC2/TQD In house Control Urine sample
d_M
etha
mph
et -
4.78
4
l_Met
ham
phet
- 5.
570
Inten
sity
0.0
1000.0
2000.0
3000.0
4000.0
5000.0
6000.0
7000.0
8000.0
9000.0
10000.0
11000.0
12000.0
Minutes1.50 2.00 2.50 3.00 3.50 4.00 4.50 5.00 5.50 6.00 6.50 7.00 7.50
©2013 Waters Corporation 32
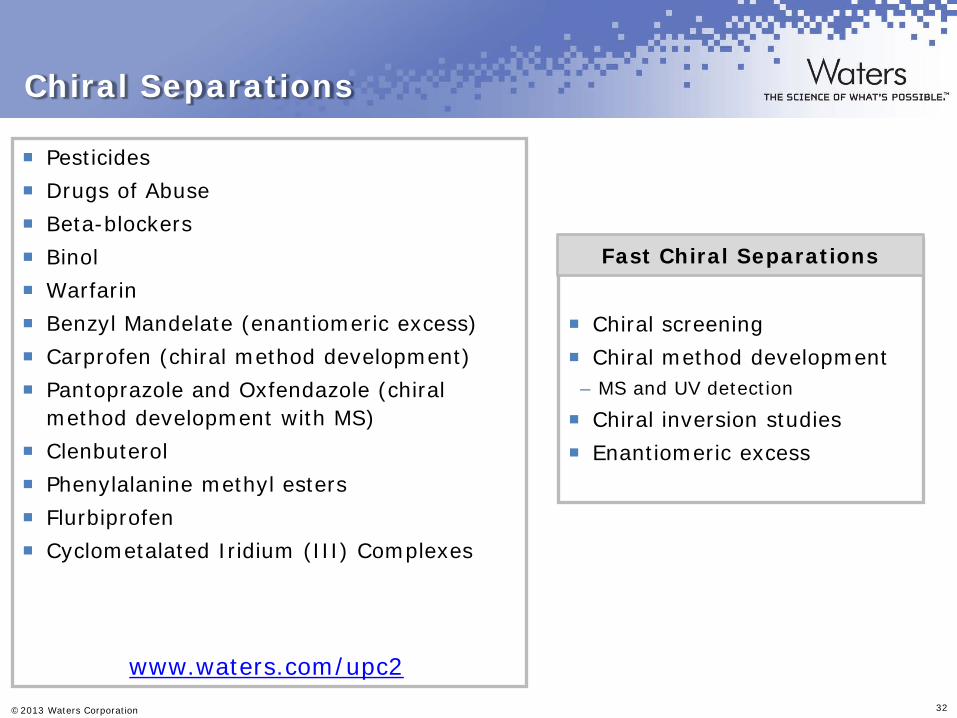
Chiral Separations
Chiral screening Chiral method development – MS and UV detection
Chiral inversion studies Enantiomeric excess
Pesticides Drugs of Abuse Beta-blockers Binol Warfarin Benzyl Mandelate (enantiomeric excess) Carprofen (chiral method development) Pantoprazole and Oxfendazole (chiral
method development with MS) Clenbuterol Phenylalanine methyl esters Flurbiprofen Cyclometalated Iridium (III) Complexes
Fast Chiral Separations
www.waters.com/upc2
©2013 Waters Corporation 33
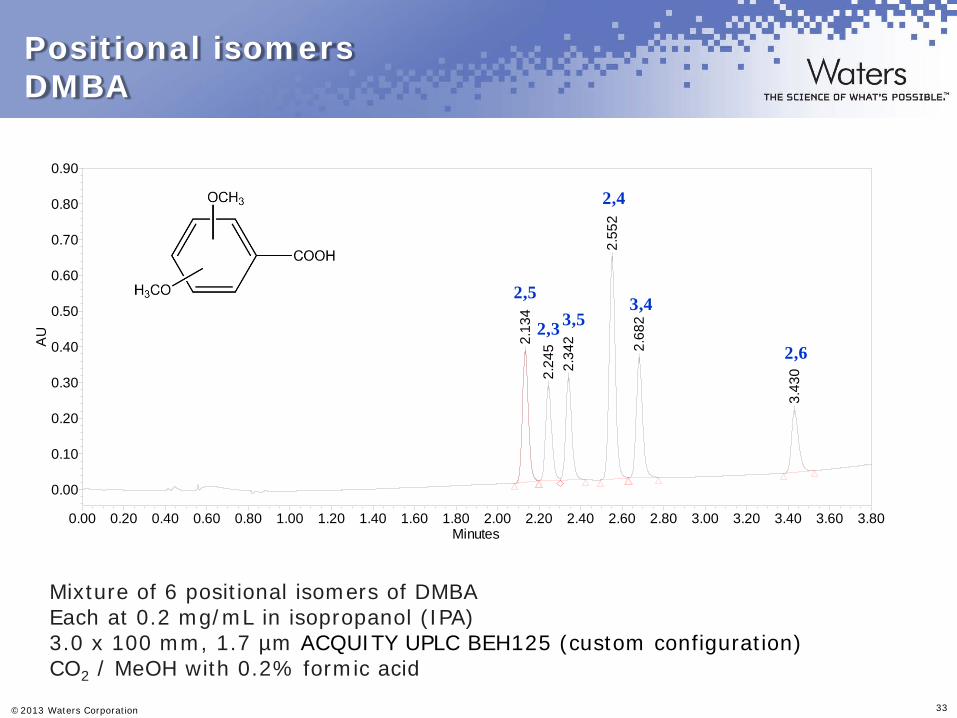
Positional isomers DMBA
2.13
42.
245
2.34
2
2.55
2
2.68
2
3.43
0
AU
0.00
0.10
0.20
0.30
0.40
0.50
0.60
0.70
0.80
0.90
Minutes0.00 0.20 0.40 0.60 0.80 1.00 1.20 1.40 1.60 1.80 2.00 2.20 2.40 2.60 2.80 3.00 3.20 3.40 3.60 3.80
2,5
2,3 3,5
2,4
3,4
2,6
Mixture of 6 positional isomers of DMBA Each at 0.2 mg/mL in isopropanol (IPA) 3.0 x 100 mm, 1.7 µm ACQUITY UPLC BEH125 (custom configuration) CO2 / MeOH with 0.2% formic acid
©2013 Waters Corporation 34
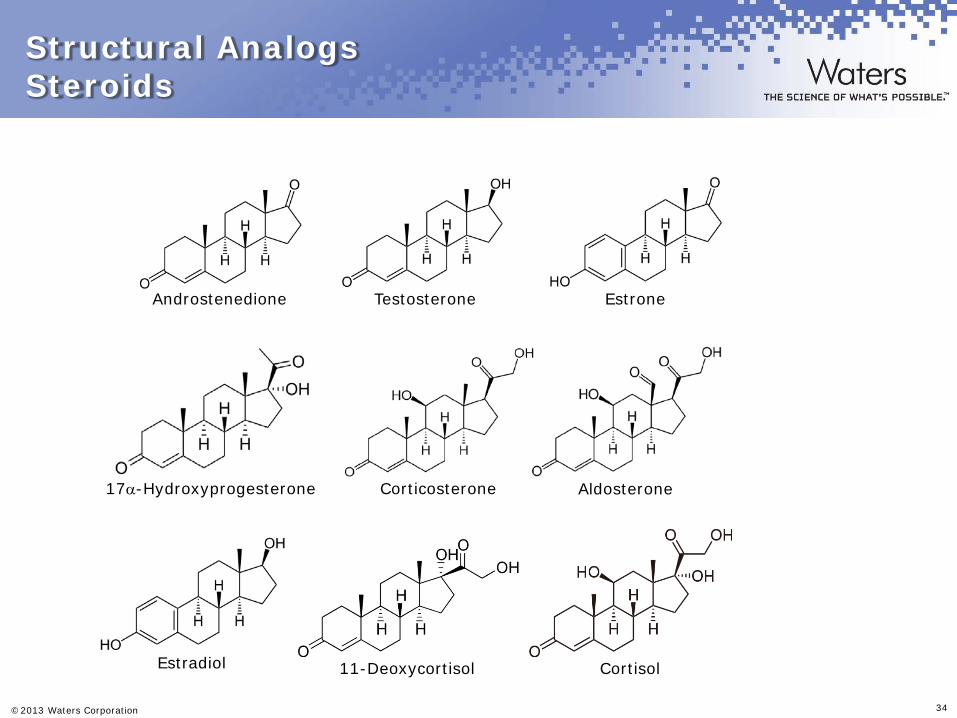
Structural Analogs Steroids
Androstenedione
17α-Hydroxyprogesterone
Testosterone Estrone
11-Deoxycortisol
Corticosterone Aldosterone
Cortisol Estradiol
©2013 Waters Corporation 35
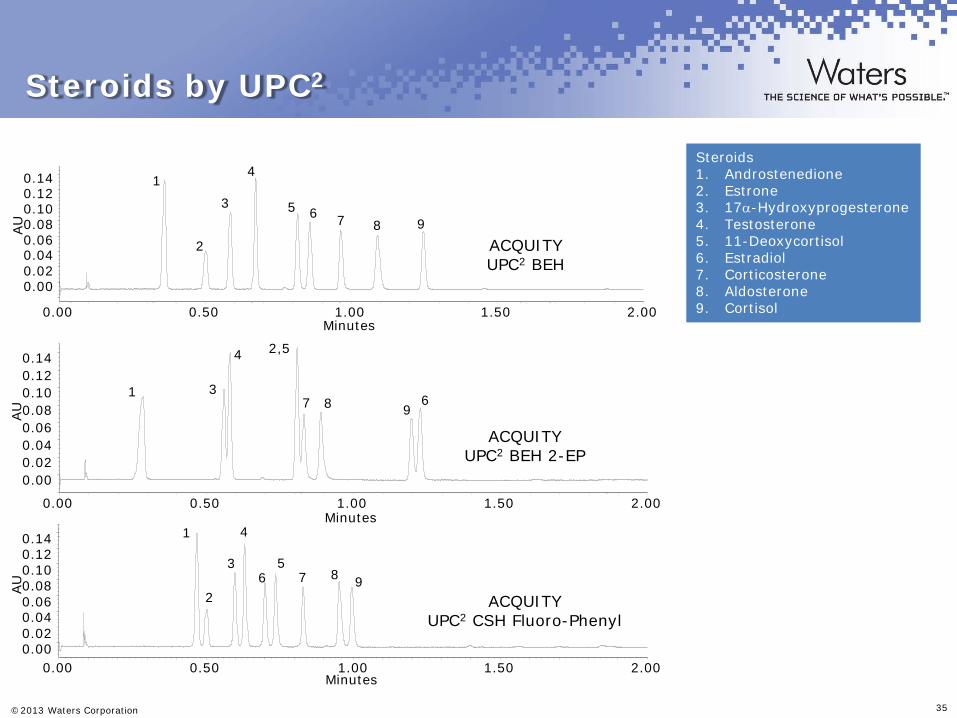
Steroids by UPC2
Steroids 1. Androstenedione 2. Estrone 3. 17α-Hydroxyprogesterone 4. Testosterone 5. 11-Deoxycortisol 6. Estradiol 7. Corticosterone 8. Aldosterone 9. Cortisol
1
2
3
4
5 6 7 8 9 AU
0.00 0.02 0.04 0.06 0.08 0.10 0.12 0.14
Minutes 0.00 0.50 1.00 1.50 2.00
ACQUITY UPC2 BEH
AU
0.00 0.02 0.04 0.06 0.08 0.10 0.12 0.14
Minutes 0.00 0.50 1.00 1.50 2.00
1
2,5
3
4
6 7 8 9
ACQUITY UPC2 BEH 2-EP
1
2
3
4
6 7 8 9 AU
0.00 0.02 0.04 0.06 0.08 0.10 0.12 0.14
Minutes 0.00 0.50 1.00 1.50 2.00
5
ACQUITY UPC2 CSH Fluoro-Phenyl
©2013 Waters Corporation 36
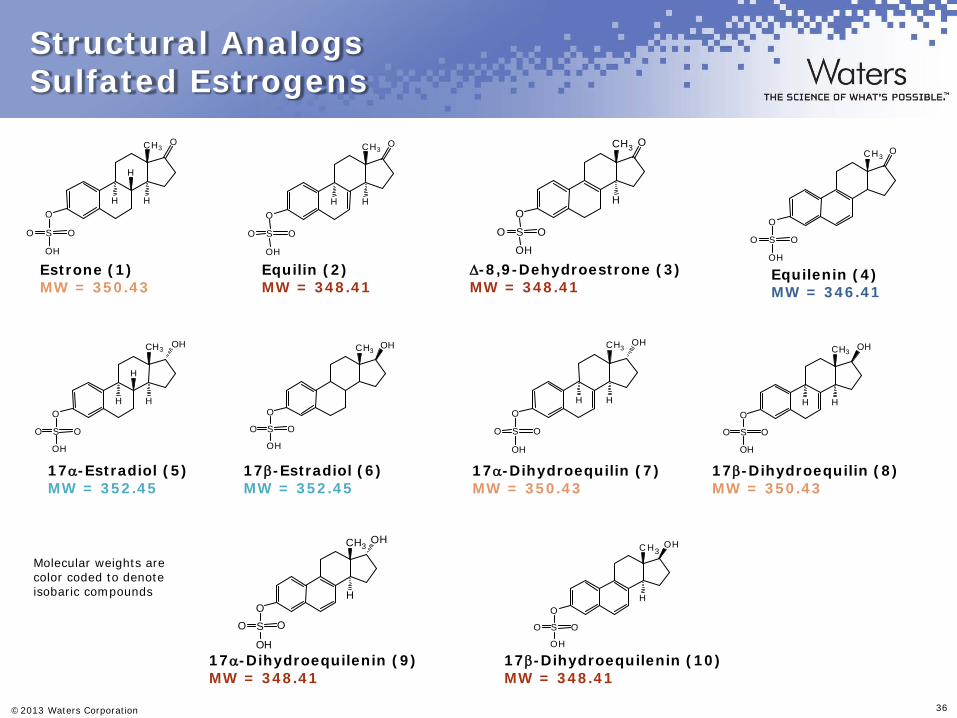
Structural Analogs Sulfated Estrogens
Estrone (1) MW = 350.43
O C H 3
O
S O O
O H
H H
H
Equilin (2) MW = 348.41
O H
O C H 3
O
S O O
H H
∆-8,9-Dehydroestrone (3) MW = 348.41
O C H 3
O
S O O
O H
H
Equilenin (4) MW = 346.41
O C H 3
O
S O O
O H
17α-Estradiol (5) MW = 352.45
O H C H 3
O
S O O
O H
H H
H
17β-Estradiol (6) MW = 352.45
O H C H 3
O
S O O
O H
17α-Dihydroequilin (7) MW = 350.43
O H C H 3
O
S O O
O H
H H
17β-Dihydroequilin (8) MW = 350.43
O H C H 3
O
S O O
O H
H H
17α-Dihydroequilenin (9) MW = 348.41
O H
O H C H 3
O
S O O
H
17β-Dihydroequilenin (10) MW = 348.41
O H C H 3
O
S O O
O H
H
Molecular weights are color coded to denote isobaric compounds
©2013 Waters Corporation 37
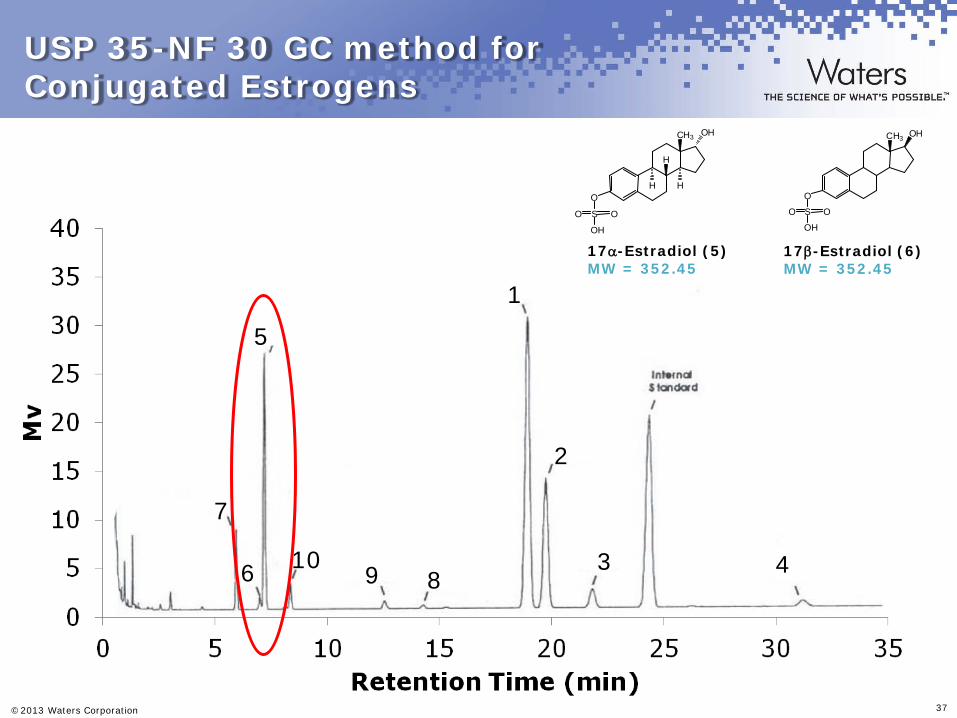
USP 35-NF 30 GC method for Conjugated Estrogens
7
6
5
10 9 8
1
2
3 4
17α-Estradiol (5) MW = 352.45
O H C H 3
O
S O O
O H
H H
H
17β-Estradiol (6) MW = 352.45
O H C H 3
O
S O O
O H
©2013 Waters Corporation 38
AU
0.00
0.02
0.04
0.06
0.08
0.10
0.12
0.14
0.16
0.18
0.20
0.22
0.24
Minutes 5.00 5.50 6.00 6.50 7.00 7.50 8.00 8.50 9.00 9.50 10.00 10.50 11.00 11.50 12.00 12.50 13.00
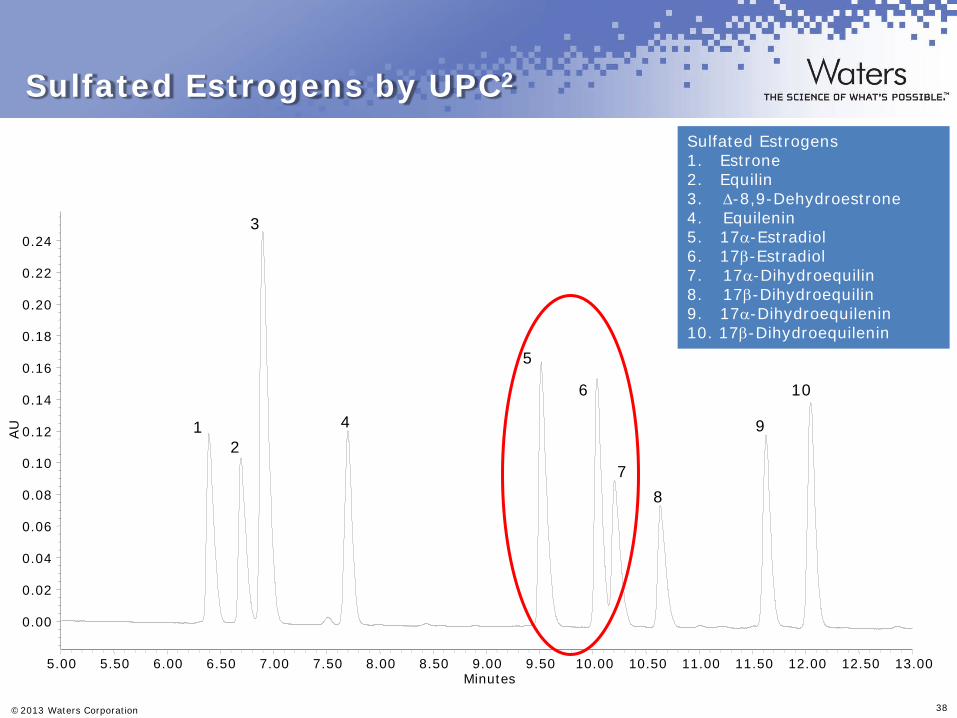
Sulfated Estrogens by UPC2
1 2
3
4
5
6
7 8
9
10
Sulfated Estrogens 1. Estrone 2. Equilin 3. ∆-8,9-Dehydroestrone 4. Equilenin 5. 17α-Estradiol 6. 17β-Estradiol 7. 17α-Dihydroequilin 8. 17β-Dihydroequilin 9. 17α-Dihydroequilenin 10. 17β-Dihydroequilenin
©2013 Waters Corporation 39
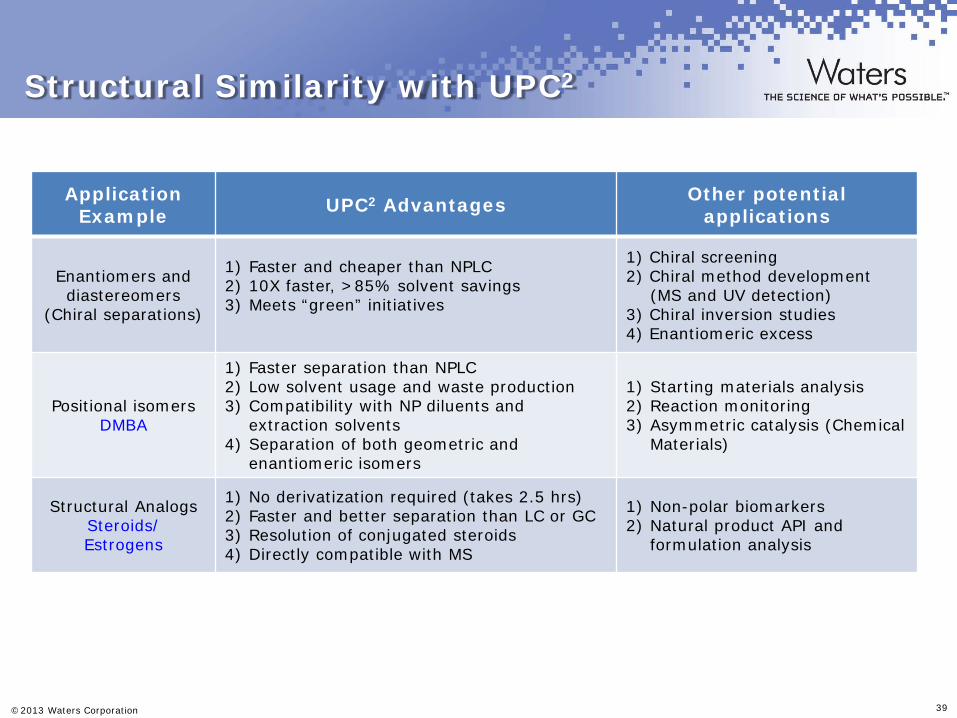
Structural Similarity with UPC2
Application Example UPC2 Advantages Other potential
applications
Enantiomers and diastereomers
(Chiral separations)
1) Faster and cheaper than NPLC 2) 10X faster, >85% solvent savings 3) Meets “green” initiatives
1) Chiral screening 2) Chiral method development
(MS and UV detection) 3) Chiral inversion studies 4) Enantiomeric excess
Positional isomers DMBA
1) Faster separation than NPLC 2) Low solvent usage and waste production 3) Compatibility with NP diluents and
extraction solvents 4) Separation of both geometric and
enantiomeric isomers
1) Starting materials analysis 2) Reaction monitoring 3) Asymmetric catalysis (Chemical
Materials)
Structural Analogs Steroids/ Estrogens
1) No derivatization required (takes 2.5 hrs) 2) Faster and better separation than LC or GC 3) Resolution of conjugated steroids 4) Directly compatible with MS
1) Non-polar biomarkers 2) Natural product API and
formulation analysis

©2013 Waters Corporation 40
UPC2 Adoption
SIMPLICITY SIMILARITY
ORTHOGONALITY
©2013 Waters Corporation 41
Orthogonal Separations
Why do I need an orthogonal separation mode?
1. A common concern in many applications is that an impurity, degradation peak, or similar compounds may be overlooked (isobaric, co-elution)
2. Orthogonal methods that provide different relative retention of peaks are needed to ensure full characterization
3. Ability to see more information about the sample
4. Separation of desired compounds from matrix interferences
©2013 Waters Corporation 42
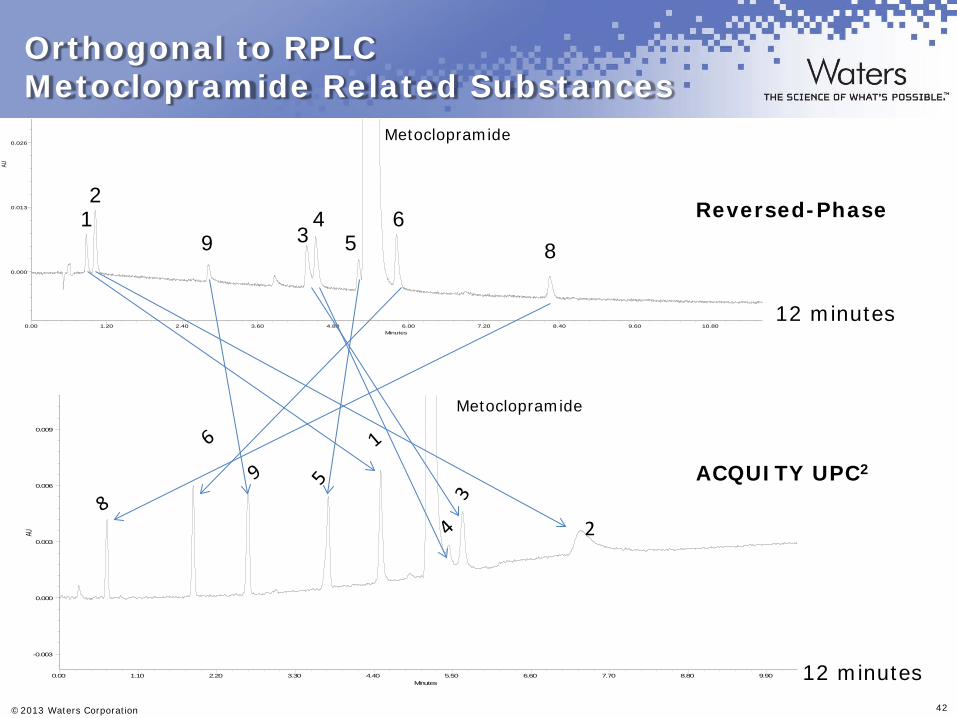
Orthogonal to RPLC Metoclopramide Related Substances
ACQUITY UPC2
Reversed-Phase
AU
0.000
0.013
0.026
Minutes0.00 1.20 2.40 3.60 4.80 6.00 7.20 8.40 9.60 10.80
1 2
3 4
5 6
8 9
AU
-0.003
0.000
0.003
0.006
0.009
Minutes0.00 1.10 2.20 3.30 4.40 5.50 6.60 7.70 8.80 9.90
2
Metoclopramide
Metoclopramide
12 minutes
12 minutes
©2013 Waters Corporation 43
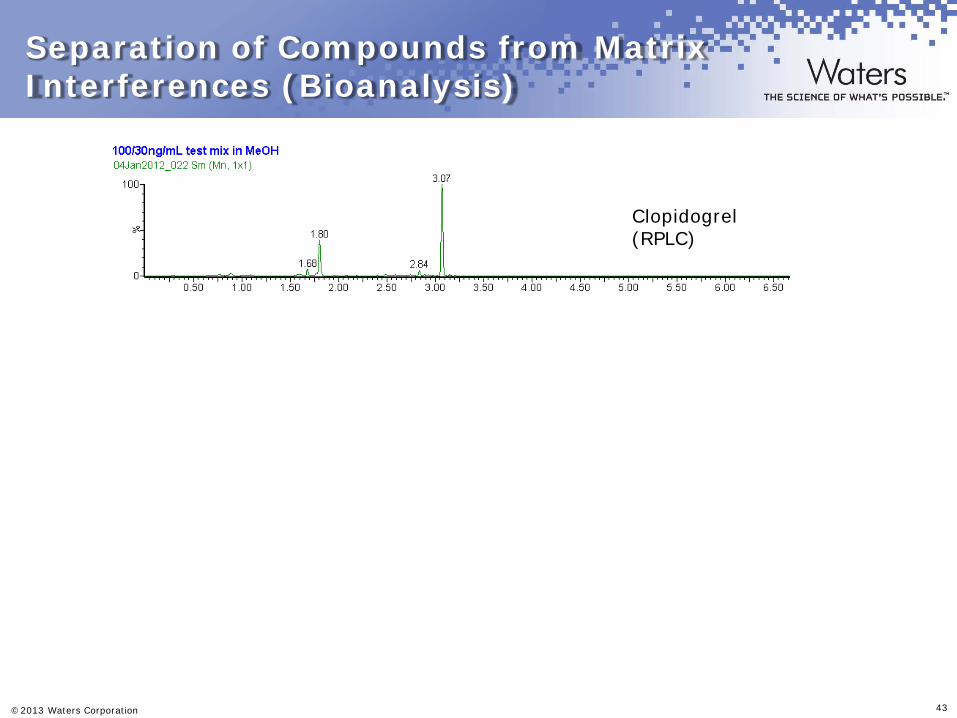
Separation of Compounds from Matrix Interferences (Bioanalysis)
Clopidogrel (RPLC)
Clopidogrel (UPC2)
Interfering Phospholipids (RPLC)
Interfering Phospholipids (UPC2)
©2013 Waters Corporation 44
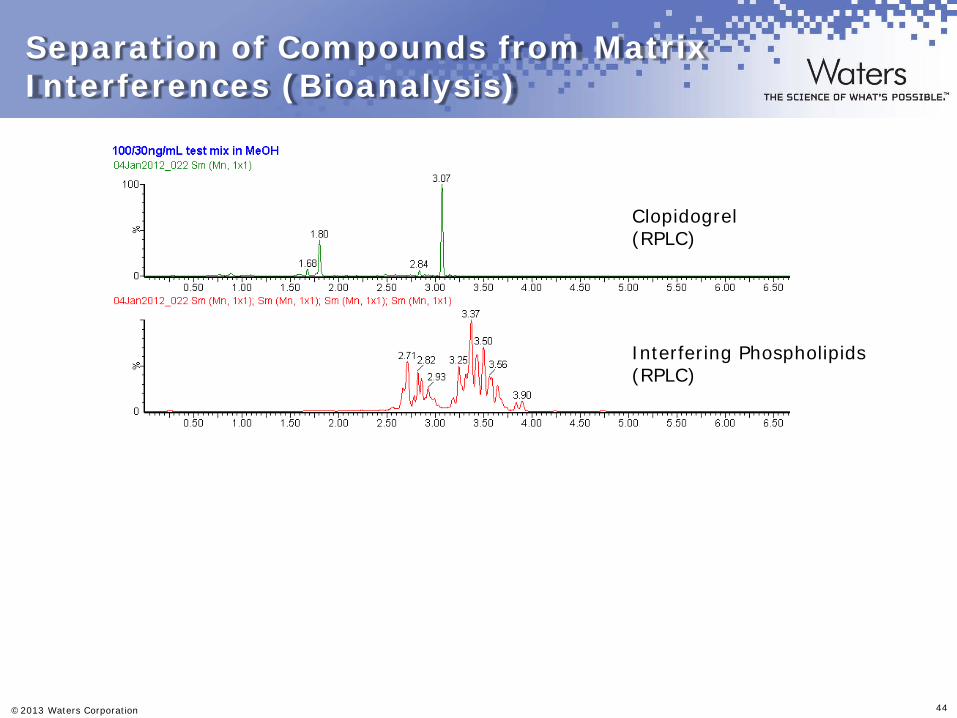
Separation of Compounds from Matrix Interferences (Bioanalysis)
Clopidogrel (RPLC)
Clopidogrel (UPC2)
Interfering Phospholipids (RPLC)
Interfering Phospholipids (UPC2)
©2013 Waters Corporation 45
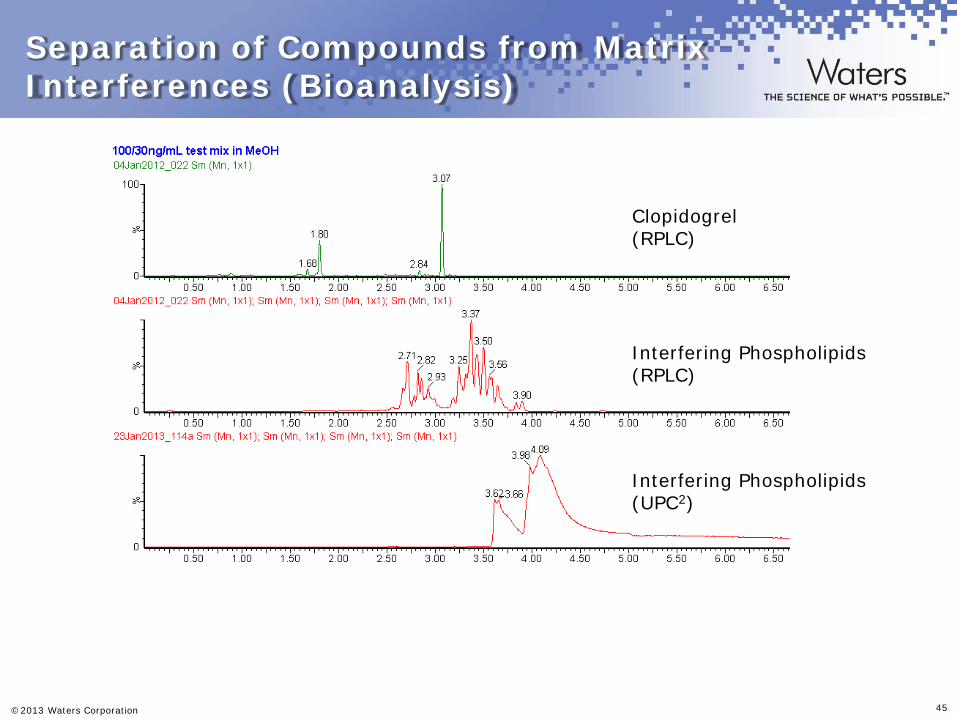
Separation of Compounds from Matrix Interferences (Bioanalysis)
Clopidogrel (RPLC)
Clopidogrel (UPC2)
Interfering Phospholipids (RPLC)
Interfering Phospholipids (UPC2)
©2013 Waters Corporation 46
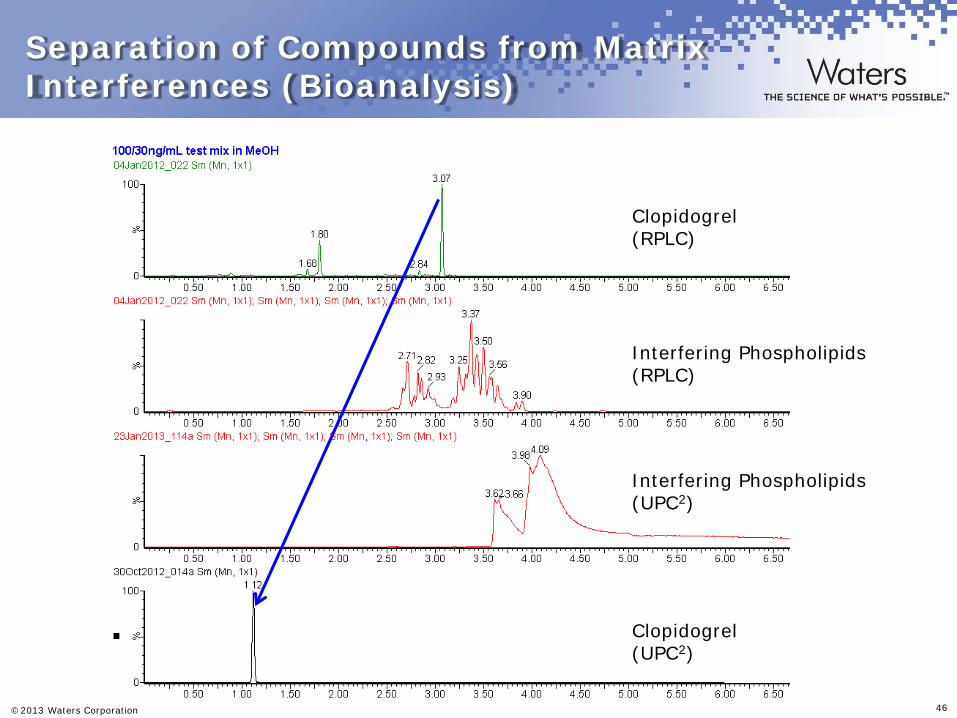
Separation of Compounds from Matrix Interferences (Bioanalysis)
Clopidogrel (RPLC)
Clopidogrel (UPC2)
Interfering Phospholipids (RPLC)
Interfering Phospholipids (UPC2)
©2013 Waters Corporation 47
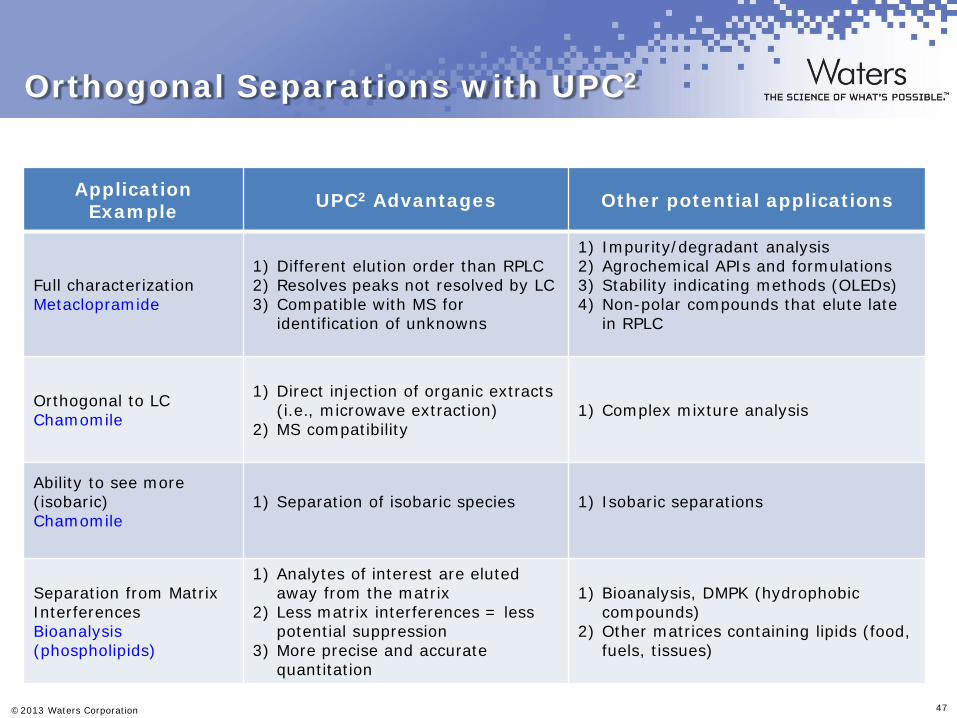
Orthogonal Separations with UPC2
Application Example UPC2 Advantages Other potential applications
Full characterization Metaclopramide
1) Different elution order than RPLC 2) Resolves peaks not resolved by LC 3) Compatible with MS for
identification of unknowns
1) Impurity/degradant analysis 2) Agrochemical APIs and formulations 3) Stability indicating methods (OLEDs) 4) Non-polar compounds that elute late
in RPLC
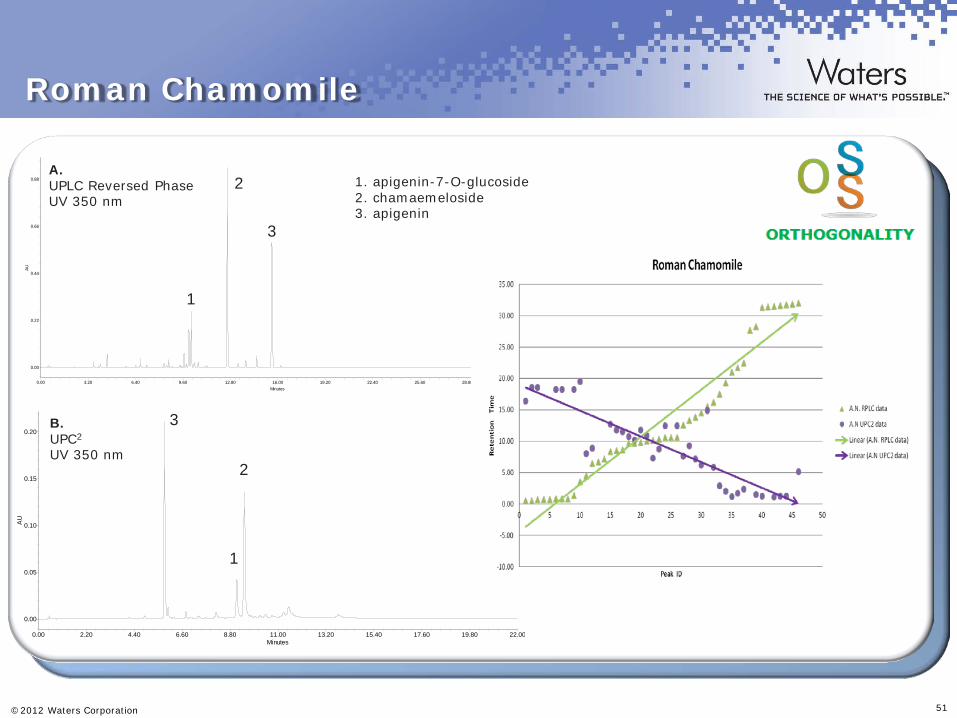
Orthogonal to LC Chamomile
1) Direct injection of organic extracts (i.e., microwave extraction)
2) MS compatibility 1) Complex mixture analysis
Ability to see more (isobaric) Chamomile
1) Separation of isobaric species
1) Isobaric separations
Separation from Matrix Interferences Bioanalysis (phospholipids)
1) Analytes of interest are eluted away from the matrix
2) Less matrix interferences = less potential suppression
3) More precise and accurate quantitation
1) Bioanalysis, DMPK (hydrophobic compounds)
2) Other matrices containing lipids (food, fuels, tissues)
©2012 Waters Corporation 48
University of Mississippi Collaboration
National Center for Natural Products Research
School of Pharmacy, The University of Mississippi
©2012 Waters Corporation 49
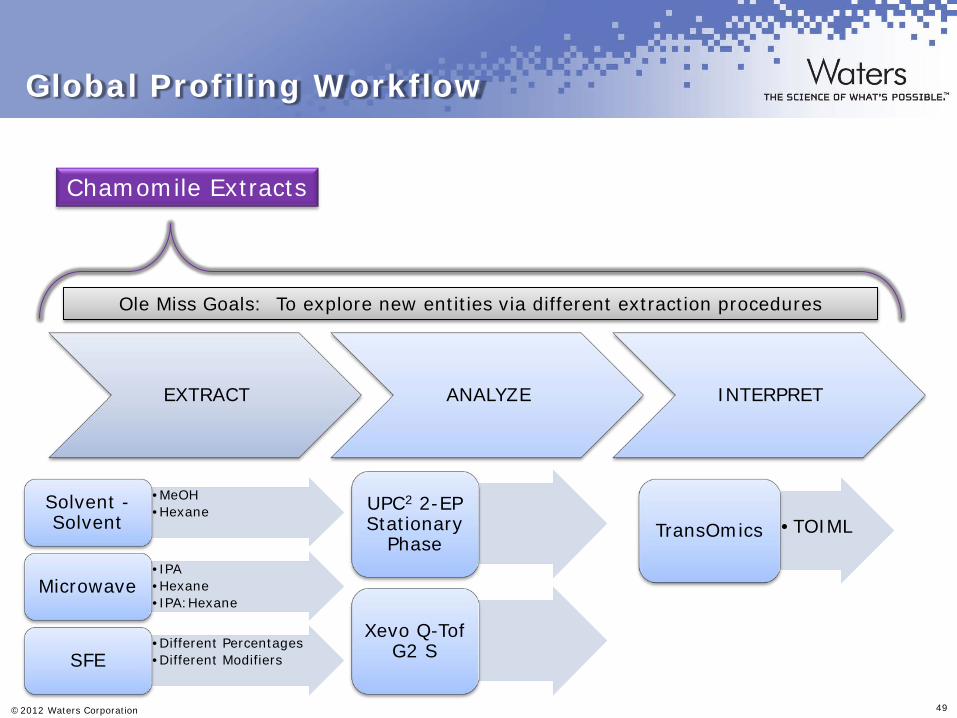
Global Profiling Workflow
EXTRACT ANALYZE INTERPRET
Ole Miss Goals: To explore new entities via different extraction procedures
Chamomile Extracts
•MeOH •Hexane Solvent -
Solvent
•IPA •Hexane •IPA:Hexane
Microwave
•Different Percentages •Different Modifiers SFE
UPC2 2-EP Stationary
Phase
Xevo Q-Tof G2 S
•TOIML TransOmics
©2012 Waters Corporation 50
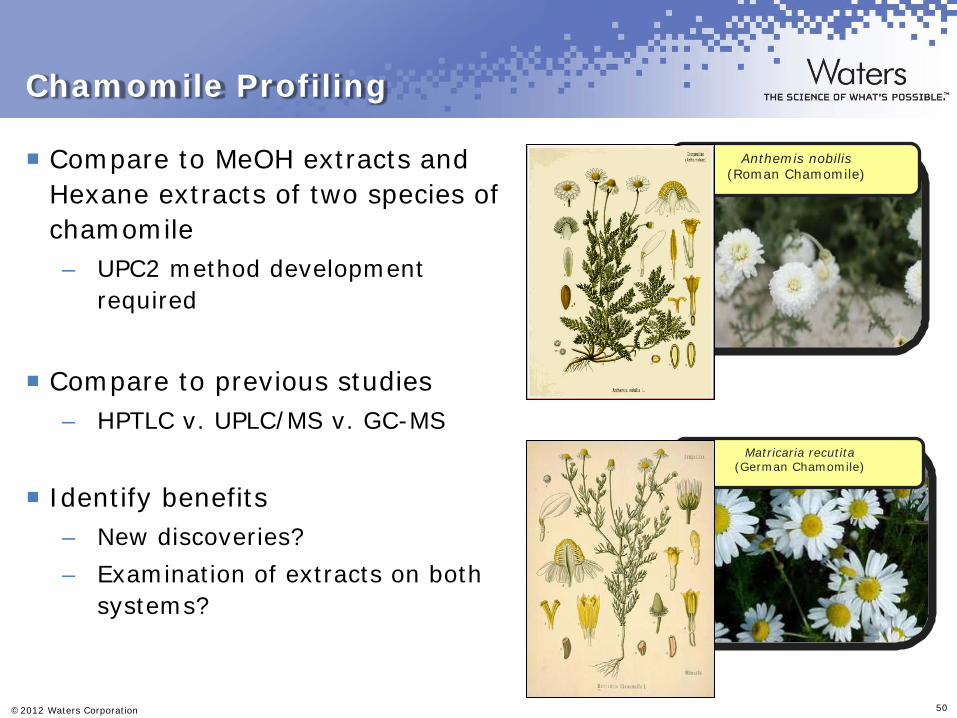
Chamomile Profiling
Compare to MeOH extracts and Hexane extracts of two species of chamomile – UPC2 method development
required
Compare to previous studies
– HPTLC v. UPLC/MS v. GC-MS
Identify benefits – New discoveries? – Examination of extracts on both
systems?
Anthemis nobilis (Roman Chamomile)
Matricaria recutita (German Chamomile)
©2012 Waters Corporation 51
Roman Chamomile
AU
0.00
0.05
0.10
0.15
0.20
Minutes0.00 2.20 4.40 6.60 8.80 11.00 13.20 15.40 17.60 19.80 22.00
AU
0.00
0.22
0.44
0.66
0.88
Minutes0.00 3.20 6.40 9.60 12.80 16.00 19.20 22.40 25.60 28.80 32.00
A. UPLC Reversed Phase UV 350 nm
B. UPC2 UV 350 nm
2
3
1
1
2
3
1. apigenin-7-O-glucoside 2. chamaemeloside 3. apigenin
©2012 Waters Corporation 52
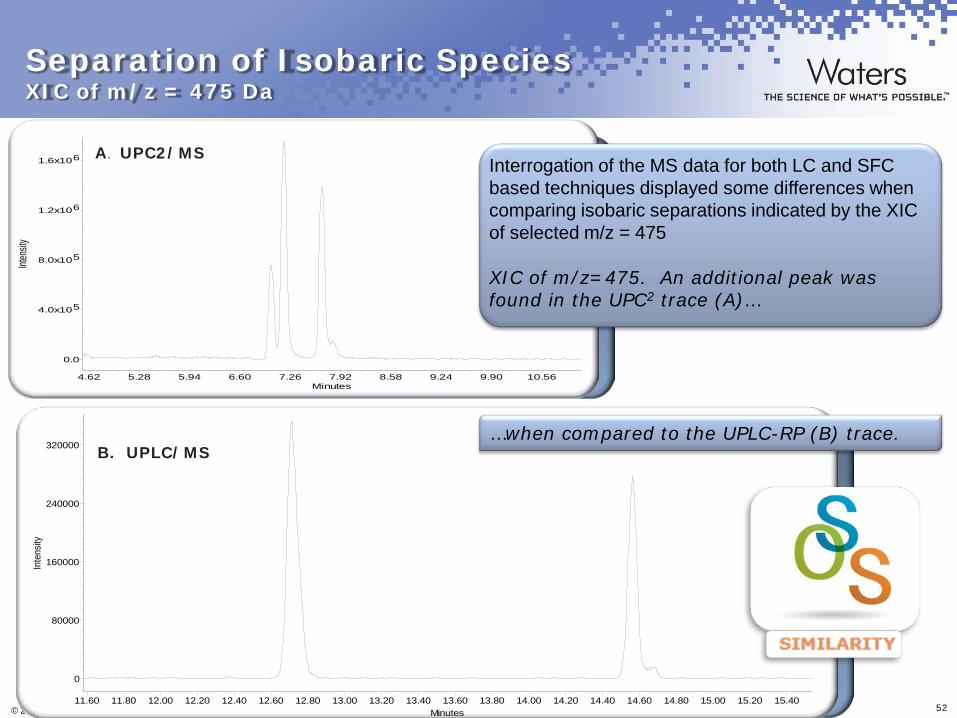
Separation of Isobaric Species XIC of m/z = 475 Da
Inte
nsity
0
80000
160000
240000
320000
Minutes11.60 11.80 12.00 12.20 12.40 12.60 12.80 13.00 13.20 13.40 13.60 13.80 14.00 14.20 14.40 14.60 14.80 15.00 15.20 15.40
Inten
sity
0.0
4.0x10⁵
8.0x10⁵
1.2x10⁶
1.6x10⁶
Minutes4.62 5.28 5.94 6.60 7.26 7.92 8.58 9.24 9.90 10.56
Interrogation of the MS data for both LC and SFC based techniques displayed some differences when comparing isobaric separations indicated by the XIC of selected m/z = 475 XIC of m/z=475. An additional peak was found in the UPC2 trace (A)…
A. UPC2/MS
B. UPLC/MS …when compared to the UPLC-RP (B) trace.
©2012 Waters Corporation 53
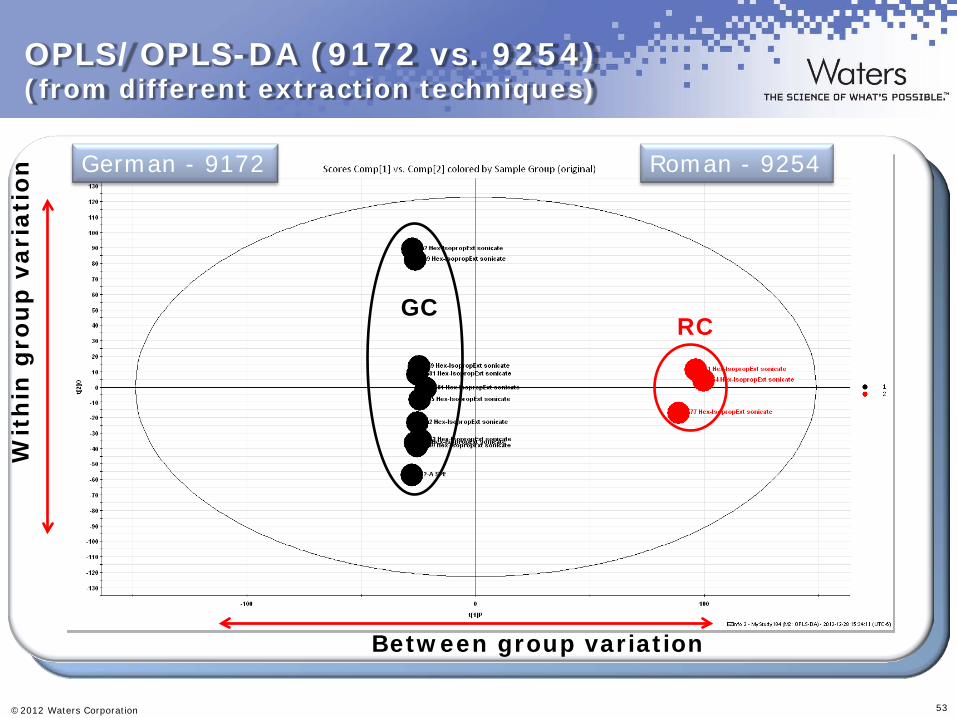
OPLS/OPLS-DA (9172 vs. 9254) (from different extraction techniques)
RC GC
Between group variation
Wit
hin
gro
up
var
iati
on German - 9172 Roman - 9254
©2012 Waters Corporation 54
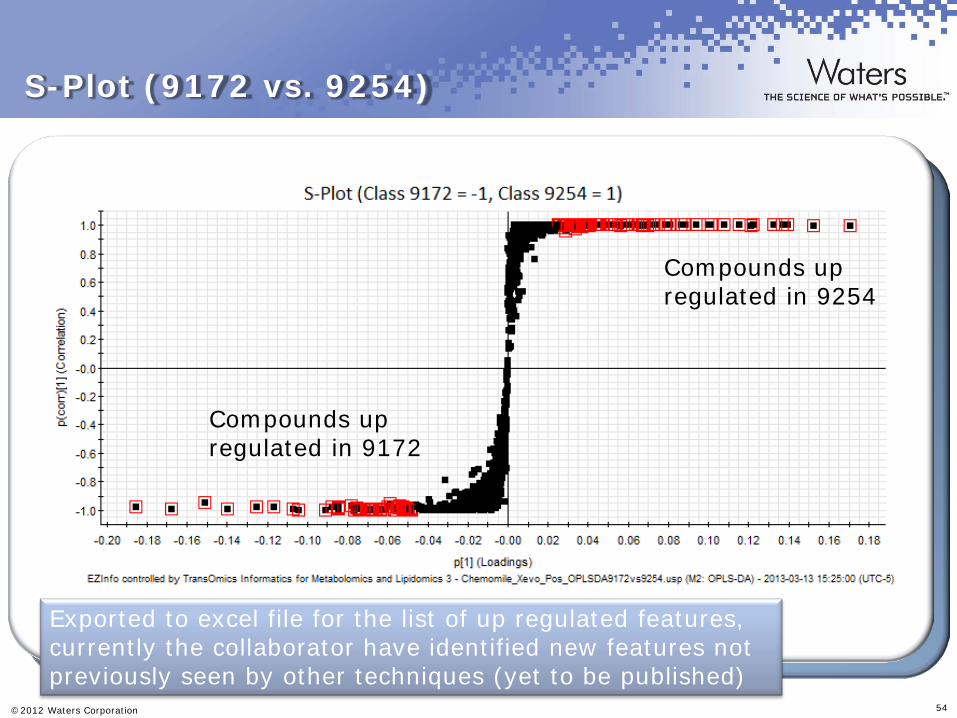
S-Plot (9172 vs. 9254)
Compounds up regulated in 9254
Compounds up regulated in 9172
Exported to excel file for the list of up regulated features, currently the collaborator have identified new features not previously seen by other techniques (yet to be published)
©2012 Waters Corporation 55
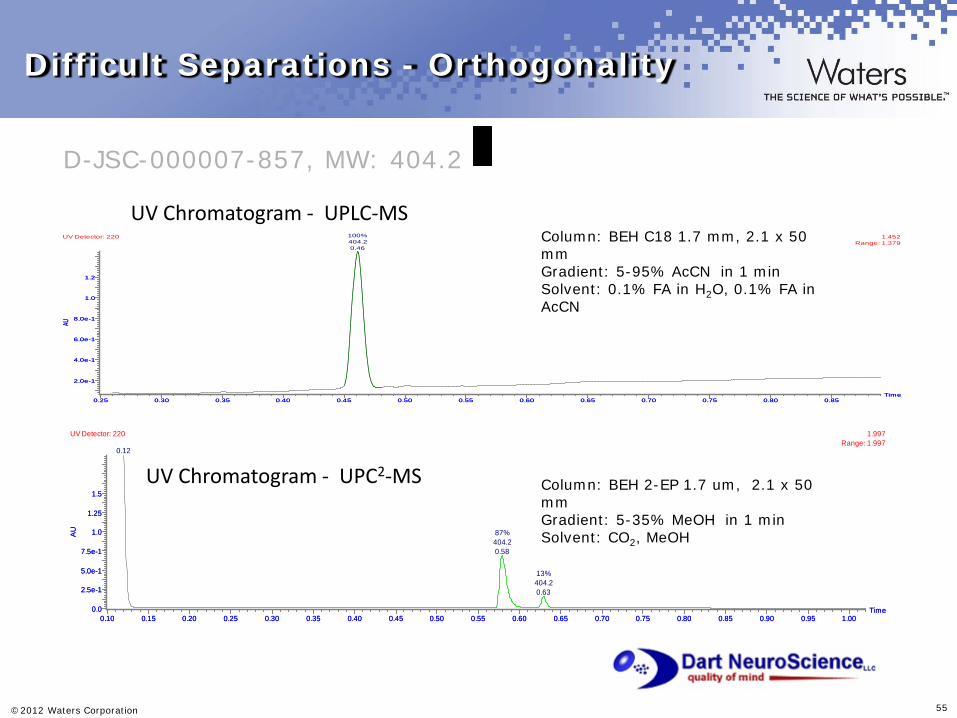
Difficult Separations - Orthogonality
Column: BEH 2-EP 1.7 um, 2.1 x 50 mm Gradient: 5-35% MeOH in 1 min Solvent: CO2, MeOH
Column: BEH C18 1.7 mm, 2.1 x 50 mm Gradient: 5-95% AcCN in 1 min Solvent: 0.1% FA in H2O, 0.1% FA in AcCN
UV Chromatogram - UPLC-MS
UV Chromatogram - UPC2-MS
Time0.25 0.30 0.35 0.40 0.45 0.50 0.55 0.60 0.65 0.70 0.75 0.80 0.85
AU
2.0e-1
4.0e-1
6.0e-1
8.0e-1
1.0
1.2
1.452Range: 1.379
UV Detector: 220 100%404.20.46
Time0.25 0.30 0.35 0.40 0.45 0.50 0.55 0.60 0.65 0.70 0.75 0.80 0.85
AU
2.0e-1
4.0e-1
6.0e-1
8.0e-1
1.0
1.2
D-JSC-000007-857, MW: 404.2
Time0.10 0.15 0.20 0.25 0.30 0.35 0.40 0.45 0.50 0.55 0.60 0.65 0.70 0.75 0.80 0.85 0.90 0.95 1.00
AU
0.0
2.5e-1
5.0e-1
7.5e-1
1.0
1.25
1.5
1.997Range: 1.997
UV Detector: 220
0.12
87%404.20.58
13%404.20.63
Time0.10 0.15 0.20 0.25 0.30 0.35 0.40 0.45 0.50 0.55 0.60 0.65 0.70 0.75 0.80 0.85 0.90 0.95 1.00
AU
0.0
2.5e-1
5.0e-1
7.5e-1
1.0
1.25
1.5
©2012 Waters Corporation 56
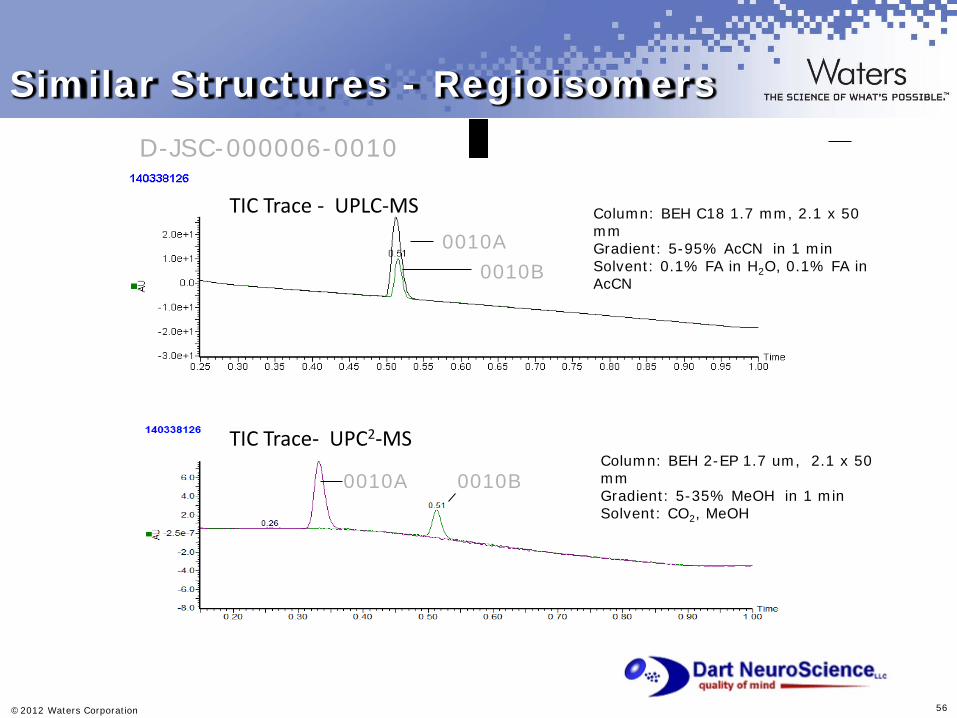
Similar Structures - Regioisomers
Column: BEH C18 1.7 mm, 2.1 x 50 mm Gradient: 5-95% AcCN in 1 min Solvent: 0.1% FA in H2O, 0.1% FA in AcCN
TIC Trace- UPC2-MS
TIC Trace - UPLC-MS
Column: BEH 2-EP 1.7 um, 2.1 x 50 mm Gradient: 5-35% MeOH in 1 min Solvent: CO2, MeOH
D-JSC-000006-0010
0010A 0010B
0010A 0010B
©2013 Waters Corporation 57
Conclusion
ACQUITY UPC2 Technology, using compressed carbon dioxide (CO2) as the primary mobile phase, is a separation tool that solves both routine and complex chromatographic problems, especially for samples possessing a wide range of polarities
UPC2 offers scientists unique workflow, application, and environmental impact benefits compared to LC and GC platforms
Because UPC2 is built utilizing UPLC Technology, customers are assured of its optimized performance through holistic design of instrumentation, detectors, software data systems and chemistries.
UPC2 provides an exceptional increase in available selectivity, making this technology widely applicable to a diverse range of compound types – 80-85% overlap of compounds that can be analyzed by CC and RPLC – Any compound soluble in an organic solvent

©2013 Waters Corporation 58
Thank You for Your Attention !