Embed Size (px)
Citation preview

Paper No. LACFO
LIQUEFACTION ASSESSMENT CHARTS BASED ON STATE AND WAVES’ VELOCITIES FROM STATIC AND CYCLIC TRIAXIAL TESTS
ON “LES DUNES” SANDS FROM ALGIERS
António Viana da Fonseca 1, José Rocha 2, Ghili Tahar3
ABSTRACT This work presents the evaluation of liquefaction susceptibility on a sand from Ain Beniam in Algeria, where, in 2003, occurred the Boumerdès earthquake, causing serious damages to several infrastructures. This evaluation was done over specimens prepared using the moist tamping technique, to achieve the void ratio limit conditions for what this phenomenon is expected. State conditions are framed in relation to the critical state, by means of the dichotomy between stress state and void ratio. The study involved isotropic compression tests and oedometer tests, and drained and undrained triaxial monotonic tests to characterize static flow liquefaction. The sensitivity of this material towards the critical state line of this sand, was revealed in three distinct zones of behavior. Several undrained static triaxial tests exhibited flow liquefaction giving rise to the definition of an unstable region. Undrained cyclic triaxial tests, recurring to bender-extender elements for measurement of seismic compression waves (P) and shear waves (S), enabled to evaluate the susceptibility to cyclic mobility under the liquefaction chart based on VS1 and CRR relations. Different confining stress conditions (depths) under the estimated K0 at rest state of the natural sand deposit have been considered. A “backbone” curve resulted for Cyclic Stress Ratio, for constant void ratio and initial stress condition. This “Liquefaction Assessment Chart” is constructed in function of the CRS concept, taken for 15 cycles, CRR15 (for an action defined in 1Hz, it corresponds to 15sec to failure), as a function of state parameter (UC-Berkeley approach). Results of this study are discussed. Keywords: Liquefaction, critical state, monotonic and cyclic triaxial tests, seismic waves,
INTRODUCTION AND OBJECTIVES The liquefaction is one of the most complex and controversial issues in geotechnical and seismic engineering. For this reason the studies in this field increased considerably in the last 40 years, largely due to earthquakes that occurred in 1964 in Alaska and in Niigata and the subsequent ones. Over the years, the term liquefaction has become related to a phenomenon that is the loss of strength and / or stiffness of a saturated soil under undrained conditions, in monotonic or cyclic loading, ie, for a short interval of time which may lead to a sudden rupture of the soil (collapse). During the process, excessive positive pressure will be generated in the pore water of soils that may equalize the total stress, resulting in the loss of interparticle forces or annulment of the effective stresses. Being the distortional stiffness and shear resistance of a soil a direct function of the effective stresses, ie, inter-particle forces, their drop or in extreme their annulling will conduct to large settlements and, in many cases, will be followed by the opening of cracks on the ground surface with expulsion of water under pressure, this phenomenon - “sand bubbling"- is devastating to structures founded on such masses. 1 DSc, Associate Professor, University of Porto, Portugal, e-mail: [email protected] 2 MSc, Graduate Student, University of Porto, Portugal 3 MSc, PhD Student, University of Bab Ezzouar (USTHB), Algiers, Algeria

5th International Conference on Earthquake Geotechnical Engineering January 2011, 10-13
Santiago, Chile
Triaxial tests were performed with samples prepared with void ratios of 0.9 and a moisture content of 5%, in order to obtain a good definition of the normal consolidation and the critical state lines (NCL and CSL, respectively), following other previous work in this material (Pinheiro, 2009, and Fonseca, 2009). Lower values of void ratios have not revealed potential for static liquefaction. In order to define the normal consolidation line for a very broad range of pressure levels, which has the advantage of indicating the pattern of the critical state line, which is expected to be parallel to NCL, a set of two oedometer tests taken to to very high stress levels were also performed. Similarly, to evaluate the cyclic mobility of the studied material, cyclic tests were performed with a constant water content of 5%, but the void ratio was varied from a value of 0.9, which exhibited a marked susceptibility to the liquefaction, to a value of 0.8, in order to define the void ratio boundary conditions for the liquefaction occurrence under cyclic loading, representative of the Boumerdés earthquake action. The implementation of piezoelectric transducers in the triaxial cells of the Geotechnical Laboratory of FEUP, allowed the evaluation of dynamic stiffness properties associated with the compression seismic waves velocities ,VP (directly related to Bulk modulus) and the seismic shear wave velocities , VS (this directly related to Shear modulus, Gdin or G0). The main objective of this work is the evaluation of the state parameters and the cyclic actions that can lead to liquefaction phenomenon in the “Les Dunes” sand of Ain Beniam.
EQUIPMENT AND EXPERIMENTAL PROCEDURE In order to characterize the phenomenon of monotonic and cyclic liquefaction resistance of the studied material; 26 triaxial tests were performed either in static or in cyclic conditions. Although some simplifications are made in these types of tests, following the recommendations of some previous researchers (Kramer, 1995, Jefferies & Been, 2006), the complete set of tests herein performed may be regarded as being quite exhaustive. All tests were performed at FEUP Geotechnical Laboratory and detailed description of the equipment can be found in Rocha (2010). As already mentioned, these experiments were fitted with bender/extender elements (BE) that allowed the recording of the travelling times of P and S waves in the specimens (more details in Viana da Fonseca et al., 2009). Sand liquefaction investigation, in static or cyclic conditions, requires an adequate method of sample preparation. The moist placement with tamping method was adopted in this work, which is a technique recognized as particularly effective and commonly used in molding silty and sandy soils specimens , allowing to reach very low density values, ie, high void ratios to replicate in situ conditions of some liquefiable in situ sands. In this work, the main steps for the preparation and the assembly of the specimens are as follows: 1. Guiding marks are first drawn on the membrane, facilitating the placement of the internal
instrumentation in static testing creating reference marks for subsequent introduction of the material; 2. A filter is placed at the base of the cell, to prevent the passage of fines through the porous stones, pre-
cut with the shape of the BE elements for free contact between the transducer and the soil; 3. The membrane is attached to the base of the cell by applying two “o-rings”; 4. A cylindrical metallic mold is placed on the base plate; then the membrane is adjusted so that it is
possible to have a correct soil molding. Vacuum pressure of around 50 kPa is subsequently applied between the mold and the membrane so that it is perfectly stretched and held against the mold walls; finally the measurement of the specimens’ dimensions are taken inside the mold;
5. Once the mold dimensions are known, the required weight of sand to be used for the requested void ratio can be known; as referred previously, the water content used for all the performed tests is 5%;
5th International Conference on Earthquake Geotechnical Engineering January 2011, 10-13
Santiago, Chile
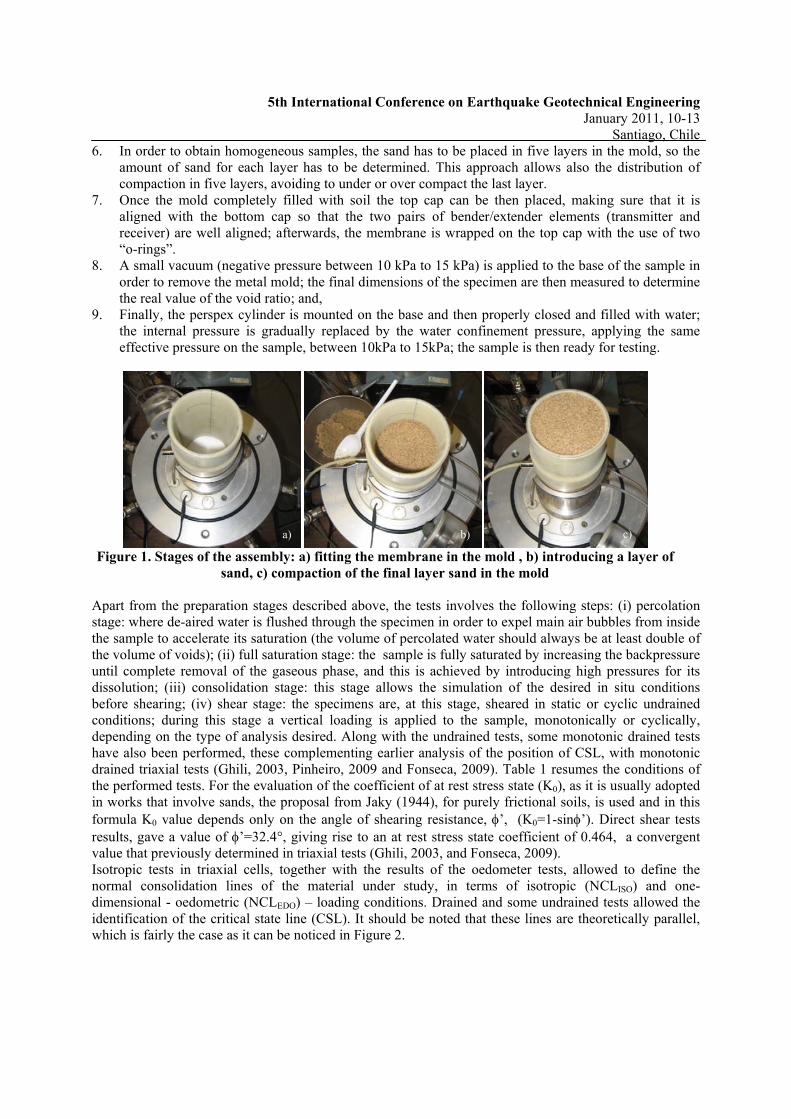
6. In order to obtain homogeneous samples, the sand has to be placed in five layers in the mold, so the amount of sand for each layer has to be determined. This approach allows also the distribution of compaction in five layers, avoiding to under or over compact the last layer.
7. Once the mold completely filled with soil the top cap can be then placed, making sure that it is aligned with the bottom cap so that the two pairs of bender/extender elements (transmitter and receiver) are well aligned; afterwards, the membrane is wrapped on the top cap with the use of two “o-rings”.
8. A small vacuum (negative pressure between 10 kPa to 15 kPa) is applied to the base of the sample in order to remove the metal mold; the final dimensions of the specimen are then measured to determine the real value of the void ratio; and,
9. Finally, the perspex cylinder is mounted on the base and then properly closed and filled with water; the internal pressure is gradually replaced by the water confinement pressure, applying the same effective pressure on the sample, between 10kPa to 15kPa; the sample is then ready for testing.
Figure 1. Stages of the assembly: a) fitting the membrane in the mold , b) introducing a layer of
sand, c) compaction of the final layer sand in the mold Apart from the preparation stages described above, the tests involves the following steps: (i) percolation stage: where de-aired water is flushed through the specimen in order to expel main air bubbles from inside the sample to accelerate its saturation (the volume of percolated water should always be at least double of the volume of voids); (ii) full saturation stage: the sample is fully saturated by increasing the backpressure until complete removal of the gaseous phase, and this is achieved by introducing high pressures for its dissolution; (iii) consolidation stage: this stage allows the simulation of the desired in situ conditions before shearing; (iv) shear stage: the specimens are, at this stage, sheared in static or cyclic undrained conditions; during this stage a vertical loading is applied to the sample, monotonically or cyclically, depending on the type of analysis desired. Along with the undrained tests, some monotonic drained tests have also been performed, these complementing earlier analysis of the position of CSL, with monotonic drained triaxial tests (Ghili, 2003, Pinheiro, 2009 and Fonseca, 2009). Table 1 resumes the conditions of the performed tests. For the evaluation of the coefficient of at rest stress state (K0), as it is usually adopted in works that involve sands, the proposal from Jaky (1944), for purely frictional soils, is used and in this formula K0 value depends only on the angle of shearing resistance, ’, (K0=1-sin’). Direct shear tests results, gave a value of ’=32.4°, giving rise to an at rest stress state coefficient of 0.464, a convergent value that previously determined in triaxial tests (Ghili, 2003, and Fonseca, 2009). Isotropic tests in triaxial cells, together with the results of the oedometer tests, allowed to define the normal consolidation lines of the material under study, in terms of isotropic (NCLISO) and one-dimensional - oedometric (NCLEDO) – loading conditions. Drained and some undrained tests allowed the identification of the critical state line (CSL). It should be noted that these lines are theoretically parallel, which is fairly the case as it can be noticed in Figure 2.
a) b) c)
5th International Conference on Earthquake Geotechnical Engineering January 2011, 10-13
Santiago, Chile
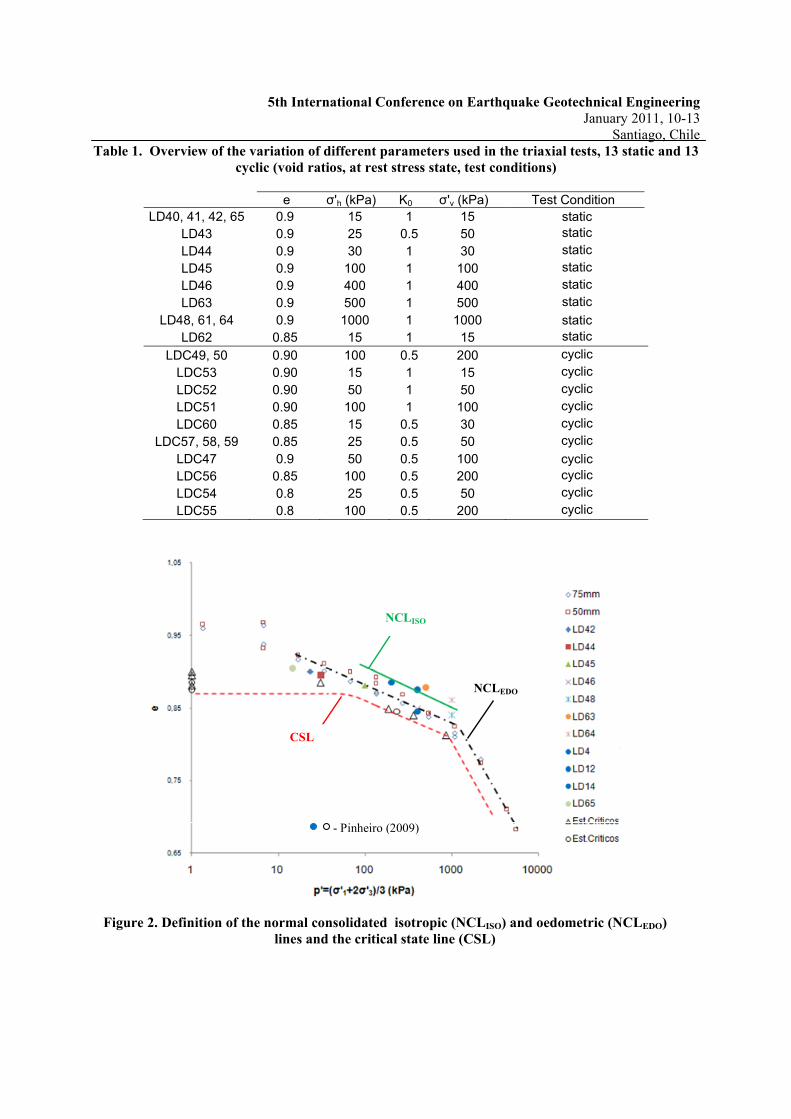
Table 1. Overview of the variation of different parameters used in the triaxial tests, 13 static and 13 cyclic (void ratios, at rest stress state, test conditions)
e σ'h (kPa) K0 σ'v (kPa) Test Condition
LD40, 41, 42, 65 0.9 15 1 15 static LD43 0.9 25 0.5 50 static
LD44 0.9 30 1 30 static
LD45 0.9 100 1 100 static
LD46 0.9 400 1 400 static
LD63 0.9 500 1 500 static
LD48, 61, 64 0.9 1000 1 1000 static LD62 0.85 15 1 15 static
LDC49, 50 0.90 100 0.5 200 cyclic
LDC53 0.90 15 1 15 cyclic
LDC52 0.90 50 1 50 cyclic
LDC51 0.90 100 1 100 cyclic
LDC60 0.85 15 0.5 30 cyclic
LDC57, 58, 59 0.85 25 0.5 50 cyclic
LDC47 0.9 50 0.5 100 cyclic LDC56 0.85 100 0.5 200 cyclic
LDC54 0.8 25 0.5 50 cyclic
LDC55 0.8 100 0.5 200 cyclic
Figure 2. Definition of the normal consolidated isotropic (NCLISO) and oedometric (NCLEDO)
lines and the critical state line (CSL)
NCLEDO
- Pinheiro (2009)
NCLISO
CSL
5th International Conference on Earthquake Geotechnical Engineering January 2011, 10-13
Santiago, Chile
In addition, with the purpose of evaluating the pattern of variation of shear wave velocities (Vs) – and therefore the distortional dynamic modulus (G0 or Gdin) - with the confinement mean effective stress, measurements of Vs values with bender elements transducers in the at rest consolidation stress states have been determined. This is important as a calibration procedure to validate the analyses that will be presented further down. With the cyclic triaxial tests results, a relationship between the state parameter, ψ, and the cyclic loading action value (CSR) adapted to be used in laboratory triaxial tests, CSRTX (Kramer, 1995), has been established.
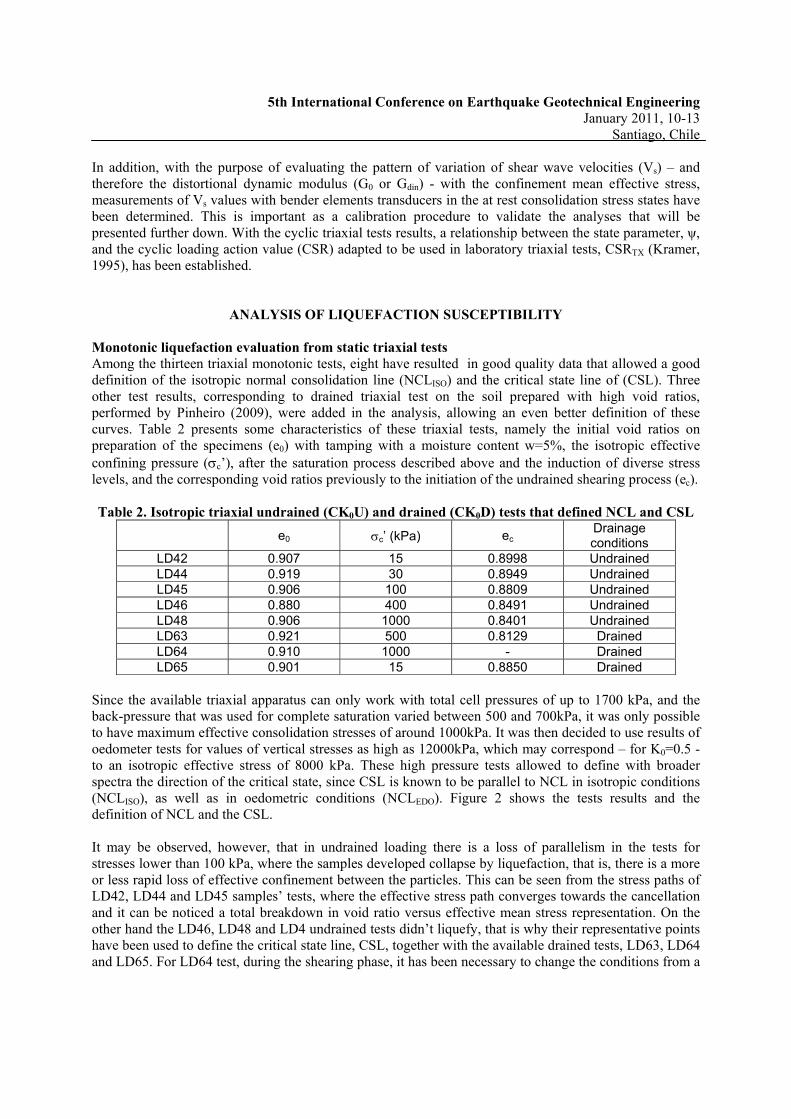
ANALYSIS OF LIQUEFACTION SUSCEPTIBILITY Monotonic liquefaction evaluation from static triaxial tests Among the thirteen triaxial monotonic tests, eight have resulted in good quality data that allowed a good definition of the isotropic normal consolidation line (NCLISO) and the critical state line of (CSL). Three other test results, corresponding to drained triaxial test on the soil prepared with high void ratios, performed by Pinheiro (2009), were added in the analysis, allowing an even better definition of these curves. Table 2 presents some characteristics of these triaxial tests, namely the initial void ratios on preparation of the specimens (e0) with tamping with a moisture content w=5%, the isotropic effective confining pressure (c’), after the saturation process described above and the induction of diverse stress levels, and the corresponding void ratios previously to the initiation of the undrained shearing process (ec). Table 2. Isotropic triaxial undrained (CK0U) and drained (CK0D) tests that defined NCL and CSL
e0 c’ (kPa) ec
Drainage conditions
LD42 0.907 15 0.8998 Undrained LD44 0.919 30 0.8949 Undrained LD45 0.906 100 0.8809 Undrained LD46 0.880 400 0.8491 Undrained LD48 0.906 1000 0.8401 Undrained LD63 0.921 500 0.8129 Drained LD64 0.910 1000 - Drained LD65 0.901 15 0.8850 Drained
Since the available triaxial apparatus can only work with total cell pressures of up to 1700 kPa, and the back-pressure that was used for complete saturation varied between 500 and 700kPa, it was only possible to have maximum effective consolidation stresses of around 1000kPa. It was then decided to use results of oedometer tests for values of vertical stresses as high as 12000kPa, which may correspond – for K0=0.5 - to an isotropic effective stress of 8000 kPa. These high pressure tests allowed to define with broader spectra the direction of the critical state, since CSL is known to be parallel to NCL in isotropic conditions (NCLISO), as well as in oedometric conditions (NCLEDO). Figure 2 shows the tests results and the definition of NCL and the CSL. It may be observed, however, that in undrained loading there is a loss of parallelism in the tests for stresses lower than 100 kPa, where the samples developed collapse by liquefaction, that is, there is a more or less rapid loss of effective confinement between the particles. This can be seen from the stress paths of LD42, LD44 and LD45 samples’ tests, where the effective stress path converges towards the cancellation and it can be noticed a total breakdown in void ratio versus effective mean stress representation. On the other hand the LD46, LD48 and LD4 undrained tests didn’t liquefy, that is why their representative points have been used to define the critical state line, CSL, together with the available drained tests, LD63, LD64 and LD65. For LD64 test, during the shearing phase, it has been necessary to change the conditions from a
5th International Conference on Earthquake Geotechnical Engineering January 2011, 10-13
Santiago, Chile
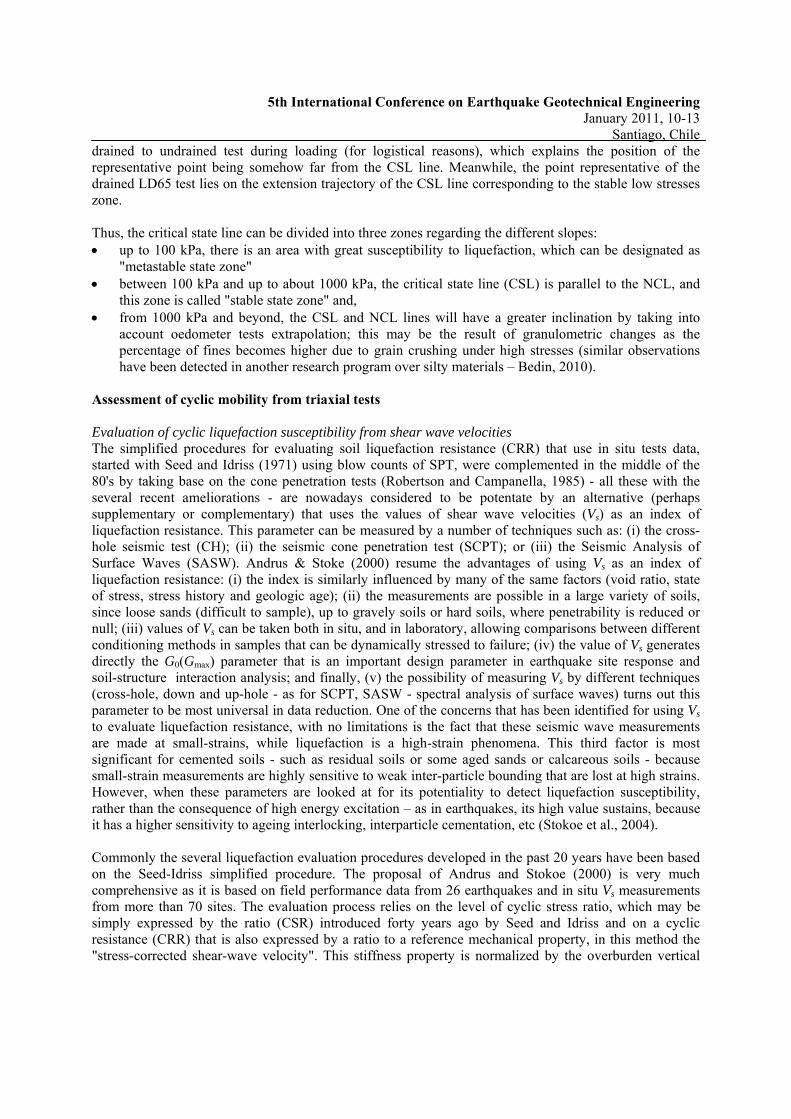
drained to undrained test during loading (for logistical reasons), which explains the position of the representative point being somehow far from the CSL line. Meanwhile, the point representative of the drained LD65 test lies on the extension trajectory of the CSL line corresponding to the stable low stresses zone. Thus, the critical state line can be divided into three zones regarding the different slopes: up to 100 kPa, there is an area with great susceptibility to liquefaction, which can be designated as
"metastable state zone" between 100 kPa and up to about 1000 kPa, the critical state line (CSL) is parallel to the NCL, and
this zone is called "stable state zone" and, from 1000 kPa and beyond, the CSL and NCL lines will have a greater inclination by taking into
account oedometer tests extrapolation; this may be the result of granulometric changes as the percentage of fines becomes higher due to grain crushing under high stresses (similar observations have been detected in another research program over silty materials – Bedin, 2010).
Assessment of cyclic mobility from triaxial tests Evaluation of cyclic liquefaction susceptibility from shear wave velocities The simplified procedures for evaluating soil liquefaction resistance (CRR) that use in situ tests data, started with Seed and Idriss (1971) using blow counts of SPT, were complemented in the middle of the 80's by taking base on the cone penetration tests (Robertson and Campanella, 1985) - all these with the several recent ameliorations - are nowadays considered to be potentate by an alternative (perhaps supplementary or complementary) that uses the values of shear wave velocities (Vs) as an index of liquefaction resistance. This parameter can be measured by a number of techniques such as: (i) the cross-hole seismic test (CH); (ii) the seismic cone penetration test (SCPT); or (iii) the Seismic Analysis of Surface Waves (SASW). Andrus & Stoke (2000) resume the advantages of using Vs as an index of liquefaction resistance: (i) the index is similarly influenced by many of the same factors (void ratio, state of stress, stress history and geologic age); (ii) the measurements are possible in a large variety of soils, since loose sands (difficult to sample), up to gravely soils or hard soils, where penetrability is reduced or null; (iii) values of Vs can be taken both in situ, and in laboratory, allowing comparisons between different conditioning methods in samples that can be dynamically stressed to failure; (iv) the value of Vs generates directly the G0(Gmax) parameter that is an important design parameter in earthquake site response and soil-structure interaction analysis; and finally, (v) the possibility of measuring Vs by different techniques (cross-hole, down and up-hole - as for SCPT, SASW - spectral analysis of surface waves) turns out this parameter to be most universal in data reduction. One of the concerns that has been identified for using Vs to evaluate liquefaction resistance, with no limitations is the fact that these seismic wave measurements are made at small-strains, while liquefaction is a high-strain phenomena. This third factor is most significant for cemented soils - such as residual soils or some aged sands or calcareous soils - because small-strain measurements are highly sensitive to weak inter-particle bounding that are lost at high strains. However, when these parameters are looked at for its potentiality to detect liquefaction susceptibility, rather than the consequence of high energy excitation – as in earthquakes, its high value sustains, because it has a higher sensitivity to ageing interlocking, interparticle cementation, etc (Stokoe et al., 2004). Commonly the several liquefaction evaluation procedures developed in the past 20 years have been based on the Seed-Idriss simplified procedure. The proposal of Andrus and Stokoe (2000) is very much comprehensive as it is based on field performance data from 26 earthquakes and in situ Vs measurements from more than 70 sites. The evaluation process relies on the level of cyclic stress ratio, which may be simply expressed by the ratio (CSR) introduced forty years ago by Seed and Idriss and on a cyclic resistance (CRR) that is also expressed by a ratio to a reference mechanical property, in this method the "stress-corrected shear-wave velocity". This stiffness property is normalized by the overburden vertical

5th International Conference on Earthquake Geotechnical Engineering January 2011, 10-13
Santiago, Chile
stress in a similar manner as that adopted for SPT and CPT values analysis. A major difference can be identified on the exponent that potentates the stress ratio, which is half of the common value adopted for resistance parameters. This, however, is not strange as it is known that low strain stiffness parameter dependence with stress level is less than that of large strain mechanical parameters, such as NSPT or qc,CPT (near failure parameters). But this also questions the adaptability of such values for the exponent value (0.25 for Vs and 0.50 for NSPT and qc). The resistance cyclic ratio is then a function of that normalized shear wave velocity (Vs1), considering limiting upper values (Vs1
*), over which liquefaction should not occur, and a magnitude scaling factor for earthquakes with moments different from 7,5. This process that can be expressed in terms of a factor of safety against liquefaction (Fs=CRR/CSR) turns out also to be translated in the curve that traditionally define the frontier between liquefiable and non-liquefiable regions in a plot of CSR versus CRR (see Figure 3).
Figure 3. Relationship between VS1 and CRR (adapted from Andrus and Stokoe, 2000) The evaluation of liquefaction susceptibility for cyclic mobility, using the cyclic triaxial tests was made from the simplified formulation expressed in the abacus proposed by Andrus and Stokoe (2000). For sands with fines percentage less than 5%, the Cyclic Resistance Ratio (CRR) is related to the normalized shear waves velocity VS1 by the following relationship:
1*
11*
2
1 11
100 sss
sTX VVV
bV
aCRR (1)
where a and b are curve fitting parameters; V*S1 is a limiting upper value of VS1. The normalised shear wave velocity VS1 is related shear wave velocity Vs by the following expression:
25.0
01 '
v
ass
pVV
(2)
where Pa is the atmospheric pressure (100 kPa) and σ'vo is the effective initial vertical stress.
Andrus & Stokoe, 2000
5th International Conference on Earthquake Geotechnical Engineering January 2011, 10-13
Santiago, Chile
It is known that the resistance to liquefaction under laboratory triaxial conditions (CRRTX) is higher by about 10% compared to field conditions, therefore it is necessary to divide the expression [1] by 0.9 to determine values of CRR corresponding to real field conditions (Kramer, 1995; Jefferies & Been, 2006):
MSFVVV
bV
CRRsss
sTX
1*
11*
2
1 11
1009.0
1 (3)
Under the abacus of Figure 4, the performed test marks, were situated, these corresponding to the normalized shear waves velocities, and the correspondent laboratory Cyclic Stress Ratio (CSRTX) . Some data from previous work are also plotted in that Figure 5. The cyclic action, expressed as the Cyclic Stress Ratio in laboratory conditions, CSRTX, is determined by expression [4], and the normalized S wave velocity, VS1, is defined by the expression [5]. Cycling was performed with a frequency of 1Hz, with the value of the distortional action centered in the effective at rest stress state, that is, for a K0=0.5 value
'2' m
ddTXCSR
(4)
25.025.0
0
25.0
1 '3
21
'
m
aS
vo
aSS
pKV
pVV
(5)
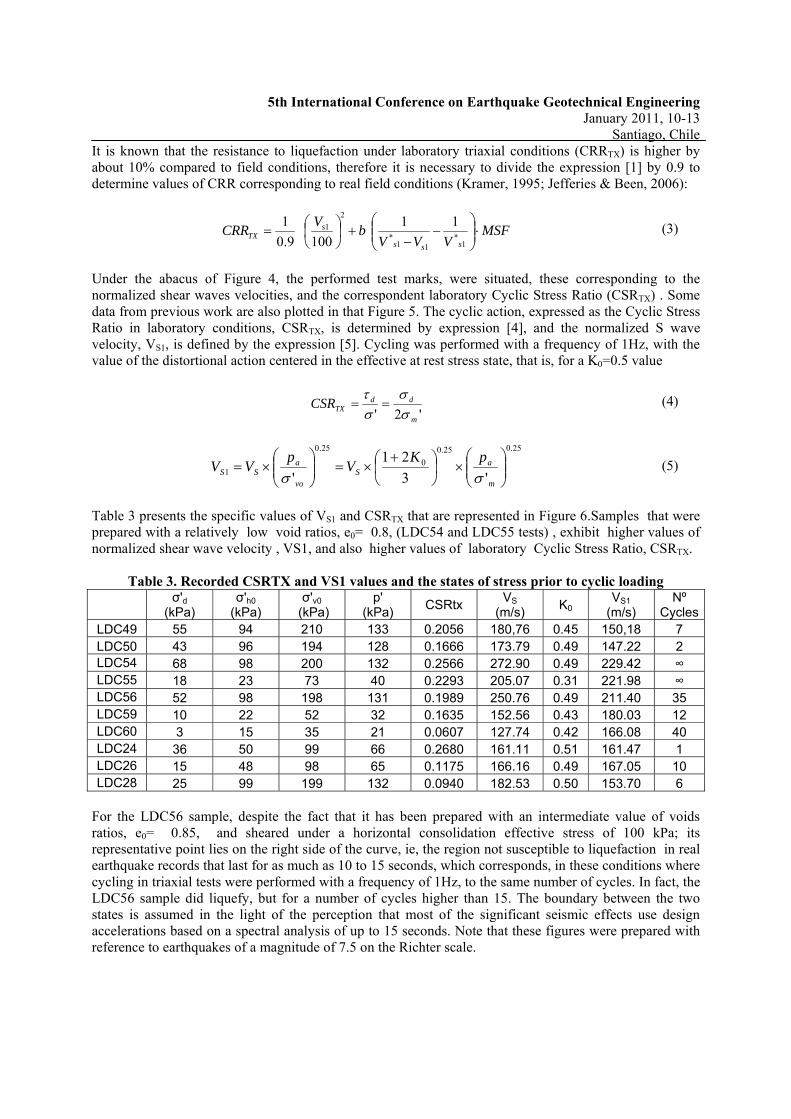
Table 3 presents the specific values of VS1 and CSRTX that are represented in Figure 6.Samples that were prepared with a relatively low void ratios, e0= 0.8, (LDC54 and LDC55 tests) , exhibit higher values of normalized shear wave velocity , VS1, and also higher values of laboratory Cyclic Stress Ratio, CSRTX.
Table 3. Recorded CSRTX and VS1 values and the states of stress prior to cyclic loading
σ'd
(kPa) σ'h0
(kPa) σ'v0
(kPa) p'
(kPa) CSRtx
VS (m/s)
K0 VS1
(m/s) Nº
CyclesLDC49 55 94 210 133 0.2056 180,76 0.45 150,18 7 LDC50 43 96 194 128 0.1666 173.79 0.49 147.22 2 LDC54 68 98 200 132 0.2566 272.90 0.49 229.42 ∞ LDC55 18 23 73 40 0.2293 205.07 0.31 221.98 ∞ LDC56 52 98 198 131 0.1989 250.76 0.49 211.40 35 LDC59 10 22 52 32 0.1635 152.56 0.43 180.03 12 LDC60 3 15 35 21 0.0607 127.74 0.42 166.08 40 LDC24 36 50 99 66 0.2680 161.11 0.51 161.47 1 LDC26 15 48 98 65 0.1175 166.16 0.49 167.05 10 LDC28 25 99 199 132 0.0940 182.53 0.50 153.70 6
For the LDC56 sample, despite the fact that it has been prepared with an intermediate value of voids ratios, e0= 0.85, and sheared under a horizontal consolidation effective stress of 100 kPa; its representative point lies on the right side of the curve, ie, the region not susceptible to liquefaction in real earthquake records that last for as much as 10 to 15 seconds, which corresponds, in these conditions where cycling in triaxial tests were performed with a frequency of 1Hz, to the same number of cycles. In fact, the LDC56 sample did liquefy, but for a number of cycles higher than 15. The boundary between the two states is assumed in the light of the perception that most of the significant seismic effects use design accelerations based on a spectral analysis of up to 15 seconds. Note that these figures were prepared with reference to earthquakes of a magnitude of 7.5 on the Richter scale.

5th International Conference on Earthquake Geotechnical Engineering January 2011, 10-13
Santiago, Chile
The remaining tests are all on the left side of the curve, except for the test LDC60, which is surprisingly on the opposite side. This can be explained by the fact that, being the mean effective stress, σ'm, so low in absolute value, the cyclic deviatoric load amplitude becomes so incipient to keep the same seismic action (that is the same CSRTX), that takes some more cycles to establish the uniformity of stress state. This will be reevaluate in subsequent tests. The relationship between the number of cycles required for the liquefaction occurrence and the Cyclic Stress Ratio, CRSTX, (see Table 3), is shown in Figure 6.
Figure 6. The relationship between the number of cycles and the value of CSRTX and the position of test marks relatively to the boundary liquefaction collapse line for 15 cycles
Comparing the results shown in Figure 5 with those of Figure 6, it is concluded that the LDC56 and LDC60 tests, which liquefied, required a number of cycles to liquefy higher than what would be expected in the reality (less than 15 cycles). All tests that are susceptible to liquefaction in the region (left side of the curve) required a number of cycles below that limit Liquefaction susceptibility assessment for cyclic tests based on the state parameter concept The liquefaction susceptibility assessment in cyclic tests can also be studied using the abacus of liquefaction based on the state parameter ψ, proposed by the research geotechnical group of the University of Berkeley, adapted by Youd et al. (2001) and quoted by Jefferies & Been (2006). Since there is an equivalence between the normalized penetration resistance, Q (Robertson, 2004), and the results of normalized SPT tests, (N1)60, and being this resistance a function of the state parameter, ψ, it is then possible to correlate the Cyclic Stress Ratio with this parameter. The state parameter, ψ, was defined by Jefferies & Been (1985) as the difference between the at rest void ratio (in triaxial tests it corresponds to the voids ratio prior to cyclic loading) and on the critical voids ratio lying on the critical state line (CSL) for the same stress state (ψ = e0 - ess). Figure 7 presents the data corresponding to this relationship, for 7.5 magnitude earthquakes, characterized by 15 loading cycles (which would correspond to an earthquake in 15 seconds with an action of 1Hz and load value referenced to the average Spectra).
Nº of cycles toliquefy: 15 to 20
Nº of cycles
Log (N° of cycles )
5th International Conference on Earthquake Geotechnical Engineering January 2011, 10-13
Santiago, Chile
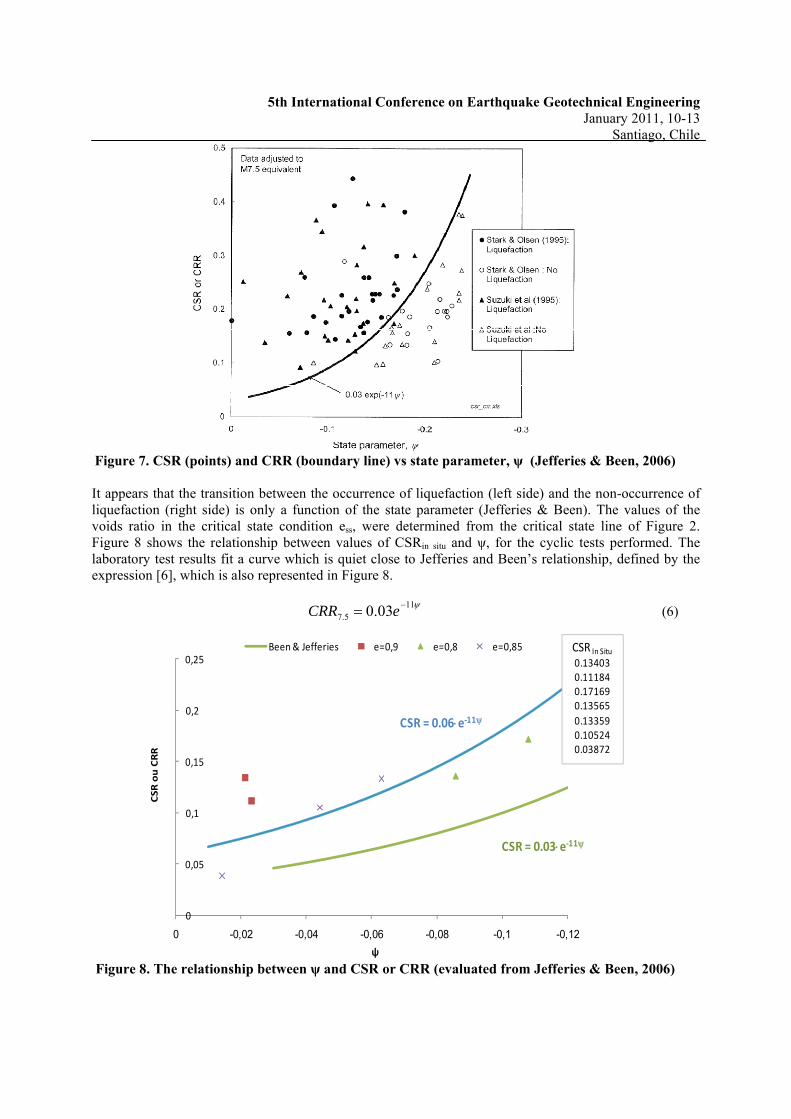
Figure 7. CSR (points) and CRR (boundary line) vs state parameter, ψ (Jefferies & Been, 2006) It appears that the transition between the occurrence of liquefaction (left side) and the non-occurrence of liquefaction (right side) is only a function of the state parameter (Jefferies & Been). The values of the voids ratio in the critical state condition ess, were determined from the critical state line of Figure 2. Figure 8 shows the relationship between values of CSRin situ and ψ, for the cyclic tests performed. The laboratory test results fit a curve which is quiet close to Jefferies and Been’s relationship, defined by the expression [6], which is also represented in Figure 8.
11
5.7 03.0 eCRR (6)
Figure 8. The relationship between ψ and CSR or CRR (evaluated from Jefferies & Been, 2006)
CSR = 0.03e‐11
CSR = 0.06e‐11
0
0,05
0,1
0,15
0,2
0,25
-0,12-0,1-0,08-0,06-0,04-0,020
CSR ou CRR
ψ
Been & Jefferies e=0,9 e=0,8 e=0,85 CSR In Situ
0.134030.111840.171690.13565
0.133590.105240.03872

5th International Conference on Earthquake Geotechnical Engineering January 2011, 10-13
Santiago, Chile
In this approach it was decided to use the same exponent of expression (6) for laboratory test data fitting curve and to modify only the base parameter (eg, 0.03 in the present case). This hypothesis might be discussable, but was adopted preliminary in the light of the small amount of performed test results in which it was possible to clearly define the state parameters, ψ. As it can be seen, the tests showed that soil samples, molded with void ratios of 0.9 and 0.85, are situated above the curve (region susceptible to liquefaction), except, again, the test LDC60. Test samples molded with a void ratio lower, are not susceptible to liquefaction, and they are below the curve. The expression [7] is therefore a preliminary proposal for the boundary between the stable states and the region susceptible to liquefaction for “Les Dunes” sand of Algiers:
1106.0 eCRR SandsDunesLus (7)
CONCLUSIONS The assessment of the susceptibility to liquefaction of the “Les Dunes” sand, from Algiers, involved the execution of 26 static and cyclic triaxial tests in the Geotechnical Laboratory of University of Porto. Static tests allowed the definition of a Critical State Line (CSL) for this sand characterised by three clearly distinct zones: a zone up to 100 kPa, where there is a very large susceptibility to liquefaction, and that was designated as "metastable state zone"; another between 100 kPa and 1000 kPa, where CSL is parallel to the normally consolidated lines (NCL), and hereby called "stable state zone"; and, from 1000kPa beyond, where the CSL and NCL lines have a larger inclination by the result of granulometric changes as the percentage of fines becomes higher due to grain crushing under high stresses. These findings allowed to define well the region where there is clearly a risk of static liquefaction (materials situated above CSL and for the breaking point between the two first zones referred above), while below that frontier, due to favorable combinations of densities and effective stresses states, there is a clear resistance to such a structural collapse, although converging to critical state failure. The parameters that determine the "state of the soil" in terms of liquefaction risk are associated with the combination of void ratios and the effective stresses state of the material, although other factors have to be considered in a broader analysis, such as natural fabric and structure, associated to ageing and interparticle bonding, but demand special sampling techniques. This is to be done in the following studies over these materials. In what respects to cyclic mobility, a study has been made in cyclic triaxial tests, by settling the necessary correspondence to the in situ conditions of the sandy terrains involved in 2003 Boumerdès earthquake, which caused heavy damage at a structural level, many of them associated with the liquefaction phenomenon. Action was defined based on the registers taken from the available regional data, adapting it to vertical cyclic triaxial conditions. Specimens were carefully saturated, by controlling their state by P-wave measurements in complement of Skempton’s B parameter readings, and the evolution of the void ratio during this long lasting process as in de tcourse of consolidation phase was thoroughly measured by local strain measurements. Cyclic shearing on triaxial conditions were conducted from anisotropic states of stress (K0=0.5) and 1Hz frequency loading for the representative actions derived of the local spectra. From the results it was possible to identify under which conditions the cyclic mobility liquefaction phenomenon is verified with a realistic number of cycles necessary to generate the phenomenon in real conditions, ie, under 15 cycles, assuming that the earthquake usual times of incidence, in an action spectrum, lasts no more than 15seconds (into a pattern of frequency of 1Hz).

5th International Conference on Earthquake Geotechnical Engineering January 2011, 10-13
Santiago, Chile
The applicability of the formulation of the liquefaction chart proposed by Andrus & Stokoe (2000), based on the normalized shear wave velocity, VS1, is verified, and a boundary separating the stable state to the unstable state (liquefiable) for Les Dunes sand has been proposed in accordance with the University of Berkeley proposal, adapted by Youd et al. (2001) and quoted by Jefferies & Been (2006).
AKNOWLEDGEMENTS This work was developed under the research activities of CEC from the Faculty of Engineering of the University of Porto, supported by multi-annual funding from FCT (Portuguese Science and Technology Foundation), specifically the research project PTDC/ECM/103220/2008, financed by QREN from the European Communion (UE/FEDER), through the Operational Program for Competitive Factors – COMPETE. The authors are grateful to the company Teixeira Duarte, SA, for their support of this work.
REFERENCES Andrus, R. D. & Stokoe, K. H. II (2000). “Liquefaction resistance of soils from shear-wave velocity”.
Journal of Geotechnical and Geoenvironmental Engineering. ASCE, 126 (11), pp. 1015-1025. Fonseca, M. A. G. (2009). “Derivation in cyclic triaxial state parameters and seismic action that induced
liquefaction of sands in dune earthquake in Algiers. Sensitivity of wave velocity cutting as risk index”. MSc in Civil Engineering, Fac. Engineering, University of Porto. (in Portuguese)
Bedin, J. (2010). “Study of the geomechanical behavior of mining wastes”. PhD thesis in Civil Engineering, Federal University of Rio Grande do Sul (in Portuguese)
Been, K. & Jefferies, M. (1985). “A state parameter for sands”. Géotechnique 35, Nº 2, pp. 99-112. Ghili, M. T. (2003). “Liquefaction du sable ‘Les Dunes’.” ISSMGE, Congrès Régional Africain
Mécanique des Sols, December, Marrakech, pp. 8-11. Jaky, J. (1944). « The coefficient of earth pressure at rest”. Journal of the Society of Hungarian Architects
and Engineers, pp. 335-358. Jefferies, M. & Been, K. (2006). “Soil liquefaction. A Critical State Approach”. Taylor & Francis. 479 pp.
USA and Canada. Kramer, S. L. (1996). “Geotechnical Earthquake Engineering”. Prentice Hall, Inc., Upper Saddle. 653 pp.
New Jersey, USA. Robertson, P. K. & Campanella, R. G. (1985). “Liquefaction potential on sands using CPT”. Journal of
Geotechnical Engineering Division, ASCE 111, GT3, pp. 384-403. Pinheiro, A. S. A. (2009). “Laboratory evaluation of the state conditions that led to phenomena of
liquefaction of sand dune in the 2003 earthquake in Boumerdes”. MSc in Civil Engineering, Fac. Engineering, University of Porto. (in Portuguese).
Seed, H. B. & Idriss, I. M (1971). “Simplified procedures for evaluating soil liquefaction potential”. Journal of Soil Mechanics and Foundation Engineering, ASCE, Vol. 97, SM9, pp. 1249-1273.
Seed, H. B., I.M. Idriss, F. Makdisi & Banerjee, N. (1975). “Representation of irregular stress time histories by equivalent uniform stress series in liquefaction analyzes”. Report no. UCB/EERC-75/29, Earthquake Engineering Research Center, UC Berkeley.
Viana da Fonseca, A., Ferreira, C., & Fahey, M. (2009). “A framework interpreting bender element tests, combining time-domain and frequency-domain methods”. Geotechnical Testing Journal, ASTM. Volume 32, No. 2, pp. 1-17.