Embed Size (px)
Citation preview
5 March, 2015
TO: Professor L. Zhang, Ph.D
FROM: Group A-7
SUBJECT: Liposome Nanoparticle Synthesis, Final Report Please find attached the final report of the evaluation liposome nanoparticles under varying cholesterol concentrations. The report includes the analysis of the average size and polydispersity index of liposomes prepared using the extrusion method. If questions or concerns arise, please feel free to contact us at your convenience. Sincerely, Group A-7
Adam Rice, Part I
Minh Dao, Part II
Chris Mase, Part III Hong Zhang, Part IV
Liposome Nanoparticles
Chris Mase, Hong Zhang, Adam Rice, Minh Dao The goal of this experiment was to synthesize liposome nanoparticles using the extrusion method to maintain an average size of 100 nm with a low polydispersity index, which indicates a more homogenous solution. The amount of lipid (DLPC) and the number of extrusions remained constant while the amount of cholesterol was varied in four samples. We found that when the cholesterol amount increased, the polydispersity index of the liposome solution decreased. This is likely due to the ability of cholesterol to incorporate itself into the liposome bilayer and stabilize it. There was no correlation between the amount of cholesterol and liposome size. The best results were obtained with the liposome solution containing 25% cholesterol, which had a PDI of 0.19 ± 0.04 with a particle size of 140 ± 10 nm.
Advisor: Professor Liangfang Zhang
March 6, 2015
1
Introduction
Liposomes were described by Akbarzadeh et al. as artificial spherical vesicles composed of
cholesterol and natural phospholipids, formed by the hydrophilic and hydrophobic interactions of the
phospholipid bilayer in aqueous solutions.1 Different preparation techniques lead to different properties,
which allows for the customization of vesicle bilayers, size, surface properties, and composition.
Liposomes form when amphiphiles, which are surface molecules with a hydrophilic head group and
hydrophilic tail group, are exposed to water and form lipid bilayer compartments which can entrap
molecules in different areas. Addition of cholesterol contributes to the stability and fluidity of the bilayer,
while the size of vesicles can be controlled by extrusion through a membrane of desired pore size.
Adjustment of these characteristics can provide an optimal environment for the transport of a desired
molecule.
Due to their characteristics, liposomes have been seen as promising vehicles for drug
transportation and delivery. Their hydrophobic and hydrophilic properties allow for the incorporation of
drugs on the surface from electrostatic interactions or entrapped within the vesicle.2 Encapsulation of
drugs allows them to be protected from degradation before they reach their target area. A more focused
drug delivery is achieved by incorporating surface molecules with an affinity for the delivery site. This
allows for minimal drug dispersal throughout the body which will reduce harmful side effects of the drug
in other areas. This is promising for cancer treatments in which toxic medications would be much more
effective if a higher dose can reach the target site and not spread throughout the body causing damage to
other areas sensitive to the drug.
Another application of liposome nanoparticles is the treatment of the bacterium which causes
acne, Propionibacterium acnes, with the antimicrobial properties of lauric acid (LA). Yang et al. have
demonstrated the effectiveness of LA loaded liposomes in the treatment of acne in which liposomes aid in
the delivery and enhancement of antimicrobial activity.3 This is partly due to the similarities between lipid
composition and the epidermis, allowing the liposomes to be very effective in treatment of hair follicle-
2
associated disorders.3 This shows the flexibility of liposome mediated treatments for diseases and the
limitations due to their composition as well as drug properties.
This experiment involved the synthesis of liposomes using cholesterol and DLPC with extrusion
through a 100 nm membrane to control their size distribution. The ratio of cholesterol to DLPC was
varied to produce different properties in the liposomes. This was done to observe the effects of the
varying cholesterol on liposome properties that can be measured by dynamic light scattering (DLS). The
goal was to produce liposomes of around 100 nm with an acceptable polydispersity index (PDI) range
between 0.1 and 0.25.4
Background and Theory
Haematologist Alec Bangham discovered liposomes in 1961 when he was testing an electron
microscope on phospholipids at the Babraham Institute.5 Liposomes then became extremely popular in
industry once Alec’s report on Liposomes went public roughly five years later. Liposomes are
phospholipid bilayers, much like cells. Liposome nanoparticles are useful in medicine because of this.
Liposomes are commonly used to protect soluble drugs en route to the desired destination. This
can be most easily explained with extremely harmful Chemo Therapy drugs. While this has not been
perfected yet, the idea is to allow the nanoparticles to carry the highly toxic Chemo drug directly to the
source of the cancer, exclusively killing the cancer, and not healthy cells. The reason liposomes are
commonly tasked for this is because of the hydrophilic head of the outer shell, allowing the liposome to
dissolve, and the hydrophobic bilayer protecting the soluble inner core of the liposome. This creates a
protective shell around anything the liposome is encapsulating.
One of the main issues in using liposomes is hydrating. Hydrating the liposome allows the
structure to expand, and allows drugs to be absorbed into the structure, so this is vital to the process.
However, over hydrating makes the liposome too large to intake into the body. The human blood stream
can most efficiently absorb liposomes in a range of 100-150 nm.
3
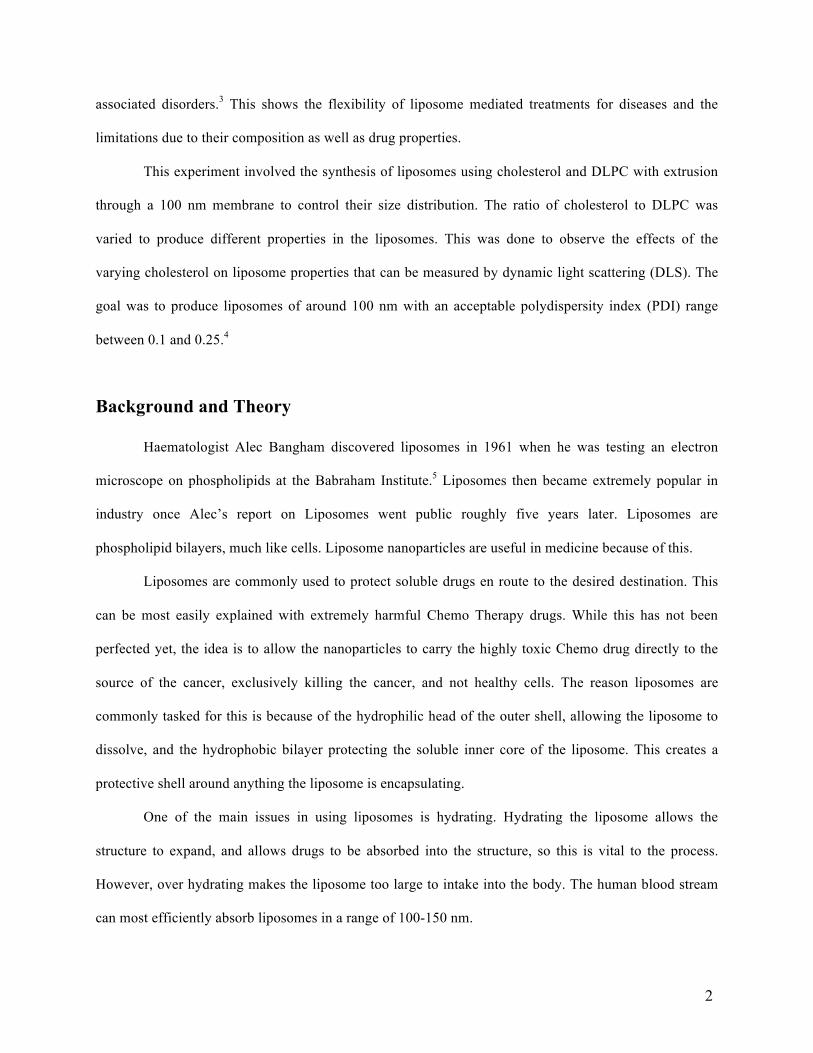
In order to efficiently attain this range of liposomes, the hydrated solution is agitated using sound
to break up multilamellar vesticles (MLV) into smaller nanoparticles. After agitation, liposomes are
commonly extruded through a membrane to restrict diameter to a large unilamellar vesticle (LUV) size of
roughly 100nm.
Figure 1: Size comparison between LUVs and MLVs.
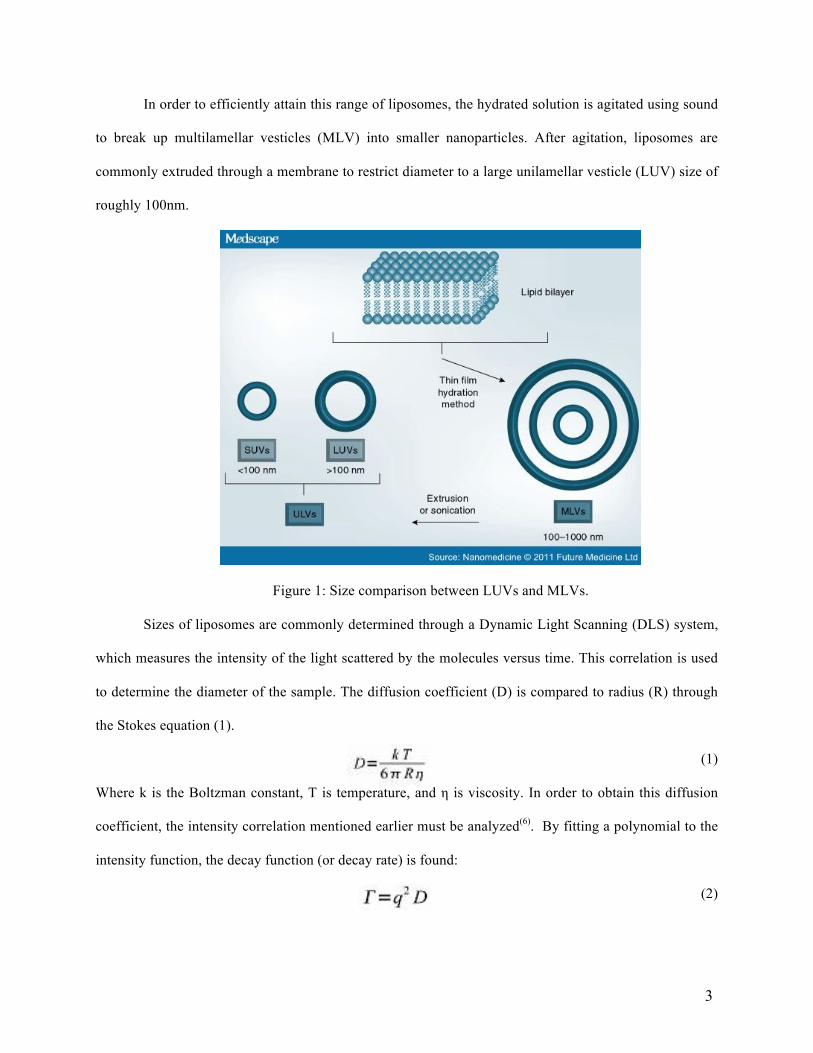
Sizes of liposomes are commonly determined through a Dynamic Light Scanning (DLS) system,
which measures the intensity of the light scattered by the molecules versus time. This correlation is used
to determine the diameter of the sample. The diffusion coefficient (D) is compared to radius (R) through
the Stokes equation (1).
(1)
Where k is the Boltzman constant, T is temperature, and η is viscosity. In order to obtain this diffusion
coefficient, the intensity correlation mentioned earlier must be analyzed(6). By fitting a polynomial to the
intensity function, the decay function (or decay rate) is found:
(2)
4
This relates the decay of intensity directly to the diffusion coefficient. q is the wave vector, which relies
on the scatter angle.
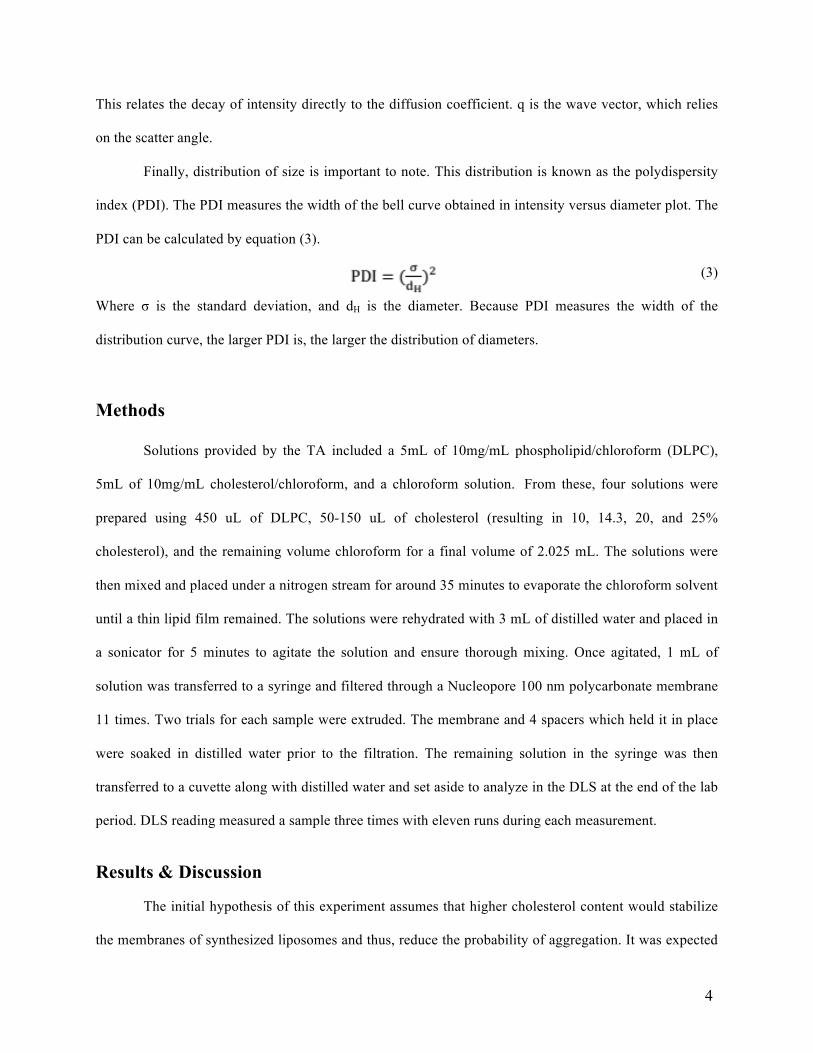
Finally, distribution of size is important to note. This distribution is known as the polydispersity
index (PDI). The PDI measures the width of the bell curve obtained in intensity versus diameter plot. The
PDI can be calculated by equation (3).
(3)
Where σ is the standard deviation, and dH is the diameter. Because PDI measures the width of the
distribution curve, the larger PDI is, the larger the distribution of diameters.
Methods
Solutions provided by the TA included a 5mL of 10mg/mL phospholipid/chloroform (DLPC),
5mL of 10mg/mL cholesterol/chloroform, and a chloroform solution. From these, four solutions were
prepared using 450 uL of DLPC, 50-150 uL of cholesterol (resulting in 10, 14.3, 20, and 25%
cholesterol), and the remaining volume chloroform for a final volume of 2.025 mL. The solutions were
then mixed and placed under a nitrogen stream for around 35 minutes to evaporate the chloroform solvent
until a thin lipid film remained. The solutions were rehydrated with 3 mL of distilled water and placed in
a sonicator for 5 minutes to agitate the solution and ensure thorough mixing. Once agitated, 1 mL of
solution was transferred to a syringe and filtered through a Nucleopore 100 nm polycarbonate membrane
11 times. Two trials for each sample were extruded. The membrane and 4 spacers which held it in place
were soaked in distilled water prior to the filtration. The remaining solution in the syringe was then
transferred to a cuvette along with distilled water and set aside to analyze in the DLS at the end of the lab
period. DLS reading measured a sample three times with eleven runs during each measurement.
Results & Discussion
The initial hypothesis of this experiment assumes that higher cholesterol content would stabilize
the membranes of synthesized liposomes and thus, reduce the probability of aggregation. It was expected
5
that the addition of cholesterol would cause a sample to be less polydisperse as more multilamellar
vesicles (LMVs) are converted to unilamellar vesicles (LUVs). In turn, the size of the sample would
decrease until it reaches a size of 100 nm with a PDI range between 0.1 and 0.25. This would show that
higher cholesterol content induces the formation of homogeneous liposome sample. Varied cholesterol
contents and other characteristics of four prepared samples were recorded in Table 1 of the Appendix.
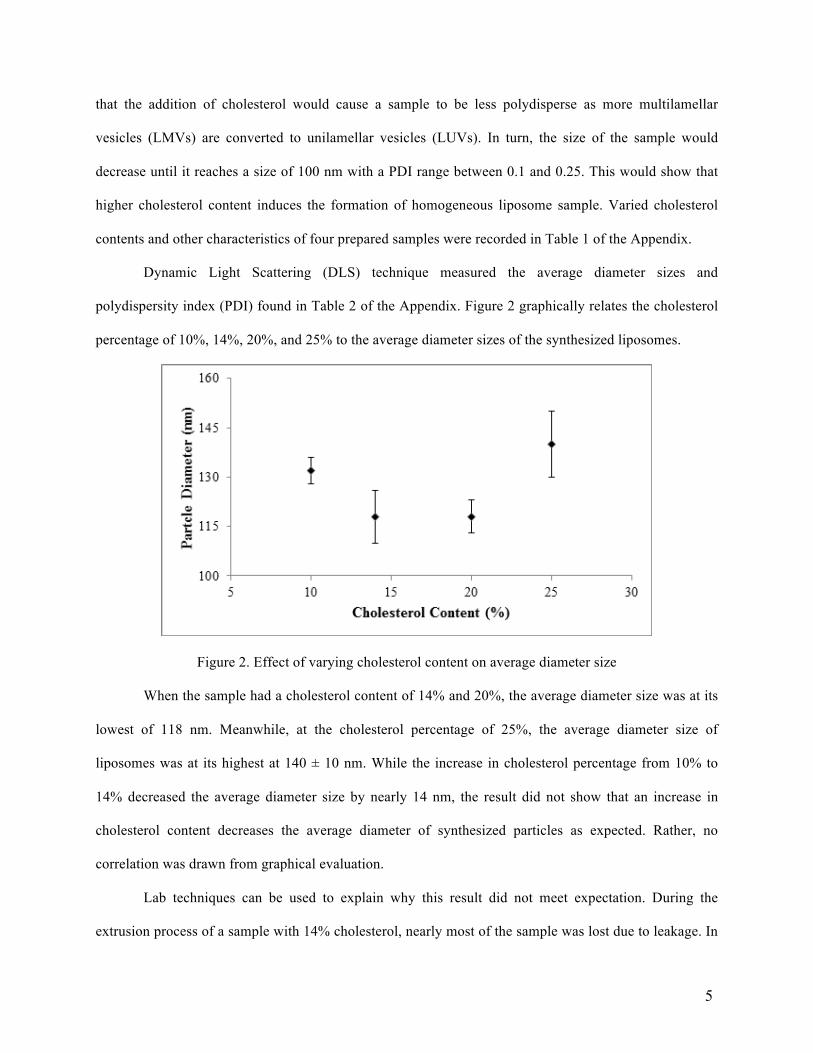
Dynamic Light Scattering (DLS) technique measured the average diameter sizes and
polydispersity index (PDI) found in Table 2 of the Appendix. Figure 2 graphically relates the cholesterol
percentage of 10%, 14%, 20%, and 25% to the average diameter sizes of the synthesized liposomes.
Figure 2. Effect of varying cholesterol content on average diameter size
When the sample had a cholesterol content of 14% and 20%, the average diameter size was at its
lowest of 118 nm. Meanwhile, at the cholesterol percentage of 25%, the average diameter size of
liposomes was at its highest at 140 ± 10 nm. While the increase in cholesterol percentage from 10% to
14% decreased the average diameter size by nearly 14 nm, the result did not show that an increase in
cholesterol content decreases the average diameter of synthesized particles as expected. Rather, no
correlation was drawn from graphical evaluation.
Lab techniques can be used to explain why this result did not meet expectation. During the
extrusion process of a sample with 14% cholesterol, nearly most of the sample was lost due to leakage. In
6
doing so, only two trials were implemented with three and nine extrusions. Therefore, point 2 of Figure 2
does not accurately reflect the effect of varying cholesterol content on synthesized liposomes since
another variable, the number of extrusion, was changed during data collection. Even though this sample
was included in Figure 1 and 2, it is important to note that this data point was disregarded during later
analysis due to the mentioned reason. Meanwhile, in Figure 1, point 4 representing a sample of 25%
cholesterol produced a high diameter size due to contamination when extruding the sample. It was
observed during data collection that one plunger of the extruder was loose. This allowed sample that was
not extruded to seep through the end of the syringe and cause contamination. In effect, the sample
containing 25% cholesterol had a large particle size.
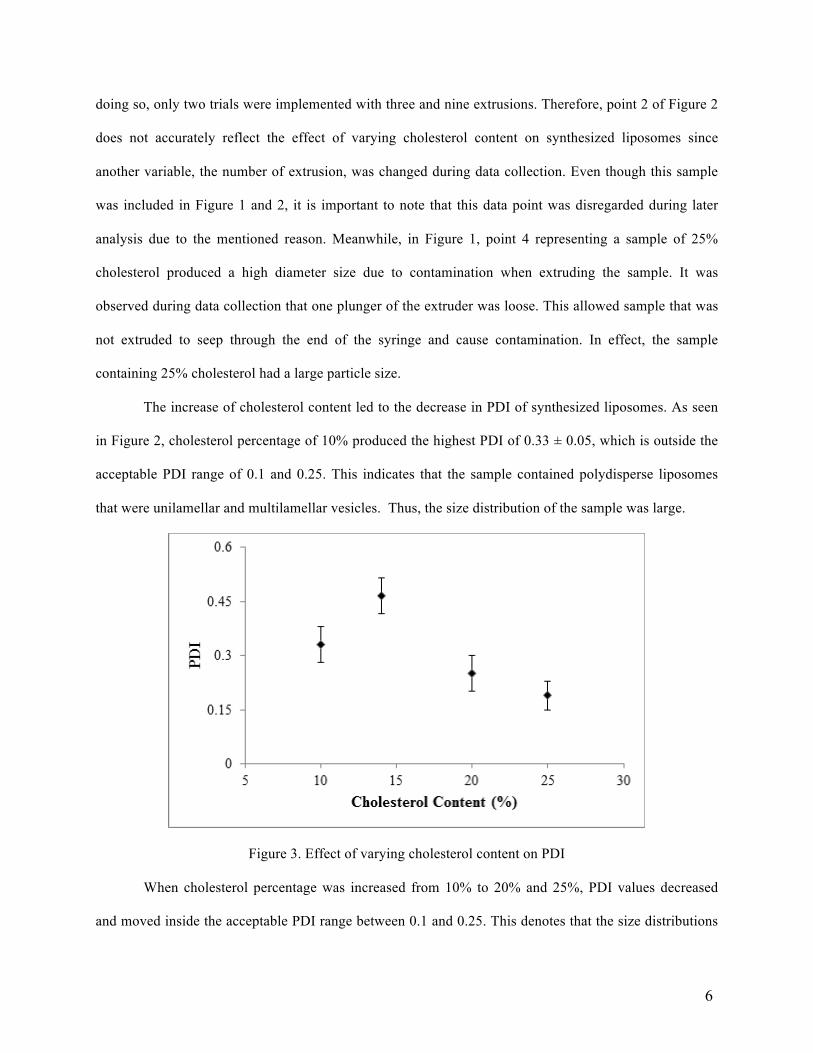
The increase of cholesterol content led to the decrease in PDI of synthesized liposomes. As seen
in Figure 2, cholesterol percentage of 10% produced the highest PDI of 0.33 ± 0.05, which is outside the
acceptable PDI range of 0.1 and 0.25. This indicates that the sample contained polydisperse liposomes
that were unilamellar and multilamellar vesicles. Thus, the size distribution of the sample was large.
Figure 3. Effect of varying cholesterol content on PDI When cholesterol percentage was increased from 10% to 20% and 25%, PDI values decreased
and moved inside the acceptable PDI range between 0.1 and 0.25. This denotes that the size distributions
7
of these two samples are narrow. A narrow size distribution illustrates that the increase in cholesterol
content stabilizes the structure of liposomes. This enables more liposomes which are LUVs to be
synthesized and thus, the size distribution within a sample becomes more uniform.
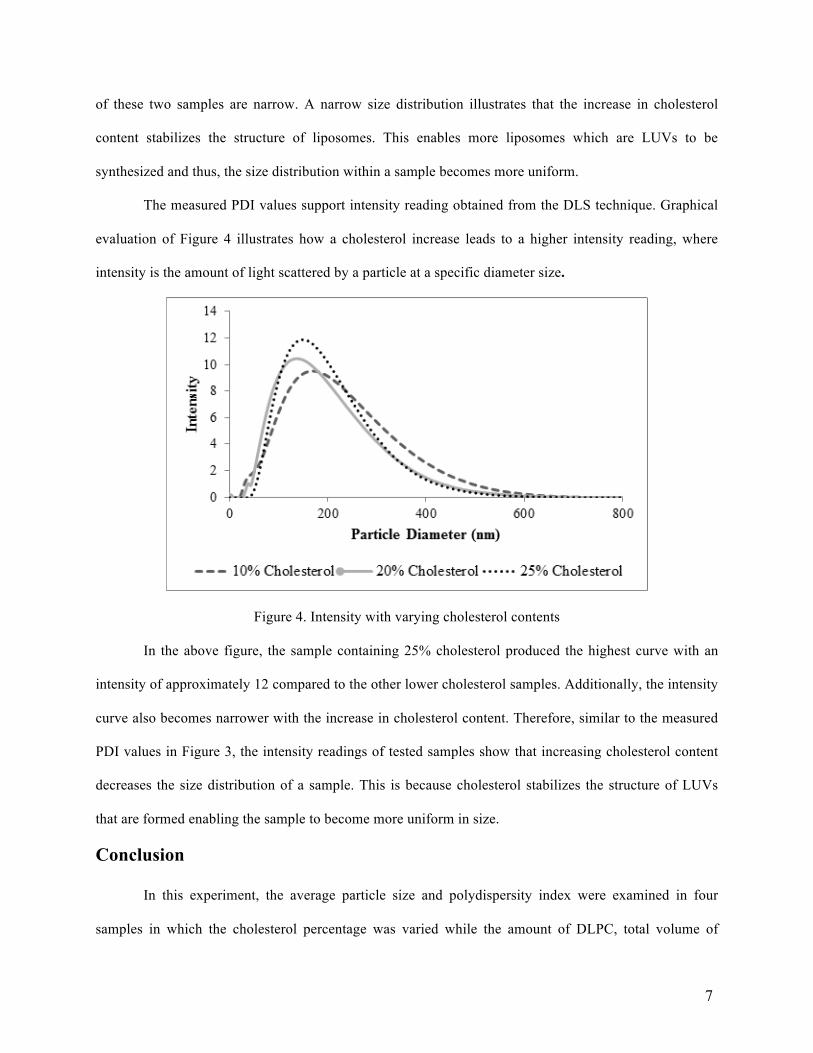
The measured PDI values support intensity reading obtained from the DLS technique. Graphical
evaluation of Figure 4 illustrates how a cholesterol increase leads to a higher intensity reading, where
intensity is the amount of light scattered by a particle at a specific diameter size.
Figure 4. Intensity with varying cholesterol contents In the above figure, the sample containing 25% cholesterol produced the highest curve with an
intensity of approximately 12 compared to the other lower cholesterol samples. Additionally, the intensity
curve also becomes narrower with the increase in cholesterol content. Therefore, similar to the measured
PDI values in Figure 3, the intensity readings of tested samples show that increasing cholesterol content
decreases the size distribution of a sample. This is because cholesterol stabilizes the structure of LUVs
that are formed enabling the sample to become more uniform in size.
Conclusion
In this experiment, the average particle size and polydispersity index were examined in four
samples in which the cholesterol percentage was varied while the amount of DLPC, total volume of
8
solution, and number of extrusions were kept constant. Results showed that the change in cholesterol had
an effect on the polydispersity index but no correlation with the size of the particles. The best results were
obtained with the lowest polydispersity index of 0.19 ± 0.04 and particle size of 140 ± 10 nm from the
solution with the highest cholesterol percentage tested, which was 25%. For future experiments the
number of extrusions could be varied in order to study its effect on size and size distribution.
References 1. Akbarzadeh A.; Davaran S.; Rezaei-Sadabady R.; et al. Liposome: classification, preparation, and applications. Nanoscale Research Letters 2013, 8(102), 1-9. 2. Gregoriadis G.; Perrie Y., Liposomes. Encyclopedia of Life Sciences 2010, 1-8. DOI: 10.1002/9780470015902.a0002656.pub2 3. Yang, D. R.; Pornpattananangkul, D.; Nakatsuji, T.; Chan, M.;Carson, D.; Huang, C. M.; Zhang, L., The antimicrobial activity of liposomal lauric acids against Propionibacterium acnes. Biomaterials 2009, 30, 6035-40. 4. Bahareh Sabeti, Mohamed Ibrahim Noordin, Shaharuddin Mohd, Rosnani Hashim, Afendi Dahlan, and Hamid Akbari Javar, “Development and Characterization of Liposomal Doxorubicin Hydrochloride with Palm Oil,” BioMed Research International, vol. 2014, Article ID 765426, 6 pages, 2014. doi:10.1155/2014/765426. 5. Bangham, A. D.; Horne, R. W. (1964). "Negative Staining of Phospholipids and Their Structural Modification by Surface-Active Agents As Observed in the Electron Microscope". Journal of Molecular Biology 8 (5): 660–668. 6. DYNAMIC LIGHT SCATTERING dynamic light scattering common terms defined. Inform White Paper. 2011;2015 (02/02):1-6. LS Instruments http://www.lsinstruments.ch/technology/dynamic_light_scattering_dls/.
9
Appendix
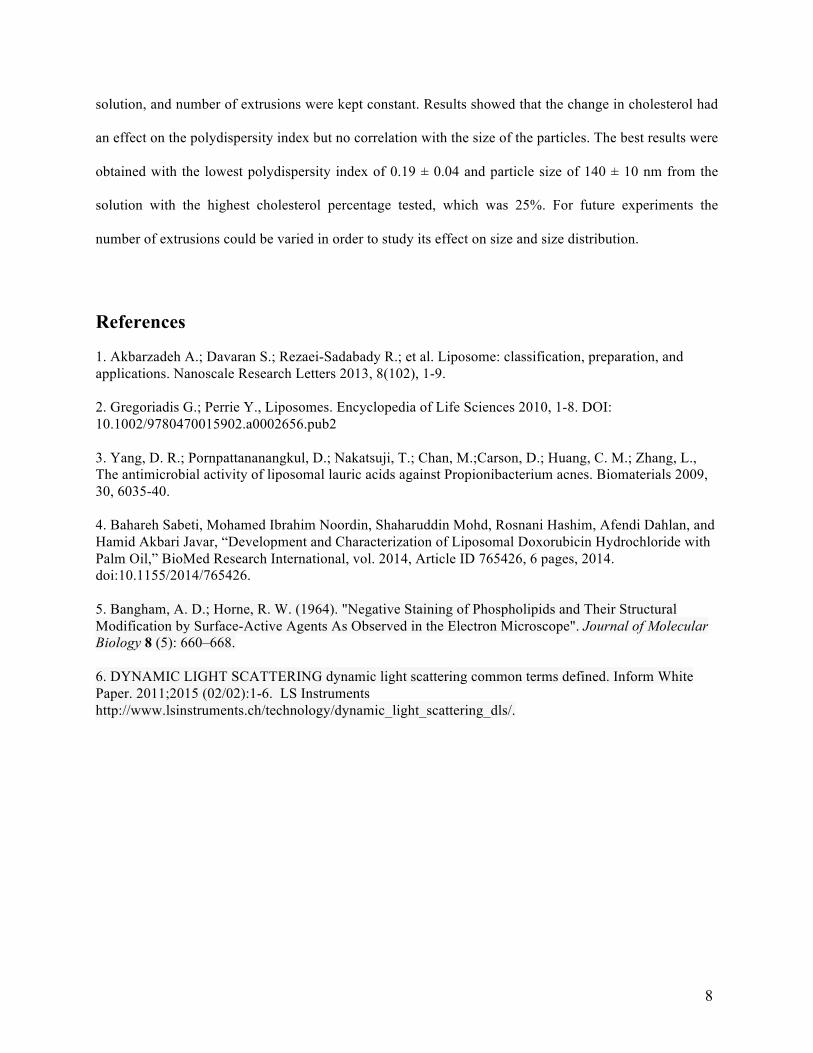
Concentration Sample 1 Sample 2 Sample 3 Sample 4 DLPC (µL) 450 450 450 450
Cholesterol (µL) 50 75 113 150 Chloroform (µL) 1525 1500 1463 1425
Volume (µL) 2025 2025 2025 2025 Cholesterol (%) 10 14.3 20 25
Cholesterol Content (%) Mean Diameter ± StDev (nm) PDI 10 132 ± 4 0.33 ± 0.05 20 118 ± 5 0.25 ± 0.05 25 140 ± 10 0.19 ± 0.04
Table 1. Concentrations of DLPC, cholesterol, and chloroform in the prepared samples. The concentration of DLPC was maintained at 2.25 mg/mL. The number of extrusion in all samples except Sample 2 was 11. The amount of solvent added after dehydration was 3 mL.
Table 2. Average particle diameter and PDI values from varying cholesterol contents.
4 March, 2015
TO: Professor L. Zhang, PhD
FROM: Group A-7
SUBJECT: Technical memorandum regarding reverse osmosis
Our group proposes to perform the reverse osmosis experiment. Reverse osmosis is a water
purification technology that has wide applications in areas such as drinking water production, and
waste remediation processes. The object of the experiment is to study the effect of pressure drop and
flow rate of inlet water on the performance of reverse osmosis system. The performance of the
reverse osmosis system is indicated by rejection coefficient and recovery under steady states. We will
perform experiments measuring those two parameters with one and two membranes reverse osmosis
system separately, with the varying parameters being the applied pressure, and flow rate. We
hypothesis that higher pressure drop would increase the performance of the system because higher
pressure drives the permeability of water through membrane. Also, two-membrane reverse osmosis
system would have an overall better performance. We will then design a reverse osmosis system with
retentate recycle, and compare its performance with design estimations generated from material
balance calculations. If you have any questions or concerns, please feel free to contact me.
Sincerely,
Hong Zhang