Embed Size (px)
Citation preview

AgendaSetupBenchmarkingProfilingTracingScripting

SetupHardwareLinux Kernel PrerequisitesBuilding User-space perfCross-compilingPermissions

HardwareHardware performance countersWorking PMU

Linux Kernel Prerequisites
$ uname -r # should be at least 3.7 4.7.1-1-ARCH $ zgrep PERF /proc/config.gz CONFIG_HAVE_PERF_EVENTS=y CONFIG_PERF_EVENTS=y CONFIG_HAVE_PERF_USER_STACK_DUMP=y CONFIG_HAVE_PERF_REGS=y ...

Building User-space perf
git clone -b milian/perf https://github.com/milianw/linux.git # or, once all my patches got accepted upstream, use: # git clone -b perf/core \ # git://git.kernel.org/pub/scm/linux/kernel/git/acme/linux
cd linux/tools/perf export CC=gcc # clang is not supported make

Dependencies
Auto-detecting system features: ... dwarf: [ on ] # for symbol resolution ... dwarf_getlocations: [ on ] # for symbol resolution ... glibc: [ on ] ... gtk2: [ on ] ... libaudit: [ on ] # for syscall tracing ... libbfd: [ on ] # for symbol resolution ... libelf: [ on ] # for symbol resolution ... libnuma: [ on ] ... numa_num_possible_cpus: [ on ] ... libperl: [ on ] # for perl bindings ... libpython: [ on ] # for python bindings ... libslang: [ on ] # for TUI ... libcrypto: [ on ] # for JITed probe points ... libunwind: [ on ] # for unwinding ... libdw-dwarf-unwind: [ on ] # for unwinding ... zlib: [ on ] ... lzma: [ on ] ... get_cpuid: [ on ] ... bpf: [ on ]

Cross-compiling
make prefix=somepath ARCH=arm64 CROSS_COMPILE=aarch64-linux-gnu-
Common pitfalls:
CC must not contain any flagsCFLAGS is ignored, use EXTRA_CFLAGSprefix path ignored for include and library pathsDependency issues:linux/tools/build/feature/test-$FEATURE.make.output

Permissions
#!/bin/bash sudo mount -o remount,mode=755 /sys/kernel/debug sudo mount -o remount,mode=755 /sys/kernel/debug/tracing echo "0" | sudo tee /proc/sys/kernel/kptr_restrict echo "-1" | sudo tee /proc/sys/kernel/perf_event_paranoid sudo chown root:tracing /sys/kernel/debug/tracing/uprobe_events sudo chmod g+rw /sys/kernel/debug/tracing/uprobe_events

BenchmarkingBe scientific!Take variance into accountCompare before/after measurements

perf stat
$ perf stat -r 5 -o baseline.txt -- ./ex_branches $ cat baseline.txt Performance counter stats for './ex_branches' (5 runs):
807.951072 task-clock:u (msec) # 0.999 CPUs utilized ( +- 1.97% ) 0 context-switches:u # 0.000 K/sec 0 cpu-migrations:u # 0.000 K/sec 520 page-faults:u # 0.643 K/sec ( +- 0.15% ) 2,487,366,239 cycles:u # 3.079 GHz ( +- 1.97% ) 1,484,737,283 instructions:u # 0.60 insn per cycle ( +- 0.00% ) 329,602,843 branches:u # 407.949 M/sec ( +- 0.00% ) 80,476,858 branch-misses:u # 24.42% of all branches ( +- 0.06% )
0.808952447 seconds time elapsed ( +- 1.97% )

Kernel vs. UserspaceUse event modifiers to separate domains:
$ perf stat -r 5 --event=cycles:{k,u} -- ./ex_qdatetime
Performance counter stats for './ex_qdatetime' (5 runs):
13,337,722 cycles:k ( +- 3.82% ) 9,745,474 cycles:u ( +- 1.58% )
0.008018321 seconds time elapsed ( +- 4.02% )
See man perf list for more.

perf list
$ perf list List of pre-defined events (to be used in -e):
branch-misses [Hardware event] cache-misses [Hardware event] cpu-cycles OR cycles [Hardware event] instructions [Hardware event] ref-cycles [Hardware event] ...
alignment-faults [Software event] context-switches OR cs [Software event] page-faults OR faults [Software event] ...
sched:sched_stat_sleep [Tracepoint event] sched:sched_stat_iowait [Tracepoint event] sched:sched_stat_runtime [Tracepoint event] ... syscalls:sys_enter_futex [Tracepoint event] syscalls:sys_exit_futex [Tracepoint event] ...

Qt TestLibCount cycles in QBENCHMARKs:
$ ./my_qt_benchmark -perf -iterations 100RESULT : BenchQDateTime::benchCurrentDateTime(): 25,346.54 CPU cycles per iteration (total: 2,534,654, iterations: 100)RESULT : BenchQDateTime::benchCurrentDateTimeUtc(): 777.86 CPU cycles per iteration (total: 77,786, iterations: 100)

Qt TestLibCount instructions:
$ ./my_qt_benchmark -perf -perfcounter instructions -iterations 100RESULT : BenchQDateTime::benchCurrentDateTime(): 62,836.76 instructions per iteration (total: 6,283,676, iterations: 100)RESULT : BenchQDateTime::benchCurrentDateTimeUtc(): 1,078.75 instructions per iteration (total: 107,876, iterations: 100)
Enable multiple perf event counters: codereview.qt-project.org/#/c/149580/

Qt TestLibAvailable performance counters:
$ ./my_qt_benchmark -perfcounterlist The following performance counters are available: alignment-faults [software] branch-instructions [hardware] branch-load-misses [cache] branch-loads [cache] branch-mispredicts [cache] branch-misses [hardware] branch-predicts [cache] branch-read-misses [cache] branch-reads [cache] branches [hardware] bus-cycles [hardware] cache-misses [hardware] cache-references [hardware] context-switches [software] cpu-clock [software] ...

ProfilingCPU profilingSleep-time profiling

perf topSystem-wide live profiling:
$ perf top Samples: 12K of event 'cycles:ppp', Event count (approx.): 5456372201 Overhead Shared Object Symbol 13.11% libQt5Core.so.5.7.0 [.] QHashData::nextNode 5.08% libQt5Core.so.5.7.0 [.] operator== 2.90% libQt5Core.so.5.7.0 [.] 0x000000000012f0d1 2.33% libQt5DBus.so.5.7.0 [.] 0x000000000002281f 1.62% libQt5DBus.so.5.7.0 [.] 0x0000000000022810 ...

Statistical ProfilingSampling the call stack is crucial!

Unwinding and Call Stacksframe pointers (fp)debug information (dwarf)Last Branch Record (lbr)

RecommendationOn embedded: enable frame pointersOn the desktop: rely on DWARFOn Intel: play with LBR

perf recordProfile new application and its children:
$ perf record --call-graph dwarf -- ./lab_mandelbrot -b 5 [ perf record: Woken up 256 times to write data ] [ perf record: Captured and wrote 64.174 MB perf.data (7963 samples) ]

perf recordAttach to running process:
$ perf record --call-graph dwarf --pid $(pidof ...) # wait for some time, then quit with CTRL + C [ perf record: Woken up 1 times to write data ] [ perf record: Captured and wrote 3.904 MB perf.data (70 samples) ]

perf recordProfile whole system for some time:
$ perf record -a -- sleep 5 [ perf record: Woken up 1 times to write data ] [ perf record: Captured and wrote 1.498 MB perf.data (2731 samples) ]

perf report

perf reportTop-down inclusive cost report:
$ perf report
Samples: 8K of event 'cycles:ppp', Event count (approx.): 8164367769 Children Self Command Shared Object Symbol - 93.67% 31.76% lab_mandelbrot lab_mandelbrot [.] main - 72.22% main + 28.42% hypot __hypot_finite 19.87% __muldc3 3.45% __muldc3@plt 2.19% cabs@plt + 1.85% QColor::rgb 1.61% QImage::width@plt 1.26% QImage::height@plt 0.97% QColor::fromHsvF + 0.90% QApplicationPrivate::init 0.66% QImage::setPixel + 21.44% _start + 83.34% 0.00% lab_mandelbrot libc-2.24.so [.] __libc_start_main + 83.33% 0.00% lab_mandelbrot lab_mandelbrot [.] _start ...

perf reportBottom-up self cost report:
$ perf report --no-children
Samples: 8K of event 'cycles:ppp', Event count (approx.): 8164367769 Overhead Command Shared Object Symbol - 31.76% lab_mandelbrot lab_mandelbrot [.] main - main - __libc_start_main _start - 23.31% lab_mandelbrot libm-2.24.so [.] __hypot_finite - __hypot_finite - 22.56% hypot main __libc_start_main _start - 23.04% lab_mandelbrot libgcc_s.so.1 [.] __muldc3 - __muldc3 + main - 5.90% lab_mandelbrot libm-2.24.so [.] hypot + hypot ...

perf reportShow file and line numbers:
$ perf report --no-children -s dso,sym,srcline
Samples: 8K of event 'cycles:ppp', Event count (approx.): 8164367769 Overhead Shared Object Symbol Source:Line - 7.82% lab_mandelbrot [.] main mandelbrot.h:41 + main - 7.79% libgcc_s.so.1 [.] __muldc3 libgcc2.c:1945 __muldc3 main __libc_start_main _start - 7.46% lab_mandelbrot [.] main complex:1326 - main + __libc_start_main - 6.94% libgcc_s.so.1 [.] __muldc3 libgcc2.c:1944 __muldc3 main __libc_start_main _start ...

perf reportShow file and line numbers in backtraces:
$ perf report --no-children -s dso,sym,srcline -g address
Samples: 8K of event 'cycles:ppp', Event count (approx.): 8164367769 Overhead Shared Object Symbol Source:Line - 7.82% lab_mandelbrot [.] main mandelbrot.h:41 - 2.84% main mandelbrot.h:41 __libc_start_main +241 _start +4194346 2.58% main mandelbrot.h:41 - 2.01% main mandelbrot.h:41 __libc_start_main +241 _start +4194346 - 7.79% libgcc_s.so.1 [.] __muldc3 libgcc2.c:1945 + 3.93% __muldc3 libgcc2.c:1945 + 3.72% __muldc3 libgcc2.c:1945 - 7.46% lab_mandelbrot [.] main complex:1326 - 4.65% main complex:1326 __libc_start_main +241 _start +4194346 2.81% main complex:1326 ...
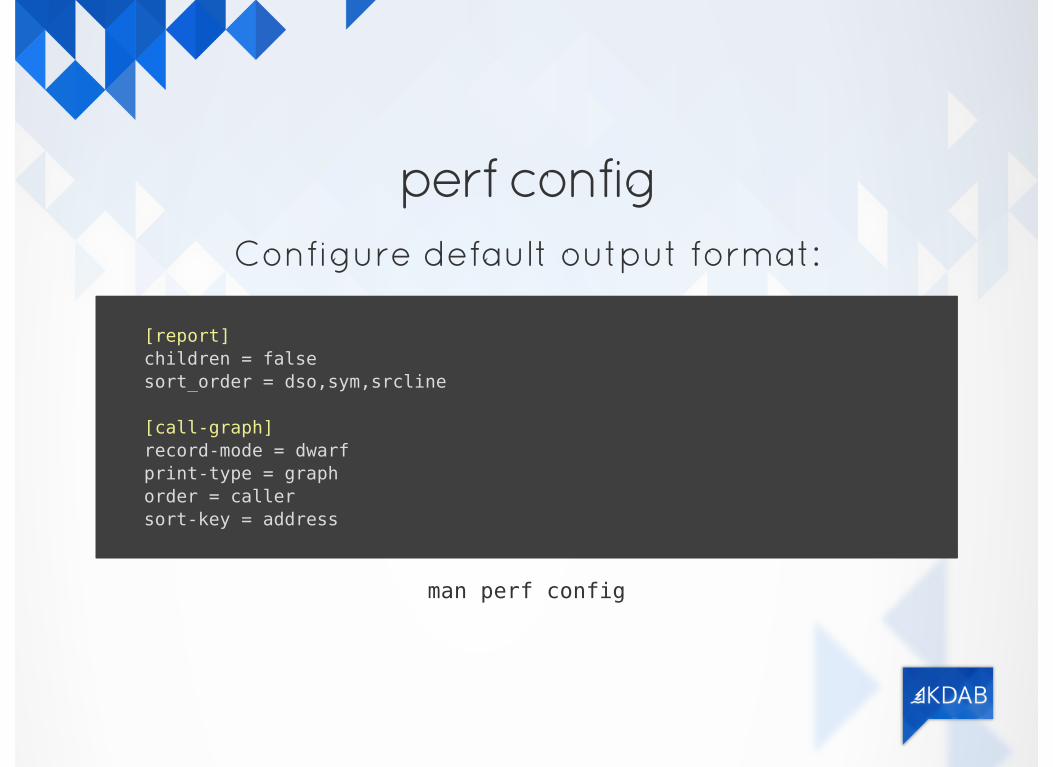
perf configConfigure default output format:
[report] children = false sort_order = dso,sym,srcline
[call-graph] record-mode = dwarf print-type = graph order = caller sort-key = address
man perf config

Flame Graphs
perf script report stackcollapse | flamegraph.pl > graph.svg
Flame Graph Search
_start
__hypot_finite__muldc3
__libc_start_main
hypotmain
c..
lab_mandelbrot

QML profiling

QML profilingJIT breaks backtraces:
$ perf record --call-graph dwarf -- qml fibonacci.qml $ perf report Failed to open /tmp/perf-22849.map, continuing without symbols Samples: 7K of event 'cycles:ppp', Event count (approx.): 7569496308 Overhead Shared Object Symbol - 12.42% libQt5Qml.so.5.7.0 [.] 0x00000000001a06ca - 6.44% 0x7fdf6db7d213 QV4::Runtime::callActivationProperty +117 - QV4::ExecutionContext::getPropertyAndBase +1281 - 3.54% QV4::QmlContextWrapper::get +85 QV4::Object::internalGet +173 0x1a06ca - 2.89% QV4::QmlContextWrapper::get +214 QV4::Object::internalGet +173 0x1a06ca - 5.98% 0x7fdf6db7d313 QV4::Runtime::callActivationProperty +117 - QV4::ExecutionContext::getPropertyAndBase +1281 + 3.41% QV4::QmlContextWrapper::get +85 + 2.57% QV4::QmlContextWrapper::get +214 ...

QML profilingLBR unwinder can break the JIT barrier:
$ perf record --call-graph lbr -- qml fibonacci.qml $ perf report Failed to open /tmp/perf-22849.map, continuing without symbols Samples: 7K of event 'cycles:ppp', Event count (approx.): 7410334159 Overhead Shared Object Symbol - 11.87% libQt5Qml.so.5.7.0 [.] 0x00000000001a06ca - 2.98% 0x7fa5f71d7310 - 1.87% QV4::Runtime::callActivationProperty +287 - 0x1c1618 - 1.64% 0x7fa5f71d7210 - 0.89% QV4::Runtime::callActivationProperty +112 QV4::ExecutionContext::getPropertyAndBase +1278 - 0.75% QV4::Runtime::callActivationProperty +287 - 0x1c1618 - 0.58% 0x7fa5f71d7210 - 0.53% QV4::Runtime::callActivationProperty +112 QV4::ExecutionContext::getPropertyAndBase +127 + 1.10% QV4::Runtime::callActivationProperty +112 + 2.15% QV4::Runtime::callActivationProperty +287 ...

QML profilingAnnotate the QML symbols:
$ QV4_PROFILE_WRITE_PERF_MAP=1 perf record --call-graph lbr -- qml myapp.qml $ perf report
Samples: 7K of event 'cycles:ppp', Event count (approx.): 7490988495 Overhead Shared Object Symbol - 12.08% libQt5Qml.so.5.7.0 [.] 0x00000000001a06ca - 3.58% fibonacci +656 - 2.05% QV4::Runtime::callActivationProperty +287 - 0x1c1618 - 1.71% fibonacci +400 - 1.04% QV4::Runtime::callActivationProperty +112 - QV4::ExecutionContext::getPropertyAndBase +1278 - 0.62% QV4::QmlContextWrapper::get +82 QV4::Object::internalGet +168 0x1a0670 - 0.67% QV4::Runtime::callActivationProperty +287 - 0x1c1618 0.60% fibonacci +400 + 1.53% QV4::Runtime::callActivationProperty +112

On-CPU vs. Off-CPUPMU events are only measured
while application is running.
How to measure sleep and IO time?

Scheduler Statistics
perf list sched_stat
List of pre-defined events (to be used in -e):
sched:sched_stat_blocked [Tracepoint event] sched:sched_stat_iowait [Tracepoint event] sched:sched_stat_runtime [Tracepoint event] sched:sched_stat_sleep [Tracepoint event] sched:sched_stat_wait [Tracepoint event]

Sleep-time Profiling
#!/bin/bash
echo 1 | sudo tee /proc/sys/kernel/sched_schedstats
perf record \ --event sched:sched_stat_sleep/call-graph=fp/ \ --event sched:sched_process_exit/call-graph=fp/ \ --event sched:sched_switch/call-graph=dwarf/ \ --output perf.data.raw $@
echo 0 | sudo tee /proc/sys/kernel/sched_schedstats
perf inject --sched-stat --input perf.data.raw --output perf.data

Sleep-time Profiling
$ perf-sleep-record ./ex_sleep $ perf report
Samples: 24 of event 'sched:sched_switch', Event count (approx.): 8883195296 Overhead Trace output - 100.00% ex_sleep:24938 [120] S ==> swapper/7:0 [120] - 90.07% main main.cpp:10 QThread::sleep +11 0x1521ed __nanosleep .:0 entry_SYSCALL_64_fastpath entry_64.o:0 sys_nanosleep +18446744071576748154 hrtimer_nanosleep +18446744071576748225 do_nanosleep hrtimer.c:0 schedule +18446744071576748092 __schedule core.c:0 + 9.02% main main.cpp:11 + 0.91% main main.cpp:6

Cross-machine ReportingWhen recording machine has symbols available:
# on first machine: $ perf record ... $ perf archive Now please run:
$ tar xvf perf.data.tar.bz2 -C ~/.debug
wherever you need to run 'perf report' on.
# on second machine: $ rsync machine1:path/to/perf.data{,tar.bz2} . $ tar xf perf.data.tar.bz2 -C ~/.debug $ perf report

Cross-machine ReportingWhen reporting machine has symbols available:
# on first machine: $ perf record ...
# on second machine: $ rsync machine1:path/to/perf.data . $ perf report --symfs /path/to/sysroot

TracingSyscallsKernel EventsUser Defined Tracepoints

perf top (again)Count syscalls per application
$ perf top -e raw_syscalls:sys_enter -m 50M -s comm --show-nr-samples Samples: 2M of event 'raw_syscalls:sys_enter', Event count (ca.): 1101332 Overhead Samples Command 32.14% 353935 Xorg 27.25% 300076 skype 21.05% 231800 QXcbEventReader 6.46% 71178 plasmashell 2.65% 29135 owncloud 1.70% 18680 baloo_file_extr 1.48% 16260 kwin_x11 0.93% 10237 yakuake 0.75% 8259 kate 0.71% 7861 kmail 0.70% 7759 cc1plus 0.63% 6909 iceccd 0.63% 6885 g++

perf traceFind slow syscalls:
$ perf trace --duration=100 767.271 (18446744073709.457 ms): mysqld/3321 poll(ufds: 0x7ff1f791bab0, nfds: 777.559 (674.075 ms): kded5/1870 poll(ufds: 0x241c940, nfds: 12, timeout_msecs: 778.634 (766.826 ms): plasmashell/1914 poll(ufds: 0x4368550, nfds: 10, timeout_msecs: 779.100 (266.541 ms): owncloud/1958 poll(ufds: 0x1146720, nfds: 5, timeout_msecs: 777.678 (263.587 ms): kate/5107 poll(ufds: 0x57737e0, nfds: 17, timeout_msecs: 791.292 (142.024 ms): mysqld/2324 futex(uaddr: 0x7ff205bc411c, op: WAIT|PRIV, val: 813.918 (500.537 ms): chromium/2586 poll(ufds: 0x36fe3ccca1e0, nfds: 4, timeout_msecs: 823.785 (500.079 ms): mysqld/2252 io_getevents(ctx_id: 140677674254336, min_nr: 892.293 (349.913 ms): chromium/29754 futex(uaddr: 0x7ffcba137794, op: WAIT_BITSET|PRIV, val: 931.227 (18446744073709.219 ms): mysqld/3321 poll(ufds: 0x7ff1f791bab0, nfds: 940.429 (500.080 ms): mysqld/2244 io_getevents(ctx_id: 140677674315776, min_nr: 940.600 (139.214 ms): mysqld/2324 futex(uaddr: 0x7ff205bc411c, op: WAIT|PRIV, val: 994.984 (500.126 ms): mysqld/2253 io_getevents(ctx_id: 140677674233856, min_nr: ...

perf traceAggregated syscall overhead:
$ perf trace -s -- ./lab_mandelbrot_concurrent -b
...
lab_mandelbrot_ (1594), 9174 events, 25.7%
syscall calls total min avg max stddev (msec) (msec) (msec) (msec) (%) --------------- -------- --------- --------- --------- --------- ------ futex 1104 7529.412 0.001 6.820 1494.748 41.56% clone 162 29.729 0.160 0.184 0.358 1.15% mprotect 397 2.239 0.002 0.006 0.047 4.41% mmap 475 1.895 0.002 0.004 0.016 1.59% open 445 1.382 0.001 0.003 0.018 2.25% poll 178 1.291 0.001 0.007 0.433 45.09% writev 165 0.940 0.001 0.006 0.407 43.54% stat 497 0.914 0.001 0.002 0.010 2.56% munmap 43 0.612 0.003 0.014 0.167 29.02% read 169 0.436 0.001 0.003 0.040 14.05%

perf traceProfile time spent in syscalls with backtraces:
$ perf trace record --call-graph dwarf -o perf.raw.data -- \ ./lab_mandelbrot_concurrent -b 5 $ perf inject --trace -i perf.raw.data -o perf.data $ perf report Samples: 16K of event 'raw_syscalls:sys_enter', Event count: 285504696458 Overhead Trace output - 77.61% NR 202 (7ffd1fe2fdc0, 80, 3, 0, 0, 0) __clone .:0 start_thread pthread_create.c:0 0xacd78 0xa901f QtConcurrent::RunFunctionTask::run qtconcurrentstoredfunctioncall.h:679 (anonymous namespace)::firstPassMandelbrotRow qmutex.h:138 QMutex::lock +71 QBasicMutex::lockInternal +53 syscall +25 ...
perf inject: Make it possible to merge sys_enter/exit events

perf timechartVisualize scheduling of processes:
$ perf timechart record -- sleep 5 [ perf record: Woken up 1 times to write data ] [ perf record: Captured and wrote 2.093 MB perf.data (5852 samples) ] $ perf timechart Written 5.0 seconds of trace to output.svg.

perf timechart

ScriptingInspecting DataGenerating ScriptsExample Scripts

perf scriptOutput raw data stream:
$ perf record --call-graph dwarf -- ... $ perf script ... lab_mandelbrot 28224 13656.319122: 995647 cycles:ppp: 403a8a _start+0x2a (/ssd/milian/projects/kdab/training-material/addon/profiling/build/lab_mandelbrot/src/lab_mandelbrot) 7f8a88e1c291 __libc_start_main+0xf1 (/usr/lib/libc-2.24.so) 40307a main+0x4a (/ssd/milian/projects/kdab/training-material/addon/profiling/build/lab_mandelbrot/src/lab_mandelbrot) 7f8a8ae39ae9 QApplicationPrivate::init+0x9 (/usr/lib/libQt5Widgets.so.5.7.0 7f8a8a69e7af QGuiApplicationPrivate::init+0x2f (/usr/lib/libQt5Gui.so.5.7.0 7f8a8a15b3bf QCoreApplicationPrivate::init+0xaaf (/usr/lib/libQt5Core.so.5.7 7f8a8a69cced QGuiApplicationPrivate::createEventDispatcher+0x2d (/usr/lib/libQt5Gui.so. 7f8a8a69c252 QGuiApplicationPrivate::createPlatformIntegration +0x5c2 (/usr/lib/libQt5Gui.so. 7f8a8a68e01f QPlatformIntegrationFactory::create+0xef (/usr/lib/libQt5Gui.so. 7f8a8a13f9c2 QFactoryLoader::instance+0x112 (/usr/lib/libQt5Core.so.5.7.0) ...

perf scriptPython bindings:
$ perf record --event=syscalls:sys_{enter,exit}_nanosleep \ --call-graph dwarf ./ex_sleep $ perf script -g python generated Python script: perf-script.py $ perf script -s ./perf-script.py
in trace_begin
syscalls__sys_enter_nanosleep 1 27967.765309546 28821 ex_sleep __syscall_nr= [4009da] _start [7f73e75a4291] __libc_start_main [40095e] main [7f73e87020cb] QThread::sleep [7f73e87a81ed] [7f73e81d5780] __nanosleep
...
in trace_end

perf scriptGenerated Python script:
...def trace_begin(): print "in trace_begin"
def trace_end(): print "in trace_end"
def syscalls__sys_exit_nanosleep(event_name, context, common_cpu, ...): print_header(event_name, common_cpu, common_secs, ...) print "__syscall_nr=%d, ret=%d" % (__syscall_nr, ret) for node in common_callchain: if 'sym' in node: print "\t[%x] %s" % (node['ip'], node['sym']['name']) else: print " [%x]" % (node['ip']) print "\n"
def syscalls__sys_enter_nanosleep(event_name, context, common_cpu, ...): ...

perf scriptConvert perf.data to callgrind format:
$ perf record --call-graph dwarf ... $ perf script report callgrind > perf.callgrind $ kcachegrind perf.callgrind
github.com/milianw/linux/.../callgrind.py

perf scriptConvert perf.data to callgrind format:

Questions?
[email protected]://www.kdab.com
We offer trainings and workshopsDebugging and Profiling
github.com/milianw/linux/tree/milian/perf
git clone -b milian/perf https://github.com/milianw/linux.git