Embed Size (px)
Citation preview
ORIGINAL ARTICLE
Links between viruses and prokaryotes throughoutthe water column along a North Atlantic latitudinaltransect
Daniele De Corte1,2, Eva Sintes3, Taichi Yokokawa1,3,4, Thomas Reinthaler3 andGerhard J Herndl1,3
1Department of Biological Oceanography, Royal Netherlands Institute for Sea Research (NIOZ), Den Burg,The Netherlands; 2Center for Ecological and Evolutionary Studies, University of Groningen, Groningen,The Netherlands and 3Department Marine Biology, Faculty Center of Ecology, University of Vienna,Vienna, Austria
Viruses are an abundant, diverse and dynamic component of marine ecosystems and have a key rolein the biogeochemical processes of the ocean by controlling prokaryotic and phytoplanktonabundance and diversity. However, most of the studies on virus–prokaryote interactions in marineenvironments have been performed in nearshore waters. To assess potential variations in therelation between viruses and prokaryotes in different oceanographic provinces, we determined viraland prokaryotic abundance and production throughout the water column along a latitudinal transectin the North Atlantic. Depth-related trends in prokaryotic and viral abundance (both decreasing byone order of magnitude from epi- to abyssopelagic waters), and prokaryotic production (decreasingby three orders of magnitude) were observed along the latitudinal transect. The virus-to-prokaryoteratio (VPR) increased from B19 in epipelagic to B53 in the bathy- and abyssopelagic waters.Although the lytic viral production decreased significantly with depth, the lysogenic viral productiondid not vary with depth. In bathypelagic waters, pronounced differences in prokaryotic and viralabundance were found among different oceanic provinces with lower leucine incorporation ratesand higher VPRs in the North Atlantic Gyre province than in the provinces further north and south.The percentage of lysogeny increased from subpolar regions toward the more oligotrophic lowerlatitudes. Based on the observed trends over this latitudinal transect, we conclude that the viral–host interactions significantly change among different oceanic provinces in response to changes inthe biotic and abiotic variables.The ISME Journal advance online publication, 19 January 2012; doi:10.1038/ismej.2011.214Subject Category: microbial ecology and functional diversity of natural habitatsKeywords: virus-like particles; prokaryotes; bacteria; North Atlantic Ocean; flow cytometry; DISTML
Introduction
Viruses are abundant, diverse and dynamic compo-nents in marine ecosystems (Sano et al., 2004; Anglyet al., 2006; Parada et al., 2007; De Corte et al., 2010).Viral lysis is a key factor in the biogeochemicalcycles as it leads to the release of intracellularmaterial from the host cells, stimulating dissolvedorganic matter cycling (Middelboe and Lyck, 2002;Middelboe et al., 2003; Middelboe and Jørgensen,2006). Moreover, viruses control prokaryotic andphytoplankton mortality and might help main-taining microbial diversity (Bratbak et al., 1993;
Thingstad and Lignell, 1997; Winter et al., 2005;Breitbart et al., 2008).
There are two main viral life strategies, thelysogenic and the lytic cycle (Weinbauer et al.,2003). The prevalence of one over the other dependson the environmental conditions. Lysogeny isconsidered an adaptation to oligotrophic conditions,with low host abundance and activity (Weinbauerand Suttle, 1999; Williamson et al., 2002), whilethe lytic cycle is considered to be dominant inhighly productive regions (Weinbauer et al., 2003).Changing trophic conditions lead to changes inthe prokaryotic community composition andconsequently, to altered virus–host interactions(Weinbauer et al., 1993).
Several studies have examined the prokaryotic(Bacteria and Archaea) abundance and diversityalong large-scale oceanographic gradients (Pommieret al., 2007; Varela et al., 2008; Schattenhofer et al.,2009). In contrast, very little information is availableon global patterns of viral abundance across different
Received 18 August 2011; revised 13 December 2011; accepted 14December 2011
Correspondence: GJ Herndl, Department Marine Biology, FacultyCenter of Ecology, University of Vienna, Althanstrasse 14, Vienna1090, Austria.E-mail: [email protected] address: Center for Marine Environmental Studies(CMES), Ehime University, Bunkyo 3, Ehime 790-8577, Japan.
The ISME Journal (2012), 1–12& 2012 International Society for Microbial Ecology All rights reserved 1751-7362/12
www.nature.com/ismej

oceanic regions. Also, the biogeographic distributionof viral diversity is largely unknown. Until now, onlyone study, using a metagenomic approach, investi-gated the viral diversity over different oceanicprovinces (Angly et al., 2006). This study revealeda high global viral diversity with consistent differ-ences among different latitudes (Angly et al., 2006).
Although several variables might influence thedistribution of viruses on the micro- to large-scale,the availability of suitable hosts is ultimately thecrucial factor controlling viral proliferation. Thus,the variability within viral communities should behighly related to changes in host metabolic abun-dance, activity and diversity. All of these prokar-yotic parameters, in turn, depend on abiotic andbiotic variables such as nutrient availability andgrazing pressure (Middelboe, 2000).
The aim of this study was to investigate the mainfactors controlling viral abundance, production andthe distribution of different viral sub-populations, asrevealed by flow cytometry, along a latitudinaltransect over four North Atlantic oceanic provincesthroughout the entire water column ranging from theepi- to the abyssopelagic layers. The virus–prokar-yote interactions, the viral life strategies and the hostspecificity of viruses might be fundamentally differ-ent between different oceanographic provinces anddepth layers as are the overall trophic conditions. Weused the distance-based multivariate analysis for alinear model using forward selection (DISTLMforward) to identify the best set of environmentalparameters explaining the variations in viral abun-dance, production and contribution of different viralsub-populations to the viral communities in fouroceanic provinces of the North Atlantic.
Materials and methods
Study area and samplingWater samples were obtained from 24 depthlayers at 33 stations during the research cruisesGEOTRACES-1 and -2 (April–July 2010) in theNorth Atlantic with R/V Pelagia (Figure 1) from fivedifferent pelagic zones: upper epipelagic (10–75 m),lower epipelagic (75–200 m), mesopelagic (200–1000 m), upper bathypelagic (1000–2500 m), subse-quently termed bathypelagic, and the layer between2500 and 6000 m (thus, lower bathypelagic plusabyssopelagic) indicated below by the term ‘abysso-pelagic’ for the sake of clarity. The samples werecollected in four different oceanic provinces basedon the classification scheme of ecological regions inthe ocean (Longhurst, 1998). Samples were taken inthe North Atlantic Arctic province (ARCT; 701N–551N), the North Atlantic Drift province (NADR;551N–401N), the North Atlantic Gyral province(NAG) comprising the North Atlantic Tropical andSubtropical Gyral province (401N–121N), and theWestern Tropical Atlantic (WTRA; 121N–121S) pro-vince (Figure 1). Sampling was performed with a
CTD (conductivity-temperature-depth; Seabird, Bel-levue, WA, USA) rosette sampler equipped with 2425-l Niskin bottles and sensors for chlorophyllfluorescence, turbidity, photosynthetic active radia-tion and oxygen. The apparent oxygen utilizationwas calculated in Ocean Data View (ODV version4.3.7, Schlitzer, 2002) as the difference between theO2 saturation at a given temperature and salinity andthe actual O2 concentration measured at this stationand depth (Pytkowicz, 1971).
Prokaryotic and viral abundanceSamples for prokaryotic and viral abundance werecollected at all the 33 stations and at all 24 depthlayers at each station. Flow cytometric enumerationof viruses and prokaryotes was used as a fast andreliable method resulting in similar viral andprokaryotic abundances as determined by epifluor-escence microscopy (Del Giorgio et al., 1996; Marieet al., 1999; Brussaard, 2004).
The prokaryotic abundance was determined usingstandard procedures (Del Giorgio et al., 1996;
70 W 60 W 50 W 40 W 30 W 20 W
EQ
20 N
40 N
60 N
1 2
3 4
5
6 7
8 9
10
11 12
13 14
15 16
17 18 19 20
21 22
23
24 25
26 27
28 29
30 31
32 33
Oce
an D
ata
Vie
w
ARCT
NADR
NAG
WTRA
North America
South America
Greenland
Figure 1 Cruise track and sampling stations (indicated by dots)occupied during the GEOTRACES research expeditions-1 and -2between April and July 2010. ARCT (701N–551N), NADR (551N–401N), NAG (401N–121N), WTRA (121N–121S). Bold horizontallines denote borders between oceanic provinces following thedescription given in Longhurst (1998).
Viruses and prokaryotes along a latitudinal transectD De Corte et al
2
The ISME Journal

Brussaard, 2004) with modification. Briefly, 2 mlsamples were fixed with glutaraldehyde (0.5% finalconcentration), shock-frozen in liquid N2 and keptat �80 1C until analysis. Samples were thawed toroom temperature and 0.5 ml subsamples stainedwith SYBR Green I (Molecular Probes, Invitrogen,Carlsbad, CA, USA) in the dark for 10 min. Theprokaryotes were enumerated on a FACSAria II flowcytometer (Becton Dickinson, Franklin Lakes, NJ,USA) by their signature in a plot of green fluores-cence versus side scatter.
Viral abundance was measured by flow cytometryafter SYBR Green I staining (Brussaard, 2004).Briefly, 2 ml samples were fixed with glutaraldehyde(0.5% final concentration), held at 4 1C for 10–30 min,frozen in liquid N2 and subsequently, storedat �80 1C until analysis. Before analysis, sampleswere thawed and 0.5 ml subsamples stained in thedark with SYBR Green I (Molecular Probes) at a finalconcentration of 0.5� of the manufacturer’s stocksolution at 80 1C for 10 min. Viruses were enumeratedon a FACSAria II flow cytometer (Becton Dickinson)as described above for prokaryotic abundance.
Depending on their respective signature in thecytogram of green fluorescence versus side scatter,two different prokaryotic populations (high and lownucleic acid content prokaryotes) and three differentviral populations (high-, medium- and low-fluores-cence viruses) were discriminated (SupplementaryFigure S1).
Leucine incorporation into heterotrophic prokaryotesas a measure of prokaryotic productionSamples to measure leucine incorporation intoheterotrophic prokaryotes were collected at 27stations at seven selected depths distributed overthe five oceanic provinces described above. Addi-tionally, leucine incorporation rates were deter-mined at all the sampled 24 depth layers at fivestations (Sts 5, 8, 14, 20 and 33). Triplicatesubsamples (1.5 ml) and one trichloroacetic acid(TCA) killed blank were dispensed into screw-capped centrifuge vials (Scientific System Inc.,VWR, Radnor, PA, USA, 2.0 ml screw tube),amended with 5 nmol l�1 (final concentration) of[3H]-leucine (product #: ART 0840, American Radi-olabeled Chemicals Inc., St Louis, MO, USA) andincubated at in situ temperature (±1 1C) in the darkfor 1 h (samples from 0 to 200 m depth) or for 24 h(samples from 250 to 6000 m) following the protocolof Smith and Azam (1992). A concentration of5 nmol l�1 final concentration of [3H]-leucine addi-tions resulted in heterotrophic prokaryotic produc-tion estimates not significantly different from10 nmol l�1 [3H]-leucine additions hence, 5 nmol l�1
[3H]-leucine additions were considered as saturatingconcentrations for prokaryotic production measure-ments (data not shown). The incubations wereterminated by adding TCA (final concentration5%). Thereafter, the samples were centrifuged at
18 000 g for 10 min and the supernatant siphoned off.The pellet was resuspended in TCA (5%), centri-fuged again for 10 min and the TCA discarded andfinally, an ethanol rinse (80%, ice-cold) was applied.One ml of Ultima-GOLD (Perkin Elmer, Waltham,MA, USA) scintillation cocktail was added to thepellet after siphoning off the ethanol. The radio-activity was measured in a liquid scintillationcounter (Tri-Carb 3100TR, Perkin Elmer). Quenchingwas corrected using an external standard channelratio. The disintegrations per minute of the TCA-killed blank were subtracted from the averagedisintegrations per minute of the samples, and theresulting disintegrations per minute converted toleucine incorporation rates. The cell-specific leucineincorporation rate was calculated by dividing thebulk leucine incorporation rates by the prokaryoticabundance (Kirchman, 2002).
Viral productionViral (lytic and lysogenic) production was measuredby the dilution approach (Wilhelm et al., 2002)covering the different oceanic provinces and depthlayers (Table 1). Lytic and lysogenic viral produc-tions (VPs) were determined at 18 samples originat-ing from eight stations. Per sample, 50 ml of theprokaryotic concentrate obtained by 0.2mm tangen-tial-flow filtration (Vivascience, Sartorius StedimBiotech, Aubagne Cedex, France) was added to450 ml of virus-free filtrate produced from the samewater sample using a 30 kDa molecular weight cut-off tangential-flow filtration (Vivascience). Thisapproach resulted in a prokaryotic abundancesimilar to in situ abundance. The experiments wereperformed in triplicate at in situ temperature in thedark with and without the addition of mitomycin C(final concentration 1mg ml�1; SIGMA, St Louis, MO,USA) (Ortmann et al., 2002). Mitomycin C wasadded to induce the lytic cycle of lysogenic viruses.Subsamples were taken to enumerate prokaryotesand viruses at 4- to 6-h intervals over a time span of72 h. VP was calculated as the slope of a first orderregression line of viral abundance versus incubationtime for the samples showing a single peak in viralabundance (Wilhelm et al., 2002).
The lytic VP was obtained from incubationswithout mitomycin C added. Lysogenic VP repre-sents the difference between the VP obtained in themitomycin C-treated samples and the VP in thetreatments without mitomycin C.
Estimation of other variables measured during the VPexperimentsNet prokaryotic production (NPP) was determinedfrom the changes in cell abundance over thesampling period using the formula:
NPP ¼ P1 � P0
T1 � T0
� �
Viruses and prokaryotes along a latitudinal transectD De Corte et al
3
The ISME Journal
where P1 and P0¼prokaryotic abundance at the endand the beginning of the experiment, respectively,T1�T0¼ time difference in days between the endand the beginning of the experiment, that is, theduration of the experiment (Ortmann et al., 2002).
Prokaryotic turnover time (PTT) was calculatedusing the formula from Parada et al. (2008):
PTT ¼ 1
NPPP0
� �
Viral turnover time (VTT) was calculated using theformula:
VTT ¼ 1
VPV0
� �
where VP is the VP and V0 is the viral abundance atthe beginning of the experiment (Parada et al., 2008;De Corte et al., 2010).
Statistical analysisSpearman rank correlation was performed to ana-lyze the relations between several measured para-meters. Regression analysis was used to predict therelationship between the log transformed viral andprokaryotic abundance and production versus tem-perature and depth (independent variables). Ana-lysis of variance (ANOVA on rank) was performed totest possible differences among depth layers and, ifsignificant differences were observed, the post hocDunn’s test was also performed.
The distance-based multivariate analysis for alinear model using forward selection (DISTLM for-ward) was applied to test the relationships betweenviral abundance and biotic and abiotic environ-mental parameters (Anderson et al., 2004).
Results
Physical and chemical variables of the water columnThe physical characteristics and the apparentoxygen utilization of the different depth layers ofthe oceanic provinces sampled are given in Supple-mentary Table S1. Temperature significantly de-creased over the entire transect from the epipelagic(mean±s.d.: 20.2±8.2 1C) to the abyssopelagic layer(2.2±0.2 1C; ANOVA on rank, Po0.001, post hocDunno’s test, Po0.05). The highest temperature inthe epipelagic layers was measured in the WTRA(28.3±0.7 1C) followed by the NAG (24.2±4.1 1C),NADR (11.8±3.6 1C) and ARCT (5.7±0.7 1C). Thehighest temperature in the lower epi- and mesope-lagic waters was found in the NAG (20.9±3.2 1C).The temperature in the bathy- and abyssopelagiclayers did not reveal pronounced latitudinal varia-tions, albeit in the ARCT, the temperature wasslightly lower than in the other provinces (Supple-mentary Table S1).
The salinity significantly decreased from thelower epi- to the abyssopelagic layers in all theT
able
1V
iral
para
mete
rsd
ete
rmin
edat
sele
cte
dS
Ts
an
dd
ep
ths
du
rin
gth
eG
EO
TR
AC
ES
exp
ed
itio
n
ST
Lati
tud
e(1
N)
Dep
th(m
)T
em
p(1
C)
Tota
lly
tic
VP
(�
10
5m
l�1d
ay�
1)
VP
Hig
h(�
10
5m
l�1d
ay�
1)
VP
Med
ium
(�10
5m
l�1d
ay�
1)
VP
Low
(�
10
5m
l�1d
ay�
1)
%V
Ph
igh
%V
Pm
ed
ium
%V
Plo
wLy
sogen
icV
P(�
10
5m
l�1d
ay�
1)
%Ly
sogen
icV
PV
TT
(day)
NP
P(�
10
5m
l�1d
ay�
1)
PT
T(d
ay)
458.6
050
7.0
18.2
4.2
13.2
0.9
23.1
72.2
4.8
ND
ND
2.3
0.4
72.9
84
58.6
0600
4.0
5.1
0.9
3.5
0.6
18.3
69.6
12.1
6.9
57.7
2.4
0.0
69.1
24
58.6
01750
2.0
1.8
0.2
1.1
0.5
11.4
59.8
28.8
1.3
43.0
4.4
0.1
31.4
57
49.7
375
10.0
6.4
1.3
5.0
0.1
19.7
78.3
2.0
1.3
16.8
5.1
0.4
45.3
77
49.7
3600
4.0
1.8
0.2
1.5
0.1
8.3
84.0
7.7
2.9
61.5
5.2
0.0
121.3
57
49.7
32500
2.0
0.7
0.1
0.6
0.1
10.0
79.7
10.2
4.5
86.4
11.4
ND
ND
12
37.5
575
15.0
25.1
1.7
15.6
7.7
6.7
62.4
30.9
ND
ND
2.2
1.1
91.2
712
37.5
5750
4.0
3.1
0.2
1.5
1.4
6.1
48.4
45.5
38.3
92.5
5.3
0.3
20.6
012
37.5
54500
2.0
0.5
0.1
0.2
0.3
12.3
38.6
49.1
0.6
53.3
15.9
ND
ND
17
29.6
250
26.0
29.3
0.6
14.3
14.3
2.1
49.0
48.9
ND
ND
1.4
0.8
60.8
417
29.6
2500
15.0
3.5
0.6
1.5
1.4
17.1
43.5
39.4
11.4
76.7
2.2
1.9
40.1
622
22.3
475
26.0
10.2
0.4
6.9
2.9
4.1
67.8
28.1
ND
ND
4.0
1.4
90.1
722
22.3
4500
16.0
0.4
0.0
0.3
0.1
8.0
71.7
20.3
9.0
95.4
17.6
1.3
60.0
626
14.8
875
26.0
20.2
3.2
12.9
4.1
15.7
63.8
20.5
ND
ND
2.7
3.7
10.0
927
13.1
6400
16.0
4.9
0.2
2.2
2.4
3.8
46.0
50.1
ND
ND
1.4
3.7
50.0
231
5.9
875
26.0
10.4
2.0
6.0
2.4
19.1
57.8
23.1
ND
ND
4.2
3.1
40.2
131
5.9
8400
10.0
2.0
0.1
0.7
1.2
4.7
34.5
60.9
30.3
93.7
2.9
2.3
80.0
431
5.9
81750
4.0
3.5
0.2
0.5
2.8
4.6
15.0
80.4
ND
ND
1.5
ND
ND
Abbre
via
tion
s:A
RC
T,
Nort
hA
tlan
tic
Arc
tic
pro
vin
ce;
NA
DR
,N
ort
hA
tlan
tic
Dri
ftp
rovin
ce;
NA
G,
Nort
hA
tlan
tic
Gyra
lp
rovin
ce;
ND
,n
ot
dete
cte
d;
NP
P,n
et
pro
kary
oti
cp
rod
ucti
on
;P
TT
,p
rokary
oti
ctu
rnover
tim
e;
ST
,st
ati
on
;V
P,
vir
al
pro
du
cti
on
;V
TT
,vir
al
turn
over
tim
e;
WT
RA
,W
est
ern
Tro
pic
al
Atl
an
tic.
Tota
lly
tic,
hig
h-,
med
ium
-an
dlo
w-f
luore
scen
ceV
Pan
dth
eir
resp
ecti
ve
per
cen
tage
are
given
.Lyso
gen
icV
Pver
sus
tota
lV
P(A
RC
T—
ST
4,N
AD
R—
ST
7,N
AG
—S
Ts
12-1
7-2
2-2
6-2
7an
dW
TR
A—
ST
31).
Viruses and prokaryotes along a latitudinal transectD De Corte et al
4
The ISME Journal

provinces (ANOVA on rank Po0.001, post hocDunno’s test Po0.05). The lowest salinity was foundin the ARCT province whereas the highest salinitywas found in the NAG zone (Supplementary TableS1). Salinity was not significantly different in thebathy- and abyssopelagic layer over the latitudinaltransect (Supplementary Table S1).
The apparent oxygen utilization significantlydecreased in the upper epipelagic layer fromthe ARCT (43.49±4.38 mmol O2 kg�1) to theWTRA (21.44±3.61 mmol O2 kg�1; ANOVA on rank,Po0.001, post hoc Dunno’s test, Po0.05). Moreover,the apparent oxygen utilization significantly in-creased with depth from the epi- to the meso- (NADR,WTRA) or bathypelagic layers (ARCT, NAG) (ANOVAon rank, Po0.001) (Supplementary Table S1).
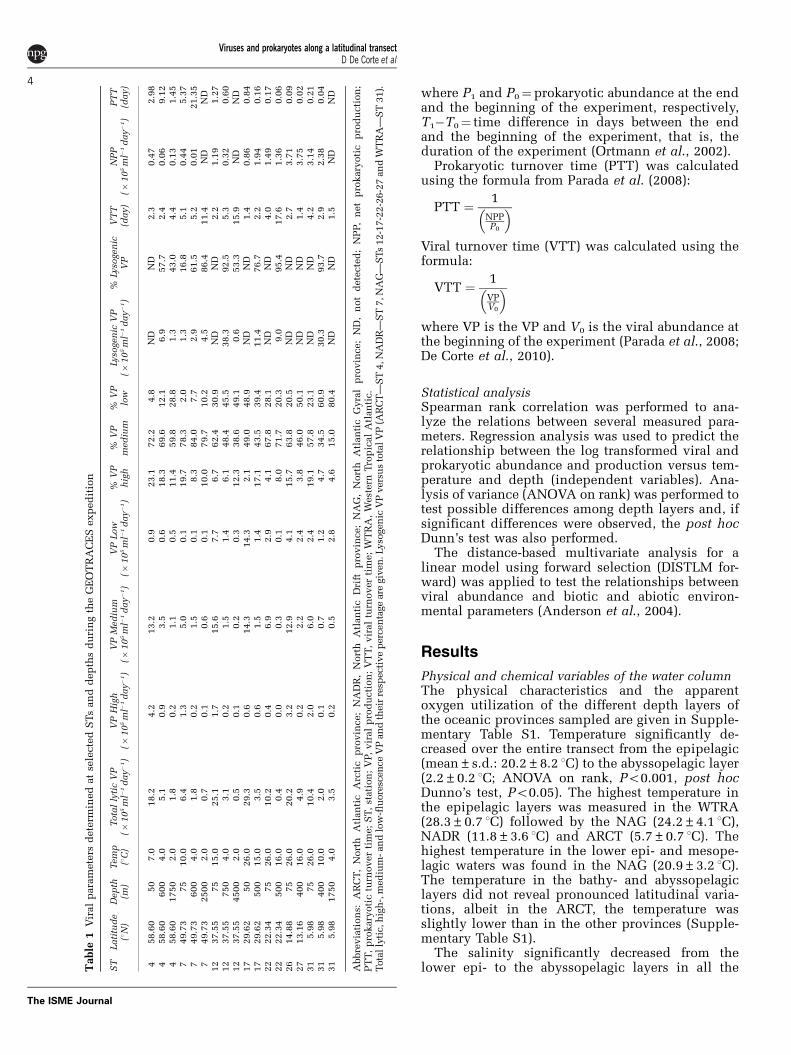
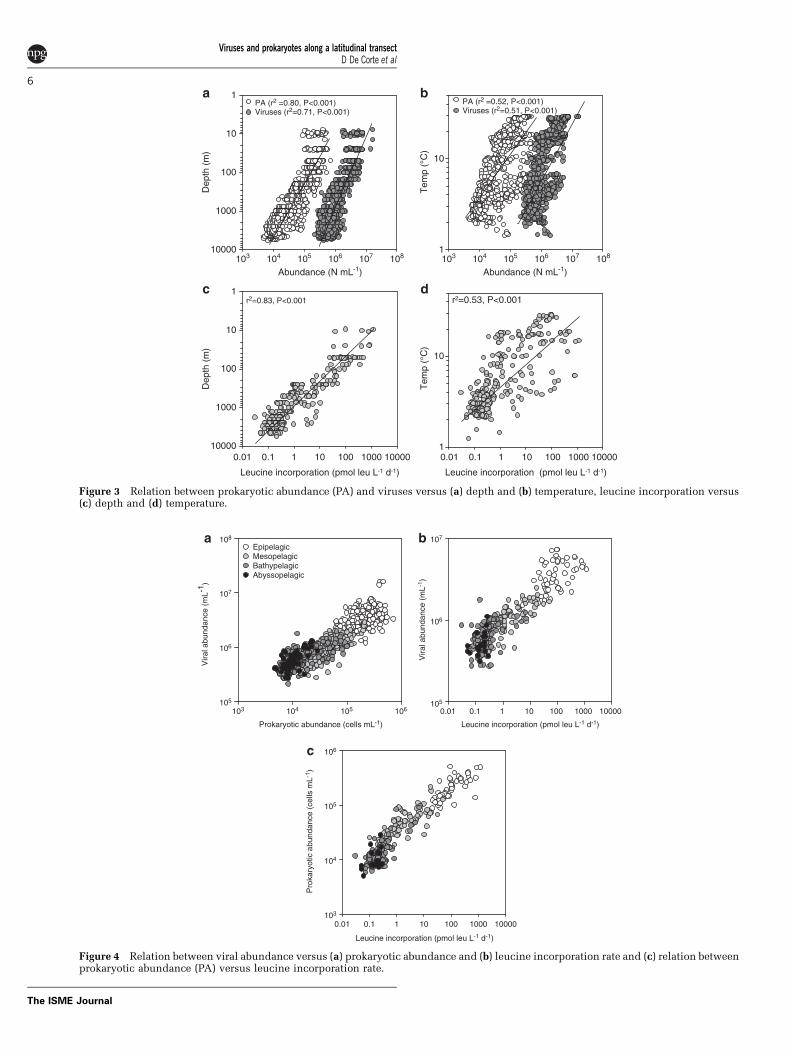
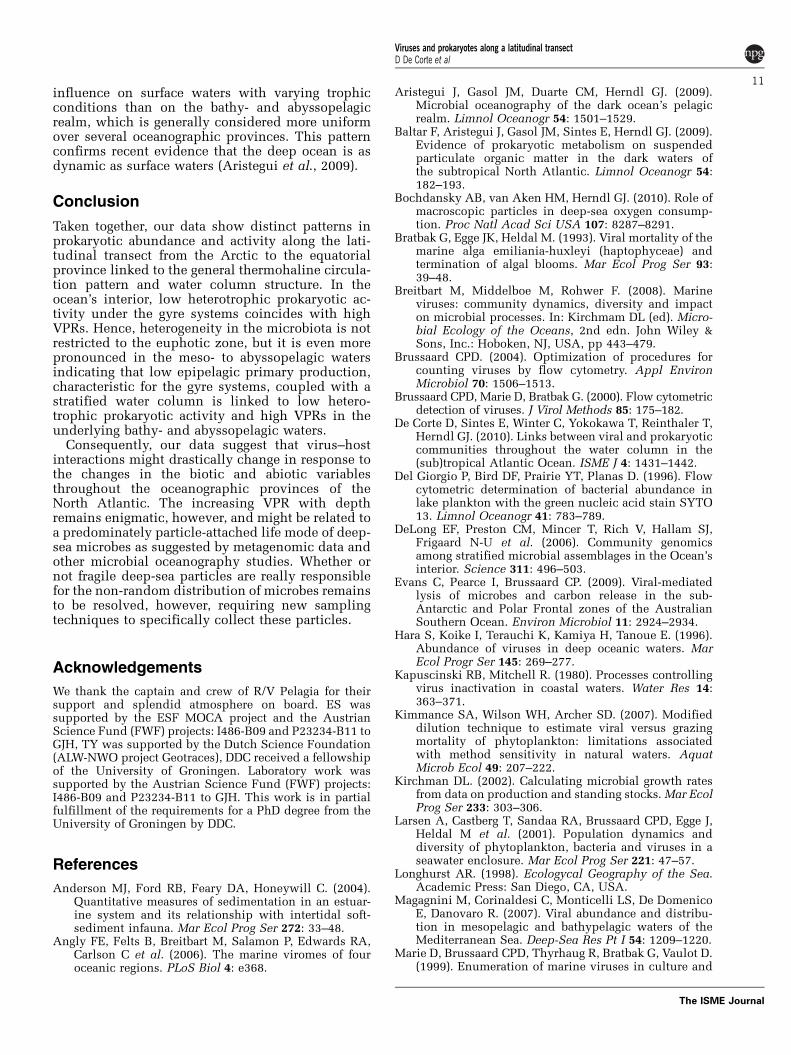
Prokaryotic and viral abundanceThe prokaryotic abundance significantly decreasedwith depth from an average over all the stationsof 2.5±1.1� 105 cells ml�1 in the epipelagic watersto 0.1±0.05� 105 cells ml�1 in the abyssopelagicwaters (ANOVA on rank, Po0.001, post hocDunno’s test, Po0.05) (Supplementary Table S2,Figure 2a). Regardless of the depth horizon, highestprokaryotic abundance was found in the ARCT,while the lowest abundance was found in the NAGand WTRA (Figure 2a). Prokaryotic abundance wasnegatively related to depth (linear regressionr2¼ 0.80, Po0.001) and positively related to tem-perature (linear regression r2¼ 0.52, Po0.001), viralabundance (Spearman’s rank correlation, r2¼ 0.90,Po0.001) and prokaryotic heterotrophic production
(Spearman’s rank correlation, r2¼ 0.92, Po0.001)(Figures 3a, b, 4a and b).
The abundance of viruses significantly decreasedwith depth from an average over all the stations of4.48±2.38� 106 viruses ml�1 and 0.58±0.23� 106
viruses ml�1 in the epi- and abyssopelagic waters,respectively (Supplementary Table S2) (ANOVA onrank, Po0.001). The viral abundance did not changesignificantly between the bathy- and the abyssope-lagic waters (ANOVA on rank, P¼ 0.460). Generally,viral abundance was negatively related with depth(linear regression r2¼ 0.71, Po0.001) and positivelycorrelated with temperature (linear regressionr2¼ 0.51, Po0.001), prokaryotic abundance (Spear-man’s rank correlation, r2¼ 0.90, Po0.001) andheterotrophic production (Spearman’s rank correla-tion, r2¼ 0.86, Po0.001) (Figures 3a, b, 4a and b). Inthe epipelagic layer, highest viral abundance wasfound in the WTRA whereas the lowest abundancewas measured in the ARCT (ANOVA on rank,Po0.001, post hoc Dunno’s test, Po0.05). In themeso, bathy- and abyssopelagic layers, the viralabundance decreased from the ARCT to the WTRA(ANOVA on rank, Po0.001).
High and low nucleic acid content prokaryoticpopulations were distinguished based on theirsignature of SYBR Green fluorescence versus sidescatter, as determined by flow cytometry (Supple-mentary Figure S1a). The fraction of the prokaryoticcommunity with high nucleic acid content did notshow any significant trend neither with depth norwith latitude (Supplementary Table S2).
Three different viral populations were distin-guished based on their fluorescence signal determined
Oce
an D
ata
Vie
w
0
1
2
3
4
5
6
7
60˚N 50˚N 40˚N 30˚N 20˚N 10˚N6000
4000
2000
0
Dep
th (
m)
NADR NAG
0
20
40
60
80
100
120
60˚N 50˚N 40˚N 30˚N 20˚N 10˚N6000
4000
2000
0
Oce
an D
ata
Vie
w
Oce
an D
ata
Vie
w
0.01
0.1
1
10
100
1000
10000
60˚N 50˚N 40˚N 30˚N 20˚N 10˚N
6000
4000
2000
0
Dep
th (
m)
0.1
1
10
100
1000
60˚N 50˚N 40˚N 30˚N 20˚N 10˚N
6000
4000
2000
0
Oce
an D
ata
Vie
w
Dep
th (
m)
Dep
th (
m)
Prokaryotic abundance (x 105 mL-1)
Spec leu (x10-5 fmol cell-1 d-1)Leucine incorporation rate (pmol leu L-1d-1)
VPR
WTRAARCT
NADR NAG WTRAARCT
NADR NAG WTRAARCT
NADR NAG WTRAARCT
0.10
0.10
0.10
0.15
0.15
0.25 0.300.400.50
0.60
0.60
0.800.901.002.03.00 10 15
15
20
20 25
25
25
30
30
40
45
45
45
4550 50
55
55
55
55
5555
60
65
70
75
8085
90
0.10
0.10
0.10 0.17 0.310.56 1.00
1.77
3.16
5.6210.00
10.0017.78
31.6256.23 56.23
1
1.25
1.77
1.77
3.625.62
5.6210.00 10.0017.7831.62 31.62
Figure 2 Biotic parameters measured along the North Atlantic latitudinal transect in the epi- meso-, bathy- and abyssopelagic layers:(a) prokaryotic abundance, (b) VPR, (c) heterotrophic prokaryotic production measured via leucine incorporation and (d) cell-specificleucine incorporation rate. Broken vertical lines denote borders between oceanic provinces following the description given in Longhurst(1998). For abbreviations of the oceanic provinces see Figure 1.
Viruses and prokaryotes along a latitudinal transectD De Corte et al
5
The ISME Journal
Abundance (N mL-1)103 104 105 106 107 108
Tem
p (°
C)
1
10
Tem
p (°
C)
1
10
Abundance (N mL-1)103 104 105 106 107 108
Dep
th (
m)
1
10
100
1000
10000
Leucine incorporation (pmol leu L-1 d-1)
Dep
th (
m)
1
10
100
1000
10000
PA (r2 =0.80, P<0.001)Viruses (r2=0.71, P<0.001)
PA (r2 =0.52, P<0.001)Viruses (r2=0.51, P<0.001)
r2=0.83, P<0.001 r2=0.53, P<0.001
Leucine incorporation (pmol leu L-1 d-1)
0.01 0.1 101 100 1000 10000 0.01 0.1 101 100 1000 10000
Figure 3 Relation between prokaryotic abundance (PA) and viruses versus (a) depth and (b) temperature, leucine incorporation versus(c) depth and (d) temperature.
Prokaryotic abundance (cells mL-1)
103 104 105 106105
106
107
108
EpipelagicMesopelagicBathypelagicAbyssopelagic
103
104
105
106
105
106
107
Vira
l abu
ndan
ce (
mL-1
)
Vira
l abu
ndan
ce (
mL-1
)
Pro
kary
otic
abu
ndan
ce (
cells
mL-1
)
Leucine incorporation (pmol leu L-1 d-1)
Leucine incorporation (pmol leu L-1 d-1)
0.01 0.1 1 10 100 1000 10000
0.01 0.1 1 10 100 1000 10000
Figure 4 Relation between viral abundance versus (a) prokaryotic abundance and (b) leucine incorporation rate and (c) relation betweenprokaryotic abundance (PA) versus leucine incorporation rate.
Viruses and prokaryotes along a latitudinal transectD De Corte et al
6
The ISME Journal

by flow cytometry (Supplementary Figure S1b). Theabundance of the three viral populations decreasedwith depth (ANOVA on rank, Po0.001). However,only the percentage of the high-fluorescence viralpopulation correlated with depth (Spearman’s rankcorrelation coefficient rs¼�0.531, Po0.001), ran-ging, on average, from 22% in the epipelagic watersto 8% of the total viral abundance in the abyssope-lagic zone (Supplementary Table S2). The medium-fluorescence population comprised, on average,70% of total viral abundance without any significanttrend with depth. The low-fluorescence viral popu-lation showed the highest variability among thethree viral populations ranging, on average, from10% to 27%, again without a specific depth-relatedtrend (Supplementary Table S2). No significantlatitudinal differences over specific depth horizonswere found for the three viral populations.
The virus-to-prokaryote ratio (VPR) significantlyincreased with depth from an average over all thestations of 19.2±8.3 in the epipelagic layer to59.1±18.7 (ANOVA on rank, Po0.001) in theabyssopelagic layer (Supplementary Table S2,Figure 2b). Although the VPR was positively relatedwith depth (linear regression r2¼ 0.50, Po0.001), itwas negatively correlated with the prokaryotic pro-duction (Spearman’s rank correlation coefficient,rs¼�0.75, Po0.001). In the bathypelagic and abysso-pelagic waters of the NAG, the VPR was significantlyhigher than in the ARCT and WTRA provinces(ANOVA on ranks, Po0.001, post hoc Dunno’s test,Po0.05) (Supplementary Table S2, Figure 2b).
Leucine incorporation as a proxy of heterotrophicprokaryotic productionLeucine incorporation into heterotrophic prokar-yotes exponentially decreased from the surface toabyssopelagic waters by three orders of magnitudefrom an average over the entire transect of227.4±268.1 to 0.17±0.09 pmol leu l�1 day�1 (Supple-mentary Table S2, Figures 2c and 3c). Significantdifferences in leucine incorporation were also foundbetween the bathy- and abyssopelagic layer (ANOVAon ranks, Po0.001, post hoc Dunno’s test, Po0.05).Leucine incorporation was positively related withtemperature (linear regression, r2¼ 0.53, Po0.001),and viral and prokaryotic abundance (Figures 3d, 4band c). In the bathy- and abyssopelagic waters of theNAG, leucine incorporation was significantly lower(ANOVA on ranks, Po0.001, post hoc Dunno’s test,Po0.05) than in the bathy- and abyssopelagic watersof the ARCT, NADR and WTRA regions (Supplemen-tary Table S2, Figure 2c).
Cell-specific leucine incorporation decreasedwith depth from an average over all the stations of85.2±95.5� 10�5 fmol leu cell�1 day�1 to 1.6±0.7�10�5 fmol leu cell�1 day�1. The highest cell-specificactivity was found in the NADR province in the epi-and mesopelagic layers whereas in the bathypelagiczone, the highest cell-specific leucine incorporation
was detected in the ARCT region (SupplementaryTable S2, Figure 2d). In the bathy- and abyssopelagicwaters of the NAG, cell-specific leucine incorpora-tion rates were lower than in the ARCT province(ANOVA on ranks, P¼ 0.002, post hoc Dunno’s test,Po0.05) (Figure 2d).
Viral productionLytic VP decreased by one order of magnitudefrom 29.3� 105 ml�1 day�1 in the epipelagic layersto 0.5� 105 ml�1 day�1 in the bathypelagic realm(Table 1, Figure 5) without differences among theoceanographic provinces. Although the relative con-tribution of the three viral populations (distinguishedby flow cytometry) to the total VP did not changewith depth, their contribution changed with latitude(Table 1). The contribution of the high- and medium-fluorescence viral population to total lytic VP waspositively correlated with latitude and therefore,increased from the WTRA to the ARCT (Spearmanrank’s coefficient rs¼ 0.47, P¼ 0.049 and rs¼ 0.60,P¼ 0.008, respectively). In contrast, the contributionof the low-fluorescence viral population to total lyticVP was negatively correlated with latitude (Spear-man rank’s coefficient rs¼�0.60, P¼ 0.007) hence,decreased from the WTRA to the ARCT (Table 1).
The lysogenic VP ranged between 38.3� 105 and0.6� 105 ml�1 day�1, contributing between 17% and95% (on average 68±26%) to total VP (Table 1).Generally, the contribution of lysogeny to total VPwas negatively related to latitude (Spearman rank’scoefficient rs¼�0.71, P¼ 0.01), however, no depth-related trends were discernable.
Other prokaryotic variables derived from VPexperimentsThe NPP (production in the presence of viral lysis)was negatively related to latitude (Spearman rank’scoefficient rs¼�0.88, Po0.01; Table 1) and positively
Lytic VP (mL-1d-1)
Dep
th (
m)
10
100
1000
104 105 106 107
Lytic Viral Production (r2=0.71, P<0.001)
Figure 5 Relation between lytic VP versus depth.
Viruses and prokaryotes along a latitudinal transectD De Corte et al
7
The ISME Journal

related to temperature (Spearman rank’s coefficientrs¼ 0.77, P¼ 0.001; Table 1).
The PTT (Table 1) calculated from the NPPmeasured during the dilution experiments wasnegatively correlated with temperature and posi-tively with latitude (Spearman rank’s coefficientrs¼�0.58, P¼ 0.02, rs¼ 0.86, Po0.01, respectively;Table 1). Also the PTT based on leucine incorpora-tion rates significantly varied with latitude in theepi- (upper and lower) and mesopelagic layers(Spearman rank’s coefficient rs¼�0.45, Po0.01;rs¼�0.59, Po0.02; rs¼�0.46, Po0.01, respectively;data not shown) and for the whole data set withtemperature (Spearman rank’s coefficient rs¼�0.63,Po0.01; data not shown). Although the two esti-mates of the PTT showed similar trends withlatitude and temperature, the PTT based on theleucine incorporation rate was at least one order ofmagnitude higher in the NADR and two orders ofmagnitude higher in the NAG and WTR provincesthan the PTT estimated from the increase in cellabundances in the dilution experiments.
The prokaryotic (calculated from the NPP) andVTTs were similar in the NADR, whereas in theNAG and WTRA, the PTT was one order ofmagnitude lower than the VTT (Table 1). The VTTranged between 1 and 18 days and was significantlycorrelated with depth (Spearman rank’s coefficientrs¼ 0.48, P¼ 0.044).
Relationships between viral and environmentalparametersThe multivariate multiple regression analysis wasused to select the best predictor variables explainingthe variability of the viral abundance between thedifferent depth layers (Table 2) and between theoceanographic provinces (Table 3).
Considering the whole data set (all depth layersand all stations), the variability of viral abundance
was mainly explained by prokaryotic abundance,temperature and latitude, which together accountedfor 73% of the total variation (Table 2). Theprokaryotic abundance accounted for 46% of thevariation in viral abundance, while temperature andlatitude accounted for 15% and 11%, respectively(Table 2). The variables explaining most of thevariability in viral abundance in the epipelagic zoneof the whole transect were prokaryotic production,latitude and temperature, together explaining 56% ofthe variation in viral abundance, although thecontribution of latitude was low (r2¼ 0.05; P¼ 0.04)(Table 2). In the mesopelagic layer, the main predictorparameters for the variability in viral abundance overthe latitudinal transect were prokaryotic abundance,temperature, latitude and the % high nucleic acidcontaining prokaryotes (cumulative r2¼ 0.62), withprokaryotic abundance and latitude explaining 52%of the variability in viral abundance. Latitude andtemperature explained 47% and 88% of the varia-tions in viral abundance in the bathy- and abyssope-lagic realm, respectively (Table 2).
Potential differences among the oceanic provincesin the parameters explaining the variation in viralabundance were investigated using data collectedthroughout the water column (Table 3). The prokar-yotic abundance accounted for 69%, 68% and 13%of the variation in viral abundance in the watercolumn of the ARCT, NADR and WTRA, respec-tively. Temperature accounted for 12%, 73% and92% of the variation in viral abundance in theARCT, NAG and WTRA, respectively (Table 3).Surprisingly, heterotrophic prokaryotic production(estimated via leucine incorporation) explained only3% and 1% of the variation in viral abundancethroughout the water column in the NADR and NAGand depth and the % high nucleic acid only 6% and2%, respectively, in the NADR (Table 3). Althoughthe contribution of prokaryotic abundance explain-ing the variation in viral abundance decreased from
Table 2 Results of the multivariate multiple regression analysis with forward selection (DISTML forward) to explain the variability inviral abundance throughout the water column (total) and in specific depth layers
Depth layer Selected variables Pseudo-F P r2 Cumulative
Total (n¼256) Prokaryotic abundance 217.2 0.001 0.46 0.46Temperature 103.1 0.001 0.15 0.61Latitude 106.2 0.001 0.11 0.73
EPI (n¼53) Prokaryotic production 27.2 0.001 0.35 0.35Temperature 17.1 0.001 0.15 0.50Latitude 4.4 0.043 0.05 0.56
MESO (n¼83) Prokaryotic abundance 50.8 0.001 0.39 0.39Latitude 24.5 0.001 0.13 0.52Temperature 11.2 0.003 0.08 0.60%HNA 3.6 0.049 0.02 0.62
BATHY (n¼102) Latitude 73.91 0.001 0.43 0.43Temperature 7.45 0.012 0.04 0.47
ABYSSO (n¼ 18) Latitude 71.73 0.001 0.82 0.82Temperature 7.47 0.019 0.06 0.88
Abbreviations: ABYSSO, abyssopelagic; BATHY, bathypelagic; EPI, epipelagic; HNA, high nucleic acid; MESO, mesopelagic; n, number ofsamples.The response variable was log transformed and the resulting data converted into Euclidian distance similarities matrices. The Pseudo-F and theP-values were obtained by permutation (n¼ 999).
Viruses and prokaryotes along a latitudinal transectD De Corte et al
8
The ISME Journal

the ARCT to the WTRA, the contribution of thetemperature increased from the ARCT to the WTRA(Table 3).
The variability in lytic VP was mainly explainedby depth and viral abundance (DISTML test,cumulative r2¼ 0.82), with depth alone explaining72% of the variation (data not shown).
Discussion
Latitudinal trends in prokaryotic abundance andproductionOverall, the prokaryotic abundance was higher inthe ARCT than in the other oceanographic pro-vinces, particularly in the bathypelagic waters(Figure 2a, Supplementary Table S2). In this deep-water layer, prokaryotic abundance decreased fromthe ARCT toward the NAG and WTRA (Figure 2a),reflecting the distribution pattern of phytoplanktonproductivity in these Atlantic provinces (Sathyen-dranath et al., 1995). Similarly to the prokaryoticabundance, the highest heterotrophic prokaryoticproduction (measured as leucine incorporation) wasfound in the ARCT and NADR (SupplementaryTable S2). The rates and ranges of leucine incorpora-tion determined for the epipelagic layer in this studyare in the range of values reported by other NorthAtlantic studies (Reinthaler et al., 2006). Thus, thevariability of the heterotrophic prokaryotic activityin the epipelagic layer reported here (Supplemen-tary Table S2) results from the large biogeographicarea covered in this study extending over fouroceanographic provinces, all exhibiting specificitiesin primary production and trophic conditions.Remarkably, there was a pronounced minimum inleucine incorporation detectable in the NAG belowabout 2000 m depth (Figure 2c). The NAG provinceis generally characterized by low primary produc-tion in the surface waters and low export flux(Sathyendranath et al., 1995). This low supply ofparticulate organic matter sedimenting into the deepwaters of the NAG apparently provokes the lowerprokaryotic abundance and leucine incorporation in
the bathy- and abyssopelagic waters in the NAGthan at the same depth layers outside the NAGfurther north and south (Figures 2a and c). Thissupports the notion that bathy- and abyssopelagicprokaryotic heterotrophic activity mainly dependson sedimenting particulate organic matter supply(Nagata et al., 2000; Baltar et al., 2009) and hence,surface water primary production.
Cell-specific leucine incorporation followed asimilar trend as bulk leucine uptake with pro-nounced differences among the oceanographic pro-vinces particularly in the dark realm of the ocean(Figure 2d). Cell-specific leucine incorporationexponentially decreased with depth by two ordersof magnitude with lowest cell-specific activity in theNAG (Figure 2d). A similar increase in deep-waterleucine incorporation from the NAG to the WTRA asreported here for the western basin of the NorthAtlantic has also been shown for the eastern basin ofthe Atlantic (Baltar et al., 2009). Taken together, theoverall prokaryotic activity in the bathy- andabyssopelagic waters appears to be related to thesedimenting particle flux, which, in turn, is relatedto the overall phytoplankton productivity. The cell-specific leucine incorporation rates measured in theARCT, NAG and WTRA reported here are compar-able to previously reported rates from these regionsof the eastern basin of the Atlantic (Reinthaler et al.,2006; De Corte et al., 2010).
Latitudinal trends of viral abundance and productionGenerally, the viral abundance was comparable toprevious studies conducted in the subtropicalAtlantic and Pacific Ocean (Hara et al., 1996;De Corte et al., 2010), but it was one order ofmagnitude lower than the abundance determined inthe eastern basin of the North Atlantic (Parada et al.,2007) using essentially the same enumeration pro-tocol. The VPR increased with depth from B19 inthe euphotic layer to B59 in the bathy- andabyssopelagic waters (Supplementary Table S2,Figure 2b) because of the lower decrease in viral
Table 3 Results of the multivariate multiple regression analysis with forward selection (DISTML forward) to explain the variability inviral abundance in different geographic regions
Provinces Selected variables Pseudo-F P r2 Cumulative
ARCT (n¼20) Prokaryotic abundance 40.6 0.001 0.69 0.69Temperature 11.5 0.003 0.12 0.82
NADR (n¼ 61) Prokaryotic abundance 126.8 0.001 0.68 0.68Depth 14.7 0.001 0.06 0.75Prokaryotic production 7.9 0.011 0.03 0.78%HNA 4.2 0.040 0.02 0.79
NAG (n¼116) Temperature 307.3 0.001 0.73 0.73Prokaryotic abundance 102.7 0.001 0.13 0.86Prokaryotic production 3.8 0.046 0.01 0.87
WTRA (n¼55) Temperature 575.84 0.001 0.92 0.92
Abbreviations: ARCT, North Atlantic Arctic province; HNA, high nucleic acid; NADR, North Atlantic Drift province; NAG, North Atlantic Gyralprovince; n, number of samples; WTRA, Western Tropical Atlantic.The response variable was log transformed and the resulting data converted in Euclidian distance similarities matrices. The Pseudo-F and the pvalue were obtained by permutation (n¼ 999). For physical and chemical characteristics of the oceanic provinces see Supplementary Table S1.
Viruses and prokaryotes along a latitudinal transectD De Corte et al
9
The ISME Journal

abundance with depth as compared with that ofprokaryotes. A similar increase in the VPR withdepth has been previously described for the easternbasin of the Atlantic (Parada et al., 2007; De Corteet al., 2010) and the Mediterranean Sea (Magagniniet al., 2007).
On a latitudinal scale, the VPR increased in all thedepth layers from the ARCT toward the WTRA(Figure 2b). Consequently, the VPR was negativelyrelated to the leucine incorporation rates. With thecurrent knowledge on the ecology of viruses, wecannot fully explain the relatively high abundanceof viruses compared with that of prokaryotes in thedeep ocean as indicated by the high VPR in thebathypelagic waters reported here and elsewhere(Parada et al., 2007; De Corte et al., 2010). A possibleexplanation of the high VPR at depth is the longersurvival time of phages (that is, lower decay rates) inthe deep waters than in the sunlit surface waterswhere phages remain infective for 1–2 days(Wilhelm et al., 1998). Our findings of increasingVTT with depth (Table 1) together with previouslyreported VTT in the deep waters of the eastern basinof the North Atlantic of about 40 days (Parada et al.,2007) further support the longer survival time ofviruses in deep waters to sustain their relativelyhigher abundance. Furthermore, the lack of arelation between viral and prokaryotic abundancein the bathy- and abyssopelagic layers (Table 2)might be caused by the allochthonous input ofviruses attached to sinking particles derived fromsurface waters (Parada et al., 2007). Phages em-bedded in particles might exhibit lower decay ratesand consequently longer survival times than free-living viruses (Kapuscinski and Mitchell, 1980). Apredominately non-random distribution of deep-water microbes including viruses might thereforealso explain the high VPR in deep waters. Indeed,there is genomic evidence that deep-water bacteriahave more genes indicative of a particle-attached lifemode than surface water bacteria (DeLong et al.,2006). Riemann and Grossart (2008) determined ahigh phage production from particle-associatedprokaryotes using a model system, supporting ourhypothesis that a predominately particle-attachedlife strategy might sustain a high abundance ofviruses in the deep ocean. This assumed predomi-nant particle-attached life style in deep waters isalso in agreement with remarkably stable concentra-tions of suspended, buoyant particles throughoutthe water column in the open ocean (Baltar et al.,2009; Bochdansky et al., 2010).
The most abundant viral population was themedium-fluorescence population (SupplementaryTable S2). This is in agreement with a studyconducted in the subtropical Atlantic (De Corteet al., 2010), however, in contrast to coastalenvironments where the low-fluorescence viralpopulation dominates (Marie et al., 1999; Larsenet al., 2001; Kimmance et al., 2007; Pan et al., 2007).Assuming that the green fluorescence of the viruses
stained with SYBR Green is related to the nucleicacid content, it suggests a higher contribution ofviruses with a medium nucleic acid content in theopen ocean than in coastal environments. However,only limited information is available on the ecologyof these viral subgroups. A few studies indicate,however, that the high-fluorescence viral populationis frequently associated with viruses infectingeukaryotic plankton (Brussaard et al., 2000;Brussaard, 2004). Thus, further studies are neededto decipher the nature and source of these three viralsub-population in the marine ecosystem.
The lytic VP exponentially decreased with depth(Table 1, Figure 5). Lytic VP was one order ofmagnitude lower than in a study conducted in thesame depth layers of the subtropical Atlantic Ocean(De Corte et al., 2010) and two orders of magnitudelower than in the Southern Ocean (Evans et al.,2009). The lytic VP obtained in our study was,however, one order of magnitude higher thanreported for the Mediterranean Sea (Weinbaueret al., 2003). In contrast to the lytic VP, the lysogenicVP did not vary with depth (Table 1). An increasingproportion of lysogeny to total VP was detectable inour study from the ARCT to the WTRA (Table 1). Theincreasing contribution of lysogeny to total VP withdecreasing heterotrophic production along the lati-tudinal transect is in agreement with the hypothesisof Weinbauer et al. (2003) suggesting that lysogeny asan adaptation to low host abundance and activity.
The bacterial turnover time obtained in the VPassays decreased toward the WTRA while the turn-over time of the lytic VP measured in the sameexperiments did not significantly vary with latitude(Table 1). Thus, a discrepancy between viral andbacterial turnover times was observed in the NAGand WTRA, where the PTT was one order ofmagnitude lower than the VTT. These resultssupport the hypothesis that oligotrophic conditions,characterized by low phytoplankton and prokaryoticproduction, favor the lysogenic over the lytic viralcycle (Weinbauer and Suttle, 1999; Williamsonet al., 2002; Williamson and Paul, 2004).
Links between viral and environmental variablesThe relationships between viral abundance andbiotic and abiotic parameters differed among theoceanographic provinces and depth layers (Tables 2and 3). The heterotrophic prokaryotic production(measured as leucine incorporation) was the mainexplanatory variable for viral abundance in theepipelagic layer over the entire latitudinal transect,suggesting a tight coupling between prokaryotes andviruses in the sunlit epipelagic waters regardless theoceanographic province (Table 2). Remarkably, lati-tude alone explained only 5% of the variability inviral abundance in the epipelagic layer but 43% and82% in the bathy- and abyssopelagic layer, respec-tively (Table 2). This is counterintuitive because onewould generally assume that latitude exerts more
Viruses and prokaryotes along a latitudinal transectD De Corte et al
10
The ISME Journal
influence on surface waters with varying trophicconditions than on the bathy- and abyssopelagicrealm, which is generally considered more uniformover several oceanographic provinces. This patternconfirms recent evidence that the deep ocean is asdynamic as surface waters (Aristegui et al., 2009).
Conclusion
Taken together, our data show distinct patterns inprokaryotic abundance and activity along the lati-tudinal transect from the Arctic to the equatorialprovince linked to the general thermohaline circula-tion pattern and water column structure. In theocean’s interior, low heterotrophic prokaryotic ac-tivity under the gyre systems coincides with highVPRs. Hence, heterogeneity in the microbiota is notrestricted to the euphotic zone, but it is even morepronounced in the meso- to abyssopelagic watersindicating that low epipelagic primary production,characteristic for the gyre systems, coupled with astratified water column is linked to low hetero-trophic prokaryotic activity and high VPRs in theunderlying bathy- and abyssopelagic waters.
Consequently, our data suggest that virus–hostinteractions might drastically change in response tothe changes in the biotic and abiotic variablesthroughout the oceanographic provinces of theNorth Atlantic. The increasing VPR with depthremains enigmatic, however, and might be related toa predominately particle-attached life mode of deep-sea microbes as suggested by metagenomic data andother microbial oceanography studies. Whether ornot fragile deep-sea particles are really responsiblefor the non-random distribution of microbes remainsto be resolved, however, requiring new samplingtechniques to specifically collect these particles.
Acknowledgements
We thank the captain and crew of R/V Pelagia for theirsupport and splendid atmosphere on board. ES wassupported by the ESF MOCA project and the AustrianScience Fund (FWF) projects: I486-B09 and P23234-B11 toGJH, TY was supported by the Dutch Science Foundation(ALW-NWO project Geotraces), DDC received a fellowshipof the University of Groningen. Laboratory work wassupported by the Austrian Science Fund (FWF) projects:I486-B09 and P23234-B11 to GJH. This work is in partialfulfillment of the requirements for a PhD degree from theUniversity of Groningen by DDC.
References
Anderson MJ, Ford RB, Feary DA, Honeywill C. (2004).Quantitative measures of sedimentation in an estuar-ine system and its relationship with intertidal soft-sediment infauna. Mar Ecol Prog Ser 272: 33–48.
Angly FE, Felts B, Breitbart M, Salamon P, Edwards RA,Carlson C et al. (2006). The marine viromes of fouroceanic regions. PLoS Biol 4: e368.
Aristegui J, Gasol JM, Duarte CM, Herndl GJ. (2009).Microbial oceanography of the dark ocean’s pelagicrealm. Limnol Oceanogr 54: 1501–1529.
Baltar F, Aristegui J, Gasol JM, Sintes E, Herndl GJ. (2009).Evidence of prokaryotic metabolism on suspendedparticulate organic matter in the dark waters ofthe subtropical North Atlantic. Limnol Oceanogr 54:182–193.
Bochdansky AB, van Aken HM, Herndl GJ. (2010). Role ofmacroscopic particles in deep-sea oxygen consump-tion. Proc Natl Acad Sci USA 107: 8287–8291.
Bratbak G, Egge JK, Heldal M. (1993). Viral mortality of themarine alga emiliania-huxleyi (haptophyceae) andtermination of algal blooms. Mar Ecol Prog Ser 93:39–48.
Breitbart M, Middelboe M, Rohwer F. (2008). Marineviruses: community dynamics, diversity and impacton microbial processes. In: Kirchmam DL (ed). Micro-bial Ecology of the Oceans, 2nd edn. John Wiley &Sons, Inc.: Hoboken, NJ, USA, pp 443–479.
Brussaard CPD. (2004). Optimization of procedures forcounting viruses by flow cytometry. Appl EnvironMicrobiol 70: 1506–1513.
Brussaard CPD, Marie D, Bratbak G. (2000). Flow cytometricdetection of viruses. J Virol Methods 85: 175–182.
De Corte D, Sintes E, Winter C, Yokokawa T, Reinthaler T,Herndl GJ. (2010). Links between viral and prokaryoticcommunities throughout the water column in the(sub)tropical Atlantic Ocean. ISME J 4: 1431–1442.
Del Giorgio P, Bird DF, Prairie YT, Planas D. (1996). Flowcytometric determination of bacterial abundance inlake plankton with the green nucleic acid stain SYTO13. Limnol Oceanogr 41: 783–789.
DeLong EF, Preston CM, Mincer T, Rich V, Hallam SJ,Frigaard N-U et al. (2006). Community genomicsamong stratified microbial assemblages in the Ocean’sinterior. Science 311: 496–503.
Evans C, Pearce I, Brussaard CP. (2009). Viral-mediatedlysis of microbes and carbon release in the sub-Antarctic and Polar Frontal zones of the AustralianSouthern Ocean. Environ Microbiol 11: 2924–2934.
Hara S, Koike I, Terauchi K, Kamiya H, Tanoue E. (1996).Abundance of viruses in deep oceanic waters. MarEcol Progr Ser 145: 269–277.
Kapuscinski RB, Mitchell R. (1980). Processes controllingvirus inactivation in coastal waters. Water Res 14:363–371.
Kimmance SA, Wilson WH, Archer SD. (2007). Modifieddilution technique to estimate viral versus grazingmortality of phytoplankton: limitations associatedwith method sensitivity in natural waters. AquatMicrob Ecol 49: 207–222.
Kirchman DL. (2002). Calculating microbial growth ratesfrom data on production and standing stocks. Mar EcolProg Ser 233: 303–306.
Larsen A, Castberg T, Sandaa RA, Brussaard CPD, Egge J,Heldal M et al. (2001). Population dynamics anddiversity of phytoplankton, bacteria and viruses in aseawater enclosure. Mar Ecol Prog Ser 221: 47–57.
Longhurst AR. (1998). Ecologycal Geography of the Sea.Academic Press: San Diego, CA, USA.
Magagnini M, Corinaldesi C, Monticelli LS, De DomenicoE, Danovaro R. (2007). Viral abundance and distribu-tion in mesopelagic and bathypelagic waters of theMediterranean Sea. Deep-Sea Res Pt I 54: 1209–1220.
Marie D, Brussaard CPD, Thyrhaug R, Bratbak G, Vaulot D.(1999). Enumeration of marine viruses in culture and
Viruses and prokaryotes along a latitudinal transectD De Corte et al
11
The ISME Journal

natural samples by flow cytometry. Appl EnvironMicrobiol 65: 45–52.
Middelboe M. (2000). Bacterial growth rate and marinevirus-host dynamics. Microbial Ecol 40: 114–124.
Middelboe M, Jørgensen NOG. (2006). Viral lysis ofbacteria: an important source of dissolved aminoacids and cell wall compounds. J Mar Biol Assn UK86: 605–612.
Middelboe M, Lyck PG. (2002). Regeneration of dissolvedorganic matter by viral lysis in marine microbialcommunities. Aquat Microb Ecol 27: 187–194.
Middelboe M, Riemann L, Steward GF, Hansen V, NybroeO. (2003). Virus-induced transfer of organic carbonbetween marine bacteria in a model community.Aquat Microb Ecol 32: 1–10.
Nagata T, Fukuda H, Fukuda R, Koike I. (2000). Bacter-ioplankton distribution and production in deepPacific waters: large-scale geographic variations andpossible coupling with sinking particle fluxes. LimnolOceanogr 45: 426–435.
Ortmann AC, Lawrence JE, Suttle CA. (2002). Lysogenyand lytic viral production during a bloom of theCyanobacterium Synechococcus spp. Microbial Ecol43: 225–231.
Pan LA, Zhang J, Zhang LH. (2007). Picophytoplankton,nanophytoplankton, heterotrohpic bacteria andviruses in the Changjiang Estuary and adjacent coastalwaters. J Plankton Res 29: 187–197.
Parada V, Baudoux AC, Sintes E, Weinbauer MG, HerndlGJ. (2008). Dynamics and diversity of newly producedvirioplankton in the North Sea. ISME J 2: 924–936.
Parada V, Sintes E, van Aken HM, Weinbauer MG, HerndlGJ. (2007). Viral abundance, decay, and diversity inthe meso- and bathypelagic waters of the NorthAtlantic. Appl Environ Microbiol 73: 4429–4438.
Pommier T, Canback B, Riemann L, Bostrom KH, Simu K,Lundberg P et al. (2007). Global patterns of diversityand community structure in marine bacterioplankton.Mol Ecol 16: 867–880.
Pytkowicz RM. (1971). On the apparent oxygen utilizationand the preformed phosphate in the oceans. LimnolOceanogr 16: 39–42.
Reinthaler T, van Aken H, Veth C, Aristegui J, Robinson C,Williams PJLR et al. (2006). Prokaryotic respirationand production in the meso- and bathypelagic realm ofthe eastern and western North Atlantic basin. LimnolOceanogr 51: 1262–1273.
Riemann L, Grossart HP. (2008). Elevated lytic phageproduction as a consequence of particle colonizationby a marine Flavobacterium (Cellulophaga sp.). Micro-bial Ecol 56: 505–512.
Sano E, Carlson S, Wegley L, Rohwer F. (2004). Movementof viruses between biomes. Appl Environ Microbiol 70:5842–5846.
Sathyendranath S, Longhurst A, Caverhill CM, Platt T.(1995). Regionally and seasonally differentiated
primary production in the North Atlantic. Deep-SeaRes Pt I 42: 1773–1802.
Schattenhofer M, Fuchs BM, Amann R, Zubkov MV,Tarran GA, Pernthaler J. (2009). Latitudinal distribu-tion of prokaryotic picoplankton populations in theAtlantic Ocean. Environ Microbiol 11: 2078–2093.
Schlitzer R. (2002). Interactive analysis and visualizationof geoscience data with Ocean Data View. ComputGeosci 28: 1211–1218.
Smith DC, Azam F. (1992). A simple, economical methodfor measuring bacterial protein synthesis rates inseawater using 3H-leucine. Mar Microb Food Webs 6:107–114.
Thingstad TF, Lignell R. (1997). Theoretical models for thecontrol of bacterial growth rate, abundance, diversityand carbon demand. Aquat Microb Ecol 13: 19–27.
Varela MM, van Aken HM, Sintes E, Herndl GJ. (2008).Latitudinal trends of Crenarchaeota and Bacteria in themeso- and bathypelagic water masses of the EasternNorth Atlantic. Environ Microbiol 10: 110–124.
Weinbauer MG, Brettar I, Hofle MG. (2003). Lysogeny andvirus-induced mortality of bacterioplankton in sur-face, deep, and anoxic marine waters. Limnol Ocea-nogr 48: 1457–1465.
Weinbauer MG, Fuks D, Peduzzi P. (1993). Distribution ofviruses and dissolved DNA along a coastal trophicgradient in the Northern Adriatic Sea. Appl EnvironMicrobiol 59: 4074–4082.
Weinbauer MG, Suttle CA. (1999). Lysogeny and prophageinduction in coastal and offshore bacterial commu-nities. Aquat Microb Ecol 18: 217–225.
Wilhelm SW, Brigden SM, Suttle CA. (2002). A dilutiontechnique for the direct measurement of viral produc-tion: a comparison in stratified and tidally mixedcoastal waters. Microbial Ecol 43: 168–173.
Wilhelm SW, Weinbauer MG, Suttle CA, Jeffrey WH.(1998). The role of sunlight in the removal and repairof viruses in the sea. Limnol Oceanogr 43: 586–592.
Williamson SJ, Houchin LA, McDaniel L, Paul JH. (2002).Seasonal variation in lysogeny as depicted by proph-age induction in Tampa Bay, Florida. Appl EnvironMicrobiol 68: 4307–4314.
Williamson SJ, Paul JH. (2004). Nutrient stimulation oflytic phage production in bacterial populations of theGulf of Mexico. Aquat Microb Ecol 36: 9–17.
Winter C, Smit A, Szoeke-Denes T, Herndl GJ, WeinbauerMG. (2005). Modelling viral impact on bacterioplank-ton in the North Sea using artificial neural networks.Environ Microbiol 7: 881–893.
This work is licensed under the CreativeCommons Attribution-NonCommercial-No
Derivative Works 3.0 Unported License. To view acopy of this license, visit http://creativecommons.org/licenses/by-nc-nd/3.0/
Supplementary Information accompanies the paper on The ISME Journal website (http://www.nature.com/ismej)
Viruses and prokaryotes along a latitudinal transectD De Corte et al
12
The ISME Journal