Embed Size (px)
Citation preview
Linking the
eMPower Reading Assessments™
with
The Lexile® Framework for Reading
April 2017
Prepared by MetaMetrics for:
Measured Progress, Inc. 100 Education Way
Dover, New Hampshire 03820

Linking the
eMPower Reading Assessments
with
The Lexile® Framework for Reading
Technical Report
Prepared by MetaMetrics for Measured Progress, Inc.
(Contract dated April 7, 2017).
MetaMetrics 1000 Park Forty Plaza Drive, Suite 120
Durham, North Carolina 27713
www.Lexile.com
April 2017
METAMETRICS®, the METAMETRICS® logo and tagline, LEXILE®, LEXILE®
FRAMEWORK, and the LEXILE® logo are trademarks of MetaMetrics, Inc., and are registered
in the United States and abroad. The trademarks and names of other companies and products
mentioned herein are the property of their respective owners. Copyright © 2017 MetaMetrics,
Inc. All rights reserved.
Confidential—Not for Distribution
MetaMetrics—eMPower Reading Assessments - Lexile Linking Report—April 2017 Page i
Table of Contents
Table of Contents ....................................................................................................... i
List of Tables ........................................................................................................... iii
List of Figures ............................................................................................................ v
Introduction ................................................................................................................ 1
The Lexile Framework for Reading ........................................................................... 3
The Semantic Component ........................................................................................................... 3
The Syntactic Component ........................................................................................................... 4 Calibration of Text Difficulty ...................................................................................................... 5
The Lexile Scale .......................................................................................................................... 5 Validity of The Lexile Framework for Reading .......................................................................... 7
Text Measure Error Associated with the Lexile Framework .................................................... 11 Lexile Item Bank ....................................................................................................................... 13
The eMPower Reading Assessments—Lexile Framework Linking Process ..........17
Description of the Assessments ................................................................................................. 17 Study Design.............................................................................................................................. 19
Description of the Sample ......................................................................................................... 19 Linking the eMPower Reading Assessments Scale with the Lexile Scale ................................ 23
Validity of the eMPower Reading Assessments–Lexile Link ................................................... 26 The Lexile Framework and Forecasted Comprehension Rates ................................................. 33
Conclusions, Caveats, and Recommendations ........................................................37
Suggestions for Using The Lexile Framework for Reading ...................................................... 44
References ................................................................................................................51
Appendix ..................................................................................................................55
Confidential—Not for Distribution
MetaMetrics—eMPower Reading Assessments - Lexile Linking Report—April 2017 Page ii
Confidential—Not for Distribution
MetaMetrics—eMPower Reading Assessments - Lexile Linking Report—April 2017 Page iii
List of Tables
Table 1. Results from linking studies conducted with The Lexile Framework for Reading. ..... 8
Table 2. Correlations between theory-based calibrations produced by the Lexile equation and
rank order of unit in basal readers. ................................................................................ 9
Table 3. Correlations between theory-based calibrations produced by the Lexile equation and
empirical item difficulties. .......................................................................................... 10
Table 4. Standard errors for selected values of the length of the text. ...................................... 12
Table 5. Item statistics from the administration of the Lexile linking item pool. ..................... 19
Table 6. Number of students sampled and number of students in the matched sample. .......... 20
Table 7. Percentage of students in the eMPower reading assessment linking study initial and
final samples for selected demographic characteristics. ............................................. 21
Table 8. Descriptive statistics for the eMPower reading scale score and Lexile measure,
matched sample (N=1,411). ........................................................................................ 22
Table 9. Linear linking equation coefficients used to predict Lexile measures from the
eMPower reading scale scores. ................................................................................... 24
Table 10. Maximum reported Lexile measures by grade............................................................ 25
Table 11. Descriptive statistics for the eMPower reading assessment calibrated Lexile measures
and eMPower reading assessment linking equation Lexile measures, final sample. .. 26
Table 12. Comparison of the Lexile measures for selected percentile ranks from the eMPower
reading assessment calibrated Lexile measures and the eMPower linking equation
Lexile measures. ......................................................................................................... 27
Table 13. eMPower threshold cut points for each performance level. ........................................ 29
Table 14. eMPower reading Lexile measures for each proficiency level descriptor. ................. 29
Table 15. Comprehension rates for the same individual with materials of varying
comprehension difficulty. ........................................................................................... 34
Table 16. Comprehension rates of different person abilities with the same material. ................ 35
Table 17. Effect of reader-text discrepancy on forecasted comprehension rate. ........................ 36
Table 18. Lexile ranges aligned to college- and career-readiness reading expectations, by grade.
..................................................................................................................................... 42

Confidential—Not for Distribution
MetaMetrics—eMPower Reading Assessments - Lexile Linking Report—April 2017 Page iv
Confidential—Not for Distribution
MetaMetrics—eMPower Reading Assessments - Lexile Linking Report—April 2017 Page v
List of Figures
Figure 1. Scatter plot between observed item difficulty and theoretical item difficulty. ........... 12
Figure 2. Scatter plot of the eMPower reading scale scores and the eMPower reading calibrated
Lexile measures, final sample (N = 66,973). .............................................................. 23
Figure 3. Selected percentiles (25th
, 50th
, and 75th
) plotted for the eMPower reading Lexile
measure for the final sample (N =66,973) .................................................................. 30
Figure 4. Box and whisker plot of the eMPower reading assessment scale scores by grade, final
sample (N = 66,973). .................................................................................................. 31
Figure 5. Box and whisker plot of the eMPower reading assessment scale scores using Lexile
calibrations, final sample (N = 66,973). ..................................................................... 32
Figure 6 Box and whisker plot of the eMPower reading assessment scores using the Lexile
linking equation by grade, final sample (N = 66,973). ............................................... 32
Figure 7. Relationship between reader-text discrepancy and forecasted comprehension rate. .. 34
Figure 8. A continuum of text difficulty for the transition from high school to postsecondary
experiences (box plot percentiles: 5th
, 25th
, 50th
, 75th
, and 95th
). ................................ 39
Figure 9. Text complexity distributions, in Lexile units, by grade (whiskers represent 5th
and
95th
percentiles). .......................................................................................................... 41
Figure 10. Comparison of the eMPower reading summative assessment scale score range and
the college and career reading levels described by the CCSS. ................................... 42
Figure 11. eMPower reading summative assessment student performance (spring 2016)
expressed as Lexile measures (N = 66,973). .............................................................. 43

Confidential—Not for Distribution
MetaMetrics—eMPower Reading Assessments - Lexile Linking Report—April 2017 Page vi
Confidential—Not for Distribution
MetaMetrics—eMPower Reading Assessments - Lexile Linking Report—April 2017 Page 1
Introduction
Often it is desirable to convey more information about test performance than can be incorporated
into a single primary score scale. Two examples arise in large-scale assessment. In one situation,
one test can provide a unique type of information (such as national comparisons available from
the National Assessment of Educational Progress), but is not administered very often. At the
same time, another test is administered more often, but is not able to provide the breadth of
information (such as a state assessment). An auxiliary score scale for a test can be established to
provide this additional information through assessment scale linkages. Once linkages are
established between two assessments, then results of the more-frequently-administered
assessment can be translated in terms of the auxiliary scale for the other assessment.
In another situation, the linkage between two score scales can be used to provide a context for
understanding the results of one of the assessments. For example, sometimes it is hard to explain
what a student can read based on the results of an English language arts/literacy test. Parents
typically ask the questions “If my child is in the fourth grade and scores a 463 on the eMPower
Reading Assessments™
, what does this mean?” or “Based on my child’s test results, what can he
or she read and how well?” or “Is my child well prepared to meet the reading demands of grade
level materials?” Once a linkage is established with an assessment that is related to specific book
or text titles, then the results of the assessment can be explained and interpreted in the context of
the specific titles that a student should be able to read.
Auxiliary score scales can be used to “convey additional normative information, test-content
information, and information that is jointly normative and content based. For many test uses, an
auxiliary scale conveys information that is more crucial than the information conveyed by the
primary score scale. In such instances, the auxiliary score is the one that is focused on, and the
primary scale can be viewed more as a vehicle for maintaining interpretability over time”
(Petersen, Kolen, and Hoover, 1989, p. 222). One such auxiliary scale is The Lexile
Framework
for Reading, which was developed to appropriately match readers with text at a level that
provides challenge but not frustration.
Linking assessment results with the Lexile Framework provides a mechanism for matching each
student’s reading ability with text on a common scale. These scales serve as anchors to which
texts and assessments can be connected allowing parents, teachers, and administrators to speak
the same language. In addition, the Lexile Framework provides a common way to monitor if
students are “on track” for the reading demands of various postsecondary endeavors. By using
the Lexile Framework, the same metric is applied to the books students read, the tests they take,
and the results that are reported. Parents often ask questions like the following:
• How can I help my child become a better reader?
• How do I challenge my child to read so that she is ready for various college and career
options?
Questions like these can be challenging for parents and educators. By linking the eMPower
Reading Assessments for Grades 3-8 with The Lexile Framework for Reading, educators and
Confidential—Not for Distribution
MetaMetrics—eMPower Reading Assessments - Lexile Linking Report—April 2017 Page 2
parents will be able to answer these questions; will be more capable of using the results; and can
improve instruction in order to develop each student’s level of reading comprehension.
This research study was designed to implement a mechanism to provide reading levels that can
be matched to text based on the eMPower Reading Assessments. The study was conducted by
MetaMetrics in collaboration with Measured Progress, Inc. (Contract dated April 7, 2017). The
following are the primary purposes of this study:
present a solution for matching readers with text;
provide Measured Progress with Lexile measures on the eMPower Reading Assessments.
develop tables for converting eMPower Reading Assessments scale scores to Lexile
measures; and
produce a report that describes the linking analysis procedures.
Confidential—Not for Distribution
MetaMetrics—eMPower Reading Assessments - Lexile Linking Report—April 2017 Page 3
The Lexile Framework for Reading A reader's comprehension of text is dependent on many factors – the purpose for reading, the
ability of the reader, and the text that is being read. The reader can be asked to read a text for
many purposes including entertainment (literary experience), to gain information, or to perform a
task. Each reader brings to the reading experience a variety of important factors: reading ability,
prior knowledge, interest level, and developmental readiness. For any text, there are three factors
associated with the readability of the text: complexity, support, and quality. All of these reader
and text factors are important considerations when evaluating the appropriateness of a text for a
reader. The Lexile Framework focuses primarily on two features: reader ability and text
complexity.
All symbol systems share two features: a semantic component and a syntactic component. In
language, the semantic units are words. Words are organized according to rules of syntax into
thought units and sentences (Carver, 1974). In all cases, the semantic units vary in familiarity
and the syntactic structures vary in complexity. The comprehensibility or difficulty of a text is
dominated by the familiarity of the semantic units and by the complexity of the syntactic
structures used in constructing the text. The Lexile Framework utilizes these two dominant
features of language in measuring text complexity by examining the characteristics of word
frequency and sentence length. Lexile text measures typically range from above 200L to below
1600L but measures can be below 0L for beginning reader materials (“BR” for “Beginning
Reader”) to above 2000L for advanced materials. Within any single classroom, there will be a
range of reading materials to reflect the student range of reading ability and interest in different
topics and types of text.
The Semantic Component
Most operationalizations of the semantic component are proxies for the probability that an
individual will encounter a word in a familiar context and thus be able to infer its meaning
(Bormuth, 1966). This is the basis of exposure theory, which explains the way receptive or
hearing vocabulary develops (Miller and Gildea, 1987; Stenner, Smith, and Burdick, 1983).
Klare (1963) hypothesized that the semantic component varied along a familiarity-to-rarity
continuum. This concept was further developed by Carroll, Davies, and Richman (1971), whose
word-frequency study examined the reoccurrence of words in a five-million-word corpus of
running text. Knowing the frequency of words as they are used in written and oral
communication provided the best means of inferring the likelihood that a word would be
encountered by a reader and thus become a part of that individual’s receptive vocabulary.
Variables such as the average number of letters or syllables per word have been observed to be
proxies for word frequency. There is a strong negative correlation between the length of words
and the frequency of word usage. Polysyllabic words are used less frequently than monosyllabic
words, making word length a good proxy for the likelihood that an individual will be exposed to
a word.

Confidential—Not for Distribution
MetaMetrics—eMPower Reading Assessments - Lexile Linking Report—April 2017 Page 4
In a study examining receptive vocabulary, Stenner, Smith, and Burdick (1983) analyzed more
than 50 semantic variables in order to identify those elements that contributed to the difficulty of
the 350 vocabulary items on Forms L and M of the Peabody Picture Vocabulary Test—Revised
(Dunn and Dunn, 1981). Variables included part of speech, number of letters, number of
syllables, the modal grade at which the word appeared in school materials, content classification
of the word, the frequency of the word from two different word counts, and various algebraic
transformations of these measures.
The first word frequency measure used was the raw count of how often a given word appeared in
a corpus of 5,088,721 words sampled from a broad range of school materials (Carroll, Davies,
and Richman, 1971). For example, the word “accident” appears 176 times in the 5,088,721-word
corpus. The second word frequency measure used was the frequency of the “word family.” A
word family included: (1) the stimulus word; (2) all plurals (adding “-s” or “-es” or changing “-
y” to “-ies”); (3) adverbial forms; (4) comparatives and superlatives; (5) verb forms (“-s,” “-d,”
“-ed,” and “-ing”); (6) past participles; and (7) adjective forms. For example, the word family for
“accident” would include “accidental,” “accidentally,” “accidentals,” and “accidents,” and they
would all have the same word frequency of 334. The frequency of a word family was based on
the sum of the individual word frequencies from each of the types listed.
Correlations were computed between algebraic transformations of these means (mean frequency
of the words in the test item and mean frequency of the word families in the test item) and the
rank order of the test items. Since the items were ordered according to increasing difficulty, the
rank order was used as the observed item difficulty. The log of the mean word frequency
provided the strongest correlation with item rank order (r = -0.779) for the items on the
combined form.
The Lexile Framework currently employs a 600-million-word corpus when examining the
semantic component of text. This corpus was assembled from the more than 15,000 texts that
were measured by MetaMetrics for publishers from 1998 through 2002.
The Syntactic Component
Klare (1963) provides a possible interpretation for how sentence length works in predicting
passage difficulty. He speculated that the syntactic component varied with the load placed on
short-term memory. Crain and Shankweiler (1988), Shankweiler and Crain (1986), and
Liberman, Mann, Shankweiler, and Westelman (1982) have also supported this explanation. The
work of these individuals has provided evidence that sentence length is a good proxy for the
demand that structural complexity places upon verbal short-term memory.
While sentence length has been shown to be a powerful proxy for the syntactic complexity of a
passage, an important caveat is that sentence length is not the underlying causal influence (Chall,
1988). Researchers sometimes incorrectly assume that manipulation of sentence length will have
a predictable effect on passage difficulty. Davidson and Kantor (1982), for example, illustrated
rather clearly that sentence length can be reduced and difficulty increased and vice versa.
Confidential—Not for Distribution
MetaMetrics—eMPower Reading Assessments - Lexile Linking Report—April 2017 Page 5
Based on previous research, it was decided to use sentence length as a proxy for the syntactic
component of reading difficulty in the Lexile Framework.
Calibration of Text Difficulty
The research study on semantic units (Stenner, Smith, and Burdick, 1983) was extended to
examine the relationship of word frequency and sentence length to reading comprehension. In
1987(a), Stenner, Smith, Horabin, and Smith performed exploratory regression analyses to test
the explanatory power of these variables. This analysis involved calculating the mean word
frequency and the log of the mean sentence length for each of the 66 reading comprehension
passages on the Peabody Individual Achievement Test (Dunn and Markwardt, 1970). The
observed difficulty of each passage was the mean difficulty of the items associated with the
passage (provided by the publisher) converted to the logit scale. A regression analysis based on
the word-frequency and sentence-length measures produced a regression equation that explained
most of the variance found in the set of reading comprehension tasks. The resulting correlation
between the observed logit difficulties and the theoretical calibrations was 0.97 after correction
for range restriction and measurement error. The regression equation was further refined based
on its use in predicting the observed difficulty of the reading comprehension passages on 8 other
standardized tests. The resulting correlation between the observed logit difficulties and the
theoretical calibrations across the 9 tests was 0.93 after correction for range restriction and
measurement error.
Once a regression equation is established linking the syntactic and semantic features of text to
the difficulty of text, the equation can be used to calibrate test items and text. The result of the
research was a regression equation linking the syntactic and semantic features of text to the
difficulty of text. This equation can now be used to calibrate test items and text within the Lexile
Framework.
The Lexile Scale
In developing the Lexile Scale, the Rasch model (Wright and Stone, 1979) was used to estimate
the difficulties of the items and the abilities of the persons on the logit scale.
The calibrations of the items from the Rasch model are objective in the sense that the relative
difficulties of the items will remain the same across different samples of persons (specific
objectivity). When two items are administered to the same group it can be determined which
item is harder and which one is easier. This ordering should hold when the same two items are
administered to a second group. If two different items are administered to the second group,
there is no way to know which set of items is harder and which set is easier. The problem is that
the location of the scale is not known. General objectivity requires that scores obtained from
different test administrations be tied to a common zero—absolute location must be sample
independent (Stenner, 1990). To achieve general objectivity, the theoretical logit difficulties
must be transformed to a scale where the ambiguity regarding the location of zero is resolved.
Confidential—Not for Distribution
MetaMetrics—eMPower Reading Assessments - Lexile Linking Report—April 2017 Page 6
The first step in developing a scale with a fixed zero was to identify two anchor points for the
scale. The following criteria were used to select the two anchor points: they should be intuitive,
easily reproduced, and widely recognized. For example, with most thermometers the anchor
points are the freezing and boiling points of water. For the Lexile Scale, the anchor points are
text from seven basal primers for the low end and text from The Electronic Encyclopedia
(Grolier, Inc., 1986) for the high end. These points correspond to the middle of first grade text
and the midpoint of workplace text.
The next step was to determine the unit size for the scale. For the Celsius thermometer, the unit
size (a degree) is 1/100th
of the difference between freezing (0 degrees) and boiling (100 degrees)
water. For the Lexile Scale the unit size (a Lexile) was defined as 1/1000th
of the difference
between the mean difficulty of the primer material and the mean difficulty of the encyclopedia
samples. Therefore, a Lexile by definition equals 1/1000th
of the difference between the
difficulty of the primers and the difficulty of the encyclopedia.
The third step was to assign a value to the lower anchor point. The low-end anchor on the Lexile
Scale was assigned a value of 200.
Finally, a linear equation of the form
[(Logit + constant) CF] + 200 = Lexile text measure Equation (1)
was developed to convert logit difficulties to Lexile calibrations. The values of the conversion
factor (CF) and the constant were determined by substituting in the low-end anchor point and
then solving the system of equations.
The Lexile Scale ranges from below 200L to above 1600L. There is not an explicit bottom or top
to the scale, but rather two anchor points on the scale (described above) that describe different
levels of reading comprehension. The Lexile Map, a graphic representation of the Lexile Scale
from 200L to 1500L+, provides a context for understanding reading comprehension (see the
Appendix).
When text is analyzed by MetaMetrics, all electronic files are initially edited according to
established guidelines used with the Lexile Analyzer software. These guidelines include the
removal of all incomplete sentences, chapter titles, and paragraph headings; running of a spell
check; and re-punctuating where necessary to correspond to how the book would be read by a
child (for example, at the end of a page). The text is then submitted to the Lexile Analyzer that
examines the lengths of the sentences and the frequencies of the words and reports a Lexile
measure for the book. When enough additional texts have been analyzed to make an adjustment
to the corpus necessary and desirable, a linking study will be conducted to adjust the calibration
equation such that the Lexile measure of a text based on the current corpus will be equivalent to
the Lexile measure based on the new corpus.
Confidential—Not for Distribution
MetaMetrics—eMPower Reading Assessments - Lexile Linking Report—April 2017 Page 7
Validity of The Lexile Framework for Reading The 2014 Standards for Educational and Psychological Testing (America Educational Research
Association, American Psychological Association, and National Council on Measurement in
Education) states that “validity refers to the degree to which evidence and theory support the
interpretations of test scores for proposed uses of tests” (p. 11). In applying this definition to The
Lexile Framework for Reading, the question that should be asked is “What evidence supports the
use of the Lexile Framework to describe text complexity and reader ability?” Because the Lexile
Framework addresses reading comprehension, an important aspect of validity evidence that
should be brought to bear is evidence showing that the construct being addressed is indeed
reading comprehension. This type of validity evidence has traditionally been called construct
validity. One source of construct validity evidence for The Lexile Framework for Reading can be
evaluated by examining how well Lexile measures relate to other measures of reading ability and
reading comprehension.
Lexile Framework and other Measures of Reading Comprehension. The Lexile Framework has
been linked to numerous standardized tests of reading comprehension. When assessment scales
are linked, a common frame of reference can be used to interpret the test results. This frame of
reference can be “used to convey additional normative information, test-content information, and
information that is jointly normative and content-based. For many test uses, … [this frame of
reference] conveys information that is more crucial than the information conveyed by the
primary score scale” (Petersen, Kolen, and Hoover, 1989, p. 222). Linking the Lexile Framework
to other measures of reading comprehension produces a common frame of reference: the Lexile
measure.
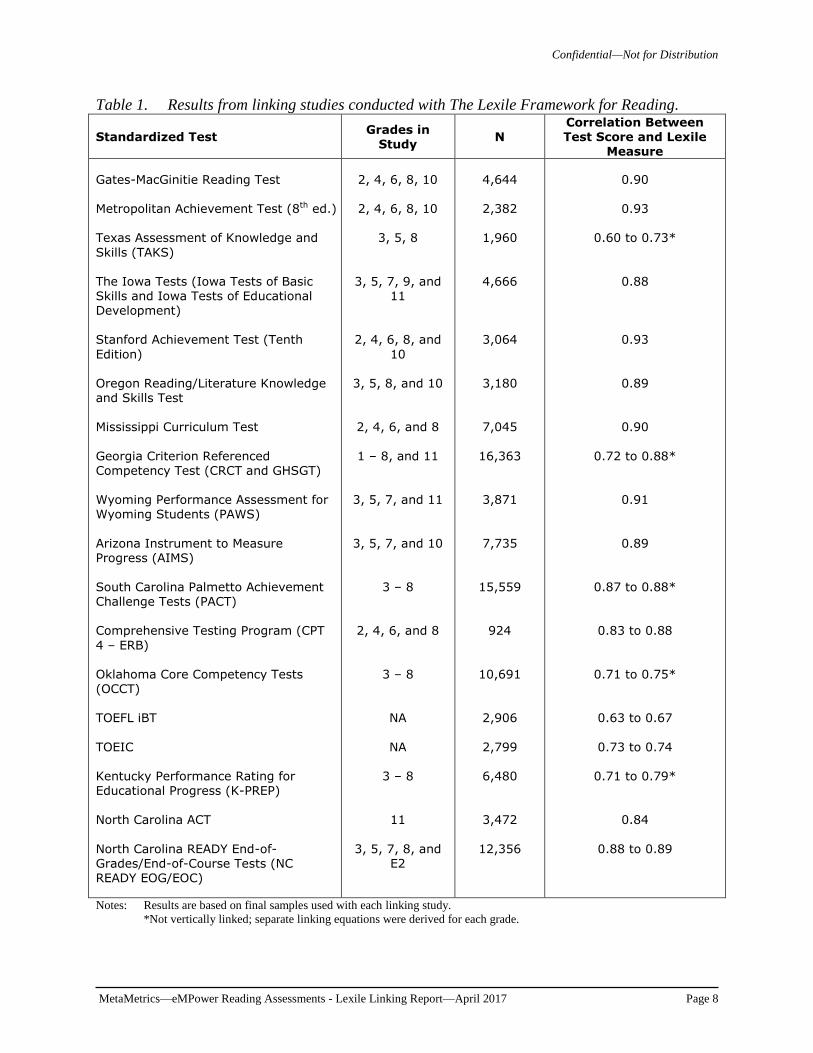
Table 1 presents the results from linking studies conducted with the Lexile Framework. In these
studies, students were administered a Lexile assessment and another assessment of reading
comprehension. There is a strong relationship between reading comprehension ability as
measured by the Lexile Framework and reading comprehension ability as measured by other
assessments. For each of the tests listed, student reading comprehension scores can also be
reported as Lexile measures. This dual reporting provides a rich, criterion-related frame of
reference for interpreting the standardized test scores. When a student takes one of the
standardized tests, in addition to receiving his norm-referenced test information, the student can
receive a reading list consisting of texts (books and articles) targeted to his specific reading level.
Confidential—Not for Distribution
MetaMetrics—eMPower Reading Assessments - Lexile Linking Report—April 2017 Page 8
Table 1. Results from linking studies conducted with The Lexile Framework for Reading.
Standardized Test Grades in
Study N
Correlation Between Test Score and Lexile
Measure
Gates-MacGinitie Reading Test Metropolitan Achievement Test (8th ed.) Texas Assessment of Knowledge and
Skills (TAKS) The Iowa Tests (Iowa Tests of Basic Skills and Iowa Tests of Educational Development) Stanford Achievement Test (Tenth
Edition) Oregon Reading/Literature Knowledge and Skills Test Mississippi Curriculum Test
Georgia Criterion Referenced Competency Test (CRCT and GHSGT) Wyoming Performance Assessment for Wyoming Students (PAWS)
Arizona Instrument to Measure Progress (AIMS)
South Carolina Palmetto Achievement Challenge Tests (PACT) Comprehensive Testing Program (CPT
4 – ERB) Oklahoma Core Competency Tests (OCCT) TOEFL iBT
TOEIC Kentucky Performance Rating for Educational Progress (K-PREP)
North Carolina ACT
North Carolina READY End-of-Grades/End-of-Course Tests (NC READY EOG/EOC)
2, 4, 6, 8, 10
2, 4, 6, 8, 10
3, 5, 8
3, 5, 7, 9, and 11
2, 4, 6, 8, and
10
3, 5, 8, and 10
2, 4, 6, and 8
1 – 8, and 11
3, 5, 7, and 11
3, 5, 7, and 10
3 – 8
2, 4, 6, and 8
3 – 8
NA
NA
3 – 8
11
3, 5, 7, 8, and
E2
4,644
2,382
1,960
4,666
3,064
3,180
7,045
16,363
3,871
7,735
15,559
924
10,691
2,906
2,799
6,480
3,472
12,356
0.90
0.93
0.60 to 0.73*
0.88
0.93
0.89
0.90
0.72 to 0.88*
0.91
0.89
0.87 to 0.88*
0.83 to 0.88
0.71 to 0.75*
0.63 to 0.67
0.73 to 0.74
0.71 to 0.79*
0.84
0.88 to 0.89
Notes: Results are based on final samples used with each linking study.
*Not vertically linked; separate linking equations were derived for each grade.
Confidential—Not for Distribution
MetaMetrics—eMPower Reading Assessments - Lexile Linking Report—April 2017 Page 9
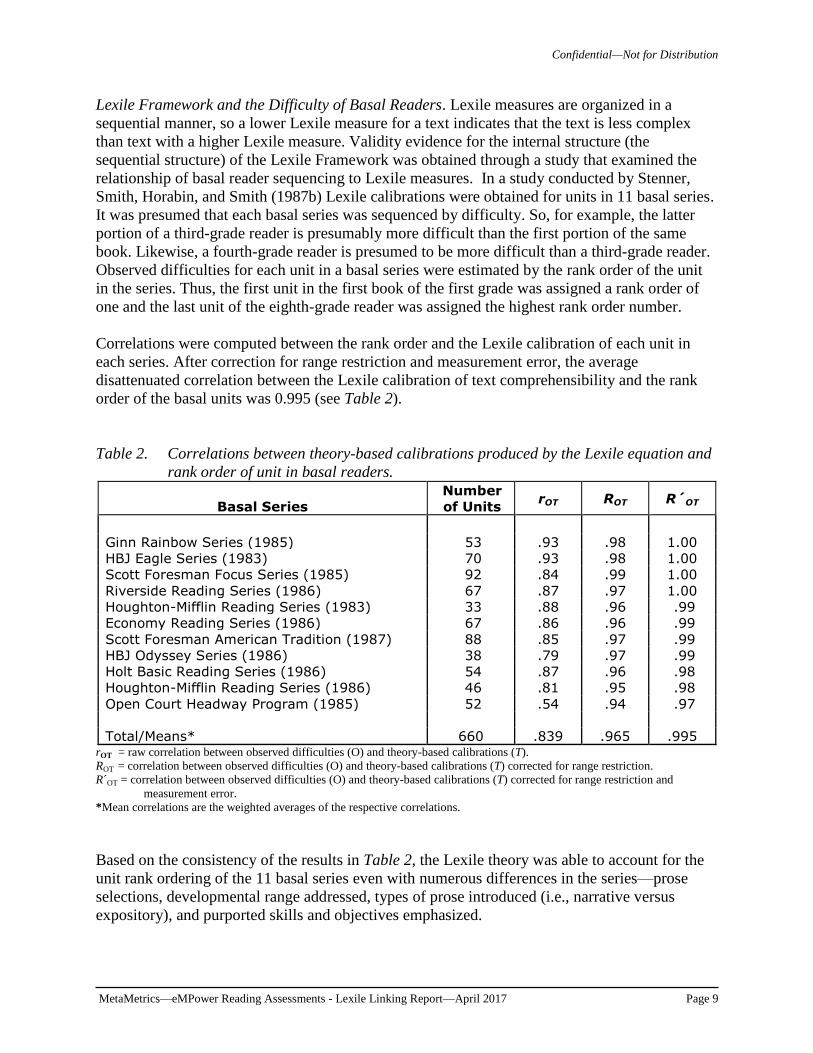
Lexile Framework and the Difficulty of Basal Readers. Lexile measures are organized in a
sequential manner, so a lower Lexile measure for a text indicates that the text is less complex
than text with a higher Lexile measure. Validity evidence for the internal structure (the
sequential structure) of the Lexile Framework was obtained through a study that examined the
relationship of basal reader sequencing to Lexile measures. In a study conducted by Stenner,
Smith, Horabin, and Smith (1987b) Lexile calibrations were obtained for units in 11 basal series.
It was presumed that each basal series was sequenced by difficulty. So, for example, the latter
portion of a third-grade reader is presumably more difficult than the first portion of the same
book. Likewise, a fourth-grade reader is presumed to be more difficult than a third-grade reader.
Observed difficulties for each unit in a basal series were estimated by the rank order of the unit
in the series. Thus, the first unit in the first book of the first grade was assigned a rank order of
one and the last unit of the eighth-grade reader was assigned the highest rank order number.
Correlations were computed between the rank order and the Lexile calibration of each unit in
each series. After correction for range restriction and measurement error, the average
disattenuated correlation between the Lexile calibration of text comprehensibility and the rank
order of the basal units was 0.995 (see Table 2).
Table 2. Correlations between theory-based calibrations produced by the Lexile equation and
rank order of unit in basal readers.
Basal Series
Number
of Units rOT ROT R´OT
Ginn Rainbow Series (1985) 53 .93 .98 1.00
HBJ Eagle Series (1983) 70 .93 .98 1.00
Scott Foresman Focus Series (1985) 92 .84 .99 1.00
Riverside Reading Series (1986) 67 .87 .97 1.00
Houghton-Mifflin Reading Series (1983) 33 .88 .96 .99
Economy Reading Series (1986) 67 .86 .96 .99
Scott Foresman American Tradition (1987) 88 .85 .97 .99
HBJ Odyssey Series (1986) 38 .79 .97 .99
Holt Basic Reading Series (1986) 54 .87 .96 .98
Houghton-Mifflin Reading Series (1986) 46 .81 .95 .98
Open Court Headway Program (1985) 52 .54 .94 .97
Total/Means* 660 .839 .965 .995 rOT = raw correlation between observed difficulties (O) and theory-based calibrations (T).
ROT = correlation between observed difficulties (O) and theory-based calibrations (T) corrected for range restriction.
R´OT = correlation between observed difficulties (O) and theory-based calibrations (T) corrected for range restriction and
measurement error.
*Mean correlations are the weighted averages of the respective correlations.
Based on the consistency of the results in Table 2, the Lexile theory was able to account for the
unit rank ordering of the 11 basal series even with numerous differences in the series—prose
selections, developmental range addressed, types of prose introduced (i.e., narrative versus
expository), and purported skills and objectives emphasized.

Confidential—Not for Distribution
MetaMetrics—eMPower Reading Assessments - Lexile Linking Report—April 2017 Page 10
Lexile Framework and the Difficulty of Reading Test Items. Additional construct validity
evidence was obtained by exploring the relationship between Lexile calibrations of item
difficulties and actual item difficulties of reading comprehension tests. In a study conducted by
Stenner, Smith, Horabin, and Smith (1987a), 1,780 reading comprehension test items appearing
on nine nationally-normed tests were analyzed. The study correlated empirical item difficulties
provided by the publishers with the Lexile calibrations specified by the computer analysis of the
text of each item. The empirical difficulties were obtained in one of three ways. Three of the
tests included observed logit difficulties from either a Rasch or three-parameter analysis (e.g.,
NAEP). For four of the tests, logit difficulties were estimated from item p-values and raw score
means and standard deviations (Poznanski, 1990; Wright, and Linacre, 1994). Two of the tests
provided no item parameters, but in each case items were ordered on the test in terms of
difficulty (e.g., PIAT). For these two tests, the empirical difficulties were approximated by the
difficulty rank order of the items. In those cases where multiple questions were asked about a
single passage, empirical item difficulties were averaged to yield a single observed difficulty for
the passage.
Once theory-specified calibrations and empirical item difficulties were computed, the two arrays
were correlated and plotted separately for each test. The plots were checked for unusual residual
distributions and curvature, and it was discovered that the Lexile equation did not fit poetry items
or noncontinuous prose items (e.g., recipes, menus, or shopping lists). This indicated that the
universe to which the Lexile equation could be generalized was limited to continuous prose. The
poetry and noncontinuous prose items were removed and correlations were recalculated. Table 3
contains the results of this analysis.
Table 3. Correlations between theory-based calibrations produced by the Lexile equation and
empirical item difficulties.
Test
Number
of
Questions
Number
of
Passages
Mean
SD
Range
Min
Max
rOT
ROT
R´OT
SRA 235 46 644 353 1303 33 1336 .95 .97 1.00 CAT-E 418 74 789 258 1339 212 1551 .91 .95 .98
Lexile 262 262 771 463 1910 –304 1606 .93 .95 .97 PIAT 66 66 939 451 1515 242 1757 .93 .94 .97 CAT-C 253 43 744 238 810 314 1124 .83 .93 .96 CTBS 246 50 703 271 1133 173 1306 .74 .92 .95 NAEP 189 70 833 263 1162 169 1331 .65 .92 .94 Battery 26 26 491 560 2186 –702 1484 .88 .84 .87
Mastery 85 85 593 488 2135 –586 1549 .74 .75 .77 Total/ Mean
1780 722 767 343 1441 50 1491 .84 .91 .93
rOT = raw correlation between observed difficulties (O) and theory-based calibrations (T).
ROT = correlation between observed difficulties (O) and theory-based calibrations (T) corrected for range restriction.
R´OT = correlation between observed difficulties (O) and theory-based calibrations (T) corrected for range restriction and
measurement error.
*Means are computed on Fisher Z transformed correlations.
Confidential—Not for Distribution
MetaMetrics—eMPower Reading Assessments - Lexile Linking Report—April 2017 Page 11
The last three columns in Table 3 show the raw correlation between observed (O) item
difficulties and theoretical (T) item calibrations, with the correlations corrected for restriction in
range and measurement error. The Fisher Z mean of the raw correlations (rOT
) is 0.84. When
corrections are made for range restriction and measurement error, the Fisher Z mean
disattenuated correlation between theory-based calibration and empirical difficulty in an
unrestricted group of reading comprehension items (R´OT) is 0.93. These results show that most
attempts to measure reading comprehension, no matter what the item form, type of skill or
objectives assessed, or item type used, measure a common comprehension factor specified by the
Lexile theory.
Text Measure Error Associated with the Lexile Framework
To determine a Lexile measure for a text, the standard procedure is to process the entire text. All
pages in the work are concatenated into an electronic file that is processed by a software package
called the Lexile Analyzer (developed by MetaMetrics, Inc.). The analyzer “slices” the text file
into as many 125-word passages as possible, analyzes the set of slices, and then calibrates each
slice in terms of the logit metric. That set of calibrations is then processed to determine the
Lexile measure corresponding to a 75% comprehension rate. The analyzer uses the slice
calibrations as test item calibrations and then solves for the measure corresponding to a raw
score of 75% (e.g., 30 out of 40 correct, as if the slices were test items). The Lexile Analyzer
automates this process, but what “certainty” can be attached to each text measure?
Using a bootstrap procedure to examine error due to the text samples, the above analysis could
be repeated (Efron, 1981; Sitter, 1992). The result would be an identical text measure to the first
because there is no sampling error when a complete text is calibrated.
There is, however, another source of error that increases the uncertainty about where a text is
located on the Lexile Map. The Lexile theory is imperfect in its calibration of the difficulty of
individual text slices. To examine this source of error, 200 items that had been previously
calibrated and shown to fit the model were administered to 3,026 students in Grades 2 through
12 in a large urban school district. For each item the observed item difficulty calibrated from the
Rasch model was compared with the theoretical item difficulty calibrated from the regression
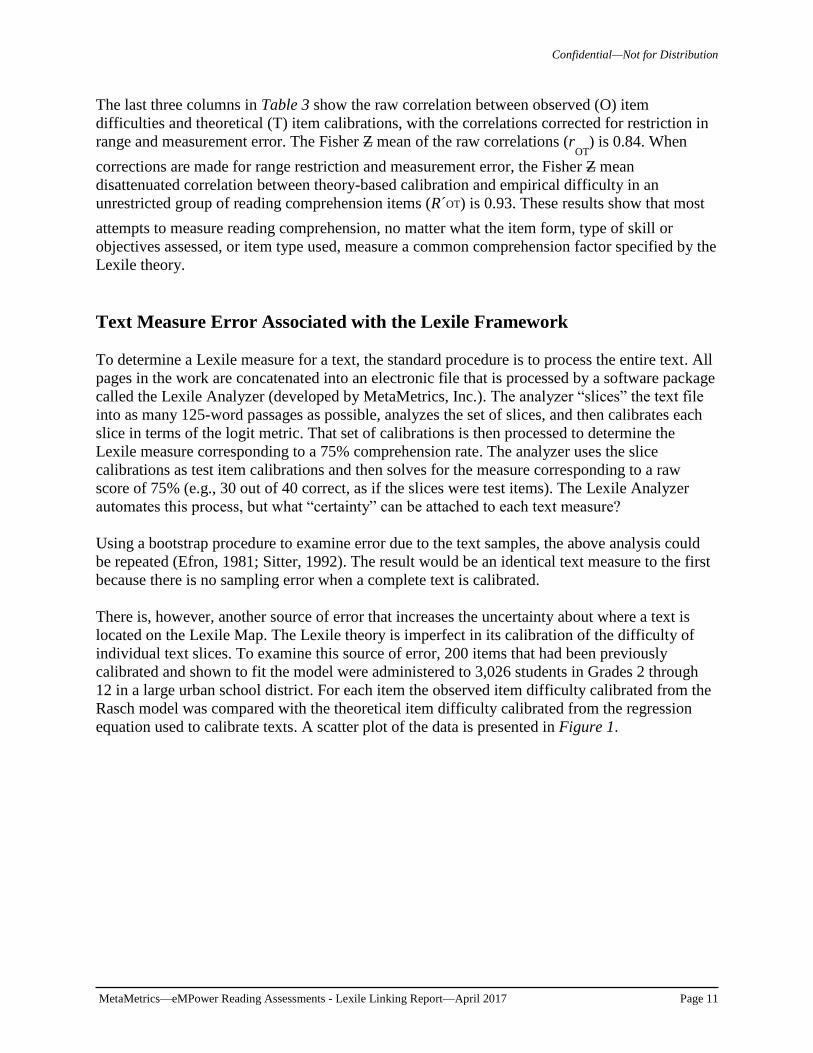
equation used to calibrate texts. A scatter plot of the data is presented in Figure 1.

Confidential—Not for Distribution
MetaMetrics—eMPower Reading Assessments - Lexile Linking Report—April 2017 Page 12
Figure 1. Scatter plot between observed item difficulty and theoretical item difficulty.
The correlation between the observed and the theoretical calibrations for the 200 items was 0.92
and the root mean square error was 178L. Therefore, for an individual slice of text the
measurement error is 178L.
The standard error of measurement associated with a text is a function of the error associated
with one slice of text (178L) and the number of slices that are calibrated from a text. Very short
books have larger uncertainties than longer books. A book with only four slices would have an
uncertainty of 89L whereas a longer book such as War and Peace (4,082 slices of text) would
only have an uncertainty of 3L (Table 4).
Table 4. Standard errors for selected values of the length of the text.
Title Number
of Slices
Text Measure Standard
Error of Text
The Stories Julian Tells 46 520L 26
Bunnicula 102 710L 18
The Pizza Mystery 137 620L 15
Meditations of First Philosophy 206 1720L 12
Metaphysics of Morals 209 1620L 12
Adventures of Pinocchio 294 780L 10
Red Badge of Courage 348 900L 10
Scarlet Letter 597 1420L 7
Pride and Prejudice 904 1100L 6
Decameron 2431 1510L 4
War and Peace 4082 1200L 3
A typical Grade 3 reading test has approximately 2,000 words in the passages. To calibrate this
text, it would be sliced into 16 125-word passages. The error associated with this text measure
would be 45L. A typical Grade 7 reading test has approximately 3,000 words in the passages and
-500
0
500
1000
1500
2000
-500 0 500 1000 1500 2000Ob
se
rve
d Ite
m D
ifficu
lty
Theoretical Item Difficulty

Confidential—Not for Distribution
MetaMetrics—eMPower Reading Assessments - Lexile Linking Report—April 2017 Page 13
the error associated with the text measure would be 36L. A typical Grade 10 reading test has
approximately 4,000 words in the passages and the error associated with the text measure would
be 30L.
The Find A Book (www.Lexile.com) contains information about each book analyzed: author,
Lexile measure and Lexile Code, awards, ISBN, and developmental level as determined by the
publisher. Information concerning the length of a book and the extent of illustrations—factors
that affect a reader’s perception of the difficultly of a book—can be obtained from MetaMetrics.
Lexile Item Bank
The Lexile Item Bank contains over 10,000 items that have been developed since 1986 for
research purposes with the Lexile Framework.
Passage Selection. Passages selected for use are selected from “real world” reading materials
that students may encounter both in and out of the classroom. Sources include textbooks,
literature, and periodicals from a variety of interest areas and material written by authors of
different backgrounds. The following criteria are used to select passages:
• the passage must develop one main idea or contain one complete piece of information;
• understanding of the passage is independent of the information that comes before or after
the passage in the source text; and
• understanding of the passage is independent of prior knowledge not contained in the
passage.
With the aid of a computer program, item writers develop native-Lexile items by examining
blocks of text (minimum of three sentences) that are calibrated to be within 100L of the source
text. From these blocks of text item writers are asked to select four to five that could be
developed as items. If it is necessary to shorten or lengthen the passage in order to meet the
criteria for passage selection, the item writer can immediately recalibrate the text to ensure that it
is still targeted within 100L of the complete text (source targeting).
Item Format. The native-Lexile item format is an embedded completion task. The embedded
completion format is similar to the fill-in-the-blank format. When properly written, this format
directly assesses the reader’s ability to draw inferences and establish logical connections between
the ideas in the passage (Haladyna, 1994). The reader is presented with a passage of
approximately 30 to 150 words in length. The passages are shorter for beginning readers and
longer for more advanced readers. The passage is then response illustrated (a statement is added
at the end of the passage with a missing word or phrase followed by four options). From the four
presented options, the reader is asked to select the “best” option that completes the statement.
With this format, all options are semantically and syntactically appropriate completions of the
sentence, but one option is unambiguously the “best” option when considered in the context of
the passage.
Confidential—Not for Distribution
MetaMetrics—eMPower Reading Assessments - Lexile Linking Report—April 2017 Page 14
The statement portion of the embedded completion item can assess a variety of skills related to
reading comprehension: paraphrase information in the passage, draw a logical conclusion based
on the information in the passage, make an inference, identify a supporting detail, or make a
generalization based on the information in the passage. The statement is written to ensure that by
reading and comprehending the passage the reader is able to select the correct option. When the
embedded completion statement is read by itself, each of the four options is plausible.
Item Writer Training. Item writers are classroom teachers and other educators who have had
experience with the everyday reading ability of students at various levels. The use of individuals
with these types of experiences helps to ensure that the items are valid measures of reading
comprehension. Item writers are provided with training materials concerning the embedded
completion item format and guidelines for selecting passages, developing statements, and
selecting options. The item writing materials also contain incorrect items that illustrate the
criteria used to evaluate items and corrections based on those criteria. The final phase of item
writer training is a short practice session with three items. Item writers are provided vocabulary
lists to use during statement and option development. The vocabulary lists were compiled from
spelling books one grade level below the level where the item would typically be used. The
rationale was that these words should be part of a reader’s “working” vocabulary since they had
been learned the previous year.
Item writers are also given extensive training related to “sensitivity” issues. Part of the item
writing materials address these issues and identify areas to avoid when selecting passages and
developing items. The following areas are covered: violence and crime, depressing
situations/death, offensive language, drugs/alcohol/tobacco, sex/attraction, race/ethnicity, class,
gender, religion, supernatural/magic, parent/family, politics, animals/environment, and brand
names/junk food. These materials were developed based on material published by McGraw-Hill
(Guidelines for Bias-Free Publishing, 1983). This publication discusses the equal treatment of
the sexes, fair representation of minority groups, and the fair representation of disabled
individuals.
Item Review. All items are subjected to a two-stage review process. First, items are reviewed and
edited by an editor according to the 19 criteria identified in the item writing materials and for
sensitivity issues. Approximately 25% of the items developed are deleted for various reasons.
Where possible items are edited and maintained in the item bank.
Items are then reviewed and edited by a group of specialists that represent various perspectives—
test developers, editors, and curriculum specialists. These individuals examine each item for
sensitivity issues and for the quality of the response options. During the second stage of the item
review process, items are either “approved as presented,” “approved with edits,” or “deleted.”
Approximately 10% of the items written are “approved with edits” or “deleted” at this stage.
When necessary, item writers receive additional on-going feedback and training.
Item Analyses. As part of the linking studies and research studies conducted by MetaMetrics,
items in the Lexile Item Bank are evaluated in terms of difficulty (relationship between logit
[observed Lexile measure] and theoretical Lexile measure), internal consistency (point-biserial
Confidential—Not for Distribution
MetaMetrics—eMPower Reading Assessments - Lexile Linking Report—April 2017 Page 15
correlation), and bias (ethnicity and gender where possible). Where necessary, items are deleted
from the item bank or revised and recalibrated.
During the spring of 1999, 8 levels of a Lexile assessment were administered in a large urban
school district to students in Grades 1 through 12. The 8 test levels were administered in Grades
1, 2, 3, 4, 5, 6, 7-8, and 9-12 and ranged from 40 to 70 items depending on the grade level. A
total of 427 items were administered across the 8 test levels. Each item was answered by at least
9,000 students (the number of students per level ranged from 9,286 in grade 2 to 19,056 in
grades 9-12). The item responses were submitted to a Winsteps Rasch analysis. The resulting
item difficulties (in logits) were assigned Lexile measures by multiplying by 180 and anchoring
each set of items to the mean theoretical difficulty of the items on the form.

Confidential—Not for Distribution
MetaMetrics—eMPower Reading Assessments - Lexile Linking Report—April 2017 Page 16
Confidential—Not for Distribution
MetaMetrics—eMPower Reading Assessments - Lexile Linking Report—April 2017 Page 17
The eMPower Reading Assessments—Lexile Framework
Linking Process
Description of the Assessments
eMPower Reading Assessments. eMPower Assessments developed by Measured Progress is an
assessment program designed for Grades 3 through 8 (Measured Progress, 2017). eMPower
Assessments are vertically scaled and designed to measure student knowledge and growth in
reading, writing and language, and mathematics. eMPower Assessments are aligned to the
Measured Progress college and career readiness standards, which are based on those authored by
the National Governors’ Association (NGA) and the Council of Chief State School Officers
(CCSSO) (Measured Progress, 2017). Scores at Grade 8 are reported on the eMPower vertical
scale as well as the scale used by the SAT® Suite of Assessments, providing an early indicator of
a student’s college and career readiness (Measured Progress, 2017). eMPower Assessments are
available during three administration periods: fall, winter, and spring. Fall interim
administrations assess previous grades’ concepts and skills as well as concepts and skills taught
at the beginning of the school year. Winter interim administrations assess grade-level concepts
and skills and can help monitor students’ progress. Spring interim administrations assess
students’ achievement and can serve as the foundation of a state’s accountability system.
The eMPower Reading Assessments are designed to assess reading standards associated with
reading comprehension, analysis, and interpreting complex literary and informational text.
Grades 3 through 5 primarily focus on literary text, while Grades 6 through 8 primarily focus on
informational text. Passages within the assessment are evaluated on text complexity metrics and
grade-level appropriateness.
The linking study focused on developing a link between the eMPower Reading Assessments
scale scores and The Lexile Framework for Reading. The eMPower Reading Assessments
measure a student’s ability to comprehend, analyze, and interpret complex text. Items used to
assess these skills include selected-response, (including multiple-choice and multiple select) and
evidence-based selected response, as well as, constructed response and/or technology enhanced
items. The total number of operational points is 26 at each grade.
Measured Progress developed the eMPower Reading Assessments scale using the 3-parameter
logistic model (3PL). Scores on the eMPower Reading Assessments are reported on a vertical
scale ranging from 204 to 1000.
The Lexile Framework for Reading. The Lexile Framework is a tool that helps teachers, parents,
and students locate appropriate reading materials. Text complexity (difficulty) and reader ability
are measured in the same unit—the Lexile. Text complexity is determined by examining such
characteristics as word frequency and sentence length. Items and text are calibrated using the
Rasch model. The typical range of the Lexile Scale is from 200L to 1600L, although actual
Lexile measures can range from below zero (BR400L) to above 1600L (see the discussion on
page 42 for more information).
Confidential—Not for Distribution
MetaMetrics—eMPower Reading Assessments - Lexile Linking Report—April 2017 Page 18
The multiple-choice items used with the Lexile Framework measure reading ability by focusing
on skills readers use when studying written materials sampled from various content areas
including both literary and informational text. Each test item consists of a passage that is
response-illustrated (a statement is added at the end of the passage with a missing word or phrase
followed by four options, or distractors). The skills measured by these items include referring to
details in the passage, drawing conclusions, and making comparisons and generalizations. Lexile
items do not require prior knowledge of ideas outside of the passage, vocabulary taken out of
context, or formal logic.
The Lexile item pool for the eMPower Reading Assessments linking study was developed for
administration to students in Grades 3 through 8. MetaMetrics provided Measured Progress with
45 linking items per grade organized into 3 groups of 7 items and 3 groups of 8 items for
administration as part of the eMPower Assessments online test administration. Each grade-level
pool contained a range of items varying in complexity, but all were within the typical range of
complexity based on grade-level norms. The item pools also contained a number of common
items across adjacent grades to provide connectivity across grades. The range of item complexity
for each grade-level item pool and the grade-level item Lexile measure mean were determined by
examining national normative data and information from previously administered Lexile Linking
Tests. The mean Lexile measures for each item pool were as follows: Grade 3, 570L; Grade 4,
758L; Grade 5, 865L; Grade 6, 946L; Grade 7, 992L; and Grade 8, 1050L.
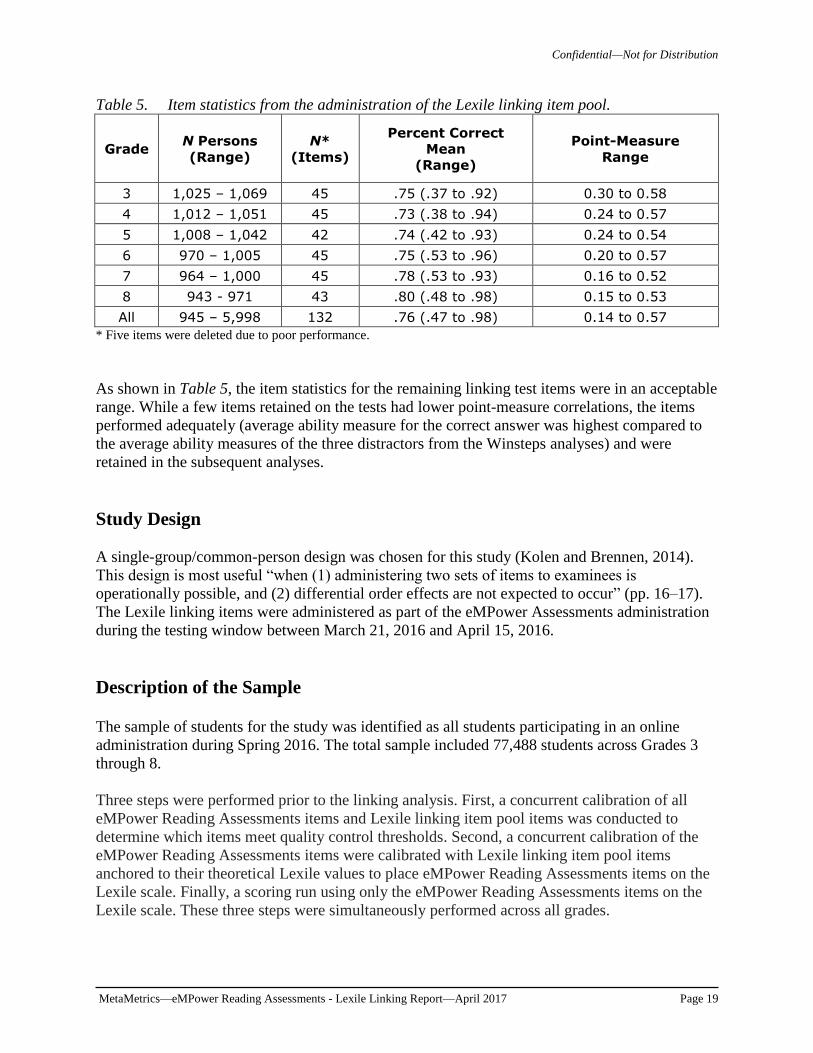
Evaluation of Lexile Linking Item Pool Items. After administration, the Lexile linking items were
reviewed. Selected item statistics for the Lexile linking item pool are presented in Table 7. The
number of students taking each Lexile linking item varied by grade with the lowest minimum in
Grade 8 with 943 students and the highest maximum in Grade 3 with 1,069 students. A number
of common items were administered across grades to establish connectivity throughout the
vertical scale. As a result, the number of persons per item is much higher in the "Total"
maximum number than in the individual grades. All items were submitted to a Winsteps analysis
(Linacre, 2011) and were reviewed and evaluated for use in the linking study based on item
difficulty or potential alternate answer choices being more attractive than the correct answer
choice (i.e. low point-measure correlation). Five items were flagged for removal based on these
criteria. The remaining Lexile linking items passed quality control thresholds and were retained
for further analysis.
Confidential—Not for Distribution
MetaMetrics—eMPower Reading Assessments - Lexile Linking Report—April 2017 Page 19
Table 5. Item statistics from the administration of the Lexile linking item pool.
Grade N Persons
(Range)
N*
(Items)
Percent Correct
Mean
(Range)
Point-Measure
Range
3 1,025 – 1,069 45 .75 (.37 to .92) 0.30 to 0.58
4 1,012 – 1,051 45 .73 (.38 to .94) 0.24 to 0.57
5 1,008 – 1,042 42 .74 (.42 to .93) 0.24 to 0.54
6 970 – 1,005 45 .75 (.53 to .96) 0.20 to 0.57
7 964 – 1,000 45 .78 (.53 to .93) 0.16 to 0.52
8 943 - 971 43 .80 (.48 to .98) 0.15 to 0.53
All 945 – 5,998 132 .76 (.47 to .98) 0.14 to 0.57
* Five items were deleted due to poor performance.
As shown in Table 5, the item statistics for the remaining linking test items were in an acceptable
range. While a few items retained on the tests had lower point-measure correlations, the items
performed adequately (average ability measure for the correct answer was highest compared to
the average ability measures of the three distractors from the Winsteps analyses) and were
retained in the subsequent analyses.
Study Design
A single-group/common-person design was chosen for this study (Kolen and Brennen, 2014).
This design is most useful “when (1) administering two sets of items to examinees is
operationally possible, and (2) differential order effects are not expected to occur” (pp. 16–17).
The Lexile linking items were administered as part of the eMPower Assessments administration
during the testing window between March 21, 2016 and April 15, 2016.
Description of the Sample The sample of students for the study was identified as all students participating in an online
administration during Spring 2016. The total sample included 77,488 students across Grades 3
through 8.
Three steps were performed prior to the linking analysis. First, a concurrent calibration of all
eMPower Reading Assessments items and Lexile linking item pool items was conducted to
determine which items meet quality control thresholds. Second, a concurrent calibration of the
eMPower Reading Assessments items were calibrated with Lexile linking item pool items
anchored to their theoretical Lexile values to place eMPower Reading Assessments items on the
Lexile scale. Finally, a scoring run using only the eMPower Reading Assessments items on the
Lexile scale. These three steps were simultaneously performed across all grades.
Confidential—Not for Distribution
MetaMetrics—eMPower Reading Assessments - Lexile Linking Report—April 2017 Page 20
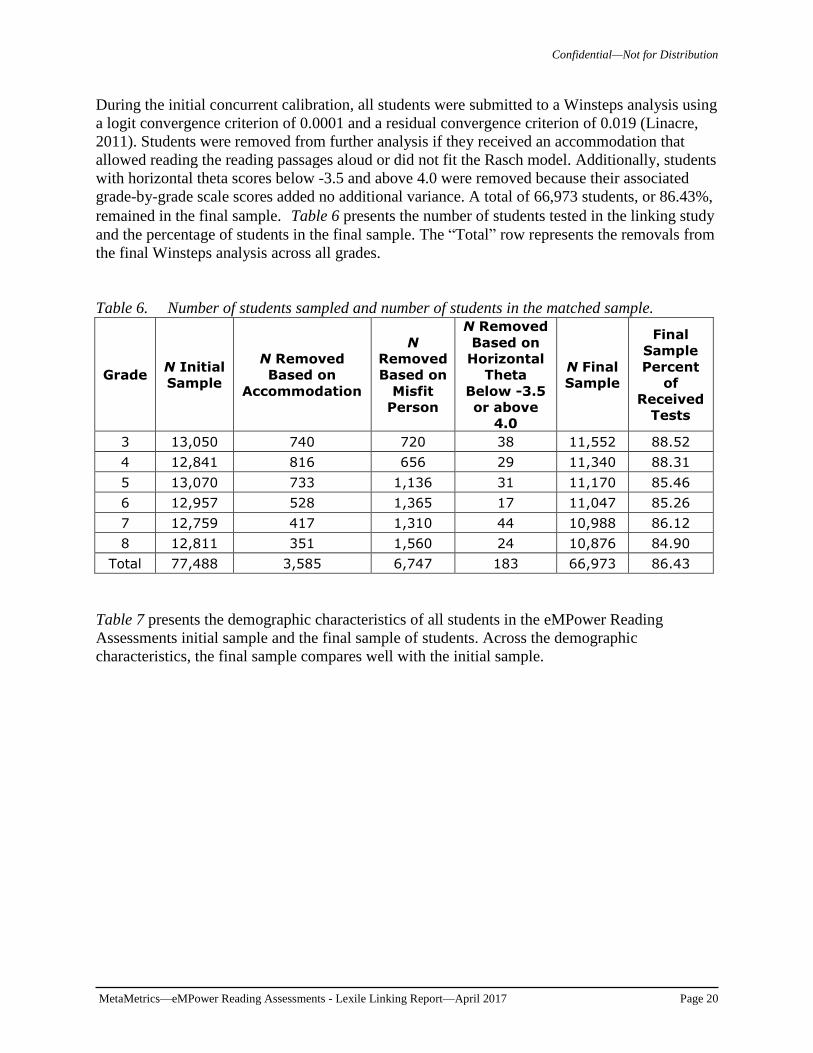
During the initial concurrent calibration, all students were submitted to a Winsteps analysis using
a logit convergence criterion of 0.0001 and a residual convergence criterion of 0.019 (Linacre,
2011). Students were removed from further analysis if they received an accommodation that
allowed reading the reading passages aloud or did not fit the Rasch model. Additionally, students
with horizontal theta scores below -3.5 and above 4.0 were removed because their associated
grade-by-grade scale scores added no additional variance. A total of 66,973 students, or 86.43%,
remained in the final sample. Table 6 presents the number of students tested in the linking study
and the percentage of students in the final sample. The “Total” row represents the removals from
the final Winsteps analysis across all grades.
Table 6. Number of students sampled and number of students in the matched sample.
Grade N Initial
Sample
N Removed
Based on
Accommodation
N
Removed
Based on
Misfit
Person
N Removed
Based on
Horizontal
Theta
Below -3.5
or above
4.0
N Final
Sample
Final
Sample
Percent
of
Received
Tests
3 13,050 740 720 38 11,552 88.52
4 12,841 816 656 29 11,340 88.31
5 13,070 733 1,136 31 11,170 85.46
6 12,957 528 1,365 17 11,047 85.26
7 12,759 417 1,310 44 10,988 86.12
8 12,811 351 1,560 24 10,876 84.90
Total 77,488 3,585 6,747 183 66,973 86.43
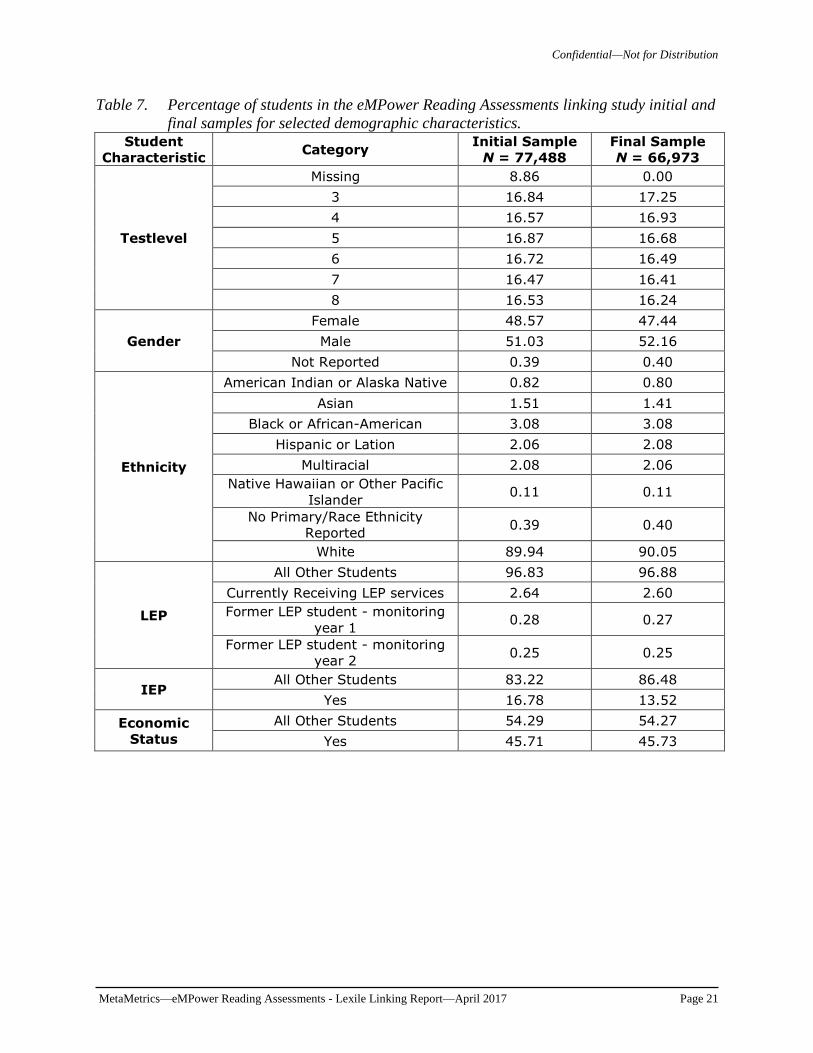
Table 7 presents the demographic characteristics of all students in the eMPower Reading
Assessments initial sample and the final sample of students. Across the demographic
characteristics, the final sample compares well with the initial sample.
Confidential—Not for Distribution
MetaMetrics—eMPower Reading Assessments - Lexile Linking Report—April 2017 Page 21
Table 7. Percentage of students in the eMPower Reading Assessments linking study initial and
final samples for selected demographic characteristics. Student
Characteristic Category
Initial Sample
N = 77,488
Final Sample
N = 66,973
Testlevel
Missing 8.86 0.00
3 16.84 17.25
4 16.57 16.93
5 16.87 16.68
6 16.72 16.49
7 16.47 16.41
8 16.53 16.24
Gender
Female 48.57 47.44
Male 51.03 52.16
Not Reported 0.39 0.40
Ethnicity
American Indian or Alaska Native 0.82 0.80
Asian 1.51 1.41
Black or African-American 3.08 3.08
Hispanic or Lation 2.06 2.08
Multiracial 2.08 2.06
Native Hawaiian or Other Pacific
Islander 0.11 0.11
No Primary/Race Ethnicity
Reported 0.39 0.40
White 89.94 90.05
LEP
All Other Students 96.83 96.88
Currently Receiving LEP services 2.64 2.60
Former LEP student - monitoring
year 1 0.28 0.27
Former LEP student - monitoring
year 2 0.25 0.25
IEP All Other Students 83.22 86.48
Yes 16.78 13.52
Economic
Status
All Other Students 54.29 54.27
Yes 45.71 45.73

Confidential—Not for Distribution
MetaMetrics—eMPower Reading Assessments - Lexile Linking Report—April 2017 Page 22
Table 8 presents the descriptive statistics from the final sample for the eMPower Reading
Assessments scale scores as well as the Lexile measures using the calibrated eMPower Reading
Assessments items.
Table 8. Descriptive statistics for the eMPower Reading Assessments scale score and Lexile
measure, matched sample (N = 66,973).
Grade N
eMPower Reading
Scale Score
Mean (SD)
eMPower Reading
Calibrated Lexile
Measure Mean (SD)
r
3 11,552 523 (70.7) 642L (189.0) 0.99
4 11,340 560 (72.4) 798L (164.3) 0.99
5 11,170 588 (74.0) 885L (183.1) 0.99
6 11,047 604 (79.2) 1014L (176.7) 0.99
7 10,988 615 (86.3) 1074L (165.3) 0.98
8 10,876 639 (84.0) 1161L (191.0) 0.99
All 66,973 587 (86.8) 925L (250.3) 0.94
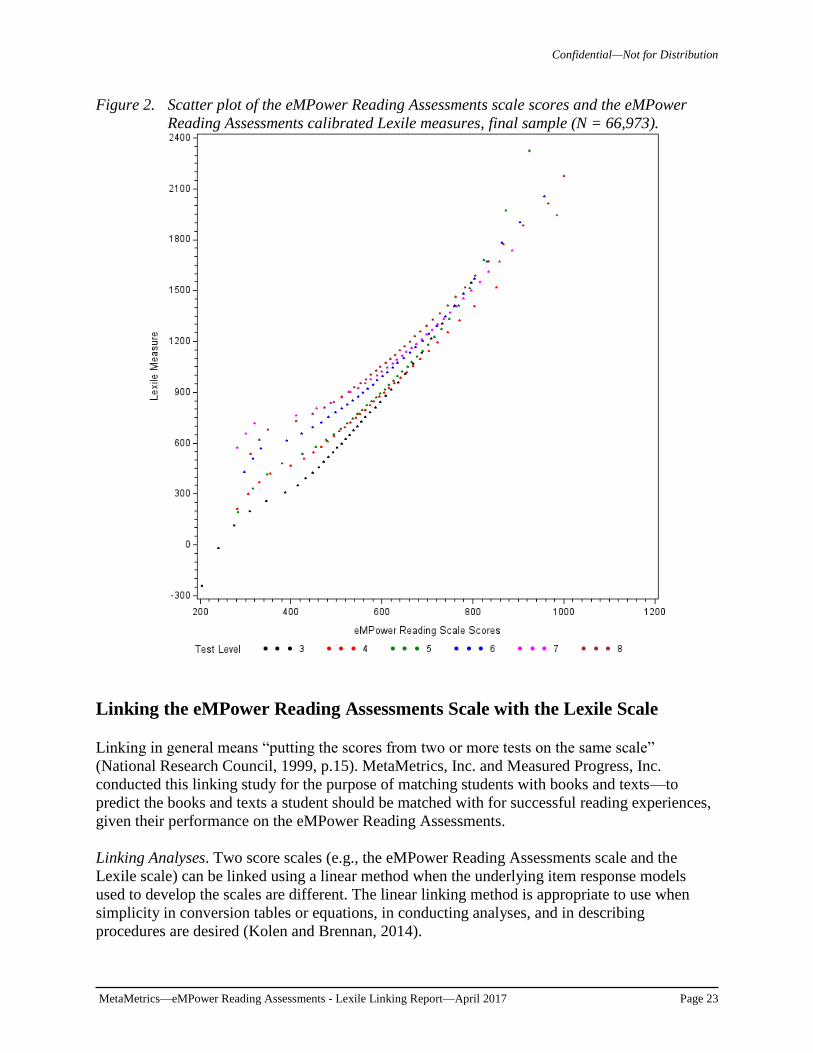
Figure 2 shows the relationship between the eMPower Reading Assessments scale scores and the
Lexile measures from the item calibration for the final sample. It can be seen that there is a linear
relationship between the eMPower Reading Assessments scale scores and the eMPower
calibrated Lexile measures. Although there is some heteroscedasticity present in the lower end of
the distribution, the number of students represented in this portion of the distribution is
approximately 10% of the sample. Given that the majority of student scores are located in the
remainder of the distribution, which is linear in nature, a linear linking process is reasonable to
apply to construct the linkage between the two scales.
Confidential—Not for Distribution
MetaMetrics—eMPower Reading Assessments - Lexile Linking Report—April 2017 Page 23
Figure 2. Scatter plot of the eMPower Reading Assessments scale scores and the eMPower
Reading Assessments calibrated Lexile measures, final sample (N = 66,973).
Linking the eMPower Reading Assessments Scale with the Lexile Scale Linking in general means “putting the scores from two or more tests on the same scale”
(National Research Council, 1999, p.15). MetaMetrics, Inc. and Measured Progress, Inc.
conducted this linking study for the purpose of matching students with books and texts—to
predict the books and texts a student should be matched with for successful reading experiences,
given their performance on the eMPower Reading Assessments.
Linking Analyses. Two score scales (e.g., the eMPower Reading Assessments scale and the
Lexile scale) can be linked using a linear method when the underlying item response models
used to develop the scales are different. The linear linking method is appropriate to use when
simplicity in conversion tables or equations, in conducting analyses, and in describing
procedures are desired (Kolen and Brennan, 2014).

Confidential—Not for Distribution
MetaMetrics—eMPower Reading Assessments - Lexile Linking Report—April 2017 Page 24
In linear linking, a transformation is chosen such that scores on two sets of items are considered
to be linked if they correspond to the same number of standard deviations above (or below) the
mean in some group of examinees (Angoff, 1984, cited in Petersen, Kolen, and Hoover, 1989;
Kolen and Brennan, 2014). Given scores x and y on tests X and Y, the linear relationship is
yX
X y
yx
Equation (2)
and the linear transformation lx (called the SD line in this report) used to transform scores on test
Y to scores on text X is
( )y XX
x x
y y
x l y y Equation (3)
Linear linking by definition has the same mean and standard deviation for the overall equation
when the scale is vertically aligned. Linear linking using an SD-line approach is preferable to
linear regression because the tests are not perfectly correlated. With less than perfectly reliable
tests, linear regression is dependent on which way the regression is conducted: predicting scores
on test X from scores on test Y or predicting scores on test Y from scores on test X. The SD line
provides the symmetric linking function that is desired.
The final linking equation between the eMPower Reading Assessments scale scores and the
Lexile measures can be written as:
Lexile measure = Slope (eMPower Reading scale score) + intercept Equation (4)
where the slope is the ratio of the standard deviation of the calibrated Lexile measures to the
standard deviation of the eMPower Reading Assessments scale scores.
Using the final sample data described in Table 8, the linear linking function relating the
eMPower Reading Assessments scale scores and Lexile measures was established. Because the
eMPower Reading Assessments reports scores on a vertical scale, one linking function was
developed for all grades. The slope and intercept for the linking equation are shown in Table 9.
Table 9. Linear linking equation coefficients used to predict Lexile measures from the
eMPower Reading Assessments scale scores.
Grade Slope Intercept
3 - 8 2.8854775 -769.434723
Confidential—Not for Distribution
MetaMetrics—eMPower Reading Assessments - Lexile Linking Report—April 2017 Page 25
Conversion tables were developed for all grade levels in order to express the eMPower Reading
Assessments scale scores in the Lexile metric and were delivered to Measured Progress in
electronic format.
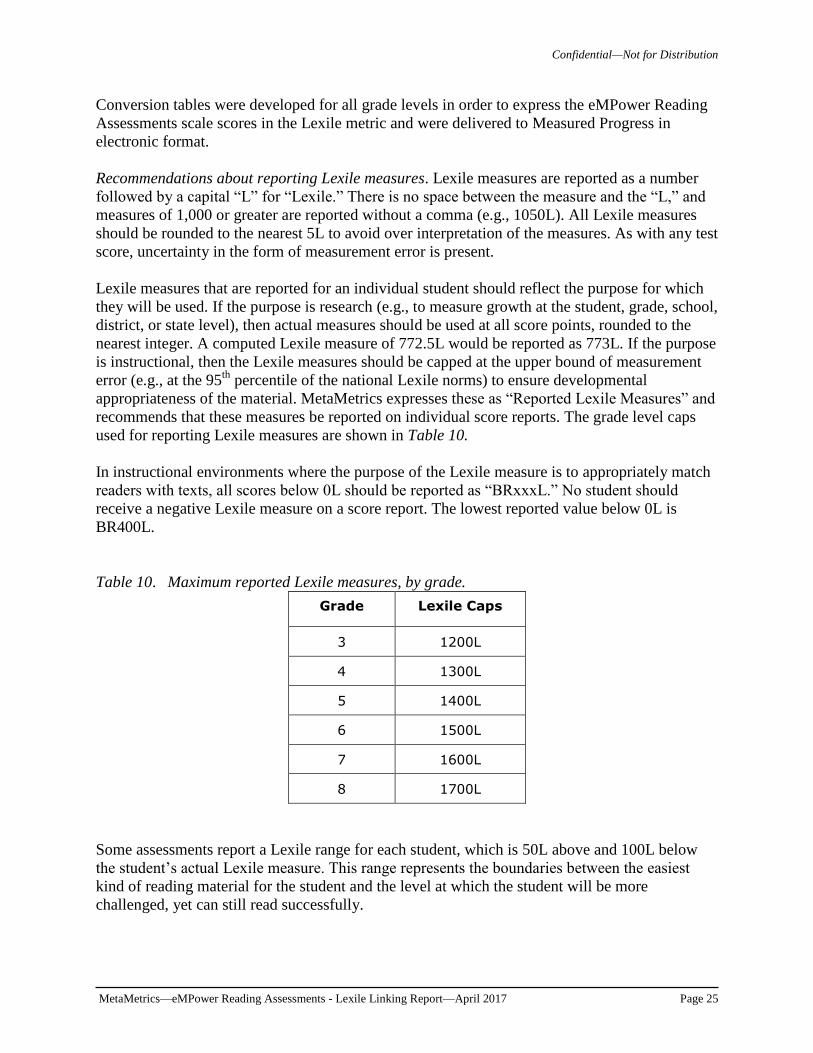
Recommendations about reporting Lexile measures. Lexile measures are reported as a number
followed by a capital “L” for “Lexile.” There is no space between the measure and the “L,” and
measures of 1,000 or greater are reported without a comma (e.g., 1050L). All Lexile measures
should be rounded to the nearest 5L to avoid over interpretation of the measures. As with any test
score, uncertainty in the form of measurement error is present.
Lexile measures that are reported for an individual student should reflect the purpose for which
they will be used. If the purpose is research (e.g., to measure growth at the student, grade, school,
district, or state level), then actual measures should be used at all score points, rounded to the
nearest integer. A computed Lexile measure of 772.5L would be reported as 773L. If the purpose
is instructional, then the Lexile measures should be capped at the upper bound of measurement
error (e.g., at the 95th
percentile of the national Lexile norms) to ensure developmental
appropriateness of the material. MetaMetrics expresses these as “Reported Lexile Measures” and
recommends that these measures be reported on individual score reports. The grade level caps
used for reporting Lexile measures are shown in Table 10.
In instructional environments where the purpose of the Lexile measure is to appropriately match
readers with texts, all scores below 0L should be reported as “BRxxxL.” No student should
receive a negative Lexile measure on a score report. The lowest reported value below 0L is
BR400L.
Table 10. Maximum reported Lexile measures, by grade.
Grade Lexile Caps
3 1200L
4 1300L
5 1400L
6 1500L
7 1600L
8 1700L
Some assessments report a Lexile range for each student, which is 50L above and 100L below
the student’s actual Lexile measure. This range represents the boundaries between the easiest
kind of reading material for the student and the level at which the student will be more
challenged, yet can still read successfully.
Confidential—Not for Distribution
MetaMetrics—eMPower Reading Assessments - Lexile Linking Report—April 2017 Page 26
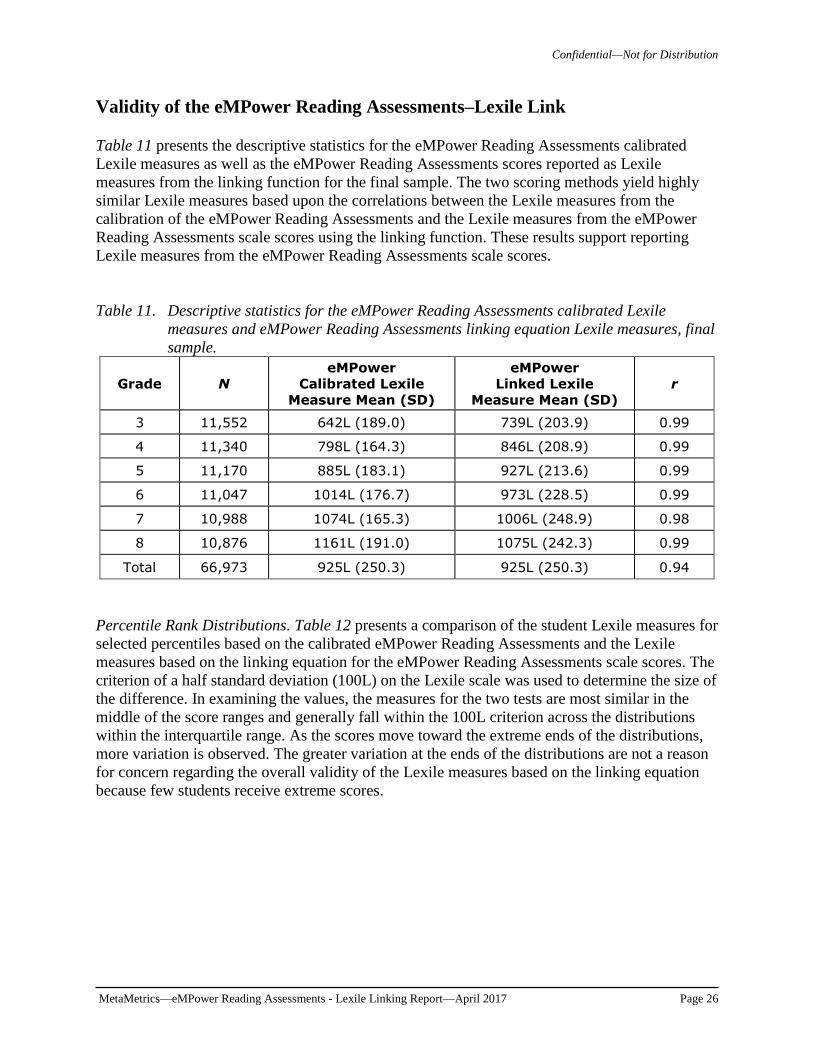
Validity of the eMPower Reading Assessments–Lexile Link Table 11 presents the descriptive statistics for the eMPower Reading Assessments calibrated
Lexile measures as well as the eMPower Reading Assessments scores reported as Lexile
measures from the linking function for the final sample. The two scoring methods yield highly
similar Lexile measures based upon the correlations between the Lexile measures from the
calibration of the eMPower Reading Assessments and the Lexile measures from the eMPower
Reading Assessments scale scores using the linking function. These results support reporting
Lexile measures from the eMPower Reading Assessments scale scores.
Table 11. Descriptive statistics for the eMPower Reading Assessments calibrated Lexile
measures and eMPower Reading Assessments linking equation Lexile measures, final
sample.
Grade N
eMPower
Calibrated Lexile
Measure Mean (SD)
eMPower
Linked Lexile
Measure Mean (SD)
r
3 11,552 642L (189.0) 739L (203.9) 0.99
4 11,340 798L (164.3) 846L (208.9) 0.99
5 11,170 885L (183.1) 927L (213.6) 0.99
6 11,047 1014L (176.7) 973L (228.5) 0.99
7 10,988 1074L (165.3) 1006L (248.9) 0.98
8 10,876 1161L (191.0) 1075L (242.3) 0.99
Total 66,973 925L (250.3) 925L (250.3) 0.94
Percentile Rank Distributions. Table 12 presents a comparison of the student Lexile measures for
selected percentiles based on the calibrated eMPower Reading Assessments and the Lexile
measures based on the linking equation for the eMPower Reading Assessments scale scores. The
criterion of a half standard deviation (100L) on the Lexile scale was used to determine the size of
the difference. In examining the values, the measures for the two tests are most similar in the
middle of the score ranges and generally fall within the 100L criterion across the distributions
within the interquartile range. As the scores move toward the extreme ends of the distributions,
more variation is observed. The greater variation at the ends of the distributions are not a reason
for concern regarding the overall validity of the Lexile measures based on the linking equation
because few students receive extreme scores.
Confidential—Not for Distribution
MetaMetrics—eMPower Reading Assessments - Lexile Linking Report—April 2017 Page 27
Table 12. Comparison of the Lexile measures for selected percentile ranks from the eMPower
Reading Assessments calibrated Lexile measures and the eMPower Reading
Assessments linking equation Lexile measures.
Grade 3
Percentile
Rank
eMPower
Calibrated
Lexile
Measure
eMPower
Equation
Lexile
Measure
1 200L 125L
5 354L 425L
10 393L 477L
25 518L 624L
50 650L 754L
75 783L 887L
90 879L 985L
95 961L 1066L
99 1069L 1161L
Grade 4
Percentile
Rank
eMPower
Calibrated
Lexile
Measure
eMPower
Equation
Lexile
Measure
1 424L 252L
5 511L 466L
10 581L 575L
25 697L 728L
50 799L 855L
75 900L 976L
90 1021L 1121L
95 1057L 1161L
99 1194L 1317L
Grade 5
Percentile
Rank
eMPower
Calibrated
Lexile
Measure
eMPower
Equation
Lexile
Measure
1 484L 330L
5 619L 607L
10 655L 656L
25 745L 774L
50 871L 924L
75 995L 1063L
90 1111L 1187L
95 1184L 1256L
99 1336L 1392L
Grade 6
Percentile
Rank
eMPower
Calibrated
Lexile
Measure
eMPower
Equation
Lexile
Measure
1 618L 356L
5 725L 578L
10 781L 668L
25 901L 841L
50 1020L 996L
75 1135L 1138L
90 1248L 1262L
95 1295L 1311L
99 1484L 1481L
Confidential—Not for Distribution
MetaMetrics—eMPower Reading Assessments - Lexile Linking Report—April 2017 Page 28
Table 12 (continued). Comparison of the Lexile measures for selected percentile ranks from the
eMPower reading assessment calibrated Lexile measures and the eMPower linking
equation Lexile measures.
Grade 7
Percentile
Rank
eMPower
Calibrated
Lexile
Measure
eMPower
Equation
Lexile
Measure
1 716L 154L
5 805L 549L
10 872L 708L
25 954L 855L
50 1070L 1028L
75 1187L 1181L
90 1300L 1317L
95 1370L 1395L
99 1502L 1530L
Grade 8
Percentile
Rank
eMPower
Calibrated
Lexile
Measure
eMPower
Equation
Lexile
Measure
1 731L 419L
5 844L 656L
10 902L 751L
25 1027L 924L
50 1174L 1103L
75 1294L 1245L
90 1413L 1377L
95 1463L 1429L
99 1674L 1637L
Confidential—Not for Distribution
MetaMetrics—eMPower Reading Assessments - Lexile Linking Report—April 2017 Page 29
eMPower Reading Assessments Proficiency Levels. Proficiency Level Descriptors (PLDs)
describe the knowledge and skills students will demonstrate at each proficiency level. The PLDs
reflect the standards measured with the eMPower Reading Assessments. Provisional cut points
for the performance levels based on standard-setting workshops in the summer of 2016 are
shown in Table 13. Each represents the first score on the eMPower Reading Assessments scale
to obtain each level Final eMPower Reading Assessments proficiency levels and PLDs will be
ready to use for the 2017-18 school year (Measured Progress, 2017). In addition, three levels will
be established for strand reports: Below Standard, At Standard, and Above Standard.
The cut points shown in Table 13 are the minimum score point for each proficiency level. These
represent the threshold score for the student who just barely meets the performance standards for
that level. Students whose scores fall below the Level 2 threshold cut point are placed into Level
1. Table 14 provides the values for the eMPower Reading Assessments scale score cut points and
their corresponding Lexile measures.
Table 13. eMPower Reading Assessments threshold cut points, proficiency level.
Grade Level 2 Level 3 Level 4
3 471 528 579
4 506 556 618
5 534 588 665
6 535 618 694
7 553 632 720
8 564 650 748
Table 14. eMPower Reading Assessments Lexile measures, proficiency level.
Grade
Level 1
Scale Score
Level 1
Lexile Measure
Level 2
Scale Score
Level 2
Lexile Measure
Level 3
Scale Score
Level 3
Lexile Measure
Level 4
Scale Score
Level 4
Lexile Measure
3 204-470 BR180L-
585L 471–527 590L-750L 528–578 755L-900L 579-837 900L-1200L
4 234-505 BR95L-690L 506–555 690L-830L 556–617 835L-1010L 618-875 1015L-1300L
5 252-533 BR40L-770L 534–587 770L-925L 588–664 925L-1145L 665-924 1150L-1400L
6 260-534 BR20L-770L 535–617 775L-1010L 618–693 1015L-1230L 694-958 1235L-1500L
7 243-552 BR70L-825L 553–631 825L-1050L 632–719 1055L-1305L 720-1000 1310L-1600L
8 274-563 20L-855L 564–649 860L-1105L 650–747 1105L-1385L 748-890 1390L-1700L
Lexile Framework Norms. Figure 3 shows the Lexile measures for the eMPower Reading
Assessments compared to the norms that have been developed for use with The Lexile
Framework for Reading. At each percentile being examined (i.e. 25th
, 50th
, and 75th
), the
Confidential—Not for Distribution
MetaMetrics—eMPower Reading Assessments - Lexile Linking Report—April 2017 Page 30
eMPower Reading Assessments scale scores reported in the Lexile metric are above the Lexile
normative values in Grade 3 and very similar to the Lexile norm values in Grades 4, 5, and 6. In
Grade 4, the 25th
percentile value for eMPower Reading Assessments is slightly higher than the
Lexile normative value, the 50th
percentile is the same for both scores, and the 75th
percentile
value for eMPower Reading Assessments is slightly lower than the Lexile normative value. In
Grades 5 and 6, the eMPower Reading Assessments scores are slightly lower than the Lexile
normative values. In Grades 7 and 8, the score differences between the eMPower Reading
Assessments scores the Lexile normative values is greater than in the lower grades, with the
Lexile normative values higher at all selected percentiles.
Figure 3. Selected percentiles (25th
, 50th
, and 75th
) plotted for the eMPower Reading
Assessments Lexile measure for the final sample (N = 66,973).
Grade-Level Progressions. The following box and whisker plots (Figures 4 through 6) show the
progression of eMPower Reading Assessments scale scores and Lexile measures (the y-axis)
from grade to grade (the x-axis). For each grade, the box refers to the interquartile range. The
line within the box indicates the median. The end of each whisker represents the minimum and
maximum values of the scores (the y-axis).
Confidential—Not for Distribution
MetaMetrics—eMPower Reading Assessments - Lexile Linking Report—April 2017 Page 31
Figures 4 through 6 demonstrate the vertical nature of both the eMPower Reading Assessments
scale and the Lexile scale. As the grade increases so do the eMPower Reading Assessments
Lexile measures, and there is overlap in scores across grades. This “overlap across grades” is
characteristic of vertical scales (Kolen & Brennan, 2014).
Figure 4. Box and whisker plot of the eMPower Reading Assessments scale scores by grade,
final sample (N = 66,973).
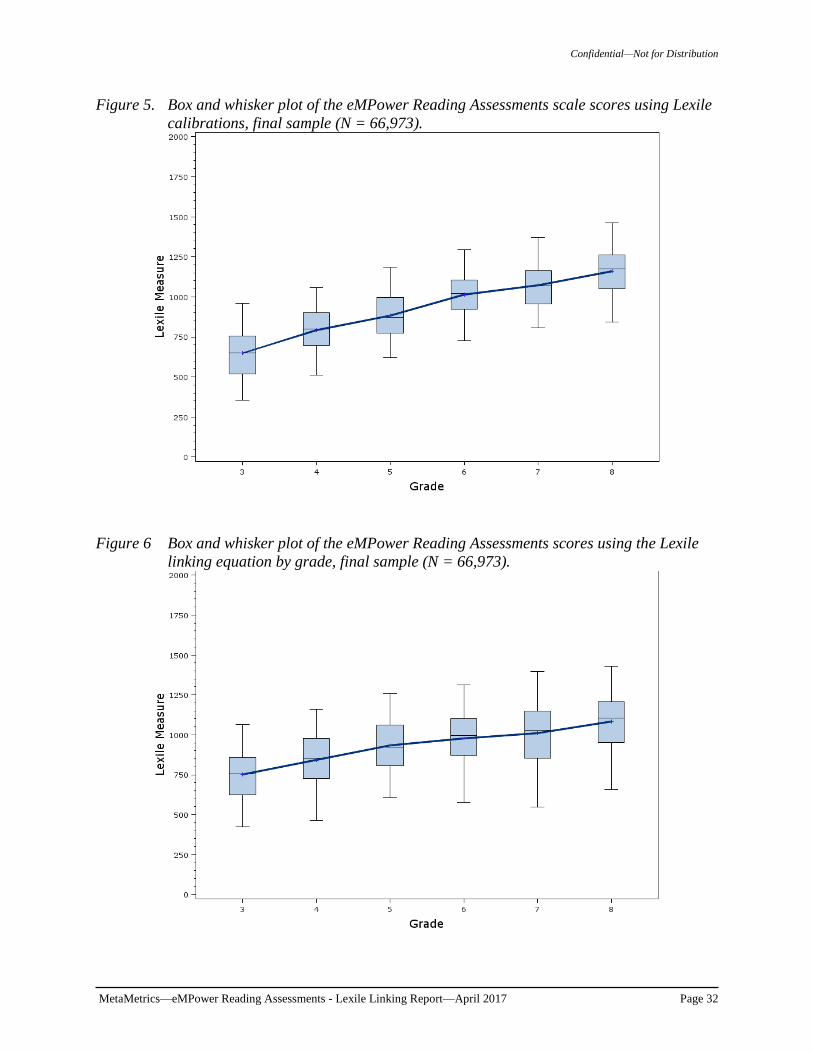
Confidential—Not for Distribution
MetaMetrics—eMPower Reading Assessments - Lexile Linking Report—April 2017 Page 32
Figure 5. Box and whisker plot of the eMPower Reading Assessments scale scores using Lexile
calibrations, final sample (N = 66,973).
Figure 6 Box and whisker plot of the eMPower Reading Assessments scores using the Lexile
linking equation by grade, final sample (N = 66,973).
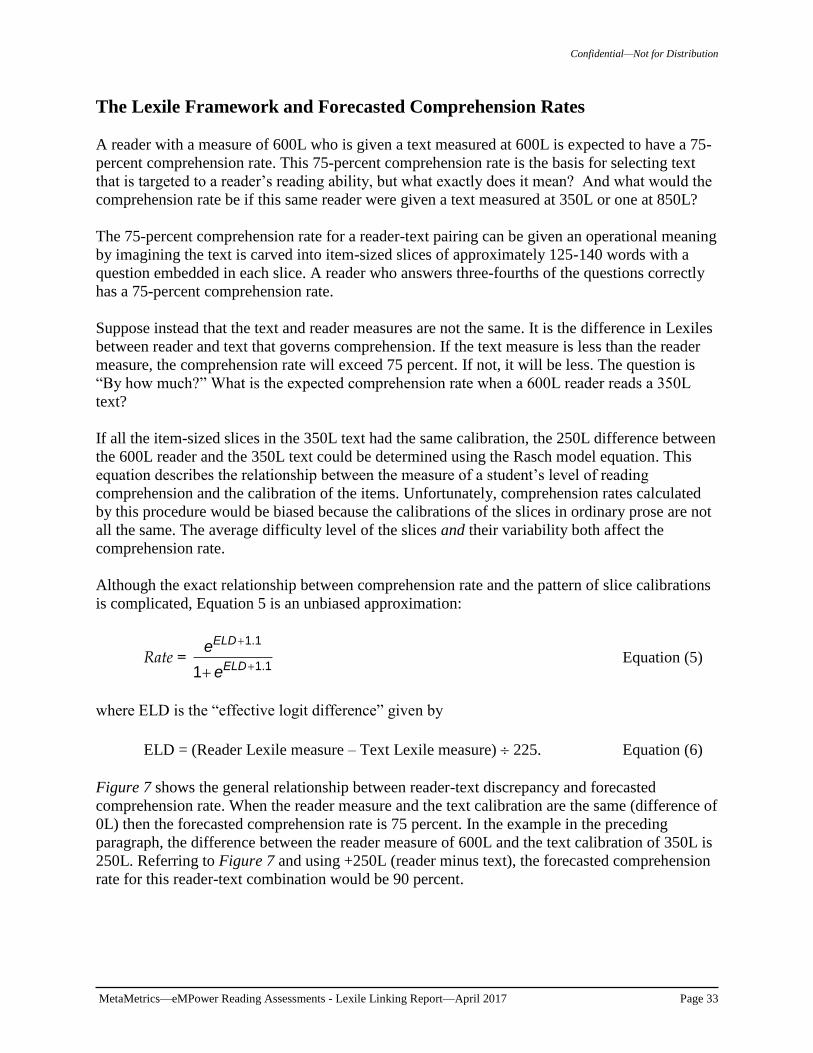
Confidential—Not for Distribution
MetaMetrics—eMPower Reading Assessments - Lexile Linking Report—April 2017 Page 33
The Lexile Framework and Forecasted Comprehension Rates
A reader with a measure of 600L who is given a text measured at 600L is expected to have a 75-
percent comprehension rate. This 75-percent comprehension rate is the basis for selecting text
that is targeted to a reader’s reading ability, but what exactly does it mean? And what would the
comprehension rate be if this same reader were given a text measured at 350L or one at 850L?
The 75-percent comprehension rate for a reader-text pairing can be given an operational meaning
by imagining the text is carved into item-sized slices of approximately 125-140 words with a
question embedded in each slice. A reader who answers three-fourths of the questions correctly
has a 75-percent comprehension rate.
Suppose instead that the text and reader measures are not the same. It is the difference in Lexiles
between reader and text that governs comprehension. If the text measure is less than the reader
measure, the comprehension rate will exceed 75 percent. If not, it will be less. The question is
“By how much?” What is the expected comprehension rate when a 600L reader reads a 350L
text?
If all the item-sized slices in the 350L text had the same calibration, the 250L difference between
the 600L reader and the 350L text could be determined using the Rasch model equation. This
equation describes the relationship between the measure of a student’s level of reading
comprehension and the calibration of the items. Unfortunately, comprehension rates calculated
by this procedure would be biased because the calibrations of the slices in ordinary prose are not
all the same. The average difficulty level of the slices and their variability both affect the
comprehension rate.
Although the exact relationship between comprehension rate and the pattern of slice calibrations
is complicated, Equation 5 is an unbiased approximation:
Rate =
1.1
1.11
ELD
ELD
e
e Equation (5)
where ELD is the “effective logit difference” given by
ELD = (Reader Lexile measure – Text Lexile measure) 225. Equation (6)
Figure 7 shows the general relationship between reader-text discrepancy and forecasted
comprehension rate. When the reader measure and the text calibration are the same (difference of
0L) then the forecasted comprehension rate is 75 percent. In the example in the preceding
paragraph, the difference between the reader measure of 600L and the text calibration of 350L is
250L. Referring to Figure 7 and using +250L (reader minus text), the forecasted comprehension
rate for this reader-text combination would be 90 percent.
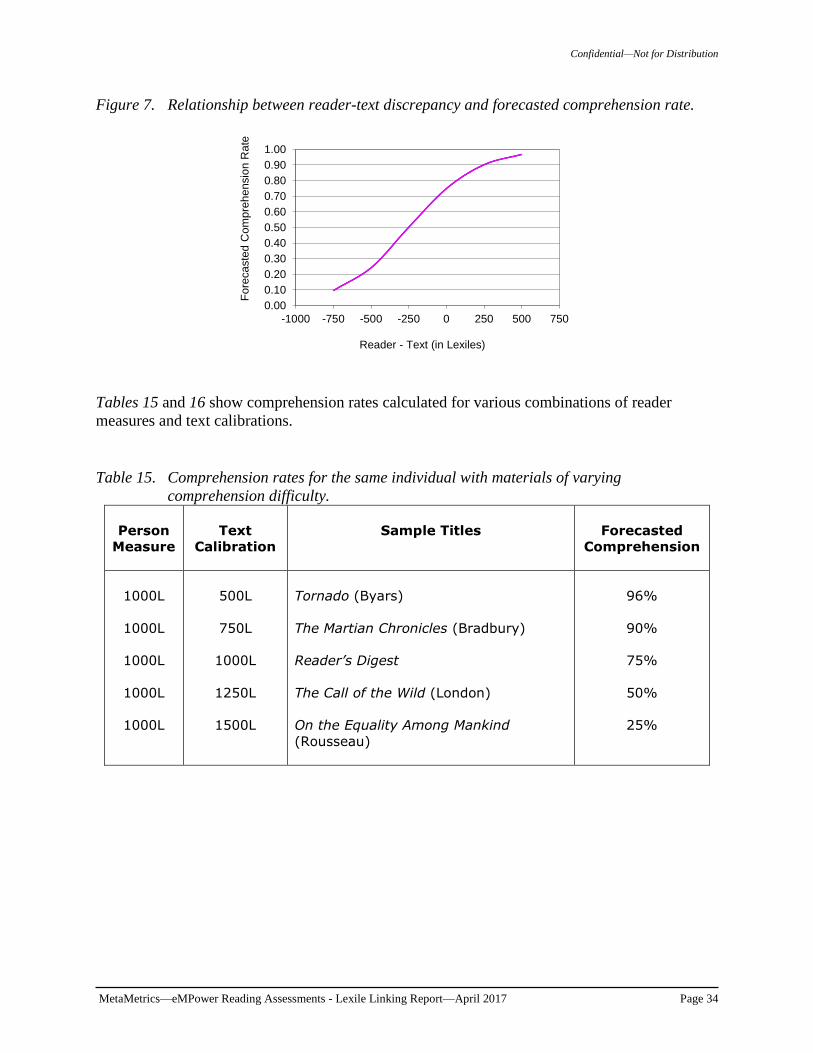
Confidential—Not for Distribution
MetaMetrics—eMPower Reading Assessments - Lexile Linking Report—April 2017 Page 34
Figure 7. Relationship between reader-text discrepancy and forecasted comprehension rate.
Tables 15 and 16 show comprehension rates calculated for various combinations of reader
measures and text calibrations.
Table 15. Comprehension rates for the same individual with materials of varying
comprehension difficulty.
Person
Measure
Text
Calibration
Sample Titles
Forecasted
Comprehension
1000L
1000L
1000L
1000L
1000L
500L
750L
1000L
1250L
1500L
Tornado (Byars)
The Martian Chronicles (Bradbury)
Reader’s Digest
The Call of the Wild (London)
On the Equality Among Mankind
(Rousseau)
96%
90%
75%
50%
25%
0.00
0.10
0.20
0.30
0.40
0.50
0.60
0.70
0.80
0.90
1.00
-1000 -750 -500 -250 0 250 500 750
Fo
reca
ste
d C
om
pre
he
nsio
n R
ate
Reader - Text (in Lexiles)

Confidential—Not for Distribution
MetaMetrics—eMPower Reading Assessments - Lexile Linking Report—April 2017 Page 35
Table 16. Comprehension rates of different person abilities with the same material.
Person
Measure
Calibration for a Grade
10 Biology Textbook
Forecasted
Comprehension Rate
500L
750L
1000L
1250L
1500L
1000L
1000L
1000L
1000L
1000L
25%
50%
75%
90%
96%
The subjective experience of 50-percent, 75-percent, and 90-percent comprehension as reported
by readers varies greatly. A 1000L reader reading 1000L text (75-percent comprehension)
reports confidence and competence. Teachers listening to such a reader report that the reader can
sustain the meaning thread of the text and can read with motivation and appropriate emotion and
emphasis. In short, such readers appear to comprehend what they are reading. A 1000L reader
reading 1250L text (50-percent comprehension) encounters so much unfamiliar vocabulary and
difficult syntactic structures that the meaning thread is frequently lost. Such readers report
frustration and seldom choose to read independently at this level of comprehension. Finally, a
1000L reader reading 750L text (90-percent comprehension) reports total control of the text,
reads with speed, and experiences automaticity during the reading process.
The primary utility of the Lexile Framework is its ability to forecast what happens when readers
confront text. With every application by teacher, student, librarian, or parent there is a test of the
Framework’s accuracy. The Framework makes a point prediction every time a text is chosen for
a reader. Anecdotal evidence suggests that the Lexile Framework predicts as intended. That is
not to say that there is an absence of error in forecasted comprehension. There is error in text
measures, reader measures, and their difference modeled as forecasted comprehension. However,
the error is sufficiently small that the judgments about readers, texts, and comprehension rates
are useful.
Relationship between Linking Error and Forecasted Comprehension Rate. Using Equation 5
with different combinations of reader measure and text difficulty, the effect of linking error on
forecasted comprehension rate can be examined. Table 17 shows the changes in the forecasted
comprehension rate for different combinations of reader and text interactions. When the linking
error is small, 5–10L, then the effect on forecasted comprehension rate is a minimal difference (1
to 2 percent) increase or decrease in comprehension.

Confidential—Not for Distribution
MetaMetrics—eMPower Reading Assessments - Lexile Linking Report—April 2017 Page 36
Table 17. Effect of reader-text discrepancy on forecasted comprehension rate.
Reader
Lexile Measure
Text
Lexile Measure
Difference
Forecasted
Comprehension
Rate
1000L
1000L
1000L
1000L
1000L
1000L
1000L
1000L
1000L
1000L
1000L
1000L
1000L
970L
975L
980L
985L
990L
995L
1000L
1005L
1010L
1015L
1020L
1025L
1030L
30L
25L
20L
15L
10L
5L
0L –5L –10L –15L –20L –25L –30L
77.4%
77.0%
76.7%
76.3%
75.8%
75.4%
75.0%
74.6%
74.2%
73.8%
73.3%
72.9%
72.4%
Confidential—Not for Distribution
MetaMetrics—eMPower Reading Assessments - Lexile Linking Report—April 2017 Page 37
Conclusions, Caveats, and Recommendations
Forging a link between scales is a way to add value to one scale without having to administer an
additional test. Value can be in the form of any or all of the following:
• increased interpretability (e.g., “Based on this test score, what can my child actually
read?”), or
• increased instructional use (e.g., “Based on these test scores, I need to modify my
instruction to include these skills.”).
The link that has been established between the eMPower Reading Assessments scale and the
Lexile scale permits readers to be matched with books and texts that provide an appropriate level
of challenge while avoiding frustration. The result of this purposeful match may be that students
will read more, and, thereby read better. The real power of the Lexile Framework is in examining
the growth of readers—wherever the reader may be in the development of his or her reading
skills. Readers can be matched with texts that they are forecasted to read with 75-percent
comprehension. As a reader grows, he or she can be matched with more demanding texts. And,
as the texts become more demanding, then the reader grows.
The concordance provides a link between the two scales. All linking functions are statistical
estimates based on data collected from specific samples. These linking results may be somewhat
different with a different sample. Other factors may affect the students’ performance during the
test administrations such as health conditions, surrounding environment, or motivation.
Recommendations about reporting Lexile measures for readers. Lexile measures are reported as
a number followed by a capital “L” for “Lexile.” There is no space between the measure and the
“L,” and measures of 1,000 or greater are reported without a comma (e.g., 1050L). All Lexile
measures should be rounded to the nearest 5L to avoid over interpretation of the measures. As
with any test score, uncertainty in the form of measurement error is present.
Lexile measures that are reported for an individual student should reflect the purpose for which
they will be used. If the purpose is research (e.g., to measure growth at the student, grade, school,
district, or state level), then actual measures should be used at all score points, rounded to the
nearest integer. A computed Lexile measure of 772.51 would be reflected as 773L. If the purpose
is instructional, then the Lexile measures should be capped at the upper bound of measurement
error (e.g., at the 95th
percentile of the national Lexile norms) to ensure developmental
appropriateness of the material. MetaMetrics expresses these as “Reported Lexile Measures” and
recommends that these measures be reflected on individual score reports. In instructional
environments where the purpose of the Lexile measure is to appropriately match readers with
texts, all scores below 0L should be reported as “BRxxxL.” No student should receive a negative
Lexile measure on a score report. The lowest reported value below 0L is BR400L.
Some assessments report a Lexile range for each student, which is 50L above and 100L below
the student’s actual Lexile measure. This range represents the boundaries between the easiest
kind of reading material for the student and the level at which the student will be more

Confidential—Not for Distribution
MetaMetrics—eMPower Reading Assessments - Lexile Linking Report—April 2017 Page 38
challenged, yet can still read successfully. A reader with a Lexile measure of 1000L would have
a Lexile range of 900L–1050L. This range represents the recommended guideline to select
reading materials for instructional purposes. Understanding the impact of selecting reading
materials on a student’s comprehension is important for student success. It should be noted that
material above or below the reader’s Lexile range may be used for specific instructional
purposes. As in any academic setting, the teachers and parents know the student best. The Lexile
range is best viewed as a tractable guideline where teachers or parents selecting reading materials
outside of the Lexile range may seem more appropriate.
Text Complexity. There is increasing recognition of the importance of bridging the gap that
exists between K-12 and higher education and other postsecondary endeavors. Many state and
policy leaders have formed task forces and policy committees such as P-20 councils.
In the Journal of Advanced Academics (Summer 2008), Williamson investigated the gap
between high school textbooks and various reading materials across several postsecondary
domains. The resources Williamson used were organized into four domains that correspond to
the three major postsecondary endeavors that students can choose—further education, the
workplace, or the military—and the broad area of citizenship, which cuts across all
postsecondary endeavors. Figure 8 shows the Lexile ranges of reading materials in the domains
investigated by Williamson. Williamson discovered a substantial increase in reading
expectations and text complexity from high school to postsecondary domains— a gap large
enough to help account for high remediation rates and disheartening graduation statistics (Smith,
2011).
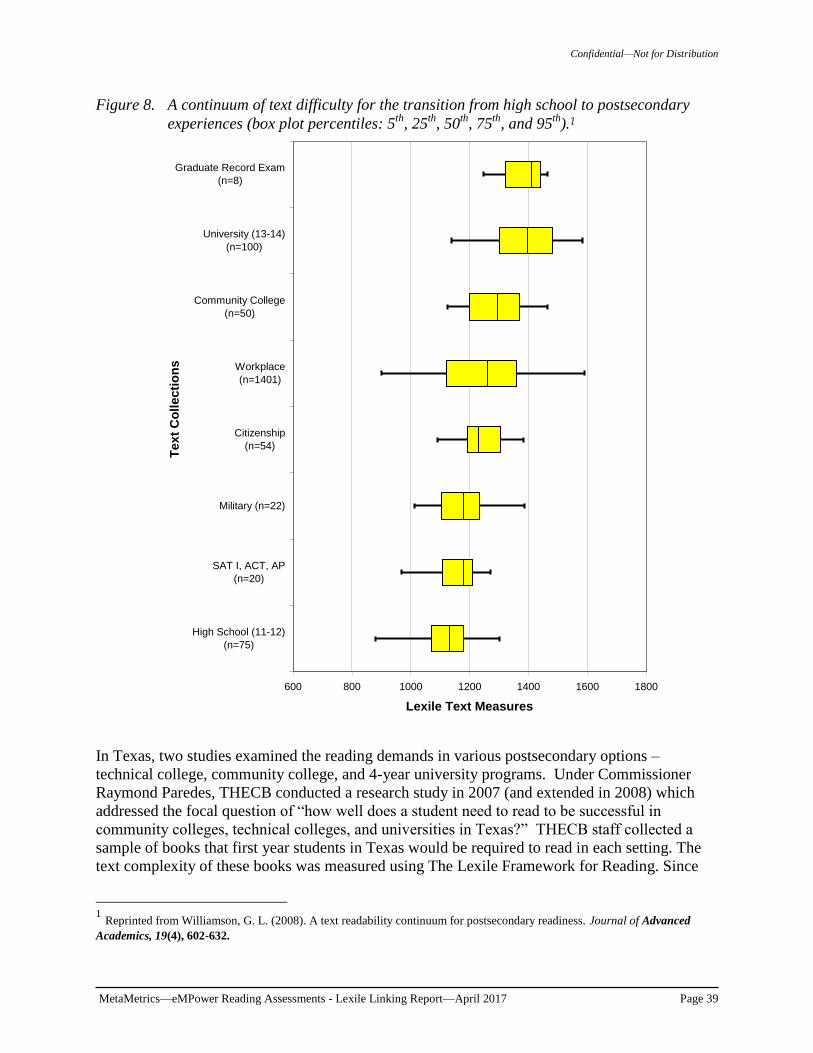
Confidential—Not for Distribution
MetaMetrics—eMPower Reading Assessments - Lexile Linking Report—April 2017 Page 39
Figure 8. A continuum of text difficulty for the transition from high school to postsecondary
experiences (box plot percentiles: 5th
, 25th
, 50th
, 75th
, and 95th
).1
In Texas, two studies examined the reading demands in various postsecondary options –
technical college, community college, and 4-year university programs. Under Commissioner
Raymond Paredes, THECB conducted a research study in 2007 (and extended in 2008) which
addressed the focal question of “how well does a student need to read to be successful in
community colleges, technical colleges, and universities in Texas?” THECB staff collected a
sample of books that first year students in Texas would be required to read in each setting. The
text complexity of these books was measured using The Lexile Framework for Reading. Since
1 Reprinted from Williamson, G. L. (2008). A text readability continuum for postsecondary readiness. Journal of Advanced
Academics, 19(4), 602-632.
A Continuum of Text Difficulty for the Transition from
High School to Postsecondary Experiences(Box Plot Percentiles: 5th, 25th, 50th, 75th, 95th)
600 800 1000 1200 1400 1600 1800
High School (11-12)
(n=75)
SAT I, ACT, AP
(n=20)
Military (n=22)
Citizenship
(n=54)
Workplace
(n=1401)
Community College
(n=50)
University (13-14)
(n=100)
Graduate Record Exam
(n=8)T
ex
t C
oll
ec
tio
ns
Lexile Text Measures

Confidential—Not for Distribution
MetaMetrics—eMPower Reading Assessments - Lexile Linking Report—April 2017 Page 40
the TAKS had already been linked with Lexile measures for several years, the THECB study was
able to overlay the TAKS cut scores onto the post high school reading requirements. (For a
complete description of this report, visit www.thecb.state.tx.us/index.cfm?objectid=31BFFF6B-
BB41-8A43-C76A99EDA0F38B7D.)
Since the THECB study was completed, other states have followed the Texas example and used
the same approach in examining the gap from high school to the postsecondary world. In 2009, a
similar study was conducted for the Georgia Department of Education; and in 2010, a study was
conducted for the Tennessee Department of Education. In terms of mean text demand, the
results across the three states produced similar estimates of the reading ability needed in higher-
education institutions: Texas, 1230L; Georgia, 1220L; and Tennessee, 1260L. When these
results are incorporated with the reading demands of other postsecondary endeavors (military,
citizenship, workplace, and adult reading materials [national and international newspapers] and
Wikipedia articles) used by Stenner, Koons, and Swartz (2010), the college and career readiness
standard for reading is 1293L. These results are based on more than 105,000,000 words from
approximately 3,100 sources from the adult text space.
Expanding on Williamson’s work, Stenner, Sanford-Moore, and Williamson (2012) aggregated
the readability information across the various postsecondary options available to a high school
graduate to arrive at a standard of reading needed by individuals to be considered “college and
career ready.” In their study, they included additional citizenship materials beyond those
examined by Williamson (e.g., national and international newspapers and other adult reading
materials such as Wikipedia articles). Using a weighted mean of the medians for each of the
postsecondary options (education, military, work place, and citizenship), a measure of 1300L
was defined as the general reading demand for postsecondary options and could be used to judge
a student’s “college and career readiness.”
The question for educators becomes how to determine if a student is “on track” for college and
career as previously defined in the Common Core State Standards and described above. “As
state departments of education, and the districts and schools within those respective states,
transition from adopting the new Common Core State Standards to the more difficult task of
implementing them, the challenge now becomes how to translate these higher standards into
tangible, practical and cost-effective curricula” (Smith, 2012). Implementing the Common Core
will require districts and schools to develop new instructional strategies and complementary
resources that are not only aligned with these national college- and career-readiness standards,
but also utilize and incorporate proven and cost-effective tools that are universally accessible to
all stakeholders.
The Standards for English Language Arts focus on the importance of text complexity. As stated
in Standard 10, students must be able to “read and comprehend complex literary and
informational texts independently and proficiently” (Common Core State Standards for English
Language Arts, College and Career Readiness Anchor Standards for Reading, NGA Center and
CCSSO, 2010, p.10).
The Common Core State Standards recommends a three-part model for evaluating the
complexity of a text that takes into account its qualitative dimensions, quantitative measure, and
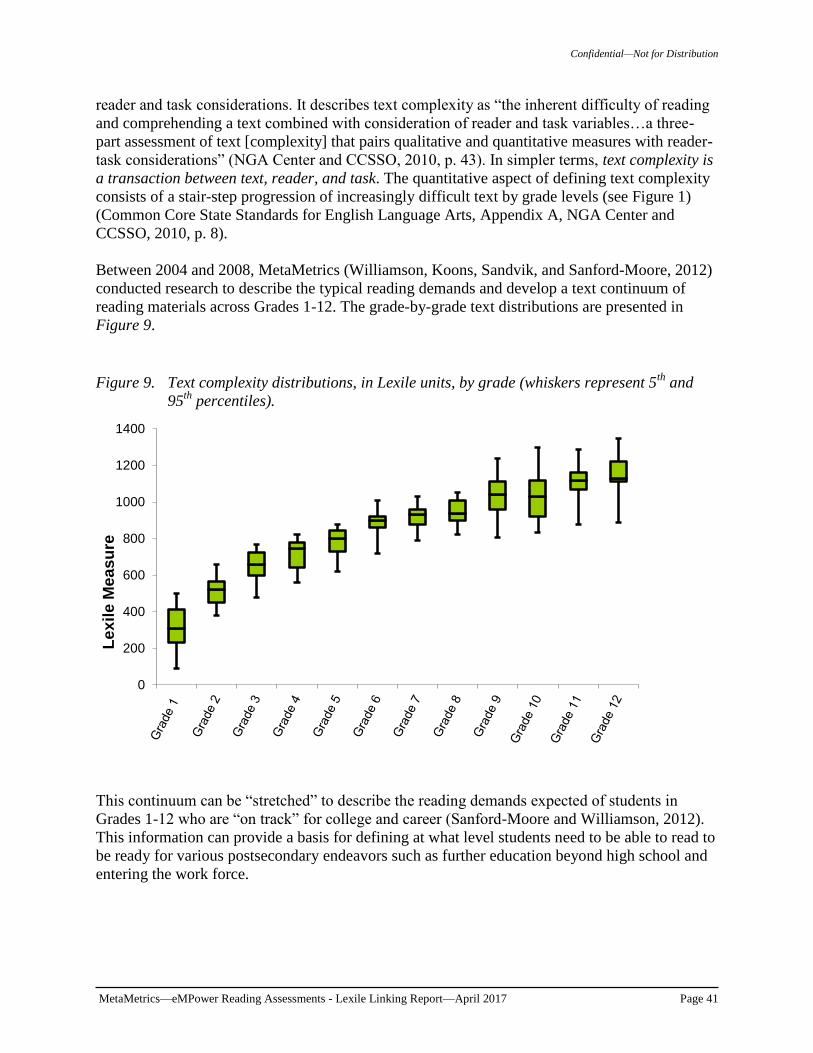
Confidential—Not for Distribution
MetaMetrics—eMPower Reading Assessments - Lexile Linking Report—April 2017 Page 41
reader and task considerations. It describes text complexity as “the inherent difficulty of reading
and comprehending a text combined with consideration of reader and task variables…a three-
part assessment of text [complexity] that pairs qualitative and quantitative measures with reader-
task considerations” (NGA Center and CCSSO, 2010, p. 43). In simpler terms, text complexity is
a transaction between text, reader, and task. The quantitative aspect of defining text complexity
consists of a stair-step progression of increasingly difficult text by grade levels (see Figure 1)
(Common Core State Standards for English Language Arts, Appendix A, NGA Center and
CCSSO, 2010, p. 8).
Between 2004 and 2008, MetaMetrics (Williamson, Koons, Sandvik, and Sanford-Moore, 2012)
conducted research to describe the typical reading demands and develop a text continuum of
reading materials across Grades 1-12. The grade-by-grade text distributions are presented in
Figure 9.
Figure 9. Text complexity distributions, in Lexile units, by grade (whiskers represent 5
th and
95th
percentiles).
This continuum can be “stretched” to describe the reading demands expected of students in
Grades 1-12 who are “on track” for college and career (Sanford-Moore and Williamson, 2012).
This information can provide a basis for defining at what level students need to be able to read to
be ready for various postsecondary endeavors such as further education beyond high school and
entering the work force.
0
200
400
600
800
1000
1200
1400
Lex
ile
Me
as
ure
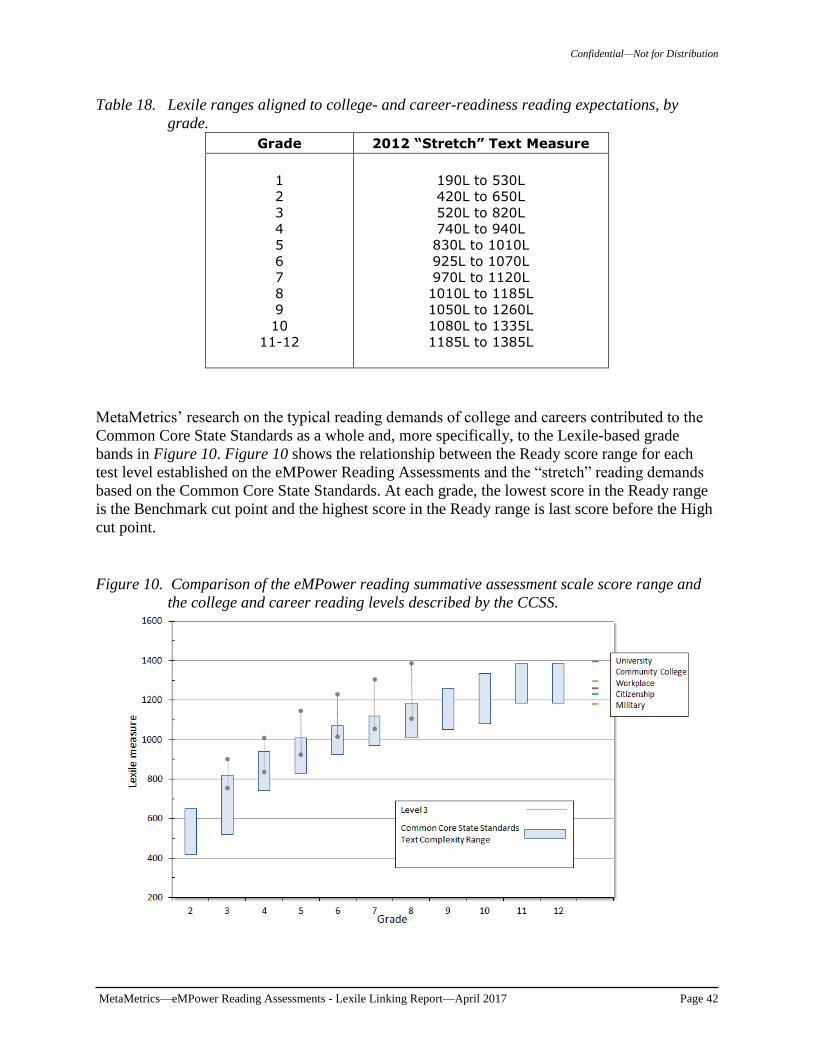
Confidential—Not for Distribution
MetaMetrics—eMPower Reading Assessments - Lexile Linking Report—April 2017 Page 42
Table 18. Lexile ranges aligned to college- and career-readiness reading expectations, by
grade.
Grade 2012 “Stretch” Text Measure
1
2
3
4
5
6
7
8
9
10
11-12
190L to 530L
420L to 650L
520L to 820L
740L to 940L
830L to 1010L
925L to 1070L
970L to 1120L
1010L to 1185L
1050L to 1260L
1080L to 1335L
1185L to 1385L
MetaMetrics’ research on the typical reading demands of college and careers contributed to the
Common Core State Standards as a whole and, more specifically, to the Lexile-based grade
bands in Figure 10. Figure 10 shows the relationship between the Ready score range for each
test level established on the eMPower Reading Assessments and the “stretch” reading demands
based on the Common Core State Standards. At each grade, the lowest score in the Ready range
is the Benchmark cut point and the highest score in the Ready range is last score before the High
cut point.
Figure 10. Comparison of the eMPower reading summative assessment scale score range and
the college and career reading levels described by the CCSS.
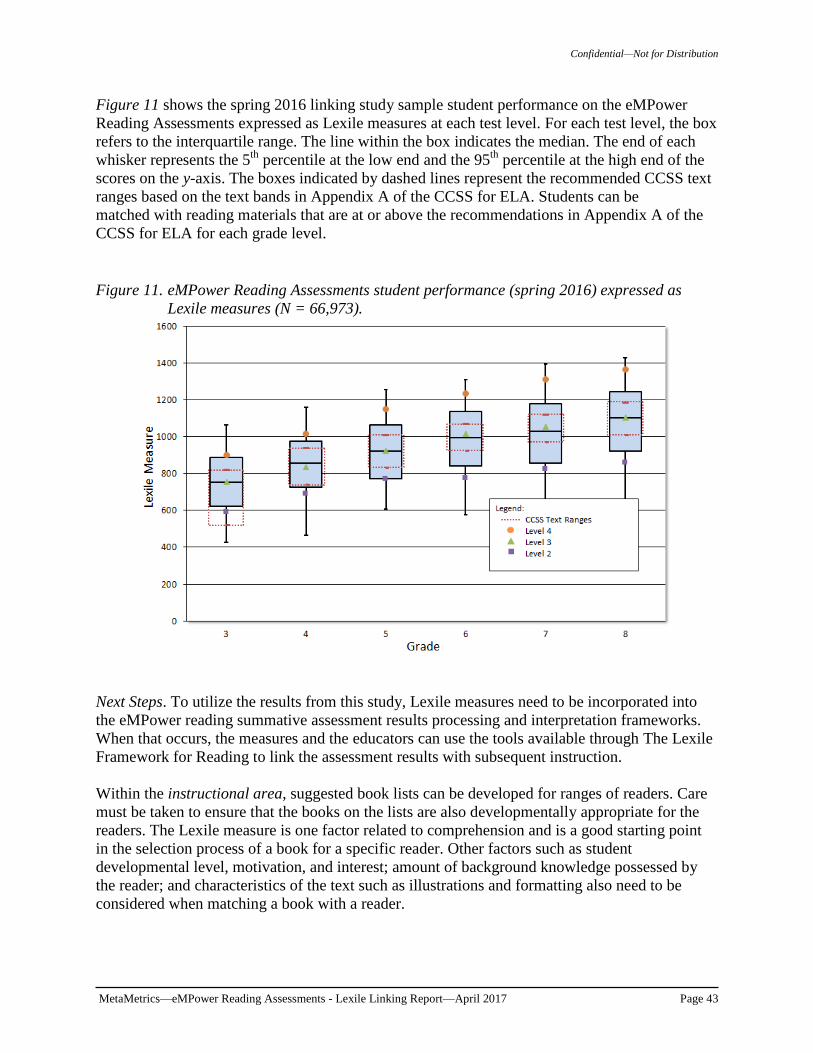
Confidential—Not for Distribution
MetaMetrics—eMPower Reading Assessments - Lexile Linking Report—April 2017 Page 43
Figure 11 shows the spring 2016 linking study sample student performance on the eMPower
Reading Assessments expressed as Lexile measures at each test level. For each test level, the box
refers to the interquartile range. The line within the box indicates the median. The end of each
whisker represents the 5th
percentile at the low end and the 95th
percentile at the high end of the
scores on the y-axis. The boxes indicated by dashed lines represent the recommended CCSS text
ranges based on the text bands in Appendix A of the CCSS for ELA. Students can be
matched with reading materials that are at or above the recommendations in Appendix A of the
CCSS for ELA for each grade level.
Figure 11. eMPower Reading Assessments student performance (spring 2016) expressed as
Lexile measures (N = 66,973).
Next Steps. To utilize the results from this study, Lexile measures need to be incorporated into
the eMPower reading summative assessment results processing and interpretation frameworks.
When that occurs, the measures and the educators can use the tools available through The Lexile
Framework for Reading to link the assessment results with subsequent instruction.
Within the instructional area, suggested book lists can be developed for ranges of readers. Care
must be taken to ensure that the books on the lists are also developmentally appropriate for the
readers. The Lexile measure is one factor related to comprehension and is a good starting point
in the selection process of a book for a specific reader. Other factors such as student
developmental level, motivation, and interest; amount of background knowledge possessed by
the reader; and characteristics of the text such as illustrations and formatting also need to be
considered when matching a book with a reader.
Confidential—Not for Distribution
MetaMetrics—eMPower Reading Assessments - Lexile Linking Report—April 2017 Page 44
The Lexile Framework reporting scale is not bounded by grade level, although typical Lexile
measure ranges have been identified for students in specific grades. Because the Lexile
Framework reporting scale is not bounded by grade level, it makes provisions for students who
read below or beyond their grade level. See the Lexile Framework Map for literary and
informational titles, leveled reading samples, and approximate grade ranges (Appendix A).
In this era of student-level accountability and high-stakes assessment, differentiated
instruction—the attempt “on the part of classroom teachers to meet students where they are in
the learning process and move them along as quickly and as far as possible in the context of a
mixed-ability classroom” (Tomlinson, 1999)—is a means for all educators to help students
succeed. Differentiated instruction promotes high-level and powerful curriculum for all students,
but varies the level of teacher support, task complexity, pacing, and avenues to learning based on
student readiness, interest, and learning profile. One strategy for managing a differentiated
classroom suggested by Tomlinson is the use of multiple texts and supplementary materials.
The Lexile Framework is an objective tool that can be used to determine a student’s readiness for
a reading experience; the Lexile Framework “targets” text (books, newspapers, periodicals) for
readers at a 75 percent comprehension level—a level that is challenging, but not frustrating
(Schnick and Knickelbine, 2000).
Suggestions for Using The Lexile Framework for Reading Use the Lexile Framework to Select Books. Teachers, parents, and students can use the tools
provided by the Lexile Framework to select materials to plan instruction. When teachers provide
parents and students with lists of titles that match the students' Lexile measures, they can then
work together to choose appropriate titles that also match the students' interests and background
knowledge. The Lexile Framework does not prescribe a reading program, but it gives educators
more knowledge of the variables involved when they design reading instruction. The Lexile
Framework facilitates multiple opportunities for use in a variety of instructional activities. After
becoming familiar with the Lexile Framework, teachers are likely to think of a variety of
additional creative ways to use this tool to match students with books that students find
challenging, but not frustrating.
Many factors affect the relationship between a reader and a book. These factors include text
content, age of the reader, interests of the reader, suitability of the text, and text difficulty. The
Lexile measure of a text, a measure of text complexity, is a good starting point in the selection
process, but other factors also must be considered. The Lexile measure should never be the only
piece of information used when selecting a text for a reader.
Help Students Set Appropriate Learning Goals. Students' Lexile measures can be used to identify
reading materials that students are likely to comprehend with 75% accuracy. Students can set
goals of improving their reading comprehension and plan clear strategies for reaching those
goals using literature from the appropriate Lexile ranges. Progress tests throughout the year can
help to monitor students’ progress toward their goals.
Confidential—Not for Distribution
MetaMetrics—eMPower Reading Assessments - Lexile Linking Report—April 2017 Page 45
Monitor Reading Program Goals. As a student's Lexile measure increases, the set of reading
materials he can likely comprehend at 75% accuracy changes. Schools often write grant
applications in which they are required to state how they will monitor progress of the
intervention or program funded by the grant. Schools that receive funds targeted to assist
students improve their reading skills can use the Lexile Framework for evaluation purposes.
Schools can use student-level and school-level Lexile information to monitor and evaluate
interventions designed to improve reading skills.
Measurable goals can be clearly stated in terms of Lexile measures. Examples of measurable
goals and clearly related strategies for reading intervention programs might include.
Goal: At least half of the students will improve reading comprehension abilities by
100L after one year of use of an intervention.
Goal: Students' attitudes about reading will improve after reading 10 books at their
75% comprehension level.
These examples of goals emphasize the fact that the Lexile Framework is not an intervention, but
a tool to help educators plan instruction and measure the success of the reading program.
Communicate With Parents Meaningfully to Include Them in the Educational Process. Teachers
can make statements to parents such as, “Your child should be ready to read with at least 75%
comprehension these kinds of materials which are at the next grade level.” Or, “Your child will
need to increase his/her Lexile measure by 400L-500L in the next few years to be prepared for
college reading demands. Here is a list of appropriate titles your child can choose from for
reading this summer.”
Improve Students' Reading Fluency. Fluency is highly correlated to comprehension (Fuchs,
Fuchs, Hops, & Jenkins, 2001; Rasinski, 2009). Educational researchers have found that students
who spend a minimum of three hours a week reading at their own level for their own purposes
develop reading fluency that leads to improved mastery. Not surprisingly, researchers have found
that students who read age-appropriate materials with a high level of comprehension also learn to
enjoy reading.
Teach Learning Strategies by Controlling Comprehension Match. The Lexile Framework
permits the teacher to target readers with challenging text and to systematically adjust text
targeting when the teacher wants fluency and automaticity (i.e. reader measure is well above text
measure) or wants to teach strategies for attacking "hard" text (i.e. reader measure is well below
text measure). For example, metacognitive ability has been well documented to play an
important role in reading comprehension performance. Once teachers know the kinds of texts
that would likely be challenging for a group of readers, they can systematically plan instruction
that will allow students to encounter difficult text in a controlled fashion and make use of
instructional scaffolding to build student success and confidence with more challenging text. The
teacher can model appropriate learning strategies for students, such as rereading or rephrasing
text in one's own words, so that students can then learn what to do when comprehension breaks
down. Students can then practice these metacognitive strategies on selected text while the teacher
monitors their progress.

Confidential—Not for Distribution
MetaMetrics—eMPower Reading Assessments - Lexile Linking Report—April 2017 Page 46
Teachers can use Lexile measures to guide a struggling student toward texts at the lower end of
the student’s Lexile range (100L above to 50L below his or her Lexile measure). Similarly,
advanced students can be adequately challenged by reading texts at the midpoint of their Lexile
range, or slightly above. Challenging new topics or genres may be approached in the same way.
Differentiating instruction for the reading experience also involves the student’s motivation and
purpose. If a student is highly motivated for a particular reading task (e.g., self-selected free
reading), the teacher may suggest books higher in the student’s Lexile range. If the student is less
motivated or intimidated by a reading task, material at the lower end of his or her Lexile range
can provide the basic comprehension support to keep the student from feeling overwhelmed.
Targeting Instruction to Students' Abilities. To encourage optimal progress with the use of any
reading materials, teachers need to be aware of the complexity level of the text relative to a
student’s reading level. A text that is too difficult may serve to undermine a student’s confidence
and diminish learning. Frequent use of text that is too easy may foster poor work habits and
unrealistic expectations that will undermine the later success of the best students.
When students confront new kinds of texts and texts containing new content, the introduction
can be softened and made less intimidating by guiding the student to easier reading. On the other
hand, students who are comfortable with a particular genre or format or the content of such texts
can be challenged with more difficult reading levels, which will reduce boredom and promote
the greatest rate of development of vocabulary and comprehension skills.
To become better readers, students need to be challenged continually—they need to be exposed
to less frequent and more difficult vocabulary in meaningful contexts. A 75% comprehension
level provides an appropriate level of challenge, but is not too challenging.
Apply Lexile measures Across the Curriculum. Over 450 publishers provide Lexile measures for
their trade books and textbooks, enabling educators to make connections among all of the
different components of the curriculum to plan instruction more effectively. With a student’s
Lexile measure, teachers can connect him or her to hundreds of thousands of books. Using
periodical databases, teachers and students can also find appropriately challenging newspaper
and magazine articles that have Lexile measures.
Using the Lexile Framework in the Classroom
Develop individualized reading lists that are tailored to provide appropriately challenging
reading while still reflecting student interest and motivations.
Build text sets that include texts at varying levels to enhance thematic teaching. These
texts might not only support the theme, but also provide a way for all students to
successfully learn about and participate in discussions about the theme, building
knowledge of common content for the class while building the reading skills of
individual students. Such discussions can provide important collaborative brainstorming
opportunities to fuel student writing and synthesize the curriculum.
Confidential—Not for Distribution
MetaMetrics—eMPower Reading Assessments - Lexile Linking Report—April 2017 Page 47
Sequence materials in a reading program to encourage growth in reading ability. For
example, an educator might choose one article a week for use as a read-aloud. In addition
to considering the topic, the educator could increase the complexity of the articles
throughout the course. This approach is also useful when utilizing a core program or
textbook that is set up in anthology format. (The order in which the readings in
anthologies are presented to the students may need to be rearranged to best meet student
needs.)
Develop a reading folder that goes home with students and comes back for weekly
review. The folder can contain a reading list of texts within the student’s Lexile range,
reports of recent assessments, and a form to record reading that occurs at home. This is
an important opportunity to encourage individualized goal setting and engage families in
monitoring the progress of students in reaching those goals.
Choose texts lower in the student’s Lexile range when factors make the reading situation
more challenging or unfamiliar. Select texts at or above the student’s range to stimulate
growth when a topic is of extreme interest to a student, or when adding additional support
such as background teaching or discussion.
Use to provide all students with exposure to differentiated, challenging text at least once
every two to three weeks as suggested by the lead authors of the Common Core State
Standards.
Use the free Find a Book website (at www.lexile.com/fab) to support book selection and
create booklists within a student’s Lexile range to help the student make more informed
choices when selecting texts.
Use database resources to infuse research into the curricula while tailoring reading
selections to specific Lexile levels. In this way, students can explore new content at an
appropriate reading level and then demonstrate their assimilation of that content through
writing and/or presentations. A list of the database service providers that have their
collections measured can be found at www.lexile.com/using-lexile/lexile-at-library.
Using the Lexile Framework in the Library
Make the Lexile measures of books available to students to better enable them to find
books of interest at their appropriate reading level.
Compare student Lexile levels with the Lexile levels of the books and periodicals in the
library to analyze and develop the collection to more fully meet the needs of all students.
Use the database resources to search for articles at specific Lexile levels to support
classroom instruction and independent student research. A list of the database service
providers that have had their collections measured can be found at
www.lexile.com/using-lexile/lexile-at-library/)
Use the free Find a Book website (at www.lexile.com/fab) to support book selection and
help students make informed choices when selecting texts.
Lexile Measures and Grade Levels. Lexile measures do not translate specifically to grade levels.
Within any grade, there will be a range of readers and a range of materials to be read. In a fifth-
grade classroom there will be some readers who are far ahead of the others and there will be
some readers who are behind the others in terms of reading ability. To say that some books are
Confidential—Not for Distribution
MetaMetrics—eMPower Reading Assessments - Lexile Linking Report—April 2017 Page 48
“just right” for fifth graders assumes that all fifth graders are reading at the same level. The
Lexile Framework can be used to match readers with texts at whatever level the reader is
reading.
Simply because a student is an excellent reader, it should not be assumed that the student would
necessarily comprehend a text typically found at a higher grade level. Without adequate
background knowledge, the words may not have sufficient meaning to the student. A high Lexile
measure for a grade indicates that the student can read grade-appropriate materials at a higher
comprehension level (90%, for example).
The real power of the Lexile Framework is in examining the growth of readers—wherever the
reader may be in the development of his or her reading skills. Readers can be matched with texts
that they are forecasted to read with 75% comprehension. As a reader grows, he or she can be
matched with more demanding texts. And, as the texts become more demanding, the reader
grows.
Communicating with Lexile measures. Lexile measures can be used to communicate with
students, parents, teachers, educators, and the community by providing a common language to
use to talk about reading growth and development. By aligning all areas of the educational
system, parents can be included in the instructional process. With a variety of data related to a
student’s reading level a more complete picture can be formed and more informed decisions can
be made concerning reading-group placement, amount of extra instruction needed, and
promotion/retention decisions.
It is much easier to understand what a national percentile rank of 50 means when it is tied to the
reading demands of book titles that are familiar to adults. Parents are encouraged to help their
children achieve high standards by expecting their children to succeed at school, communicating
with their children’s teachers and the school, and helping their children keep pace and do
homework.
Through the customized reading lists and electronic database of titles, parents can assist their
children in the selection of reading materials that are at the appropriate level of challenge and
monitor the reading process at home. A link can be provided to the “Find a Book with Lexiles”
website. This site provides a quick, free resource to battle “summer slide” – the learning losses
that students often experience during the summer months when they are not in school. Lexiles
make it easy to help students read and learn all summer long and during the school year. This
website can help build a reading list of books at a young person’s reading level that are about
subjects that interest him or her. This website can be viewed at
http://www.lexile.com/findabook/.
In one large school district, the end-of-year testing results are sent home to parents in a folder.
The folder consists of a Lexile Map on one side and a letter from the superintendent on the other
side. The school district considers this type of material as “refrigerator-friendly.” They
encourage parents to put the Lexile Map on the refrigerator and use it to monitor and track the
reading progress of their child throughout the school year.
Confidential—Not for Distribution
MetaMetrics—eMPower Reading Assessments - Lexile Linking Report—April 2017 Page 49
The community-at-large (business leaders, citizens, politicians, and visitors) sees the educational
system as a reflection of the community. Through the reporting of assessment results (after all,
that is what the community is most interested in—results), people can understand what the
community values and see the return for its investment in the schools and its children.
One way to involve the community is to work with the public libraries and local bookstores
when developing reading lists. The organizations should be contacted early enough so that they
can be sure that the books will be available. Often books can be displayed with their Lexile
measures for easy access.
Many school districts make presentations to civic groups to educate the community as to their
reading initiatives and how the Lexile Framework is being utilized in the school. Conversely,
many civic groups are looking for an activity to sponsor, and it could be as simple as “donate-a-
book” or “sponsor-a-reader” campaigns.

Confidential—Not for Distribution
MetaMetrics—eMPower Reading Assessments - Lexile Linking Report—April 2017 Page 50
Confidential—Not for Distribution
MetaMetrics—eMPower Reading Assessments - Lexile Linking Report—April 2017 Page 51
References American Educational Research Association, American Psychological Association, & National
Council on Measurement in Education. (1999). Standards for educational and
psychological testing. Washington, DC: American Educational Research Association.
Bormuth, J.R. (1966). Readability: New approach. Reading Research Quarterly, 7, 79-132.
Carroll, J.B., Davies, P., & Richman, B. (1971). Word frequency book. Boston: Houghton
Mifflin.
Carver, R.P. (1974). Measuring the primary effect of reading: Reading storage technique,
understanding judgments and cloze. Journal of Reading Behavior, 6, 249-274.
Chall, J.S. (1988). “The beginning years.” In B.L. Zakaluk and S.J. Samuels (Eds.),
Readability: Its past, present, and future. Newark, DE: International Reading
Association.
Crain, S. & Shankweiler, D. (1988). “Syntactic complexity and reading acquisition.” In A.
Davidson and G.M. Green (Eds.), Linguistic complexity and text comprehension:
Readability issues reconsidered. Hillsdale, NJ: Erlbaum Associates.
Davidson, A. & Kantor, R.N. (1982). On the failure of readability formulas to define readable
text: A case study from adaptations. Reading Research Quarterly, 17, 187- 209.
Dunn, L.M. & Dunn, L.M. (1981). Manual for Forms L and M of the Peabody Picture
Vocabulary Test—Revised. Circle Pines, MN: American Guidance Service.
Dunn, L.M. & Markwardt, F.C. (1970). Peabody Individual Achievement Test. Circle Pines, MN:
American Guidance Service.
Efron, B. (1981). Nonparametric estimates of the standard error: The Jackknife, the Bootstrap,
and other resampling techniques. Biometrika. 68, 589-599.
Grolier, Inc. (1986). The electronic encyclopedia. Danbury, CT: Author.
Haladyna, T. M., (1994). Developing and Validating Multiple-Choice Test Items. Hillsdale, NJ.
Lawrence Erlbaum Associates.
Klare, G.R. (1963). The measurement of readability. Ames, IA: Iowa State University Press.
Kolen, M.J. & Brennan, R.L. (2014). Test equating, scaling, and linking: Methods and practices.
Third edition. New York: Springer Science + Business Media, LLC.
Confidential—Not for Distribution
MetaMetrics—eMPower Reading Assessments - Lexile Linking Report—April 2017 Page 52
Liberman, I.Y., Mann, V.A., Shankweiler, D., & Westelman, M. (1982). Children’s memory for
recurring linguistic and non-linguistic material in relation to reading ability. Cortex, 18,
367-375.
Linacre, J.M. (2011). WINSTEPS (Version 3.70) [Computer Program]. Chicago: Author.
Lord, F.M. (1980). Applications of item response theory to practical testing problems. New
York: Erlbaum Associates.
McGraw-Hill Book Company. (1983). Guidelines for bias-free publishing. Monterey, CA:
Author.
Measured Progress. (2017). eMPower Assessments: Technical bulletin. Retrieved from
https://www.measuredprogress.org/wp-content/uploads/2017/03/eMPower-Assessments-
Technical-Bulletin.pdf
MetaMetrics, Inc. (2008). The text continuum in 2008. Presented at the Lexile National
Conference, San Antonio, TX.
Miller, G.A. & Gildea, P.M. (1987). How children learn words. Scientific American, 257, 94-99.
National Governors Association Center for Best Practices & Council of Chief State School
Officers. (2010). Common Core State Standards for English Language Arts & Literacy in
History/Social Studies, Science, and Technical Subjects, Appendix A. Washington, DC:
Author.
National Research Council. (1999). Uncommon measures: Equivalence and linkage among
educational tests. Washington, D.C.: National Academy Press.
Petersen, N.S., Kolen, M.J., & Hoover, H.D. (1989). “Scaling, Norming, and Equating.” In R.L.
Linn (Ed.), Educational Measurement (Third Edition) (pp. 221-262). New York:
American Council on Education and Macmillan Publishing Company.
Poznanski, J.B. (1990). A meta-analytic approach to the estimation of item difficulties.
Unpublished doctoral dissertation, Duke University, Durham, NC.
Sanford-Moore, E., & Williamson, G. L. (2012). Bending the text complexity curve to close the
gap (MetaMetrics Research Brief). Durham, NC: MetaMetrics, Inc.
Schnick, T. & Knickelbine, M. (2000). The Lexile Framework: An introduction for educators.
Durham, NC: MetaMetrics, Inc.
Shankweiler, D. & Crain, S. (1986). Language mechanisms and reading disorder: A modular
approach. Cognition, 14, 139-168.
Confidential—Not for Distribution
MetaMetrics—eMPower Reading Assessments - Lexile Linking Report—April 2017 Page 53
Sitter, R.R. (1992). Comparing three bootstrap methods for survey data. The Canadian Journal
of Statistics, 20(2), 135-154.
Smith, M. (2011, March 30). Bending the reading growth trajectory: Instructional strategies to
promote reading skills and close the readiness gap. MetaMetrics Policy Brief. Durham,
NC: MetaMetrics, Inc.
Smith, M. (2012, February). Not so common: Comparing Lexile®
Measures with the standards'
other text complexity tools. MetaMetrics White Paper. Durham, NC: MetaMetrics, Inc.
Stenner, A.J. (1990). Objectivity: Specific and general. Rasch Measurement Transactions, 4,
111.
Stenner, A. J., Sanford-Moore, E., & Williamson, G. L. (2012). The Lexile®
Framework for
Reading quantifies the reading ability needed for “College & Career Readiness.”
MetaMetrics Research Brief. Durham, NC: MetaMetrics, Inc.
Stenner, A.J., Smith, M., & Burdick, D.S. (1983). Toward a theory of construct definition.
Journal of Educational Measurement, 20(4), 305-315.
Stenner, A.J., Smith, D.R., Horabin, I., & Smith, M. (1987a). Fit of the Lexile Theory to item
difficulties on fourteen standardized reading comprehension tests. Durham, NC:
MetaMetrics, Inc.
Stenner, A.J., Smith, D.R., Horabin, I., & Smith, M. (1987b). Fit of the Lexile Theory to
sequenced units from eleven basal series. Durham, NC: MetaMetrics, Inc.
Tomlinson, C.A. (1999). The differentiated classroom. Alexandria, VA: Association for
Supervision and Curriculum Development.
Williamson, G. L. (2008). A text readability continuum for postsecondary readiness. Journal of
Advanced Academics, 19(4), 602-632.
Williamson, G. L. (2011, March 16-17). Growth and growth norms: Standards for academic
growth. Presentation at the first semi-annual meeting of MetaMetrics’ Technical
Advisory Committee, held at MetaMetrics, Inc., Durham, NC.
Williamson, G. L., Koons, H., Sandvik, T., & Sanford-Moore, E. (2012). The text complexity
continuum in grades 1-12 (MetaMetrics Research Brief). Durham, NC: MetaMetrics, Inc.
Williamson, G. L., Thompson, C. L., and Baker, R. F. (2007, April). North Carolina's growth in
reading and mathematics. AERA Distinguished Paper Presentation at the 2007 annual
meeting of the American Educational Research Association (AERA), Chicago, IL.
Wright, B.D. & Linacre, J.M. (1994, August). The Rasch model as a foundation for the Lexile
Framework. Unpublished manuscript.

Confidential—Not for Distribution
MetaMetrics—eMPower Reading Assessments - Lexile Linking Report—April 2017 Page 54
Wright, B.D. & Stone, M.H. (1979). Best Test Design. Chicago: MESA Press.
Confidential—Not for Distribution
MetaMetrics—eMPower Reading Assessments - Lexile Linking Report—April 2017 Page 55
Appendix
The Lexile Framework for Reading Map

Confidential—Not for Distribution
MetaMetrics—eMPower Reading Assessments - Lexile Linking Report—April 2017 Page 56
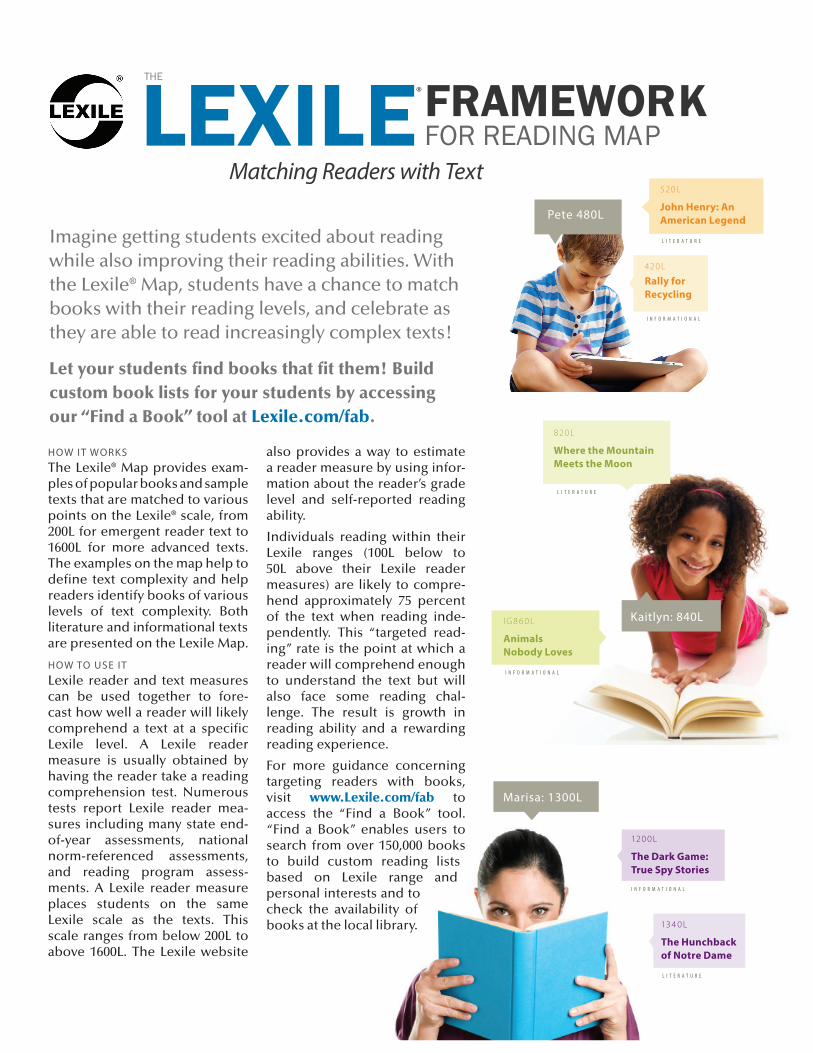
Kaitlyn: 840LI G8 6 0 L
Animals Nobody Loves
820 L
Where the Mountain Meets the Moon
i n f o r m a t i o n a l
i n f o r m a t i o n a l
l i t e r a t U r e
l i t e r a t U r e
Pete 480L
520 L
John Henry: An American Legend
420 L
Rally for Recycling
Marisa: 1300L
13 4 0 L
The Hunchback of Notre Dame
120 0 L
The Dark Game: True Spy Stories
How it worKsThe Lexile® Map provides exam-ples of popular books and sample texts that are matched to various points on the Lexile® scale, from 200L for emergent reader text to 1600L for more advanced texts. The examples on the map help to define text complexity and help readers identify books of various levels of text complexity. Both literature and informational texts are presented on the Lexile Map.
How to use itLexile reader and text measures can be used together to fore-cast how well a reader will likely comprehend a text at a specific Lexile level. A Lexile reader measure is usually obtained by having the reader take a reading comprehension test. Numerous tests report Lexile reader mea-sures including many state end-of-year assessments, national norm-referenced assessments, and reading program assess-ments. A Lexile reader measure places students on the same Lexile scale as the texts. This scale ranges from below 200L to above 1600L. The Lexile website
also provides a way to estimate a reader measure by using infor-mation about the reader’s grade level and self-reported reading ability.
Individuals reading within their Lexile ranges (100L below to 50L above their Lexile reader measures) are likely to compre-hend approximately 75 percent of the text when reading inde-pendently. This “targeted read-ing” rate is the point at which a reader will comprehend enough to understand the text but will also face some reading chal-lenge. The result is growth in reading ability and a rewarding reading experience.
For more guidance concerning targeting readers with books, visit www.Lexile.com/fab to access the “Find a Book” tool. “Find a Book” enables users to search from over 150,000 books to build custom reading lists based on Lexile range and personal interests and to check the availability of books at the local library.
Imagine getting students excited about reading while also improving their reading abilities. With the Lexile® Map, students have a chance to match books with their reading levels, and celebrate as they are able to read increasingly complex texts!
Let your students find books that fit them! Build custom book lists for your students by accessing our “Find a Book” tool at Lexile.com/fab.
i n f o r m a t i o n a l
l i t e r a t U r e
Matching Readers with Text
FRAMEWORKFOR READING MAP
THE

The Lexile Framework for Reading
**Common Core State Standards Text Exemplar
iNf
oR
MA
Tio
NA
L
|
LiT
eR
AT
UR
e |
1300 L 1500L+ Le x i Le R AN G e
1500
L+
15 0 0 L Don Quixote** C e r v a n t e s
The Words were to me so many Pearls of Eloquence, and his Voice sweeter to my Ears than Sugar to the Taste. The Reflection on the Misfortune which these Verses brought on me, has often made me applaud Plato’s Design of ban-ishing all Poets from a good and well governed Common-wealth, especially those who write wantonly or lasciviously. For, instead of composing lamentable Verses, like those of the Marquiss of Mantua, that make Women and Children cry by the Fireside, they try their utmost Skill on such soft Strokes as enter the Soul, and wound it, like that Thunder which hurts and consumes all within, yet leaves the Garment sound. Another Time he entertained me with the following Song.
1400
L14
95L
The Legend of Sleepy Hollow ( I r v I n g )
Billy Budd** ( M e L v I L L e )
The Story of King Arthur and His Knights ( P y L e )
Life All Around Me by ellen foster ( g I b b o n s )
The Scarlet Letter** ( H a w t H o r n e )
America’s Constitution: A Biography** ( a M a r )
Gettysburg Address ( L I n C o L n )
The Declaration of independence
Profiles in Courage ( K e n n e d y )
The Life and Times of frederick Douglass ( d o u g L a s s )
14 6 0 L
14 5 0 L
14 3 0 L
14 2 0 L
14 2 0 L
14 9 0 L
14 9 0 L
14 8 0 L
141 0 L
14 0 0 L
14 0 0 L Nathaniel’s Nutmeg M I L t o n Setting sail once again they kept a sharp look-out for Busse Island, discovered thirty years previously by Martin Frobisher, but the rolling sea mists had grown too thick. Storms and gale—force winds plagued them for days on end and at one point grew so ferocious that the foremast cracked, splintered and was hurled into the sea. It was with considerable relief that the crew sighted through the mist the coast of Newfoundland—a vague geographical term in Hudson’s day—at the beginning of July. They dropped anchor in Penobscot Bay, some one hundred miles west of Nova Scotia.
s A M P L e t i t L e s
iNf
oR
MA
Tio
NA
L |
LiT
eR
AT
UR
e |
1300
L13
95L
Robinson Crusoe ( d e f o e )
The Secret Sharer ( C o n r a d )
The Hunchback of Notre Dame ( H u g o )
The Metamorphosis** ( K a f K a )
fever Pitch ( H o r n b y )
in Defense of food: An eater’s Manifesto ( P o L L a n )
Politics and the english Language** ( o r w e L L )
Jane Austen’s Pride and Prejudice ( b L o o M )
Walden** ( t H o r e a u )
Arctic Dreams: imagination and Desire in a Northern Landscape ( L o P e z )
13 6 0 L
13 5 0 L
13 4 0 L
13 4 0 L
13 4 0 L
13 9 0 L
13 8 0 L
13 7 0 L
13 4 0 L
13 0 0 L
13 0 0 L 1776: America and Britain at War** M C C u L L o u g H
But from this point on, the citizen-soldiers of Washington’s army were no longer to be fighting only for the defense of their country, or for their rightful liberties as freeborn Englishmen, as they had at Lexington and Concord, Bunker Hill and through the long siege at Boston. It was now a proudly proclaimed, all-out war for an independent America, a new America, and thus a new day of freedom and equality. At his home in Newport, Nathanael Greene’s mentor, the Reverend Ezra Stiles, wrote in his diary almost in disbelief: Thus the Congress has tied a Gordian knot, which the Parl [iament] will find they can neither cut, nor untie. The thirteen united colonies now rise into an Independent Republic among the kingdoms, states, and empires on earth...And have I lived to see such an impor-tant and astonishing revolution?
s A M P L e t i t L e s
iNf
oR
MA
Tio
NA
L |
L
iTe
RA
TU
Re
|
The Plot Against America ( r o t H )
Rob Roy ( s C o t t )
The Good earth ( b u C K )
A fable ( f a u L K n e r )
The Decameron ( b o C C a C C I o )
Sustaining Life: How Human Health Depends on Biodiversity ( C H I v I a n & b e r n s t e I n )
The Art of War ( s u n t z u )
The United States’ Constitution
fair Play: The ethics of Sport ( s I M o n )
Critique of Pure Reason ( K a n t )
16 4 0 L
15 6 0 L
15 3 0 L
15 2 0 L
15 0 0 L
16 0 0 L
15 5 0 L
15 6 0 L
15 2 0 L
15 0 0 L
s A M P L e t i t L e s
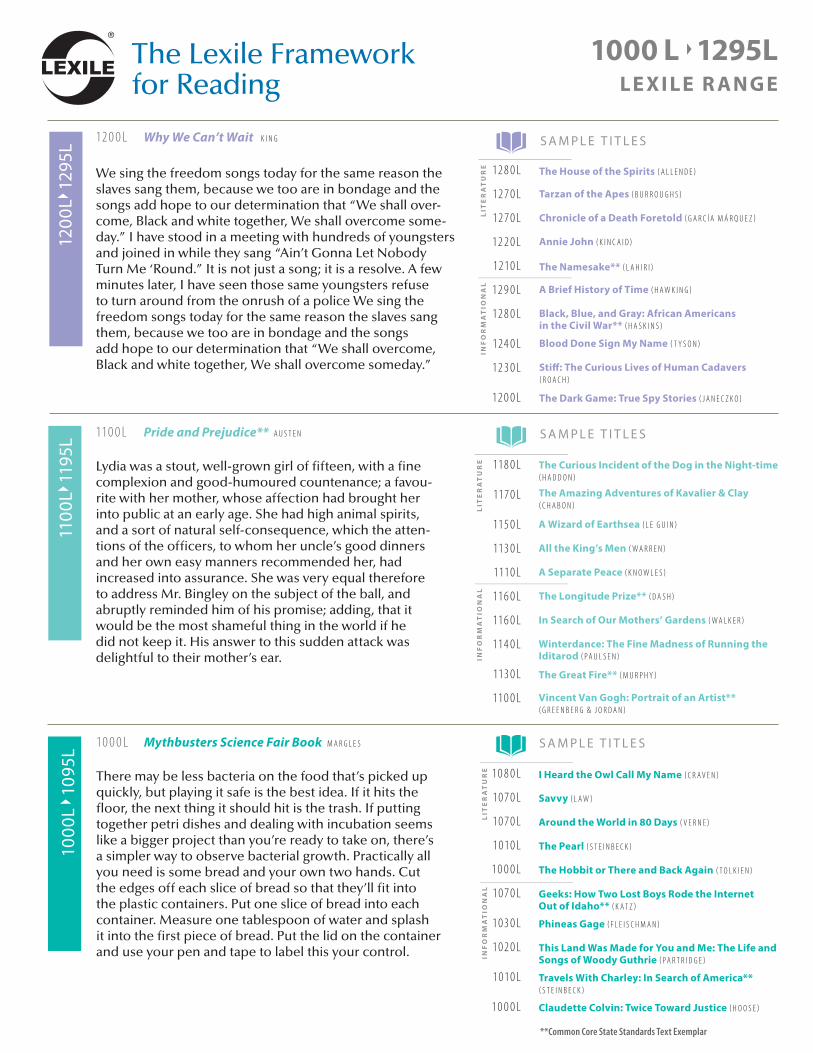
The Lexile Framework for Reading
**Common Core State Standards Text Exemplar
iNf
oR
MA
Tio
NA
L |
L
iTe
RA
TU
Re
|iN
fo
RM
AT
ioN
AL
|
LiT
eR
AT
UR
e |
1000 L 1295L Le x i Le R AN G e
1200
L12
95L
The House of the Spirits ( a L L e n d e )
Tarzan of the Apes ( b u r r o u g H s )
Chronicle of a Death foretold ( g a r C í a M á r q u e z )
Annie John ( K I n C a I d )
The Namesake** ( L a H I r I )
A Brief History of Time ( H a w K I n g )
Black, Blue, and Gray: African Americans in the Civil War** ( H a s K I n s )
Blood Done Sign My Name ( t y s o n )
Stiff: The Curious Lives of Human Cadavers ( r o a C H )
The Dark Game: True Spy Stories ( J a n e C z K o )
12 8 0 L
12 7 0 L
12 7 0 L
12 2 0 L
12 1 0 L
12 9 0 L
12 8 0 L
124 0 L
12 3 0 L
12 0 0 L
12 0 0 L Why We Can’t Wait K I n g
We sing the freedom songs today for the same reason the slaves sang them, because we too are in bondage and the songs add hope to our determination that “We shall over-come, Black and white together, We shall overcome some-day.” I have stood in a meeting with hundreds of youngsters and joined in while they sang “Ain’t Gonna Let Nobody Turn Me ‘Round.” It is not just a song; it is a resolve. A few minutes later, I have seen those same youngsters refuse to turn around from the onrush of a police We sing the freedom songs today for the same reason the slaves sang them, because we too are in bondage and the songs add hope to our determination that “We shall overcome, Black and white together, We shall overcome someday.”
1100
L11
95L
118 0 L
117 0 L
115 0 L
113 0 L
111 0 L
116 0 L
116 0 L
114 0 L
113 0 L
11 0 0 L
The Curious incident of the Dog in the Night-time ( H a d d o n )
The Amazing Adventures of Kavalier & Clay ( C H a b o n )
A Wizard of earthsea ( L e g u I n )
All the King’s Men ( w a r r e n )
A Separate Peace ( K n o w L e s )
The Longitude Prize** ( d a s H )
in Search of our Mothers’ Gardens ( w a L K e r )
Winterdance: The fine Madness of Running the iditarod ( P a u L s e n )
The Great fire** ( M u r P H y )
Vincent Van Gogh: Portrait of an Artist** ( g r e e n b e r g & J o r d a n )
110 0 L Pride and Prejudice** a u s t e n
Lydia was a stout, well-grown girl of fifteen, with a fine complexion and good-humoured countenance; a favou-rite with her mother, whose affection had brought her into public at an early age. She had high animal spirits, and a sort of natural self-consequence, which the atten-tions of the officers, to whom her uncle’s good dinners and her own easy manners recommended her, had increased into assurance. She was very equal therefore to address Mr. Bingley on the subject of the ball, and abruptly reminded him of his promise; adding, that it would be the most shameful thing in the world if he did not keep it. His answer to this sudden attack was delightful to their mother’s ear.
s A M P L e t i t L e s
s A M P L e t i t L e s
iNf
oR
MA
Tio
NA
L |
LiT
eR
AT
UR
e |
1000
L
1095
L 10 0 0 L Mythbusters Science Fair Book M a r g L e s
There may be less bacteria on the food that’s picked up quickly, but playing it safe is the best idea. If it hits the floor, the next thing it should hit is the trash. If putting together petri dishes and dealing with incubation seems like a bigger project than you’re ready to take on, there’s a simpler way to observe bacterial growth. Practically all you need is some bread and your own two hands. Cut the edges off each slice of bread so that they’ll fit into the plastic containers. Put one slice of bread into each container. Measure one tablespoon of water and splash it into the first piece of bread. Put the lid on the container and use your pen and tape to label this your control.
i Heard the owl Call My Name ( C r a v e n )
Savvy ( L a w )
Around the World in 80 Days ( v e r n e )
The Pearl ( s t e I n b e C K )
The Hobbit or There and Back Again ( t o L K I e n )
Geeks: How Two Lost Boys Rode the internet out of idaho** ( K a t z )
Phineas Gage ( f L e I s C H M a n )
This Land Was Made for You and Me: The Life and Songs of Woody Guthrie ( P a r t r I d g e )
Travels With Charley: in Search of America** ( s t e I n b e C K )
Claudette Colvin: Twice Toward Justice ( H o o s e )
1 0 8 0 L
1 0 7 0 L
1 0 7 0 L
1 0 1 0 L
1 0 0 0 L
1 0 7 0 L
1 0 3 0 L
1 0 2 0 L
1 0 1 0 L
1 0 0 0 L
s A M P L e t i t L e s
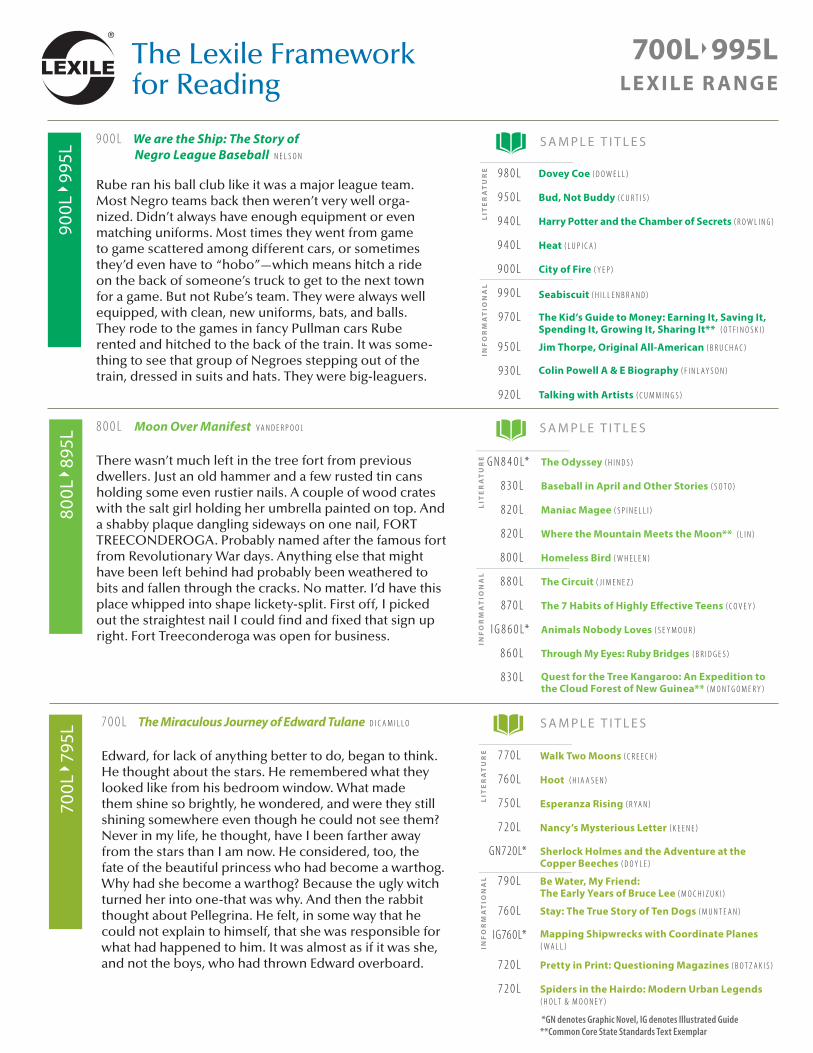
The Lexile Framework for Reading
**Common Core State Standards Text Exemplar
iNf
oR
MA
Tio
NA
L |
L
iTe
RA
TU
Re
|iN
fo
RM
AT
ioN
AL
|
L
iTe
RA
TU
Re
|
700L995L Le x i Le R AN G e
900L
995L
9 0 0 L We are the Ship: The Story of Negro League Baseball n e L s o n
Rube ran his ball club like it was a major league team. Most Negro teams back then weren’t very well orga-nized. Didn’t always have enough equipment or even matching uniforms. Most times they went from game to game scattered among different cars, or sometimes they’d even have to “hobo”—which means hitch a ride on the back of someone’s truck to get to the next town for a game. But not Rube’s team. They were always well equipped, with clean, new uniforms, bats, and balls. They rode to the games in fancy Pullman cars Rube rented and hitched to the back of the train. It was some-thing to see that group of Negroes stepping out of the train, dressed in suits and hats. They were big-leaguers.
Dovey Coe ( d o w e L L )
Bud, Not Buddy ( C u r t I s )
Harry Potter and the Chamber of Secrets ( r o w L I n g )
Heat ( L u P I C a )
City of fire ( y e P )
Seabiscuit ( H I L L e n b r a n d )
The Kid’s Guide to Money: earning it, Saving it, Spending it, Growing it, Sharing it** ( o t f I n o s K I )
Jim Thorpe, original All-American ( b r u C H a C )
Colin Powell A & e Biography ( f I n L a y s o n )
Talking with Artists ( C u M M I n g s )
9 8 0 L
9 5 0 L
9 4 0 L
9 4 0 L
9 0 0 L
9 9 0 L
9 7 0 L
9 5 0 L
9 3 0 L
9 2 0 L
g n 8 4 0 L*
8 3 0 L
8 2 0 L
8 2 0 L
8 0 0 L
8 8 0 L
8 7 0 L
I g 8 6 0 L*
8 6 0 L
8 3 0 L
s A M P L e t i t L e s
800L
895L
The odyssey ( H I n d s )
Baseball in April and other Stories ( s o t o )
Maniac Magee ( s P I n e L L I )
Where the Mountain Meets the Moon** ( L I n )
Homeless Bird ( w H e L e n )
The Circuit ( J I M e n e z )
The 7 Habits of Highly effective Teens ( C o v e y )
Animals Nobody Loves ( s e y M o u r )
Through My eyes: Ruby Bridges ( b r I d g e s )
Quest for the Tree Kangaroo: An expedition to the Cloud forest of New Guinea** ( M o n t g o M e r y )
8 0 0 L Moon Over Manifest v a n d e r P o o L
There wasn’t much left in the tree fort from previous dwellers. Just an old hammer and a few rusted tin cans holding some even rustier nails. A couple of wood crates with the salt girl holding her umbrella painted on top. And a shabby plaque dangling sideways on one nail, FORT TREECONDEROGA. Probably named after the famous fort from Revolutionary War days. Anything else that might have been left behind had probably been weathered to bits and fallen through the cracks. No matter. I’d have this place whipped into shape lickety-split. First off, I picked out the straightest nail I could find and fixed that sign up right. Fort Treeconderoga was open for business.
s A M P L e t i t L e s
s A M P L e t i t L e s
700L
795L
7 0 0 L The Miraculous Journey of Edward Tulane d I C a M I L L o
Edward, for lack of anything better to do, began to think. He thought about the stars. He remembered what they looked like from his bedroom window. What made them shine so brightly, he wondered, and were they still shining somewhere even though he could not see them? Never in my life, he thought, have I been farther away from the stars than I am now. He considered, too, the fate of the beautiful princess who had become a warthog. Why had she become a warthog? Because the ugly witch turned her into one-that was why. And then the rabbit thought about Pellegrina. He felt, in some way that he could not explain to himself, that she was responsible for what had happened to him. It was almost as if it was she, and not the boys, who had thrown Edward overboard.
Walk Two Moons ( C r e e C H )
Hoot ( H I a a s e n )
esperanza Rising ( r y a n )
Nancy’s Mysterious Letter ( K e e n e )
Sherlock Holmes and the Adventure at the Copper Beeches ( d o y L e )
Be Water, My friend: The early Years of Bruce Lee ( M o C H I z u K I )
Stay: The True Story of Ten Dogs ( M u n t e a n )
Mapping Shipwrecks with Coordinate Planes ( w a L L )
Pretty in Print: Questioning Magazines ( b o t z a K I s )
Spiders in the Hairdo: Modern Urban Legends ( H o L t & M o o n e y )
7 7 0 L
76 0 L
7 5 0 L
7 2 0 L
gn720L*
7 9 0 L
76 0 L
Ig760L*
7 2 0 L
7 2 0 L
iNf
oR
MA
Tio
NA
L |
L
iTe
RA
TU
Re
|
*GN denotes Graphic Novel, IG denotes Illustrated Guide
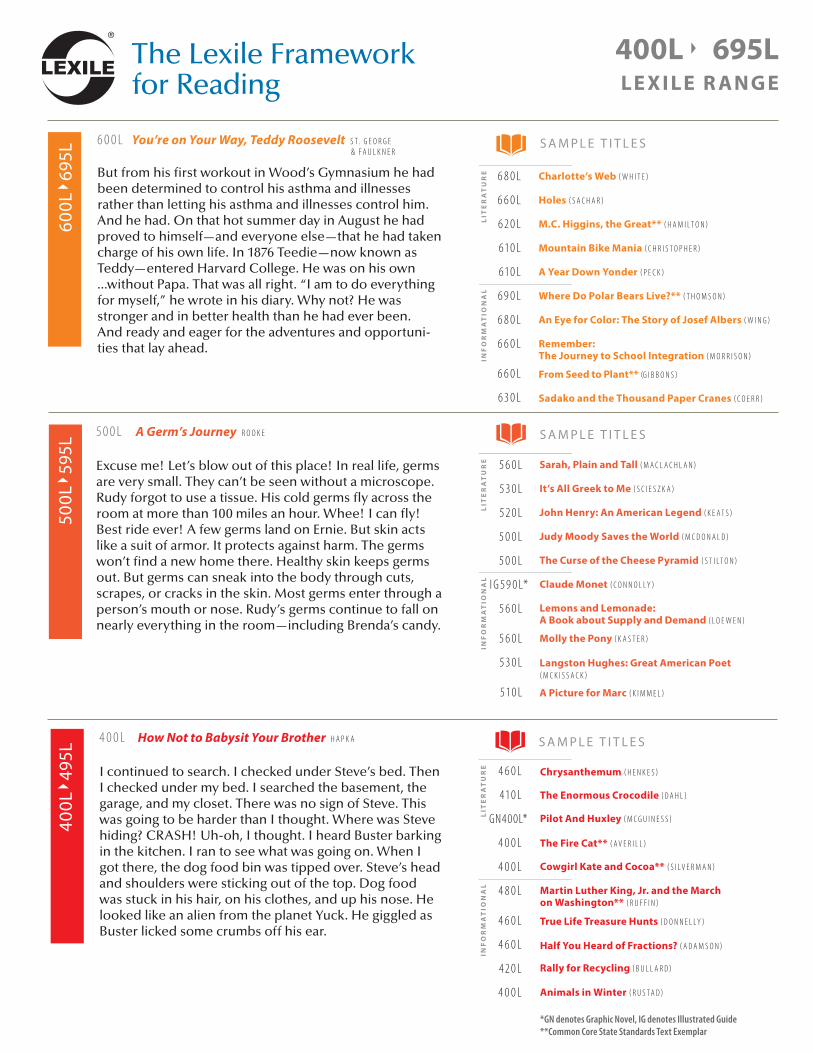
The Lexile Framework for Reading
**Common Core State Standards Text Exemplar
iNf
oR
MA
Tio
NA
L |
LiT
eR
AT
UR
e |
400L 695L Le x i Le R AN G e
600L
695L
Charlotte’s Web ( w H I t e )
Holes ( s a C H a r )
M.C. Higgins, the Great** ( H a M I L t o n )
Mountain Bike Mania ( C H r I s t o P H e r )
A Year Down Yonder ( P e C K )
Where Do Polar Bears Live?** ( t H o M s o n )
An eye for Color: The Story of Josef Albers ( w I n g )
Remember: The Journey to School integration ( M o r r I s o n )
from Seed to Plant** (g I b b o n s )
Sadako and the Thousand Paper Cranes ( C o e r r )
6 0 0 L You’re on Your Way, Teddy Roosevelt s t . g e o r g e & f a u L K n e r
But from his first workout in Wood’s Gymnasium he had been determined to control his asthma and illnesses rather than letting his asthma and illnesses control him. And he had. On that hot summer day in August he had proved to himself—and everyone else—that he had taken charge of his own life. In 1876 Teedie—now known as Teddy—entered Harvard College. He was on his own ...without Papa. That was all right. “I am to do everything for myself,” he wrote in his diary. Why not? He was stronger and in better health than he had ever been. And ready and eager for the adventures and opportuni-ties that lay ahead.
s A M P L e t i t L e s
500L
595L
Sarah, Plain and Tall ( M a C L a C H L a n )
it’s All Greek to Me ( s C I e s z K a )
John Henry: An American Legend ( K e a t s )
Judy Moody Saves the World ( M C d o n a L d )
The Curse of the Cheese Pyramid ( s t I L t o n )
Claude Monet ( C o n n o L L y )
Lemons and Lemonade: A Book about Supply and Demand ( L o e w e n )
Molly the Pony ( K a s t e r )
Langston Hughes: Great American Poet ( M C K I s s a C K )
A Picture for Marc ( K I M M e L )
5 0 0 L A Germ’s Journey r o o K e
Excuse me! Let’s blow out of this place! In real life, germs are very small. They can’t be seen without a microscope. Rudy forgot to use a tissue. His cold germs fly across the room at more than 100 miles an hour. Whee! I can fly! Best ride ever! A few germs land on Ernie. But skin acts like a suit of armor. It protects against harm. The germs won’t find a new home there. Healthy skin keeps germs out. But germs can sneak into the body through cuts, scrapes, or cracks in the skin. Most germs enter through a person’s mouth or nose. Rudy’s germs continue to fall on nearly everything in the room—including Brenda’s candy.
s A M P L e t i t L e s
iNf
oR
MA
Tio
NA
L |
LiT
eR
AT
UR
e |
5 6 0 L
5 3 0 L
5 2 0 L
5 0 0 L
5 0 0 L
I g 5 9 0 L*
5 6 0 L
5 6 0 L
5 3 0 L
51 0 L
6 8 0 L
6 6 0 L
6 2 0 L
61 0 L
61 0 L
6 9 0 L
6 8 0 L
6 6 0 L
6 6 0 L
6 3 0 L
400L
495L
Chrysanthemum ( H e n K e s )
The enormous Crocodile ( d a H L )
Pilot And Huxley ( M C g u I n e s s )
The fire Cat** ( a v e r I L L )
Cowgirl Kate and Cocoa** ( s I L v e r M a n )
Martin Luther King, Jr. and the March on Washington** ( r u f f I n )
True Life Treasure Hunts ( d o n n e L L y )
Half You Heard of fractions? ( a d a M s o n )
Rally for Recycling ( b u L L a r d )
Animals in Winter ( r u s t a d )
4 0 0 L How Not to Babysit Your Brother H a P K a
I continued to search. I checked under Steve’s bed. Then I checked under my bed. I searched the basement, the garage, and my closet. There was no sign of Steve. This was going to be harder than I thought. Where was Steve hiding? CRASH! Uh-oh, I thought. I heard Buster barking in the kitchen. I ran to see what was going on. When I got there, the dog food bin was tipped over. Steve’s head and shoulders were sticking out of the top. Dog food was stuck in his hair, on his clothes, and up his nose. He looked like an alien from the planet Yuck. He giggled as Buster licked some crumbs off his ear.
4 6 0 L
41 0 L
gn400L*
4 0 0 L
4 0 0 L
4 8 0 L
4 6 0 L
4 6 0 L
4 2 0 L
4 0 0 L
iNf
oR
MA
Tio
NA
L |
L
iTe
RA
TU
Re
|s A M P L e t i t L e s
*GN denotes Graphic Novel, IG denotes Illustrated Guide
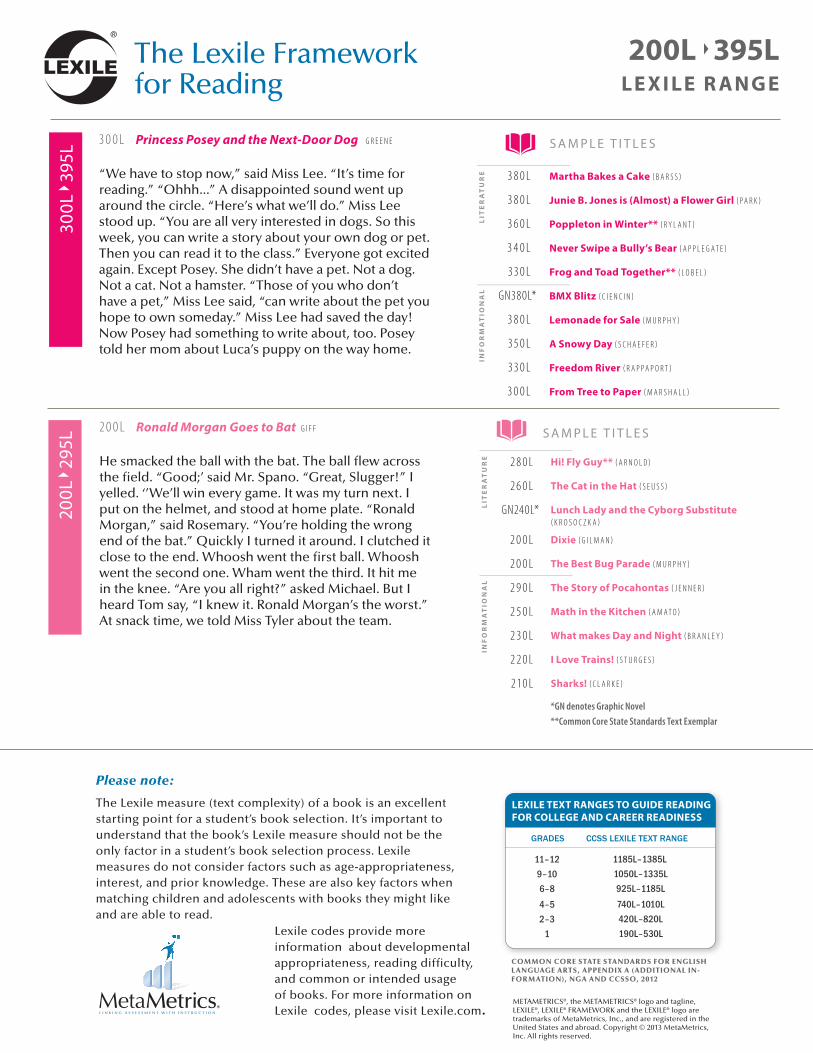
LexiLe TexT RANGeS To GUiDe ReADiNG foR CoLLeGe AND CAReeR ReADiNeSS
iNf
oR
MA
Tio
NA
L |
LiT
eR
AT
UR
e |
iNf
oR
MA
Tio
NA
L |
L
iTe
RA
TU
Re
|
200L 395L Le x i Le R AN G e
s A M P L e t i t L e s
200L
295L
Hi! fly Guy** ( a r n o L d )
The Cat in the Hat ( s e u s s )
Lunch Lady and the Cyborg Substitute ( K r o s o C z K a )
Dixie ( g I L M a n )
The Best Bug Parade ( M u r P H y )
The Story of Pocahontas ( J e n n e r )
Math in the Kitchen ( a M a t o )
What makes Day and Night ( b r a n L e y )
i Love Trains! ( s t u r g e s )
Sharks! ( C L a r K e )
2 0 0 L Ronald Morgan Goes to Bat g I f f
He smacked the ball with the bat. The ball flew across the field. “Good;’ said Mr. Spano. “Great, Slugger!” I yelled. ‘’We’ll win every game. It was my turn next. I put on the helmet, and stood at home plate. “Ronald Morgan,” said Rosemary. “You’re holding the wrong end of the bat.” Quickly I turned it around. I clutched it close to the end. Whoosh went the first ball. Whoosh went the second one. Wham went the third. It hit me in the knee. “Are you all right?” asked Michael. But I heard Tom say, “I knew it. Ronald Morgan’s the worst.” At snack time, we told Miss Tyler about the team.
2 8 0 L
2 6 0 L
gn240L*
2 0 0 L
2 0 0 L
2 9 0 L
2 5 0 L
2 3 0 L
2 2 0 L
2 1 0 L
300L
395L
3 0 0 L Princess Posey and the Next-Door Dog g r e e n e
“We have to stop now,” said Miss Lee. “It’s time for reading.” “Ohhh...” A disappointed sound went up around the circle. “Here’s what we’ll do.” Miss Lee stood up. “You are all very interested in dogs. So this week, you can write a story about your own dog or pet. Then you can read it to the class.” Everyone got excited again. Except Posey. She didn’t have a pet. Not a dog. Not a cat. Not a hamster. “Those of you who don’t have a pet,” Miss Lee said, “can write about the pet you hope to own someday.” Miss Lee had saved the day! Now Posey had something to write about, too. Posey told her mom about Luca’s puppy on the way home.
3 8 0 L
3 8 0 L
3 6 0 L
3 4 0 L
3 3 0 L
gn380L*
3 8 0 L
3 5 0 L
3 3 0 L
3 0 0 L
Martha Bakes a Cake ( b a r s s )
Junie B. Jones is (Almost) a flower Girl ( P a r K )
Poppleton in Winter** ( r y L a n t )
Never Swipe a Bully’s Bear ( a P P L e g a t e )
frog and Toad Together** ( L o b e L )
BMx Blitz ( C I e n C I n )
Lemonade for Sale ( M u r P H y )
A Snowy Day ( s C H a e f e r )
freedom River ( r a P P a P o r t )
from Tree to Paper ( M a r s H a L L )
s A M P L e t i t L e s
Common Core State StandardS For engLiShLanguage artS, appendix a (additionaL in-Formation), nga and CCSSo, 2012
Please note:
The Lexile measure (text complexity) of a book is an excellent starting point for a student’s book selection. It’s important to understand that the book’s Lexile measure should not be the only factor in a student’s book selection process. Lexile measures do not consider factors such as age-appropriateness, interest, and prior knowledge. These are also key factors when matching children and adolescents with books they might like and are able to read.
The Lexile Framework for Reading
**Common Core State Standards Text Exemplar
Lexile codes provide more information about developmental appropriateness, reading difficulty, and common or intended usage of books. For more information on Lexile codes, please visit Lexile.com.
METAMETRICS®, the METAMETRICS® logo and tagline, LEXILE®, LEXILE® FRAMEWORK and the LEXILE® logo are trademarks of MetaMetrics, Inc., and are registered in the United States and abroad. Copyright © 2013 MetaMetrics, Inc. All rights reserved.
*GN denotes Graphic Novel