Embed Size (px)
Citation preview

LINEAR ACCELERATOR MULTILEAF COLLIMATOR
QUALITY CONTROL METHODOLOGIES
IN RADIOTHERAPY
Ayron Edward Rule
A Dissertation submitted to the Faculty of Science, University of the Witwatersrand,
Johannesburg, in fulfilment of the requirements for the degree of Master of Science.
May 2016

ii
DECLARATION
I declare that "Linear Accelerator Multileaf Collimator Quality Control Methodologies in
Radiotherapy" thesis is my own work and that all sources that I have used or quoted have
been indicated and acknowledged by means of complete references. It is being submitted for
the Degree of Master of Science at the University of the Witwatersrand, Johannesburg. It has
not been submitted before for any degree or examination at any other University.
_______________________
(Signature of candidate)
30 day of May 2016

iii
ABSTRACT
Introduction: The Multileaf collimator (MLC) system introduction into Clinical Linear
Accelerators (Linacs), facilitated computer-control and verification of complex treatment, and
results in an increase in patient set up speed. An MLC system thus requires a re-evaluation of
the quality assurance (QA) requirements for beam collimation. This study investigated,
developed, performed and evaluated QA efforts for conventional MLCs with the aim to
evaluate the efficacy and reproducibility of the quality control (QC) procedures with different
detectors.
Materials and Methods: The performance of MLCs for an Elekta (Livingstone Hospital)
and Siemens (Charlotte Maxeke Johannesburg Academic Hospital) Linac were examined.
The major QC procedures studied were leaf matching, leaf position accuracy, intraleaf
leakage and transmission through abutting leaves. Three portal imaging devices
(radiographic film, radiochromic film and an Electronic Portal Imaging Device) and a PTW
LA48 Linear array were used as detectors. Record and verify data management systems were
used to set up and execute the procedures. The calibration of all the portal imaging devices
was also performed.
Results: The calibration procedure of the portal imaging devices is Linac specific in
execution. The profiles obtained indicated consistency across device and time. A combined
single execution procedure is viable and reproducible on all platforms.
Conclusion: The results show that the calibration of imaging devices is of great importance.
The MLC design influences the range and extent of QC that can be performed. This may
impact on the accuracy with which advanced technologies requiring high conformity and
reproducible leaf movement, can be delivered. Imaging devices each have specific resource
requirement issues affecting the efficacy of their use.

iv
DEDICATION
To my family, my wife Nadia, my son Kayne and my daughter Mia, you are why and who I
am and the reason I do what I do.
In memory of Dr Iona Ismail-Wesso, you will always be remembered and cherished.

v
ACKNOWLEDGEMENTS
This research report would not have been possible without the assistance and cooperation of
certain individuals and institutions, and the author would particularly like to thank the
following:
My supervisor Professor D. G. van der Merwe for assisting me in choosing this topic,
making the opportunity available to me and assisting me whenever and however I
needed throughout the process.
The departments of Radiation Oncology at Charlotte Maxeke Johannesburg Academic
Hospital and Livingstone Hospital for allowing me to use their Linear accelerators.
My colleagues, Ms Leandi van der Merwe and Mr Johan Engelbrecht for numerous
discussions about the subject.
My mother, Dr Iona Ismail-Wesso for your guidance and complete understanding.
My wife, Nadia Wesso-Rule for your support, grammatical and overall writing assis-
tance.

vi
TABLE OF CONTENTS
CONTENTS PAGE
DECLARATION ii
ABSTRACT iii
DEDICATION iv
ACKNOWLEDGEMENTS v
LIST OF FIGURES ix
LIST OF TABLES xv
ABBREVIATIONS xvi
1. INRODUCTION AND AIM 1
2. LITERATURE REVIEW 4
3. MATERIALS 9
3.1. Multileaf Collimators 9
3.2. Megavoltage 2 Dimensional Detectors 10
3.3. Ionization Chambers 11
3.4. Phantoms 11
3.5. Film Scanners and Dosimetric Software 12
4. METHODOLOGY 14
4.1. Experimental Test Procedures Introduction 14

vii
4.2. Quality Control Test Procedures Design 14
4.2.1. Leaf matching test procedure 14
4.2.2. Leaf position accuracy test procedure 15
4.2.3. Intraleaf leakage and abuttal test procedures 16
4.2.4. Combined test procedure 19
4.3. Megavoltage 2 Dimensional Detectors and Linear Array Setup and Calibration 19
4.3.1. Radiographic film 20
4.3.2. Radiochromic film 23
4.3.3. Electronic Portal Imaging Device (EPID) 24
4.3.4. Linear array 24
5. RESULTS 26
5.1. Results of the MLC Performance at CMJAH 26
5.1.1. Calibration curves 26
5.1.2. Quality Assurance test procedure results 28
5.2. Results of the MLC Performance at LH 35
5.2.1. Calibration curves 35
5.2.2. Quality Assurance test procedure results 37
5.3. CMJAH and LH Results Comparison 45
5.3.1. Leaf matching test procedure 45
5.3.2. Leaf position accuracy test procedure 45
5.3.3. Intraleaf leakage and abuttal test procedures 46
5.3.4. Combined test procedure 46
5.4. Portal Imaging Device and Linear Array Observations 47
5.4.1. Processing and Analysis Assessment of Imaging Devices 48

viii
6. ANALYSIS 50
6.1. Introduction 50
6.2. Leaf Matching Test Procedure Analysis 50
6.3. Leaf Position Accuracy Test Procedure Analysis 54
6.4. Intraleaf Leakage Test Procedure Analysis 58
6.5. Abuttal Test Procedure Analysis 60
6.6. Summary 60
7. CONCLUSION AND RECOMMENDATIONS 62
8. REFERENCES 64
APPENDIX
Similarity Summary Report 68

ix
LIST OF FIGURES
Figure 3.1: Diagram of Elekta Linac jaw and leaf orientation in the Linac
collimator head as used at LH. (Image found in Jordan et al.16) 9
Figure 3.2: Diagram of Siemens Linac jaw and leaf orientation in the Linac
collimator head as used at CMJAH. 10
Figure 3.3: Universal IMRT phantom structure indicating the film prickers, the
chamber slots and the two sections of the phantom 12
Figure 4.1: Diagram of leaf matching test procedure. 15
Figure 4.2: Diagram of leaf position accuracy test procedure predicted result for
the comparison between CMJAH and LH in this study. 16
Figure 4.3: Diagram of the Elekta and Siemens MLC systems indicating the tongue
and groove leaf configuration (Image found in Huq et. al24). 17
Figure 4.4: Diagram of intraleaf leakage and abuttal test procedures for CMJAH.
The thicker grey horizontal area indicates open leaves. 18
Figure 4.5: Diagram of the intraleaf leakage test procedure for LH. The thicker
grey horizontal area indicates open leaves. 18
Figure 4.6: Diagram of the combined test procedure consisting of segments for leaf
matching, leaf position accuracy, intraleaf leakage and abuttal test
procedures. 19
Figure 4.7: The positioning of the UIP for the exposure of films at the isocentre of
the CMJAH Linac. 20
Figure 4.8: The positioning of the UIP for the exposure of films at the SSD 63 cm
setup for the CMJAH Linac. 21
Figure 4.9: The positioning of the Polystyrene phantom for exposure of films at the
isocentre of the LH Linac 21
Figure 4.10: The positioning of the Polystyrene phantom for the exposure of the
films at the SSD 63 cm setup for LH Linac. 22
Figure 4.11: The position of the EPID for the exposure of EPID images for the LH
Linac. 24
Figure 4.12: The PTW MP3 water tank, support table and reservoir tank used with
the LA 48 at CMJAH. 25
Figure 4.13: The LA 48 set up in PTW MP-3 water tank for the CMJAH Linac 25

x
Figure 5.1: Image (a) illustrates the Kodak X-Omat VTM film exposed at CMJAH to
a 20 x 20 cm2 field size at isocentre in the UIP phantom with 20 MU
and a virtual wedge angle of 600 for the purpose of calibration of the the
Kodak X-Omat VTM film. Graph (b) is the linear-logarithmic curve
obtained when plotting the measured optical density against the known
dose for the corresponding MU field.
27
Figure 5.2: The Gafchromic EBT2 calibration curve for CMJAH 6 MV photon
beam. 27
Figure 5.3: The calibration curve from the PTW LA48 Linear array obtained from a
20 x 20 cm2 600 virtual wedge field delivered over 50 MU to the central
axis. The curve was measured at a depth of 5.5 cm in water at isocentre. 28
Figure 5.4: Image (a) is the Kodak X-OMat V film of the completed leaf matching
test procedure obtained using the UIP phantom at 5cm depth in phantom
with the film set up with a SSD of 63 cm for a 6 MV photon beam and
30 MU delivered per field segment. Graph (b) is the profile of the
central X-axis as indicated on image (a). The data were obtained using
the film calibration data, the MEPHYSTO software and adjusted to
represent the field dimensions at isocentre. 29
Figure 5.5: A comparison of the profile of the central X-axis produced from the
Kodak X-OMat V film on the 22 September 2014 and the 03 April
2015. 29
Figure 5.6: Image (a) is the Gafchromic EBT2 film of the completed leaf position
accuracy test procedure obtained using the UIP phantom with the film
set up with a SSD of 63 cm for 6 MV photon beam and 80 MU per
field segment. Graph (b) is the profile of the field defined by the MLC
along the central field segment as indicated on image (a). The data were
obtained using the film calibration data, the MEPHYSTO software and
adjusted to show the field dimensions as defined at isocentre. 30
Figure 5.7: A comparison of the profile 1 cm along the Y-axis produced from the
Gafchromic EBT2 film on the 21 September 2014 and the 03 April
2015. 31
Figure 5.8: The LA 48 Linear array profile of Leaf 10 (5 cm from the central axis)
to obtain the intraleaf leakage and perform the abuttal test procedure. A
xi
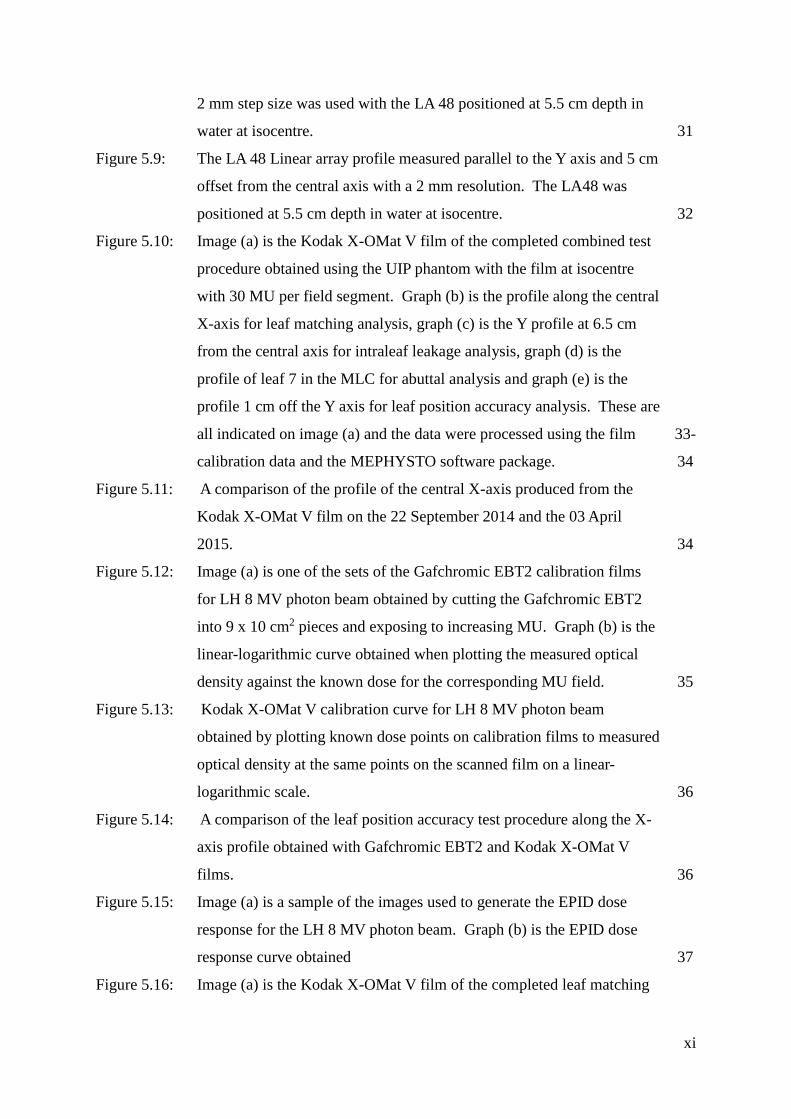
2 mm step size was used with the LA 48 positioned at 5.5 cm depth in
water at isocentre.
31
Figure 5.9: The LA 48 Linear array profile measured parallel to the Y axis and 5 cm
offset from the central axis with a 2 mm resolution. The LA48 was
positioned at 5.5 cm depth in water at isocentre. 32
Figure 5.10: Image (a) is the Kodak X-OMat V film of the completed combined test
procedure obtained using the UIP phantom with the film at isocentre
with 30 MU per field segment. Graph (b) is the profile along the central
X-axis for leaf matching analysis, graph (c) is the Y profile at 6.5 cm
from the central axis for intraleaf leakage analysis, graph (d) is the
profile of leaf 7 in the MLC for abuttal analysis and graph (e) is the
profile 1 cm off the Y axis for leaf position accuracy analysis. These are
all indicated on image (a) and the data were processed using the film
calibration data and the MEPHYSTO software package.
33-
34
Figure 5.11: A comparison of the profile of the central X-axis produced from the
Kodak X-OMat V film on the 22 September 2014 and the 03 April
2015. 34
Figure 5.12: Image (a) is one of the sets of the Gafchromic EBT2 calibration films
for LH 8 MV photon beam obtained by cutting the Gafchromic EBT2
into 9 x 10 cm2 pieces and exposing to increasing MU. Graph (b) is the
linear-logarithmic curve obtained when plotting the measured optical
density against the known dose for the corresponding MU field. 35
Figure 5.13: Kodak X-OMat V calibration curve for LH 8 MV photon beam
obtained by plotting known dose points on calibration films to measured
optical density at the same points on the scanned film on a linear-
logarithmic scale. 36
Figure 5.14: A comparison of the leaf position accuracy test procedure along the X-
axis profile obtained with Gafchromic EBT2 and Kodak X-OMat V
films. 36
Figure 5.15: Image (a) is a sample of the images used to generate the EPID dose
response for the LH 8 MV photon beam. Graph (b) is the EPID dose
response curve obtained 37
Figure 5.16: Image (a) is the Kodak X-OMat V film of the completed leaf matching

xii
test procedure (without back up jaws) in a field obtained using a
polystyrene phantom. The film was placed at 5 cm depth in the phantom
with an SSD of 63 cm and 30 MU per field segment was delivered.
Graph (b) is the profile of the central X-axis as indicated on image (a).
The data were obtained using the film calibration data, the MEPHYSTO
software and adjusted to the field dimensions at isocentre.
38
Figure 5.17: A comparison of the profile without the back-up jaw in the field along
the central X-axis produced from the Kodak X-OMat V film on the 16
November 2014 and the 13 March 2015. 38
Figure 5.18: A comparison of the profile with the back-up jaw in the field along the
central X-axis produced from the Kodak X-OMat V film on the 16
November 2014 and the 13 March 2015. 39
Figure 5.19: Image (a) is the Gafchromic EBT2 film of the completed leaf position
accuracy test procedure obtained using a depth of 5 cm in a 7 cm thick
polystyrene phantom with the film at isocentre using 80 MU per field
segment. Graph (b) is the profile of the edge of the field defined by the
MLC for the central field segment as indicated on image (a) obtained
using the calibration film data and the MEPHYSTO software. 40
Figure 5.20: A comparison of the profile 1 cm off the Y-axis produced from the
Gafchromic® EBT2 film on the 11 November 2014 and the 13 March
2015. 41
Figure 5.21: The three EPID images required to produce the intraleaf leakage test
procedure. 41
Figure 5.22: The EPID profile of 5 cm along Y-axis for the intraleaf leakage and
abuttal test procedure. The central peak is from leaf 20 being open
during the exposure. 42
Figure 5.23: Comparison of the intraleaf leakage profile for the EPID taken at two
different times 42
Figure 5.24: Image (a) is the Kodak X-OMat V film of the completed combined test
procedure obtained at 5 cm depth in a 7 cm thick polystyrene phantom
at isocentre with each segment delivering 30 MU. Graph (b) is the
profile of the central X-axis representing the leaf matching test
procedure. Graph (c) is the profile of 6.5 cm off the Y-axis representing

xiii
the intraleaf leakage test procedure and graph (d) is 1 cm off the Y-axis
for performing the leaf position accuracy test procedure. The profiles
are indicated in image (a) and the analysis was obtained using the film
calibration data and the MEPHYSTO software package.
43
Figure 5.25: A comparison of the profile of the central X-axis produced from the
Kodak X-OMat V film on the 16 November and the 18 March 2015
with 100% defined as maximum value for each profile. 44
Figure 5.26: The comparison of the leaf matching test procedure at CMJAH and LH
using Kodak X-OMat V film. 45
Figure 5.27: The comparison of the leaf position accuracy test procedure for CMJAH
and LH exposed on Gafchromic EBT2 film. 45
Figure 5.28: The comparison of the intraleaf leakage test procedure result from the
LA 48 linear array (in water) at CMJAH and the EPID at LH (in air). 46
Figure 5.29: The comparison of the combined test procedure for CMJAH and LH
exposed on Kodak X-OMat V film. 47
Figure 5.30: The comparison of the leaf matching test procedure for the portal
imaging devices (Kodak X-OMat V and Gafchromic EBT2 films) and
the LA48 linear array used at CMJAH. 47
Figure 5.31: The comparison of the combined test procedure X-axis profile for the
portal imaging devices (Kodak X-OMat V, Gafchromic EBT2 films and
EPID) used at LH. 48
Figure 6.1: An example of a leaf matching test procedure subfield with the position
of the backup jaw and MLC shown with respected to the irradiated field
size. 51
Figure 6.2: An example of the method used to determine the FWHM values for the
matching data results. The curve shown is for the LA 48 detector at
position 100 mm from CAX. 52
Figure 6.3: The leaf matching test procedure profiles for Kodak 2 and Gafchromic 2
showing the difference in the shape of the spikes at the matching
positions. 53
Figure 6.4: An example of the leaf position accuracy test procedure results for all
imaging devices at CMJAH taken in September 2014 normalised to leaf
21 with leaves below 100% being out of the field and leaves above

xiv
100% being in the field. 55
Figure 6.5: An example of the combined test procedure results for leaf position
accuracy for Kodak and Gafchromic film at LH taken in March 2015
normalised to leaf 20 with leaves below 100% being out of the field and
leaves above 100% being in the field.
55
xv
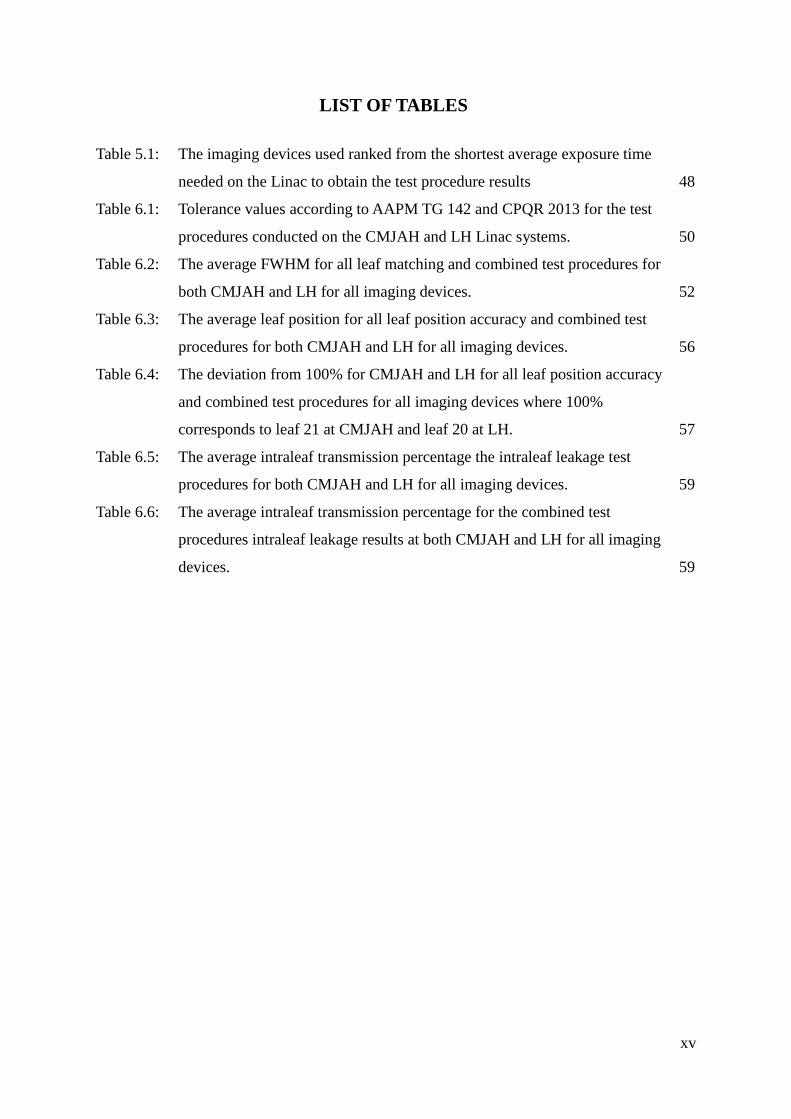
LIST OF TABLES
Table 5.1: The imaging devices used ranked from the shortest average exposure time
needed on the Linac to obtain the test procedure results 48
Table 6.1: Tolerance values according to AAPM TG 142 and CPQR 2013 for the test
procedures conducted on the CMJAH and LH Linac systems. 50
Table 6.2: The average FWHM for all leaf matching and combined test procedures for
both CMJAH and LH for all imaging devices. 52
Table 6.3: The average leaf position for all leaf position accuracy and combined test
procedures for both CMJAH and LH for all imaging devices. 56
Table 6.4: The deviation from 100% for CMJAH and LH for all leaf position accuracy
and combined test procedures for all imaging devices where 100%
corresponds to leaf 21 at CMJAH and leaf 20 at LH. 57
Table 6.5: The average intraleaf transmission percentage the intraleaf leakage test
procedures for both CMJAH and LH for all imaging devices. 59
Table 6.6: The average intraleaf transmission percentage for the combined test
procedures intraleaf leakage results at both CMJAH and LH for all imaging
devices. 59

xvi
ABBREVIATIONS
A
AAPM American Association of Physicists in Medicine
Am-Si Amorphous Silicon
C
cm centimetre
cGy centiGray
CAPCA Canadian Association of Provincial Cancer Agencies
CMJAH Charlotte Maxeke Johannesburg Academic Hospital
CPQR Canadian Partnership for Quality Radiotherapy
CT Computer Tomography
D
3-D CRT 3-Dimensional Conformal Radiation Therapy
E
EPID Electronic Portal Imaging Device

xvii
G
Gy Gray
I
IMRT Intensity Modulated Radiation Therapy
L
LANTIS Local Area Network Treatment Information SystemTM
LH Livingstone Hospital
Linac Linear Accelerator
M
MLC Multileaf Collimator
MU Monitor Units
MV Megavoltage
Q
QC Quality Control

xviii
QA Quality Assurance
S
SSD Source to Surface Distance
T
TG Task Group
TLD Thermo Luminescent Dosimeters
TV Target Volume
U
UIP Universal IMRT Phantom
V
VMAT Volumetric-Modulated Arc Therapy
1
1. INTRODUCTION AND AIMS:
Linear accelerators (Linacs) produce high energy photon and electron beams via the
acceleration of electrons by high-frequency electromagnetic waves within a waveguide
powered by a magnetron or klystron1. Conventional Linacs are fitted with two sets of solid
metal collimator jaws for secondary collimation in high energy photon radiotherapy. These
standard jaws are capable of producing divergent rectangular field shapes of up to a 40 cm by
40 cm defined at the treatment distance1. Most tissue within the rectangular field shape
produced by the collimator jaws will be treated including any radiation sensitive normal
tissues in the field. To spare normal tissues during a radiation therapy treatment on a
conventional Linac, lead or lead alloy shielding blocks are used. Lead-alloy facilitates
patient-specific fabrication of these blocks. Limitations of blocks are their time-consuming
production, toxic fume emission during the melting and moulding process, and the fact that
they can be cumbersome2.
Multileaf collimator (MLC) systems were introduced into Linacs in the 1980’s3. Currently
most manufacturers of teletherapy machines offer the MLC as an option on their units. The
main reasons for the introduction of the MLC system were to facilitate computer-control and
verification of complex treatment field shapes and to obtain an increase in the speed of both
set up and treatment of patients1, 2. With MLCs in place, beam-shaping blocks for the most
part are no longer needed. There are several MLC collimator jaw configurations available but
in general MLC systems consist of 20 – 80 pairs of movable leaves which project a width of 1
cm or less at the treatment beam isocentre2. MLC leaf position and speed must be
automatically uploaded, verified and controlled by a computer system1.
MLCs and shielding blocks are used both for shielding sensitive organs in treatment fields
and for conforming fields to a target volume. 3-Dimensional Conformal Radiation Therapy
(3-D CRT) is a treatment technique in which 3-D anatomical information from a Computed
Tomography (CT) scanner is used to produce a highly conformal dose distribution to the
target volume (TV). The high conformity of the dose distribution to the target volume must
fulfil the dual requirement of sufficient dose to the tumour and achieve as low as possible
dose to any normal or radiation sensitive tissue1.

2
When using a MLC system, there are inherent challenges:
1. The MLC leaves have a finite width at isocentre. Therefore, when conforming to an
irregular shape, there is a limited radius of curvature which is not a concern with
cerrobend blocks.
2. Owing to their finite width, the MLC leaves can only be positioned around a non-
rectangular tumour with each leaf aligned at its midpoint to the target edge,
completely within the target or completely withdrawn from the target.
3. The MLC leaves cannot extend into the target area, thus the MLC are unable to easily
replicate an island block1. The only way to replicate island blocks is to produce
multiple matched fields with the leaves from alternating leaf banks closing the field
up to and including the island block area during each sub-treatment of the field.
Matching across target volumes is usually avoided so treatment with an MLC is a sub-
optimal approach in this instance.
4. As the MLC adds or replaces a jaw, all collimator mounted beam-modifying devices
(e.g. wedge, tissue compensators, etc.) are fixed in their orientation relative to the
MLC.
5. Cerrobend blocks are cut and moulded to be continuous with the Linac beam
divergence. Thus, they diverge correctly with the light and radiation fields of the
Linac. This is known as dual-focus however most MLC systems are not designed
with dual-focus ability.
6. There may be a loss of penumbra from the decreased source-collimator distance when
a MLC is added.
7. Additional Quality Control (QC) for the Linac and Quality Assurance (QA) of the
MLC itself are required, due to the difference in complexity compared to standard
jaws.

3
Even with these limitations the MLC leaves have an additional ability to be moved to
different orientations while the Linac unit is irradiating and/or moving and this leads to an
extension of 3-D CRT. This extended use of the MLC capacity allows the delivery of
Intensity Modulated Radiation Therapy (IMRT) and a further extension of the IMRT
technique such as Volumetric Modulated Arc Therapy (VMAT). IMRT is a treatment
technique in which non-uniform radiation beam intensities are delivered from multiple
treatment beam positions4. Whereas, VMAT is a treatment technique in which the IMRT
technique is delivered with the radiation beam continuously on and the Linac gantry rotating
for one or more complete arcs5.
The implementation of these new techniques with an MLC system and the differences
encountered between the solid metal collimator jaw pairs and an MLC system therefore
require a re-evaluation of the QA requirements for beam collimation and treatment
techniques. An analysis of relevant and recommended QA programs is necessary to
determine the optimum requirements and procedures.
The aim of this study is therefore to perform, compare, quantify and evaluate the accuracy of
QA efforts for conventional Multileaf Collimators (MLC) installed on medical Linacs.
4
2. LITERATURE REVIEW
The 2001 American Association of Physicists in Medicine (AAPM) ‘Report no. 72: Basic
Application of Multileaf Collimators’2, discussed the different MLC configurations available
and suggested a preliminary QA program. The 2005 Canadian Association of Provincial
Cancer Agencies (CAPCA) ‘Medical Linear Accelerator’6 and the 1994 AAPM
‘Comprehensive QA for radiation oncology: Report of the AAPM Radiation Therapy
Committee Task Group 40’7, both include QA documentation for a Linac. Neither of these
documents covered the QA requirements of MLC-equipped Linacs despite widespread use by
2005.
Both associations subsequently released QA documentation to specifically focus on the issue
of QA for the MLC. The 2006 CAPCA document ‘Multileaf Collimators’8 presents QA for
the MLC but does not deal with QA requirements for MLC systems utilized for the treatment
of IMRT. In 2009, the AAPM released the ‘Task Group 142 Report: QA of medical
accelerators’9 document (TG142), which updated the section in the Task Group 40 report7 on
Linacs, including new technologies such as MLC, asymmetric jaws, dynamic wedge, virtual
wedge and electronic portal imaging devices (EPID).
TG142 divides MLC-equipped Linacs into three types; these are non-IMRT, IMRT and those
capable of MLC or micro MLC-based Stereotactic radiosurgery/Stereotactic body radiation
therapy, with each type requiring different procedures and tolerances on these procedures9.
The Canadian Partnership for Quality Radiotherapy (CPQR) replaced CAPCA to generate,
maintain and inform the QC and QA systems. In 2013, CPQR released ‘Technical Quality
Control Guidelines for Canadian Radiation Treatment Centres: Medical Linear Accelerators
and Multileaf Collimators’10 which summarised and combined the 2005 and 2006 CAPCA
documents6, 8. The TG142 and CPQR documents includes Linac and MLC QC and specifies
that it is for non-patient specific IMRT QA.
In 2003, the AAPM released ‘Guidance Document on Delivery, Treatment Planning, and
Clinical Implementation of IMRT: Report of the IMRT subcommittee of the AAPM radiation
therapy committee’4, which was intended to cover the complete process for IMRT from the
commissioning of the systems required through to the treatment of patients. This document

5
suggests QC procedures for MLCs and was used by Charlotte Maxeke Johannesburg
Academic Hospital (CMJAH) in the commissioning and implementation of IMRT on their
MLC equipped Linac in the Radiation Oncology department. The MLC equipped Linac in
the Radiation Oncology department at Livingstone Hospital (LH) does not have IMRT
capabilities thus this document was not used in the commissioning of the unit.
The starting point for the methodology and the origin of the test procedures required to
produce a comprehensive QA for the MLCs in this study was obtained from this document.
The initial procedures for leaf matching, leaf position accuracy and leaf abuttal were
developed from this document. The document, however, fails to address all the test
procedures required for the program to be comprehensive, e.g. intraleaf leakage.
Other investigators developed their own methodologies and test procedures to evaluate the
requirements set out by the AAPM and CAPCA3, 11-27. These were based on the type of MLC
the authors had at their institutions with only LaSosso11 and Huq, et al.24 generalizing with
respect to MLC type. Some of these were published prior to the release of the latest AAPM
and CAPCA documentation as the awareness for a change in QC procedures grew.
Publications list leaf position accuracy as the major quality assurance aspect of a MLC.
Intraleaf transmission is also covered by most authors however; others focused their work
only on leaf position accuracy13, 17, 19, 20, 27. Transmission through abutting leaves was only
examined by Bayouth15 and Low, et al.25, as these were the only authors using systems with
abutting leaves. Only Bayouth15 examined a Siemens Linac however, the author only
discusses leaf abuttal but does not suggest how to determine or measure it.
LoSasso11 suggested a QA program for IMRT and presented a thorough examination of the
topic. The author suggested how procedures can be executed but did not specify detail. The
author defines leaf matching as leaf alignment and suggests that the leaf position accuracy be
evaluated separately from leaf alignment.
Half of the publications discussed above as well as the 2003 AAPM4 report cover two aspects
of the MLC leaf system under the title of leaf position accuracy3, 12-14, 17, 18, 20, 23. These two
aspects are the MLC leaf matching and the individual leaf position accuracy. The MLC leaf
matching affects the deviation of the distance between the edge of the radiation field defined

6
by each leaf and the desired field size11. On the other hand, the leaf position accuracy is the
accuracy of the individual leaf positions with respect to a reference leaf. The reference leaf is
the leaf which is on the isocentric central axis of the collimator system. Some the authors15, 19,
22, 25 - 27 only focus on the individual leaf position accuracy of their MLC systems whereas
others16, 21, 24 only focus on the leaf matching.
The authors use various procedures for the determination of the leaf position accuracy. Lui3
and Baker17 used a manufacturer-developed system (Elekta) for evaluation of leaf matching
and leaf position accuracy called major and minor off-set tests. A strip test technique where
the strip test consist of either 2 cm wide fields with 1 mm gap was used by some12, 13, 20, 26
whereas 1 cm wide fields with a 1 cm gap was used by others15, 19. Jordan et al.16 and
Hounsell et al.23 used fields where alternative methods of producing field sizes of 4 cm x 30
cm are compared. Graves22 used a reference jaw set at 19 cm from the central axis and
moved the opposite leaves to different positions with respect to the fixed position jaw. Galvin
et al.21 and Huq et al.24 used a 10 cm x 10 cm field size off set in 5 cm steps from the central
axis. Parent27 used the same technique but restricted the field size to that of the EPID.
Pasquino et al.18 and Low et al.25 used six 5 cm x 40 cm abutted fields.
Intraleaf leakage which is also known as the tongue and groove effect is often not discussed at
all16, 17, 19, 20, 22, 25, 27. Others3, 12, 14, 15 discuss intraleaf leakage but neither gives results nor
suggests how to measure it. Jordan et al.16 and Hounsell et al.23 measured intraleaf leakage
by completely closing each leaf bank separately in turn. Pasquino et al.18 measured intraleaf
leakage by extending alternative adjacent pairs of leaves from each leaf bank and then
repeating the pattern for the leaves not extended originally. Others21, 24, 26 measured intraleaf
leakage by exposing a 10 cm x 10 cm field completely closed by the MLC only and then
comparing with an open field. LoSasso et al.26 also used an ionization chamber at central
axis and in an offset position with open and closed 10 cm x 10 cm fields. Various other field
sizes were also investigated. As seen with leaf position accuracy there is no common
procedure used for intraleaf leakage.
Most authors used planar imaging for data capture and analysis. There is therefore a need to
produce effective, explicit and versatile procedures executable on all MLC types as well as
detail the design, methodology and execution of the test procedures. This is pressurized by
the continual emergence of new techniques incorporating increasingly complex MLCs that

7
assumes consistent performance.
QC procedures require not only that the MLC system be evaluated but that data captured and
the analysis and archive tools are consistent, reproducible and reliable for maintaining
records. Several different detector systems have also been developed for performing QC
procedures on MLCs for IMRT delivery. These can be divided into point dose or 1-D, 2-D
and 3-D systems with each having inherent advantages and disadvantages.
Point dosimeters are ionization chambers and solid state detectors. Ionization chambers are
regularly used for absolute and relative dose measurements in radiotherapy. Solid state
detectors are either diodes or thermo luminescent dosimeters (TLDs). The disadvantage of
common ionization chambers is the size of the sensitive measurement volume of the
ionization chamber relative to the small size of the treatment fields, especially in IMRT and
stereotactic work28, 29. This issue is also prevalent in the measurement of steep dose gradients
and dose profiles of small fields (IMRT) as discussed by Bouchard et al.30, 31. Diodes are
used for relative dose measurements for IMRT and produce immediate measurement results.
The disadvantages of diodes are directional and dose rate dependence as well as long term
radiation damage requiring recalibration and eventual replacement28, 29. TLDs are used for
relative dose measurements and demonstrate a high sensitivity within a small volume28, 29.
The disadvantages of TLDs are the need for careful calibration, detector specific sensitivity
coefficients, a decrease in response over time and a delay in obtaining dose results28, 29. Point
dosimeters can only be used to verify local absolute dose delivered within the area of the
procedure.
2-D dosimetry systems include radiographic film (wet film), radiochromic film, electronic
portal imaging devices (EPIDs), diode arrays and ionization chamber arrays. The
radiographic film, radiochromic and EPIDs are all used for relative dose distribution
measurements. The advantages of radiographic film are high spatial resolution, accurate and
reproducible response, long term data storage and traceability. The disadvantage of
radiographic film is that it requires a stable wet chemical processor to develop the film and
not all departments have access to these units. The advantages of radiochromic film are as for
radiographic film however, radiochromic film does not require chemical processing. The
disadvantage of radiochromic film is the low sensitivity with the current Gafchromic EBT
series having sensitivity similar to the Kodak EDR-2 radiographic film as discussed in Low

8
etal28 and Marinello29. The advantages of the EPID are time saving compared to film and a
better spatial resolution than array detectors. The disadvantages of the EPID are limitations
in the field size, the need for multiple signal corrections to obtain dose results in the detector
and the requirement for commercial software packages for automated result analysis28. Diode
and ion chamber arrays can be used for routine QC of the MLC. The advantages of the arrays
are the number of dose measurement points achievable from a single exposure and the
immediate availability of the results. The disadvantages of the arrays are a low spatial
resolution, uniformity and the need for regular calibration (monthly for some devices) 28, 29.
3-D systems are polymer, Fricke and radiographic gels and plastics as well as a combination
of detectors in anthropomorphic phantoms. The advantages of all the 3-D systems are the
production of a 3-D dose distribution, correct anatomical shaping for IMRT plan QA and high
spatial resolution. The disadvantages of the gel and plastics systems are the high cost,
complexity and time duration required to obtain results28, 29. The disadvantages of the
anthropomorphic phantoms used in conjunction with detectors are the requirement for
appropriate analysis software, registration of the measured and calculated dose distributions
and correct alignment within the software to maintain correct anatomical dosimetric
information28, 29.
In summary, there is a need not only for a comprehensive QA program for the MLC system
but also for an accurate, efficient and effective method of data capture and an independent
analysis methodology that best fits the resources available. Due to the complexity and
advanced functionality of the MLC over conventional collimation systems, the QA
requirement for MLC-based Linacs needs to be expanded accordingly.

9
3. MATERIALS
The procedures, methodology and dosimetry systems relevant to an informative QA program
for an MLC on a medical Linac were selected based on the resources available at each site.
3.1 Multileaf Collimators
Two MLC collimator configurations were examined and studied in this work.
In the first configuration the conventional upper solid secondary collimator jaws are replaced
with two opposing banks of 40 leaves per bank and a set of solid back-up jaws (diaphragms)
positioned immediately below the leaves. Each back-up jaw automatically positions at the
outer most leaf position. This configuration is currently used by Elekta (Pty) Ltd for their
Linac units and is available at Livingstone Hospital (LH) in Port Elizabeth. Each MLC leaf
can travel beyond the central axis by 12.5 cm and therefore each leaf can move through a total
distance of 32.5 cm to produce a maximum open field size of 40 cm x 40 cm at the isocentric
plane. The single-focussed MLC leaf pairs have a minimum separation of 5 mm and are
unable to abut owing to their rounded leaf edges2. The opposing leaf pairs project a width of
1 cm each at isocentre and IEC 61217 naming convention is applied.
Figure 3.1: Diagram of Elekta Linac jaw and leaf orientation in the Linac collimator head as
used at LH. (Image found in Jordan et al.16)

10
In the second configuration, the MLC replaces the conventional lower solid secondary
collimator jaws with two opposing banks of 41 leaves each. This configuration is currently
used by Siemens (Pty) Ltd for their Linac units and is available at CMJAH. Each MLC leaf
can travel beyond the central axis by 10 cm and therefore each MLC leaf can move a total
distance of 30 cm to produce a maximum open field size of 40 cm x 40 cm at the isocentric
plane. The leaves in this configuration have leaf ends and sides which are continuous with
the divergence of the radiation beam. This design configuration is known as double focused.
The double focused leaf edges are straight and the leaves can thus abut. The leaves could also
be independently and manually controlled via the hand controller of Linac control system2.
The opposing leaf pairs project a width of 1 cm each at isocentre and the IEC 61217 naming
convention is applied.
Figure 3.2: Diagram of Siemens Linac jaw and leaf orientation in the Linac collimator head
as used at CMJAH.
These configuration aspects affected the design and implementation of the leaf position
accuracy and abuttal test procedures as they were required to be carried out on both platforms
for direct comparison.
3.2 Megavoltage 2 Dimensional Detectors
Three imaging devices were used:
The first of these was wet film or radiographic film, which required chemical developing in a
wet processor. Two batches of the Kodak X-Omat VTM series of film of size 25.4 x 30.5 cm2
Upper Y Jaw
Lower
MLC Jaw

11
were used. A Konica Minolta SRX-101A wet processor was used at CMJAH and a KODAK
Medical X-ray Processor 102 at LH.
The second was radiochromic film; this means that the film colours directly when exposed to
radiation and does not require chemical development. Two sizes and batches of Gafchromic
EBT2 series of films were used: 35.6 x 43.2 cm2 and 20.3 x 25.4 cm2.
The third was the Electronic Portal Imaging Device (EPID), which is a Linac gantry mounted
real time imaging device. The EPID in LH is constructed from amorphous silicon (aSI) flat-
panel detectors and had a fixed SID of 160 cm. The EPID array size was 41 x 41 cm2 and
therefore could image a maximum field size of 26 x 26 cm2 at isocentre17.
3.3 Ionization Chambers
The ionization chambers which were used in CMJAH were a PTW LA48 linear array system
and calibrated cylindrical ionization chambers of different volumes (PTW 31010 0.125 cm3
Semiflex chamber and a PTW 30010 0.6 cm3 Farmer chamber). All were calibrated in terms
of IEC 60731. The linear array had an active measuring length of 37 cm and consisted of 47
fluid filled 8 mm3 ionization chambers. These ionization chambers were each 4 mm x 4 mm
x 0.5 mm spaced 8 mm apart on the central plane of the array. The linear array was used with
the PTW MP-3 water tank system and the MEPHYSTO mc2 acquisition software. The array
was moveable laterally such that a 1 – 8 mm measurement resolution could be achieved.
The detectors used in LH were a PTW 31010 0.125 cm3 Semiflex chamber and a PTW 30013
0.6 cm3 Farmer chamber. Both were calibrated in terms of IEC 60731. The cylindrical
ionization chambers were used to obtain the absolute dose values required for the calibration
of the films.
3.4 Phantoms
The acrylic PTW Universal IMRT phantom (UIP) (Figure 3.3) was used for the film
measurements at CMJAH. The phantom consists of 2 interlocking sections, the top section
was a 30 x 30 x 5 cm3 plate scribed with centre marking to aid setup and 5 film prickers for
localization and orientation. The second section has a 30 x 30 x 2 cm3 plate which was

12
scribed with centre marking and 5 holes with plugs at 1 cm depth. The holes are designed to
accommodate a 0.125 cm3 cylindrical chamber. The film was placed between the 2 acrylic
plates.
Figure 3.3: Universal IMRT phantom structure indicating the film prickers, the chamber slots
and the two sections of the phantom.
At LH a 30 x 30 x 7 cm3 phantom consisting of 1 cm thick pieces of polystyrene was used for
the film set. The same materials for both phantoms were not available at CMJAH (UIP
acrylic) and LH (polystyrene sheets). The films were thus placed at 5 cm depth at LH to
reproduce as closely as possible the position used at CMJAH in the UIP. A separate 30 x 30 x
1 cm3 plate with a hole for a 0.125 cm3 cylindrical chamber was used in the phantom when
point dose measurements were required.
No phantom was used for the images obtained with the EPID systems.
3.5 Film Scanners and Dosimetric Software
An Epson 10000 film scanner was used to capture the dosimetric information from the wet
radiographic and radiochromic films into a digital format in CMJAH and a Microtek
Scanmaker 9800XL film scanner was used in LH. The acquisition settings of the Epson
scanner for the wet film were 16-bit grey scale and 400 dpi, and for the radiochromic films
Film
Prickers
Top
5 cm
Section
Bottom
2 cm
Section
Chamber
slots

13
the settings were 48-bit colour and 400 dpi. All colour corrections were switched off. The
same settings were used on the Microtek scanner.
The Film analysis software PTW VerisoftTM was used for analysis and comparison of the
dosimetric information obtained from the wet film, radiochromic film, EPID and the
ionization chambers.

14
4. METHODOLOGY
4.1 Experimental Test Procedures Introduction
AAPM TG142 lists recommended QC test procedures which need to be carried out for an
MLC used in both IMRT or non-IMRT modes9. The 2013 CPQR ‘Medical Linear
Accelerators and Multileaf Collimators’ lists all the test procedures required for a Linac with
an MLC10. As discussed in chapter 2 the major annual QC test procedures are leaf position
accuracy, intraleaf leakage and transmission through abutting leaves. For this thesis leaf
position accuracy was separated into leaf matching and leaf position accuracy. These 4 test
procedures were therefore conducted in this work. In addition, a leaf sequence that combines
and examines all the test procedures was also designed and investigated.
4.2 Quality Control Test Procedures Design
All test procedures were produced, set up and executed from a record and verify data
management intranet system at both CMJAH (using the LANTISTM system) and LH (using
the MOSAIQTM system) to maintain reproducibility, increase procedure speed and provide a
record of the test procedure. All the test procedures at CMJAH were conducted using the 6
MV photon energy beam and all the test procedures at LH were conducted using the 8 MV
photon energy beam. These energies were selected since they are the most commonly used at
each site.
4.2.1 Leaf matching test procedure
Leaf matching affects the deviation of the distance between the edge of the radiation field
defined by each leaf and the desired field size12 as discussed in chapter 2. Inaccurate leaf
matching alters the dose homogeneity between adjacent fields. The examination of this effect
was tested by setting up a sequence consisting of six 5 cm x 40 cm field strips each irradiated
with the same MU setting shown in figure 4.1. Both MLC designs were capable of delivering
this test procedure and in LH the test procedure was conducted with the back-up jaw in the
field and the back-up jaw out the field. The MLC leaves would define the field edge when
the back-up jaws are out of the field. Thus demonstrating the effect of the back-up jaw on the

15
test procedure. Perfect MLC performance should result in a uniform field of 30 x 40 cm2 at
isocentre. The recommended tolerance is 1 mm and action level is 2 mm10.
Figure 4.1: Diagram of leaf matching test procedure.
4.2.2 Leaf position accuracy test procedure
The edge of each MLC leaf may have to move to multiple positions during a treatment and
the accuracy of this movement to the set position will define the accuracy with which a
specified field shape can be reproduced. The positional accuracy of each leaf should be
maintained over the full travel of the leaf as well as from both a positive and negative
directional approach.
The leaf position accuracy test procedure at CMJAH consists of fields of 2 mm x 40 cm strips
at 2 cm intervals across the MLC travel, which produces a composite field of 20.2 x 40 cm2.
The leaf position accuracy test procedure at LH consists of 5 mm x 40 cm thick strips at 2 cm
intervals across the maximum MLC over travel, which produces a composite field of 24 x 40
cm2. The 5 mm strip width used at LH arose from the Elekta MLC system having round
ended leaves preventing abuttal and thus the smallest separation between opposed leaves
5 cm Y-axis
X-axis
30 cm
40 cm

16
allowed is 5 mm.
Since these two test procedures could not be compared directly, the leaf position accuracy
test procedure for this study was re-configured to consist of 7 field strips of 2 cm x 40 cm
thick. The field segments were spaced at 2 cm intervals for the outer two sets of strips and
reduced to 1 cm on either side of the central axis strip as shown in figure 4.2
Figure 4.2: Diagram of leaf position accuracy test procedure predicted result for the
comparison between CMJAH and LH in this study.
4.2.3 Intraleaf leakage and abuttal test procedures
An MLC that can abut completely should permit the same level of transmission as a closed
solid jaw system. The abuttal leakage is of greater importance for IMRT treatment than 3-D
CRT as the outputs used are higher. Abuttal leakage of the leaves may also be called interleaf
leakage as it is the leakage between corresponding leaves on opposing leaf banks.
MLC leaves are also required to move parallel to each other and a transmission of < 5%
through shielded areas is recommended as per solid collimator jaws1 and the recommended
2 cm Y-axis
X-axis
24 cm
40 cm
2 cm

17
tolerance is that they should vary only ± 0.5% from baseline9. To minimize intraleaf leakage
(between leaves in the same bank) the MLC leaves are designed to overlap and this is
commonly known as the “tongue and groove” configuration. This is schematically shown in
figure 4.3. Transmission increases with higher energies, and is more significant in IMRT
when higher outputs are used and a measurable dose is delivered to the shielded parts of each
field segment.
Figure 4.3: Diagram of the Elekta and Siemens MLC systems indicating the tongue and
groove leaf configuration (Image found in Huq et. al24).
The sequence used to test abuttal and intraleaf leakage consisted of three field segments. In
the first segment the leaf banks were closed together at a position of -10 cm from central axis,
in the second the leaf banks were closed on the central axis and in the final segment the leaf
banks were closed at +10 cm from the central axis. The central leaf (leaf 21 on Siemens at
CMJAH and 20 on Elekta at LH) was left open for all segments to deliver a dose to which the
intraleaf leakage could be compared. A schematic of the CMJAH procedure is shown in
figure 4.4 and LH is shown in figure 4.5. The LH test procedure was different as the system
was unable to abut the leaves and a 5 mm gap was necessarily present between opposing
leaves. The sequence was however still valid for testing the intraleaf leakage.

18
Figure 4.4: Diagram of intraleaf leakage and abuttal test procedures for CMJAH. The thicker
grey horizontal area indicates open leaves.
Figure 4.5: Diagram of the intraleaf leakage test procedure for LH. The thicker grey horizon-
tal area indicates open leaves.
Y-axis
X-axis
20 cm
40 cm
Y-axis
X-axis
20 cm
40 cm
0.5 cm
Jaw abuttal
positions

19
4.2.4 Combined test procedure
A single pattern was designed to combine all the test procedures and establish if it is possible
to obtain equivalent results. The combined test procedure as shown in figure 4.6 consisted of
7 field segments which included the four individual test procedures. The test produces a
composite field size of 25 x 40 cm2. The leaf matching capabilities of the MLC was exam-
ined by producing four 2.5 cm x 20 cm fields with each field off set from the central axis by
either 11.25 cm or 8.85 cm in both the negative and positive travel directions. The leaf posi-
tion accuracy capabilities of the MLC were examined from three 2 cm x 40 cm fields, at the
central axis and 1 cm apart on either side. The intraleaf and abuttal capabilities were exam-
ined using the non-irradiated portion of the composite field between the leaf matching and
leaf position accuracy segments.
Figure 4.6: Diagram of the combined test procedure consisting of segments for leaf matching,
leaf position accuracy, intraleaf leakage and abuttal test procedures.
4.3 Megavoltage 2 Dimensional Detectors and Linear Array Setup and Calibration
The physical differences between the planar detectors and the linear array required different
methods related to the physical dimensions of the devices, the dose range and response.
2.5 cm
Y-axis
X-axis
25 cm
40 cm
2 cm
20 cm
1 cm

20
4.3.1 Radiographic film
The maximum field size that needed to be examined was 30 x 40 cm2 when conducting the
leaf matching test procedure but the Kodak X-Omat VTM that was available had dimensions
of 25.4 x 20 cm2 thus a single film could not be exposed at isocentre (100 cm from the
source). The Universal IMRT (PTW) phantom in CMJAH was therefore setup with the film
at isocentre as shown in Figure 4.7 and then the table of the Linac was raised through 32 cm
so that the film to source distance was 68 cm as shown in figure 4.8. These set up conditions
were used as the field light of the 30 x 40 cm2 field size covered the films radiation sensitive
area and was as close to the accessory tray of the Linac to still allow for films to be changed
without the need to move the complete set up. All test procedure films except the leaf match-
ing test procedure were conducted at isocentre as their field sizes were less than or equal to 25
cm. A similar setup was used at LH. Figure 4.9 and figure 4.10 show the isocentric and the
Source to Surface Distance (SSD) of 63 cm set ups at LH respectively. The SSD 63 cm set up
maintains the film to source distance of 68 cm as used at CMJAH.
Figure 4.7: The positioning of the UIP for the exposure of films at the isocentre of the
CMJAH Linac.

21
Figure 4.8: The positioning of the UIP for the exposure of films at the SSD 63 cm setup for
the CMJAH Linac.
Figure 4.9: The positioning of the Polystyrene phantom for exposure of films at the isocentre
of the LH Linac

22
Figure 4.10: The positioning of the Polystyrene phantom for the exposure of the films at the
SSD 63 cm setup for LH Linac.
The dose range, methods of calibration, general recommended handling and processing of the
radiographic film used in this study was based on the 2007 American Association of Physi-
cists in Medicine (AAPM) ‘Task Group 69 Radiographic film for megavoltage beam dosime-
try’32. The Kodak X-Omat VTM film has a dose response range of 5-100 cGy and a saturation
of 200 cGy. Both the Linacs used were calibrated to deliver a dose of 1 cGy per Monitor
Units (MU), at isocentre in a 10 x 10 cm2 field at the depth of maximum dose. Each irradiat-
ed segment of each test procedure was delivered with 30 MU so that the most sensitive dose
region of the film was used and the saturation point of the film was not exceeded.
The calibration of the radiographic film was performed at CMJAH using a soft wedge and
varying the central axis dose. The resultant dose range used covered the response range of
the film. Four films were exposed with a 20 x 20 cm2 field size at isocentre at 5 cm depth in
the UIP phantom with 10, 20, 50, and 100 MU (total MU delivered to central axis) respective-
ly and a wedge angle of 600. The central axis dose was measured at the same time using the
0.125 cm3 Semiflex cylindrical chamber corrected for temperature and pressure. The com-
bined known central dose and the wedge profile obtained with the LA48 linear array for the
same fields were used to determine the dose to various points on the films. This was done

23
every 1 cm along the central axis in the wedge direction.
The LH Linac has a motorized physical wedge system consisting of a physical wedge of 600
angle mounted in the Linac collimator head. The wedge angle is varied by controlling the
amount of MU when the wedge is in the field for a completed treatment. Due to the beam
hardening effect where lower energy photons are attenuated out of the beam by the wedge1,
the LH films were calibrated using a different method. This method did not use any beam
modifying devices such as wedges. Four films were exposed with four open fields each of 7
x 7 cm2 field size. The fields were off set to the corners of the film and the rest of the film
was shielded. The film was placed at the isocentre at 5 cm depth in a 30 x 30 x 7 cm3 poly-
styrene phantom and exposed to 0, 1, 2, 5, 10, 15, 20, 30, 50, 70, 100, 150 and 200 MU re-
spectively. The central axis dose was confirmed using the PTW 0.6 cm3 Farmer cylindrical
chamber for each exposure.
4.3.2 Radiochromic film
The radiochromic film used was of two different sizes and batches but direct comparison with
the radiographic film required that the same setup for exposing both type of films was used.
The Gafchromic EBT2 film has a dose response range of 1 - 4000 cGy. Accordingly, each
irradiated segment of each test procedure was delivered with 80 MU so that the exposures
were within the most sensitive dose region of the film.
The dose range, methods of calibration, general recommended handling and processing of the
radiochromic film was based on the 1998 American Association of Physicists in Medicine
(AAPM) ‘Report 63: Radiochromic film dosimetry’33. The calibration of the radiochromic
film was carried out using exactly the same setup, positioning and phantoms as used for the
radiographic film. The only difference arose in the dose range used as the radiochromic film
has a high dose response range. For this study the lower end of the film dose range was used.
Thus at CMJAH the films were exposed to 20, 50 and 100 MU with a 600 virtual wedge and
at LH the films were cut into 10 x 9 cm2 pieces and each piece was exposed to 0, 1, 2, 5, 10,
15, 20, 30, 50, 70, 100, 150, 200, 300, 500 and 700 MU respectively.

24
4.3.3 Electronic Portal Imaging Device (EPID)
The EPID did not require calibration but dose response measurements were conducted to
confirm that the dose accuracy and sensitivity of the EPID. The dose response of the EPID
was carried out differently from the film dosimetry as the doses used were much lower and no
phantom was used for the EPID images. Seven 10 x 10 cm2 fields were used for various MU
values (1, 2, 4, 8, 10, 15, 20, 50 and 100)17.
No phantom was used for the EPID data. It was recommended by the manufacturer of the
Linac system that single dose exposures for the EPID are less than 4 MU hence all exposures
using the EPID were 2 MU per field segment.
Figure 4.11: The position of the EPID for the exposure of EPID images for the LH Linac.
4.3.4 Linear array
The linear array was set up in the PTW MP-3 water tank system at isocentre at a depth of 5.5
cm in water shown in figure 4.12 - 13. This was done to maintain an equivalent depth to the
films in phantom. The calibration of the linear array was done with a 20 x 20 cm2 600 virtual

25
wedge field over 50 MU. The leaf positioning accuracy and leaf matching test procedures
were also conducted with the array aligned along the central axis of the MLC leaves, parallel
to the direction of travel as well as a 1 cm off set from central axis for the position accuracy.
The intraleaf leakage and abuttal test procedures were conducted with the linear array
positioned along the Y jaw axis, offset 5 cm from central axis and along leaves 21, 30 and 10.
The combined test procedure was carried out and measurements were taken along leaf 21 and
32 as well in the Y direction at an offset of 6.5 cm. All segments of the combined test
procedure were exposed for 30 MU and the maximum spatial resolution used for the test
procedures was 2 mm.
Figure 4.12: The PTW MP3 water tank, support table and reservoir tank used with the LA 48
at CMJAH.
Figure 4.13: The LA 48 set up in PTW MP-3 water tank for the CMJAH Linac.

26
5. RESULTS
The test procedures were conducted at least twice for each planar detector type at each
institution with a minimum time separation of 4 months. The difference in time was to
determine if the test procedures could detect changes to the MLC systems over time. It was
possible to obtain data over a longer period of time at LH including during an annual major
service during which the MLC system was recalibrated.
5.1 Results of the MLC Performance at CMJAH
All results below were obtained at CMJAH on the Siemens Linac using the 6 MV photon
beam and the methodology laid out in the previous chapter.
5.1.1 Calibration curves
The radiographic and radiochromic films required that the relationship of dose to optical
density ratio be established; this was obtained by the development of a calibration curve. The
calibration curves were specific for each detector type, machine and energy used32, 33. Figure
5.1 shows an example of one of the Kodak X-Omat VTM films obtained for the calibration
curve. Figure 5.2 shows the calibration curve obtained for the Gafchromic EBT2 film
obtained with the methodology discussed previously.

27
(a) (b)
Figure 5.1: Image (a) illustrates the Kodak X-Omat VTM film exposed at CMJAH to a 20 x 20
cm2 field size at isocentre in the UIP phantom with 20 MU and a virtual wedge angle of 600
for the purpose of calibration of the the Kodak X-Omat VTM film. Graph (b) is the linear-
logarithmic curve obtained when plotting the measured optical density against the known
dose for the corresponding MU field.
Figure 5.2: The Gafchromic EBT2 calibration curve for CMJAH 6 MV photon beam.
0
10000
20000
30000
40000
50000
60000
70000
0.1 1 10 100 1000
Me
asu
red
Op
tica
l De
nsi
tyMeasured Dose (cGY) Log Scale
CMJAH Kodak X-Omat VTM
Film Calibration Curve
0
5000
10000
15000
20000
25000
30000
35000
1 10 100 1000
Me
asu
red
Op
tica
l De
nsi
ty
Measured Dose (cGY) Log Scale
CMJAH Gafchromic EBT2 Film Calibration
Curve

28
The PTW LA48 linear array was calibrated by the manufacturer. A 600 wedge profile was
measured to produce the calibration values for the film and is shown below in figure 5.3.
Figure 5.3: The calibration curve from the PTW LA48 Linear array obtained from a 20 x 20
cm2 600 virtual wedge field delivered over 50 MU to the central axis. The curve was
measured at a depth of 5.5 cm in water at isocentre.
5.1.2 Quality Assurance test procedure results
An example of the output obtained for each test procedure and the corresponding relevant
profile from one of the planar detectors or the linear array are displayed in figures 5.4 – 5.11.
0%
50%
100%
150%
-200 -100 0 100 200
pe
rce
nta
ge (
%)
Inplane distance (mm)
PTW LA48 linear array calibration curve 600
virtual wedge

29
Leaf matching test procedure
(a) (b)
Figure 5.4: Image (a) is the Kodak X-OMat V film of the completed leaf matching test
procedure obtained using the UIP phantom at 5cm depth in phantom with the film set up with
a SSD of 63 cm for a 6 MV photon beam and 30 MU delivered per field segment. Graph (b)
is the profile of the central X-axis as indicated on image (a). The data were obtained using
the film calibration data, the MEPHYSTO software and adjusted to represent the field
dimensions at isocentre.
Figure 5.5: A comparison of the profile of the central X-axis produced from the Kodak X-
OMat V film on the 22 September 2014 and the 03 April 2015.
0
20
40
60
80
100
-200 -100 0 100 200
Pe
rce
nta
ge t
o m
axim
um
val
ue
Distance from Central Axis along X-axis (mm)
Leaf matching test
procedure central X-axis
profile obtained with Kodak
X-OMat V film
0
20
40
60
80
100
-200 -150 -100 -50 0 50 100 150 200
Pe
rce
nta
ge t
o M
axim
um
val
ue
Distance from Central Axis Along X-axis(mm)
Comparison of the Kodak X-OMat V film taken of the
leaf matching test procedure on two seperate dates
22-Sep-14
03-Apr-15
Leaf matching
Profile
X-axis
Y-Axis
30
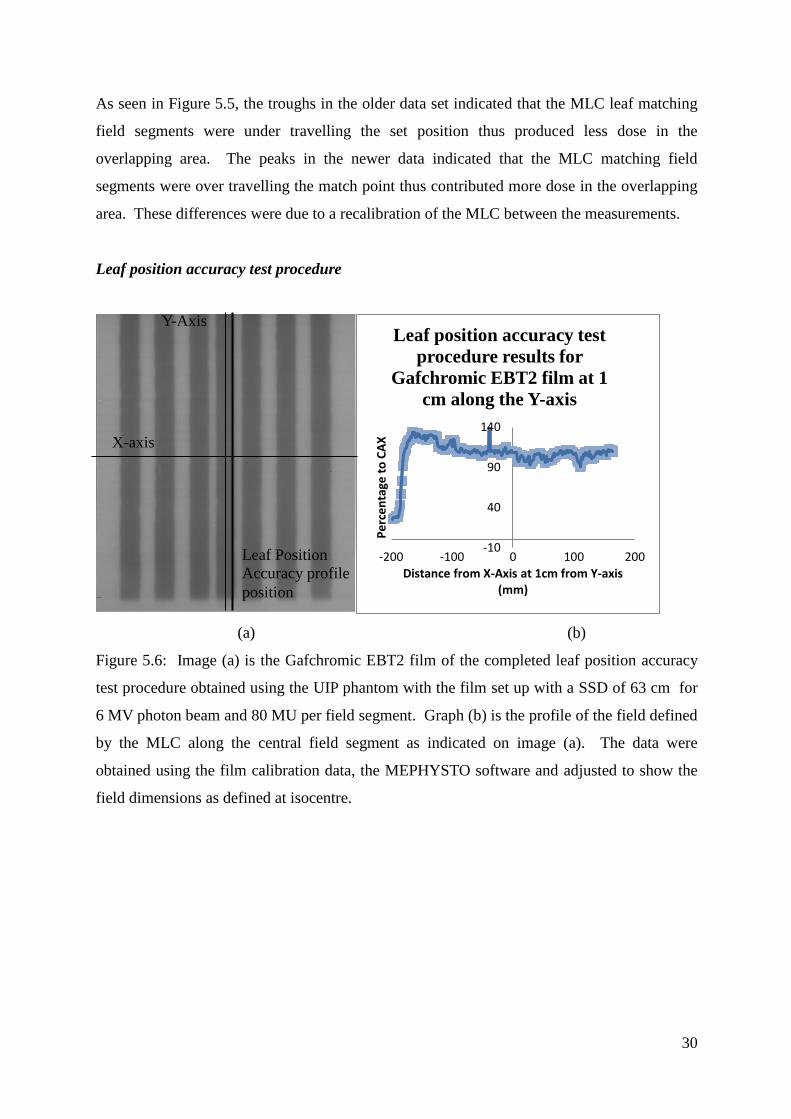
As seen in Figure 5.5, the troughs in the older data set indicated that the MLC leaf matching
field segments were under travelling the set position thus produced less dose in the
overlapping area. The peaks in the newer data indicated that the MLC matching field
segments were over travelling the match point thus contributed more dose in the overlapping
area. These differences were due to a recalibration of the MLC between the measurements.
Leaf position accuracy test procedure
(a) (b)
Figure 5.6: Image (a) is the Gafchromic EBT2 film of the completed leaf position accuracy
test procedure obtained using the UIP phantom with the film set up with a SSD of 63 cm for
6 MV photon beam and 80 MU per field segment. Graph (b) is the profile of the field defined
by the MLC along the central field segment as indicated on image (a). The data were
obtained using the film calibration data, the MEPHYSTO software and adjusted to show the
field dimensions as defined at isocentre.
-10
40
90
140
-200 -100 0 100 200
Pe
rce
nta
ge t
o C
AX
Distance from X-Axis at 1cm from Y-axis (mm)
Leaf position accuracy test
procedure results for
Gafchromic EBT2 film at 1
cm along the Y-axis
Leaf Position
Accuracy profile
position
X-axis
Y-Axis

31
Figure 5.7: A comparison of the profile 1 cm along the Y-axis produced from Gafchromic
EBT2 film on the 21 September 2014 and the 03 April 2015.
Intraleaf leakage and abuttal test procedure
Figure 5.8: The LA 48 Linear array profile of Leaf 10 (5 cm from the central axis) to obtain
the intraleaf leakage and perform the abuttal test procedure. A 2 mm step size was used with
the LA 48 positioned at 5.5 cm depth in water at isocentre.
The lack of peaks at -100, 0 and 100 mm in figure 5.8, indicated that the jaws were abutting
completely.
0
50
100
150
200
250
-200 -150 -100 -50 0 50 100 150 200
Pe
rce
nta
ge t
o C
AX
Distance from X-axis at 1 cm from Y-axis (mm)
Comparison of leaf position accuracy test procedure
results for Gafchromic EBT2 film on two seperate dates
21-Sep-14
03-Apr-15
0
20
40
60
80
100
120
-200 -150 -100 -50 0 50 100 150 200
Pe
rce
nta
ge t
o C
AX
Distance from Y-axis along leaf 10 (mm)
Intraleaf leakage and abuttal test procedure
results from LA48 Linear Array of Leaf 10 of
MLC

32
Figure 5.9: The LA 48 Linear array profile measured parallel to the Y axis and 5 cm offset
from the central axis with a 2 mm resolution. The LA48 was positioned at 5.5 cm depth in
water at isocentre.
The profile indicated that the transmission between the leaves (intraleaf leakage) were less
than 5 % of the central axis dose.
0
20
40
60
80
100
120
-200 -150 -100 -50 0 50 100 150 200
Pe
rce
nta
ge t
o C
AX
Distance from X-axis at 5 cm from Y-axis(mm)
Intraleaf leakage and abuttal test procedure results
obtained with LA48 Linear Array 5 cm offset from
central axis in 2 mm resolution

33
Combined test procedure
(a) (b)
(c) (d)
0
20
40
60
80
100
-150 -50 50 150
Pe
rce
nta
ge t
o M
Axi
mu
m V
alu
e
Distance from Y-axis along X-axis (mm)
Combined test procedure
results with Kodak X-OMat
V film on the central X-axis
for leaf matching analysis
0
20
40
60
80
100
120
-150 -100 -50 0 50 100 150
Pe
rce
nta
ge t
o C
AX
Distance from X-axis at 6.5 cm offset from central axis (mm)
Combined test procedure
results obtained with Kodak
X-OMat V film 6.5 cm offset
the central axis for intraleaf
leakage analysis
0
20
40
60
80
100
120
-150 -100 -50 0 50 100 150
Pe
rce
nta
ge t
o C
AX
Distance from Y-axis along leaf 7 (mm)
Combined test procedure
results obtained with
Kodak X-OMat V film on
leaf 7 for abuttal analysis
Abuttal
profile
position
Leaf
Position
Accuracy
profile
position
Leaf
matching
profile
position
Intraleaf
leakage
profile
position
X-Axis
Y-Axis
34
(e)
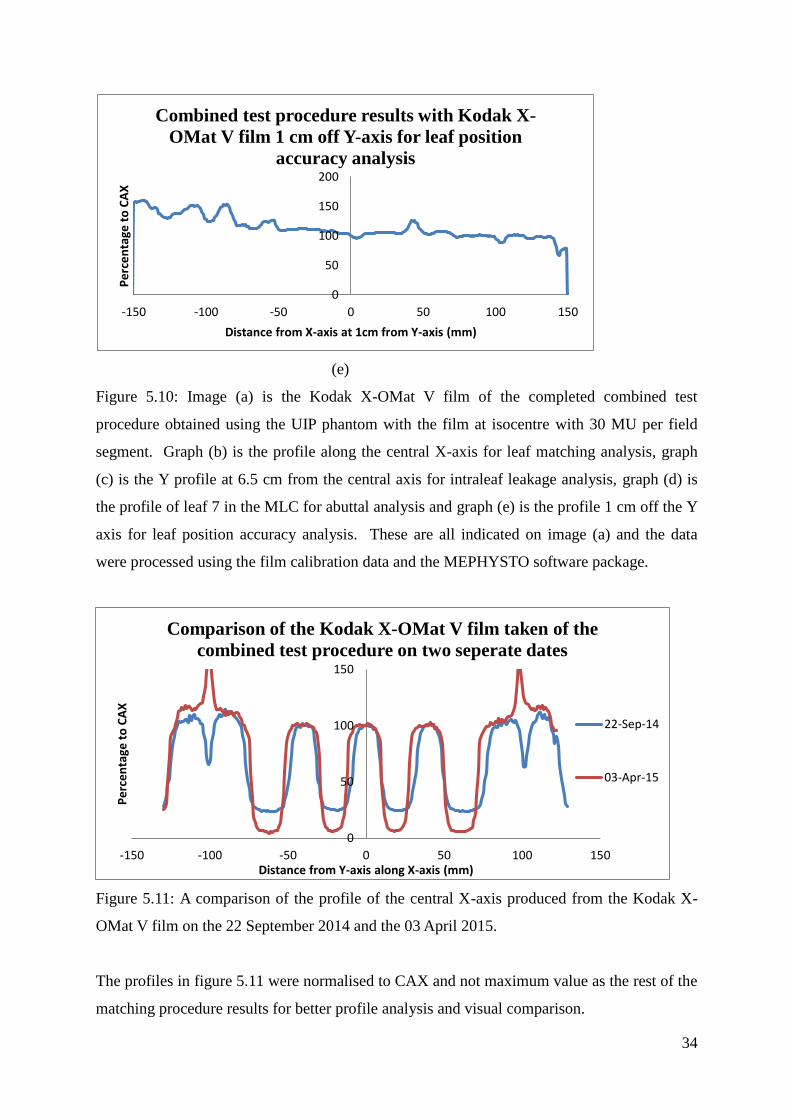
Figure 5.10: Image (a) is the Kodak X-OMat V film of the completed combined test
procedure obtained using the UIP phantom with the film at isocentre with 30 MU per field
segment. Graph (b) is the profile along the central X-axis for leaf matching analysis, graph
(c) is the Y profile at 6.5 cm from the central axis for intraleaf leakage analysis, graph (d) is
the profile of leaf 7 in the MLC for abuttal analysis and graph (e) is the profile 1 cm off the Y
axis for leaf position accuracy analysis. These are all indicated on image (a) and the data
were processed using the film calibration data and the MEPHYSTO software package.
Figure 5.11: A comparison of the profile of the central X-axis produced from the Kodak X-
OMat V film on the 22 September 2014 and the 03 April 2015.
The profiles in figure 5.11 were normalised to CAX and not maximum value as the rest of the
matching procedure results for better profile analysis and visual comparison.
0
50
100
150
200
-150 -100 -50 0 50 100 150
Pe
rce
nta
ge t
o C
AX
Distance from X-axis at 1cm from Y-axis (mm)
Combined test procedure results with Kodak X-
OMat V film 1 cm off Y-axis for leaf position
accuracy analysis
0
50
100
150
-150 -100 -50 0 50 100 150
Pe
rce
nta
ge t
o C
AX
Distance from Y-axis along X-axis (mm)
Comparison of the Kodak X-OMat V film taken of the
combined test procedure on two seperate dates
22-Sep-14
03-Apr-15

35
The profiles shown in figures 5.5 and 5.11 both showed troughs in the older data set and
peaks in the newer set thus indicated that the combined test procedures produced the same
results as the full leaf matching test procedure.
5.2 Results of the MLC Performance at LH
All results were carried out as set out in the methodology section and were obtained at LH on
the Elekta Linac using 8 MV photon beam.
5.2.1 Calibration curves
As stated in section 5.2.1 calibration curves were specific for each portal imaging type,
machine and energy used32, 33. Figure 5.12(a) shows an example of one of the set of
Gafchromic EBT2 films obtained for the purpose of the development of the calibration curve.
The curve obtained from this set of films, graph 5.12(b), is inverted when compared to the
other calibration curves produced (figure 5.2 and 5.13). The inversion is due to the
MEPHYSTO software converting the true colour of the Gafchromic EBT2 film to black for
processing and analysis. Figure 5.13 shows the calibration curve obtained for the Kodak X-
OMat V film.
(a) (b)
Figure 5.12: Image (a) is one of the sets of the Gafchromic EBT2 calibration films for LH 8
MV photon beam obtained by cutting the Gafchromic EBT2 into 9 x 10 cm2 pieces and
0
10000
20000
30000
40000
50000
60000
0.001 0.01 0.1 1 10
Me
asu
re O
pti
cal D
en
sity
Measured Dose (Gy) Log Scale
Livingstone Hospital
Gafchromic EBT2 Film
Calibration Curve

36
exposing to increasing MU. Graph (b) is the linear-logarithmic curve obtained when plotting
the measured optical density against the known dose for the corresponding MU field.
Figure 5.13: Kodak X-OMat V calibration curve for LH 8 MV photon beam obtained by
plotting known dose points on calibration films to measured optical density at the same points
on the scanned film on a linear-logarithmic scale.
Figure 5.14: A comparison of the leaf position accuracy test procedure along the X-axis
profile obtained with Gafchromic EBT2 and Kodak X-OMat V films.
As shown even though the film images of the Gafchromic EBT2 were inverted by
MEPHYSTO, the profiles still demonstrated the same trend and have peaks at the expected
positions. Thus, the resultant data were not affected by the inversion.
0
20000
40000
60000
80000
0.001 0.01 0.1 1 10
Me
asu
re O
pti
cal D
en
sity
Measured Dose (Gy) Log Scale
Livingstone Hospital Kodak X-OMat V
calibration curve
0
20
40
60
80
100
120
140
-150 -100 -50 0 50 100 150
Pe
rce
nta
ge o
f C
AX
Distance from Y-axis along X-axis (mm)
Comparison of the leaf postion accuracy test procedure
along the X-axis for the Gafchromic EBT2 and Kodak X-
OMat V
Gafchromic®EBT2
Kodak X-OMat V

37
The EPID dose linearity curve was obtained with the EPID at its fixed SID of 160 cm and
thus differs from the set up conditions of the other portal image devices used. In figure
5.15(a) an example of an EPID image used to generate the calibration is given. Figure
5.15(b) is the calibration curve generated for the EPID.
Figure 5.15: Image (a) is a sample of the images used to generate the EPID dose response for
the LH 8 MV photon beam. Graph (b) is the EPID dose response curve obtained.
5.2.2 Quality Assurance test procedure results
An example of the planar output obtained for each test procedure and a corresponding profile
are shown in figures 5.16 – 5.24.
36500
37000
37500
38000
38500
39000
39500
40000
40500
0 50 100 150
Op
tica
l De
nsi
ty
MU
Dose response of the EPID at
LH

38
Leaf matching test procedure
(a) (b)
Figure 5.16: Image (a) is the Kodak X-OMat V film of the completed leaf matching test
procedure (without back up jaws) in a field obtained using a polystyrene phantom. The film
was placed at 5 cm depth in the phantom with an SSD of 63 cm and 30 MU per field segment
was delivered. Graph (b) is the profile of the central X-axis as indicated on image (a). The
data were obtained using the film calibration data, the MEPHYSTO software and adjusted to
the field dimensions at isocentre.
Figure 5.17: A comparison of the profile without the back-up jaw in the field along the central
X-axis produced from the Kodak X-OMat V film on the 16 November 2014 and the 13 March
2015.
0
20
40
60
80
100
120
-200 -150 -100 -50 0 50 100 150 200
Pe
rce
nta
ge t
o C
AX
Distance from Y-axis along X-axis (mm)
Leaf matching test
procedure without Back-up
jaw central X-axis profile
obtained with Kodak X-
OMat V film
0
20
40
60
80
100
120
-200 -150 -100 -50 0 50 100 150 200
Pe
rce
nta
ge t
o C
AX
Distance from Y-axis along X-axis (mm)
Comparison of the Kodak X-OMat V film taken of the
leaf matching test procedure without the Back-up jaw on
two seperate dates
16-Nov-14
13-Mar-15
Matching
Profile
X-axis
Y-Axis

39
Both data sets in figure 5.17 had the same trend as well as showing no under- or over-travel of
the leaves.
Figure 5.18: A comparison of the profile with the back-up jaw in the field along the central X-
axis produced from the Kodak X-OMat V film on the 16 November 2014 and the 13 March
2015.
In figure 5.18 the dips at the field segment edges were due to the possible over-travelling of
the MLC ahead of the back-up jaw
0
20
40
60
80
100
120
-200 -150 -100 -50 0 50 100 150 200
Pe
rce
nta
ge t
o M
axim
um
Val
ue
Distance from Y-axis along X-axis (mm)
Comparison of the Kodak X-OMat V film taken of the
leaf matching test procedure with the Back-up jaw on two
seperate dates
16-Nov-14
13-Mar-15

40
Leaf position accuracy test procedure
Figure 5.19: Image (a) is the Gafchromic EBT2 film of the completed leaf position accuracy
test procedure obtained using a depth of 5 cm in a 7 cm thick polystyrene phantom with the
film at isocentre using 80 MU per field segment. Graph (b) is the profile of the edge of the
field defined by the MLC for the central field segment as indicated on image (a) obtained
using the calibration film data and the MEPHYSTO software.
In figure 5.19(b), a peak would indicate that the leaf is further back than the leaf 20 position
and a trough would indicate that the leaf is further forward. The image indicated that leaves
1-19 were closer in position to leaf 20 and that leaf 21 – 40 were progressively aligned further
away from leaf 20.
0
50
100
150
200
-200 -100 0 100 200
Pe
rce
nta
ge t
o C
AX
Distance from X-axis at 1cm from Y-axis (mm)
Leaf position accuracy test
procedure results for
Gafchromic EBT2 1 cm off
Y-Axis
Leaf Position
Accuracy profile
X-axis
Y-Axis
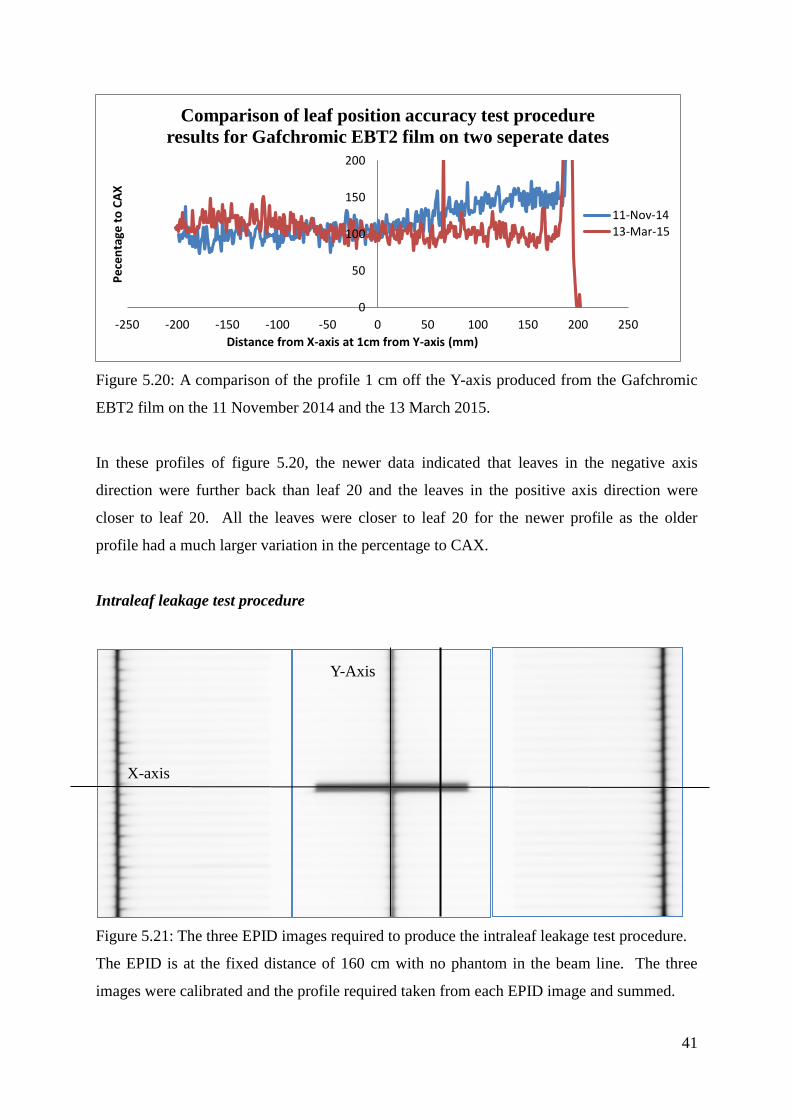
41
Figure 5.20: A comparison of the profile 1 cm off the Y-axis produced from the Gafchromic
EBT2 film on the 11 November 2014 and the 13 March 2015.
In these profiles of figure 5.20, the newer data indicated that leaves in the negative axis
direction were further back than leaf 20 and the leaves in the positive axis direction were
closer to leaf 20. All the leaves were closer to leaf 20 for the newer profile as the older
profile had a much larger variation in the percentage to CAX.
Intraleaf leakage test procedure
Figure 5.21: The three EPID images required to produce the intraleaf leakage test procedure.
The EPID is at the fixed distance of 160 cm with no phantom in the beam line. The three
images were calibrated and the profile required taken from each EPID image and summed.
0
50
100
150
200
-250 -200 -150 -100 -50 0 50 100 150 200 250
Pe
cen
tage
to
CA
X
Distance from X-axis at 1cm from Y-axis (mm)
Comparison of leaf position accuracy test procedure
results for Gafchromic EBT2 film on two seperate dates
11-Nov-1413-Mar-15
X-axis
Y-Axis

42
Figure 5.22: The EPID profile of 5 cm along the Y-axis for the intraleaf leakage and abuttal
test procedure. The central peak is from leaf pair 20 which was open during the exposure.
The smaller peaks in figure 5.22 corresponded to the leakage between the edges of adjoining
leaves. The doses were in the region of 15 – 20% of the maximum central dose but this was
due to the back-up jaw of the MLC system being removed during the imaging of the test
procedure.
Figure 5.23: Comparison of the intraleaf leakage profile for the EPID taken at two different
times
The difference in the profiles seen in figure 5.23 was due to a mirror replacement. The
replacement of the mirror resulted in the projection of the light field changing.
0
20
40
60
80
100
-150 -100 -50 0 50 100 150
Pe
rce
nta
ge t
o C
AX
Distance from X-axis at 5 cm from the Y-axis (mm)
Interleaf leakage test procedure results obtained 5 cm
along the Y-axis for the EPID
0
20
40
60
80
100
120
-150 -100 -50 0 50 100 150
Pe
rce
nta
ge t
o C
AX
Distance from X-axis at 5 cm from Y-axis (mm)
Comparison of intraleaf leakage procedure results for
EPID on two separate dates
EPID March 2015
EPID July 2015

43
Combined test procedure
(a) (b)
(c) (d)
Figure 5.24: Image (a) is the Kodak X-OMat V film of the completed combined test
procedure obtained at 5 cm depth in a 7 cm thick polystyrene phantom at isocentre with each
segment delivering 30 MU. Graph (b) is the profile of the central X-axis representing the leaf
matching test procedure. Graph (c) is the profile of 6.5 cm off the Y-axis representing the
0
20
40
60
80
100
-150 -50 50 150
Pe
rce
nta
ge t
o M
axim
um
Val
ue
Distance from Y-axis along the X-axis (mm)
Combined test procedure
results with Kodak X-OMat
V film on the central X-axis
for leaf matching analysis
0
20
40
60
80
100
120
140
-150 -50 50 150
Pe
rce
nta
ge t
o C
AX
Distance from X-axis at 6.5 cm from Y-axis (mm)
Combined test procedure
results obtained with
Kodak X-OMat V at 6.5
cm off Y-axis for intraleaf
leakage analysis
0
50
100
150
-175 -75 25 125
Pe
rce
nta
ge t
o C
AX
Distance from X-axis at 1 cm from Y-axis (mm)
Combined test procedure
results with Kodak X-OMat
V film 1 cm off Y-axis for
leaf position accuracy
analysis
Leaf Position Accuracy
profile position
Leaf
matching
profile
position
Interleaf
leakage
profile
position
X-axis
Y-Axis

44
intraleaf leakage test procedure and graph (d) is 1 cm off the Y-axis for performing the leaf
position accuracy test procedure. The profiles are indicated in image (a) and the analysis was
obtained using the film calibration data and the MEPHYSTO software package.
Figure 5.25: A comparison of the profile of the central X-axis produced from the Kodak X-
OMat V film on the 16 November and the 18 March 2015 with 100% defined as maximum
value for each profile.
0
20
40
60
80
100
120
-150 -100 -50 0 50 100 150
Pe
rce
nta
ge t
o M
Axi
mu
m V
alu
e
Distance from Y-axis along the X-axis (cm)
Comparison of the Kodak X-OMat V film taken of the
combined test procedure for the leaf matching analysis on
two seperate dates
16-Nov-14
18-Mar-15

45
5.3 CMJAH and LH Results Comparison
The figure (5.26 – 5.29) below are a comparison for each of the test procedures for the
different centers in the study.
5.3.1 Leaf matching test procedure
Figure 5.26: The comparison of the leaf matching test procedure at CMJAH and LH using
Kodak X-OMat V film.
5.3.2 Leaf position accuracy test procedure
Figure 5.27: The comparison of the leaf position accuracy test procedure for CMJAH and LH
exposed on Gafchromic EBT2 film.
0
20
40
60
80
100
120
140
-200 -150 -100 -50 0 50 100 150 200
Pe
rce
nta
ge t
o C
AX
Distance from Y-axis along X-axis (mm)
Comparison of the leaf matching test procedure for
Kodak film at CMJAH and LH
LH 16 Nov 2014without back-up jaw
CMJAH 03 Apr 2015
LH 16 Nov 2014with Back-up jaw
0
50
100
150
200
-200 -150 -100 -50 0 50 100 150 200
Pe
rce
nta
ge t
o C
AX
Distance from X-axis at 1cm from Y-axis(mm)
Comparison of leaf position accuracy test procedure for
Gafchromic film at CMJAH and LH
LH 16 Nov2014
CMJAH 03Apri 2015

46
5.3.3 Intraleaf leakage and abuttal test procedures
Figure 5.28: The comparison of the intraleaf leakage test procedure result from the LA 48
linear array (in water) at CMJAH and the EPID at LH (in air).
The LH MLC jaws do not abut but require a minimum separation distance of 5 mm and back-
up jaws to close the field. Hence an abuttal profile for the LH MLC was not possible and a
direct comparison with the performance of the CMJAH MLC could not be carried out.
5.3.4 Combined test procedure
Figure 5.29: The comparison of the combined test procedure for CMJAH and LH exposed on
Kodak X-OMat V film.
0
20
40
60
80
100
120
-250 -200 -150 -100 -50 0 50 100 150 200 250
Pe
rce
nta
ge t
o C
AX
Distance from X-axis at 5 cm from Y-axis (mm)
Comparison of the intraleaf leakage for LA48 linear array
at CMJAH and EPID at LH
LA48 CMJAH27/09/2015
EPID LH 13 March 2015
0
20
40
60
80
100
120
-150 -100 -50 0 50 100 150
Pe
rce
nta
ge t
o C
AX
Distance from y-axis along X-axis (mm)
Comparison of combined test procedure for Kodak film at
CMJAH and LH
CMJAH 03 Mar 2015Isocentre setup
LH 16 Nov 2014

47
5.4 Portal Imaging Device and Linear Array Observations
Each of the portal imaging devices and the LA48 were capable of producing the similar
results for the test procedures as shown in figure 5.30 for CMJAH and figure 5.31 for LH
below. Each imaging type had its own set of unique limitations when it came to obtaining the
results required.
Figure 5.30: The comparison of the leaf matching test procedure for the portal imaging
devices (Kodak X-OMat V and Gafchromic EBT2 films) and the LA48 linear array used at
CMJAH.
The troughs and the peaks all matched in figure 5.30 with the only discrepancy being the
height of the peaks and the depth of the trough. The Kodak X-OMat V film had a higher
sensitivity and the best resolution at the lower dose areas thus the deeper troughs.
0
20
40
60
80
100
120
-200 -150 -100 -50 0 50 100 150 200
Pe
rce
nta
ge t
o M
axim
um
Val
ue
Distance from Central Axis Along X-axis(mm)
Comparison of the leaf matching test procedure for the
portal imaging devices and LA 48 linear array used at
CMJAH
Kodak 22 Sep 14
Gafchromic 25 Sep14

48
Figure 5.31: The comparison of the combined test procedure X-axis profile for the portal
imaging devices (Kodak X-OMat V, Gafchromic EBT2 films and EPID) used at LH.
As in figure 5.30 the troughs and the peaks all matched in figure 5.31 with the only
discrepancy being the height of the peaks once again.
5.4.1 Processing and Analysis Assessment of Imaging Devices
The imaging devices used, all had specific limitations and advantages for the dose range
covered by the results of this study. Table 5.1 ranks the imaging devices according to the
average exposure time which indicates how much Linac time would be required to obtain the
results for the test procedures.
Table 5.1: The imaging devices used, ranked from the shortest average exposure time needed
on the Linac to obtain the test procedure results
Rank Imaging Device
1st EPID
2nd Kodak
3rd Gafchromic
4th LA 48
The exposure time is linked to the number of MU required by each imaging device as
discussed in chapter 3.
0
50
100
150
-150 -100 -50 0 50 100 150
Pe
rce
nta
ge t
o C
AX
Distance from Y-axis along X-axis (mm)
Comparison of the combined test procedure X-axis profile
for portal imaging devices at LHEpid
Gafchromic16 Nov 14
Kodak 16Nov 14

49
The limitations of the radiographic Kodak film were that it required wet processing which
was not readily available and had a long processing time. The other imaging devices did not
require any processing. The Kodak film though had the highest sensitivity and best dose
response for the portal image devices in the dose range investigated in this thesis.
The Gafchromic EBT2 film did not require any post irradiation processing as per the Kodak
film however it was recommended that the Gafchromic film is only read or scanned 24 hours
after exposure for image stability33. This was done for this study but is not recommended if
analysis and adjustment of MLC is needed urgently. The Gafchromic film showed a low
sensitivity in the low dose range required for this study and produced profiles which are
distorted and not as smooth as obtained with the other imaging devices. Thus the validity of
the results obtained with the Gafchromic film can be brought into question.
The LH EPID system is ranked as having the shortest exposure time but was only able to
obtain images of one field segment per exposure. This slowed the total exposure, capture and
analysis as the segments had to be recombined to obtain a completed test procedure image.
The detector field size of 26 x 26 cm2 also affected the results of certain tests (leaf matching)
and limits the maximum field size that could be tested.
The LA48 required set up in a water tank before any exposure can be done. This was very
time consuming when compared to the portal imaging devices. It did however produced the
best quality of profiles as it was a directly calibrated measurement in real time with no
additional processing of device or data required.

50
6. ANALYSIS
6.1 Introduction
The analysis of the QC procedures was conducted based on the tolerance level set out in
AAPM TG142 ‘Quality assurance of Medical Accelerators’9 and the 2013 CPQR ‘Medical
Linear Accelerators and Multileaf Collimators’10. Further analysis was done to determine the
reproducibly and compatibility across the different Linac platforms and imaging devices used.
Table 6.1 below details the different tolerance levels stated and the baseline is chosen to be
the Kodak film at each institution. The procedures listed in the two guidance documents do
not necessarily have the same names but the appropriate procedure tolerances were used.
Table 6.1: Tolerance values according to AAPM TG 142 and CPQR 2013 for the test
procedures conducted on the CMJAH and LH Linac systems.
Procedure
AAPM
TG142
Tolerance
CPQR
Tolerance Action
Leaf
Matching 1 mm 1 mm 2 mm
Leaf
Positioning
Accuracy
1 mm 1 mm 2 mm
Intraleaf
Leakage
0.5 % from
baseline
2% from
Baseline
3% from
Baseline
Leaf Abuttal 0.5% from
baseline
2% from
Baseline
3% from
Baseline
6.2 Leaf Matching Test Procedure Analysis
The ideal result for the leaf matching test procedure would be a smooth solid profile. The
deviation from the smooth profile is expected at the matching points of the fields when there
is under- or over-travel of the MLC. When this occurs there would be either spikes or dips in

51
the profile at distances of ± 100, ± 50 and 0 mm from the central axis and at ± 100 mm from
the central axis for the combined test procedure. If there were dips below the expected profile
the field was smaller than the expected field size due to the under-travel of the MLC and a
spike in the profile indicated that the field was larger than expected due to the over-travel of
the MLC.
The design of the MLC system on the Elekta Linac used at LH was such that the leaf
matching test procedure could be completed with the back-up jaws either in the field or out of
the field. With the back-up jaws out of the field there were no significant spikes or dips
corresponding to the field matching points as shown in figure 5.16(b). The fields were
matching and thus the MLC leaves were moving to the same position. With the back-up jaws
in the field, the MLC leaves defined the field edge closer to the CAX and the back-up jaw
defined the field edge further from the CAX with the MLC leaves offset by 2 mm as
designed. This was due to the back-up jaw travelling on a straight plane and the MLC leaves
on an elliptical plane within the collimator head. Thus, the MLC leaves which were ahead of
the back-up jaw would over-travel on the matching field edges creating dips on the field
matching points due to a reduction in dose through the MLC leaves. Figure 6.1 shows an
example of one of the leaf matching test procedure subfields with the outline defining the
field set.
Figure 6.1: An example of a leaf matching test procedure subfield with the position of the
backup jaw and MLC shown with respect to the irradiated field size.
Back-
up Jaw
MLC leaf
bank
closer to
CAX
Irradiated
field defined
by dark
outline
MLC leaf
bank ahead
of Back-up
jaw
CAX

52
For all leaf matching and combined test procedure profiles such as those shown in figures 5.5,
5.10(b), 5.11, 5.17, 5.18 and 5.24(b), the full widths half maximum (FWHM) were calculated
and displayed in Table 6.2. The FWHM values give the distance between the jaw positions at
50% of the dose for the curve as seen in figure 6.2.
Figure 6.2: An example of the method used to determine the FWHM values for the matching
data results. The curve shown is for the LA 48 detector at position 100 mm from CAX.
Table 6.2: The average FWHM for all leaf matching and combined test procedures for both
CMJAH and LH for all imaging devices.
Imaging
Device
CMJAH
average
FWHM (mm)
CMJAH
combined
average
FWHM (mm)
LH average
FWHM (mm)
LH combined
average
FWHM (mm)
LA 48 1 -6.8 -6.75 -- --
LA 48 2 -6.9 -6.5 -- --
Kodak 1 -5.2 -5.75 -3.9 -3.25
Kodak 2 3.5 4.13 -3.4 -3.63
Kodak 3 -- -- -3.75 -4.0
Gafchromic 1 -4.95 -5.25 -- -3.5
Gafchromic 2 8.35 7.63 -- -3.38
EPID 1 -- -- -5.25 -5.5
EPID 2 -- -- -5.7 --
The numbering of the imaging devices refers to the different time periods or SSD that the
results were obtained on with a minimum time period of four months from the previous
results.
-110-100
-90-80-70-60-50-40-30-20-10
0
90 91 92 93 94 95 96 97 98 99 100 101 102 103 104 105 106 107 108 109 110
Pe
rce
nta
ge t
o C
AX
Distance from CAX (mm)
The determination of the FWHM for one of the
positions of the LA 48
FWHM

53
The positive average FWHM denoted when the profiles had spikes and thus over-travel of the
MLC was seen. The negative average FWHM denoted when the profiles had dips and thus an
under-travel of the MLC was seen.
There was no constancy in the values obtained for the average FWHM values between the
imaging devices. All the imaging devices at CMJAH showed the same result trend, which
was, negative values for first result and positive for the second except LA 48 which were
taken days apart. The change in the results was due to the MLC being recalibrated between
the data sets.
The LA 48 average FWHM values were all within 0.5 mm but differed from the Kodak 1 and
Gafchromic 1 values by up to 2 mm. The Gafchromic 2 average FWHM values were greater
than those for the Kodak 2 by between 3 – 4 mm whereas the Gafchromic 1 and Kodak 1
values only differ by 0.3 - 0.5 mm. The reason that this result occurred was that the
Gafchromic 2 profiles spikes were not as sharp or long as the Kodak profile spikes as seen in
figure 6.3. When the spikes were re-normalised for determination of the average FWHM, the
Gafchromic 2 results were much broader than the Kodak 2 results causing the discrepancy in
the FWHM seen in table 6.2.
Figure 6.3: The leaf matching test procedure profiles for Kodak 2 and Gafchromic 2 showing
the difference in the shape of the spikes at the matching positions.
0
20
40
60
80
100
120
140
-200 -150 -100 -50 0 50 100 150 200
Pe
rce
nta
ge t
o C
AX
Distance from CAX (mm)
Leaf matching test procedure results at CMJAH for
Kodak 2 and Gafchromic 2
Kodak 2
Gafchromic 2

54
Even though the MLC jaws positions tests and the average FWHM results indicated an
inaccuracy in the jaw position. The tests performed in this thesis were unable to distinguish
what the requirements were for any adjustments or suggested corrections to the leaf banks.
This information could be obtained if the leaf matching test procedure was repeated with a
collimator rotation of 1800. If the rotated subfields match then the MLC leaf banks were
symmetric and further analysis on leaf bank movement could be done. Thus, a more in-depth
study of the leaf matching test procedure is required to obtain a complete quantitative analysis
of the MLC jaw matching.
The LH average FWHM values for the profiles with the back-up jaw in the field were
measured and shown in table 6.2 but the jaws would not be adjusted as the fields without the
back-up show that the MLC jaws match. All the Kodak and Gafchromic average FWHM
values fall between 3.25 – 4.0 mm which was expected as the MLC leaves are offset 2 mm
from the backup jaw into the field. Only one result was obtained from the EPID 1 data for
the combine test procedure due to the edge of the field falling at the end of the detector. To
accommodate the use of the EPID 1 data for the combined test procedure, the procedure can
be redesigned moving the match point closer to CAX.
6.3 Leaf Position Accuracy Test Procedure Analysis
The ideal result of the leaf positioning accuracy procedure would be a straight profile with all
leaves in line with the central MLC leaf pair (leaf 21 at CMJAH and leaf 20 at LH). The
value corresponding to the centre of each leaf was obtained from the curves displayed in
chapter 5. These data sets were then plotted with respect to the central leaves. This data
indicated whether more or less dose was detected by the imaging device (and not the
individual leaf positions) with respect to the central leaves. The inverse of the dose versus
leaf number was plotted to show the actual leaf position with respect to the central leaf (figure
6.4).
In this configuration, if a leave had a value greater than the central leaf at 100 % then that leaf
is further ahead of the central leaf and thus in the field. If a leave had a value smaller than the
central leaf at 100% then the leaf lags the central leaf. From the plot it could be determined
which leaves needed to be moved and in which direction. The adjustment of the leaf could
then be done in conjunction with the visual light field display of the leaves at isocentre.

55
Figure 6.4: An example of the leaf position accuracy test procedure results for all imaging
devices at CMJAH taken in September 2014 normalised to leaf 21 with leaves below 100%
being out of the field and leaves above 100% being in the field.
Figure 6.4 shows that the Kodak 1 film and LA48 1 linear array are in better agreement than
the Gafchromic 1 film which had a greater leaf position variation than the other imaging
devices used.
Figure 6.5: An example of the combined test procedure results for leaf position accuracy for
Kodak and Gafchromic film at LH taken in March 2015 normalised to leaf 20 with leaves
below 100% being out of the field and leaves above 100% being in the field.
Figure 6.5 shows that the Kodak 3 film and Gafchromic 2 film were in better agreement than
the Kodak 2 film which had the same trend as the other imaging device but had larger
0
20
40
60
80
100
120
140
7 8 9 10 11 12 13 14 15 16 17 18 19 20 21 22 23 24 25 26 27 28 29 30 31 32 33 34 35 36 37
Leaf
po
siti
on
fro
m L
eaf
21
Leaf Number
An example of the leaf position accuracy test procedure
results for CMJAH
Kodak
LA 48
Gafchromic
0
20
40
60
80
100
120
140
6 7 8 9 10 11 12 13 14 15 16 17 18 19 20 21 22 23 24 25 26 27 28 29 30 31 32 33 34 35 36
Leaf
Po
siti
on
fro
m L
eaf
20
Leaf Number
An example of the combined test procedure results for leaf
position accuracy at LH
Kodak 2
Gafchromic 2
Kodak 3

56
outlining values at both large and small leaf numbers.
The average leaf position was determined for both centres for all imaging devices and
displayed below in table 6.3. How much the leaf positions vary from 100% (leaf 21 at
CMJAH and leaf 20 at LH) were obtained from the deviation from the 100% information in
table 6.4. Thus, the deviation values were not linked to the average leaf position values. The
ideal values for the average leaf position should be 100% and the standard deviation from the
central MLC leaf should be 0.
Table 6.3: The average leaf position for all leaf position accuracy and combined test
procedures for both CMJAH and LH for all imaging devices.
Imaging
Device
CMJAH
average Leaf
Position (%)
CMJAH
combined
average Leaf
Position (%)
LH average
Leaf Position
(%)
LH combined
average Leaf
Position (%)
LA 48 1 95.84 -- -- --
LA 48 2 -- -- -- --
Kodak 1 95.40 88.68 100.17 100.28
Kodak 2 92.93 92.43 100.62 102.27
Kodak 3 -- 88.69 96.39 97.33
Gafchromic 1 93.96 95.00 89.84 93.12
Gafchromic 2 92.10 89.69 98.39 96.50
EPID 1 -- -- 100.72 102.22
EPID 2 -- -- 99.69 101.16

57
Table 6.4: The deviation from 100% for CMJAH and LH for all leaf position accuracy and
combined test procedures for all imaging devices where 100% corresponds to leaf 21 at
CMJAH and leaf 20 at LH.
Imaging
Device
CMJAH
deviation from
leaf 21 (%)
CMJAH
combined
deviation from
leaf 21 (%)
LH deviation
from leaf 20
(%)
LH combined
deviation from
leaf 20 (%)
LA 48 1 ±14.38 -- -- --
LA 48 2 -- -- -- --
Kodak 1 ±9.76 ±16.43 ±10.26 ±16.24
Kodak 2 ±8.32 ±13.47 ±4.51 ±14.57
Kodak 3 -- ±13.89 ±6.85 ±6.58
Gafchromic 1 ±14.21 ±17.85 ±16.70 ±9.93
Gafchromic 2 ±10.85 ±10.21 ±10.78 ±12.74
EPID 1 -- -- ±6.32 ±7.67
EPID 2 -- -- ±5.88 ±6.43
All the average leaf position values for CMJAH were below 96 % and thus on average the
leaves were behind leaf 21 out of the field. The CMJAH deviation values were all greater
than 10% for all imaging devices except for the leaf position accuracy test procedure results
obtained with the Kodak film. Both these results were expected as seen in figure 6.4 where
on average the leaf were below leaf 21 and there were leaves which had values in the range of
70 – 120%.
The average leaf position values for LH were above 100% before maintenance service on the
Linac and below 100% after the service. This trend was seen with all the imaging devices
except the Gafchromic film. The LH deviation values varied greatly with only the EPID
values being below 10% constantly. Both these results were expected as seen in figure 6.5
where on average the leaves were below leaf 20 and there were leaves which have values in
the range of 80 – 120%
The position with respect to leaf 21 for CMJAH and leaf 20 at LH is known but the distance
that corresponds to these values is not yet quantifiable, even though the average leaf position
results and the graphic representation of the leaf position as in figure 6.4 was known. The
current method of leaf adjustment required the production of the graph as figure 6.4 to

58
determine which leaves had to be moved. The actual adjustment was conducted with visual
display of the leaves position. Thus, further research is required for this analysis to produce a
relationship between the percentage leaf deviation from 100% (leaf 21 at CMJAH and leaf 20
at LH) and physical distance of the leaves in mm.
6.4 Intraleaf Leakage Test Procedure Analysis
The intraleaf leakage data were analysed by imaging device as the dose calibration applied to
each imaging device affects the resultant dose levels especially in the low dose range
associated with scatter. Thus, the data obtained for each imaging device taken first at each
institution namely LA 48 1, Kodak 1, Gafchromic 1 and EPID 1 (September 2014 for
CMJAH and November 2014 for LH) were used as the baseline for that imaging devices data
set as per the abuttal test procedure.
The expected result and therefore the baseline of the intraleaf test procedure will have a
central spike and low percentage peaks at each leaf side as shown in figures 5.9, 5.22 and
5.23. The CMJAH intraleaf leakage was expected to be around 5 % of the maximum whereas
the LH results were expected to be around 20 % due the back-up jaw not being present in the
fields for the procedure.
The expected results for the combined test procedure will have no central spike as shown in
figures 5.10(c) and 5.24(c). This was due to the difference in field design between the
combine test procedure and the intraleaf test procedure. The readings were normalised to the
reading at CAX and as this is not an open leaf dose the values obtained were due to scatter.
Thus, these values were in the percentage range of 80 – 120% of CAX and not 5 – 20% seen
in the intraleaf leakage test procedure results. There was also no expected percentage value
for the combined test procedure results but the variation from the baseline data set must be
within the tolerance shown in table 6.1.

59
Table 6.5: The average intraleaf transmission percentage for the intraleaf leakage test
procedures at both CMJAH and LH for all imaging devices.
Imaging Device
CMJAH
average
intraleaf
transmission
(%)
LH average
intraleaf
transmission
(%)
LA 48 1 3.81 --
LA 48 2 -- --
Kodak 1 3.30 12.21
Kodak 2 2.84 13.44
Kodak 3 0 7.49
Kodak 4 0 5.14
Gafchromic 1 9.67 19.53
Gafchromic 2 14.3 22.49
EPID 1 -- 13.59
EPID 2 -- 9.03
Table 6.6: The average intraleaf transmission percentage for the combined test procedures
intraleaf leakage results at both CMJAH and LH for all imaging devices.
Imaging Device
CMJAH
combined
average intraleaf
transmission
(%)
LH combined
average intraleaf
transmission
(%)
LA 48 1 83.45 --
LA 48 2 79.75 --
Kodak 1 86.36 94.33
Kodak 2 85.76 --
Kodak 3 84.39 94.42
Kodak 4 89.27
Gafchromic 1 111.45 124.48
Gafchromic 2 90.99 110.06
EPID 1 -- 96.09
EPID 2 -- 98.14
Due to the difference in field orientations used for the intraleaf leakage test procedure and the
combined test procedure a direct comparison of the results is not possible. The results though
should be consistent with each other.

60
The intraleaf leakage test procedure results for the Kodak 1 and LA 48 1 baseline values and
subsequent values were within the expected value and the tolerance expressed. For the
combined test procedure, the values differed from the baseline value within the expressed
tolerances as well, except for the Gafchromic film.
All the imaging devices and procedure type had the same trend with the results of the later
reading being lower than the earlier results. This was not observed with the intraleaf leakage
test procedure results for the Gafchromic film (Gafchromic 1) at both CMJAH and LH.
6.5 Abuttal Test Procedure Analysis
The abuttal test procedure could only be conducted on the Siemens Linac at CMJAH as the
Elekta MLC is unable to abut as discussed previously. The expected result of the abuttal
procedure was a smooth continuous profile with no spikes. The expected results for the
abuttal in the combined test procedure were different from the abuttal test procedure results.
This was due to the open fields in the combined test procedure for the leaf position accuracy
test procedure. Thus, a straight line result was not possible but as seen in figure 5.10(d), the
slope from ± 50 mm should be a smooth curve.
Each imaging device would have its own baseline reading as the dose calibration of each
imaging device was different. The dose calibration and the low dose range of the results
would also result in the profiles not being continuously smooth.
6.6 Summary
The leaf matching, leaf position accuracy, leaf abuttal, intraleaf leakage and combined test
procedures were successfully carried out and analysed using different detectors on two Linac
systems at CMJAH and LH. Further investigation is required for the leaf matching and leaf
position accuracy test procedures to produce comprehensive quantitative results. The validity
of the imaging devices results can only be confirmed by physical comparison with the MLC
and the subsequent MLC adjustment according to the results obtained per imaging device.
All the imaging devices produced differing values for each of the test procedures but all
follow the same trends. Thus, an imaging device must be chosen which is most consistent in

61
response and in availability to the user. The Gafchromic film differed from the other imaging
devices for all the test procedure either in result values or data trend. This was related to the
low sensitivity of the Gafchromic film in the dose range evaluated.

62
7. RECOMMEDATIONS
The following was concluded from this thesis:
The leaf matching, leaf position accuracy, leaf abuttal and intraleaf leakage test
procedures evaluated in this thesis are the most relevant for the calibration and
characterisation of an MLC system to current international standards and tolerances.
A successful and reproducible QA program can be established from these procedures
as currently being executed at CMJAH.
The program can be successfully applied on different MLC configurations as at LH
with equivalent effectiveness.
A combined test procedure can replace the four individual procedures as a constancy
check and does achieve results within the accepted tolerances of the individual
procedures.
A combined test procedure requires less execution time and also uses less material (i.e.
film, processor).
Further investigation is required into the methodology of the leaf matching test
procedure to obtain complete quantitative analytical information on the MLC jaw
symmetry and matching.
Further research is required in the analysis of the leaf position accuracy test procedure
in order to quantify the physical distance of the leaves from their ideal position.
The various imaging devices produced consistent and comparable results within
tolerance of each other except for the Gafchromic film, which has a low sensitivity in
the low dose ranges used for these test procedures.
The investigator recommends that the combined test procedure be conducted on all
Linac MLC systems to establish a system baseline and then repeated at a frequency as
stipulated in current international standards.
The investigator strongly recommends that the radiographic Kodak film is used as the
imaging device to record the results as it has consistently reproducibly results in the
dose range investigated.
If Kodak film is not a viable option for the department due to issues discussed, the
investigator recommends that the LA 48 linear array is used as the imaging device as
it has real time results and a high resolution is achievable.
If neither the Kodak film nor the LA 48 linear array is available due to departmental
resources the investigator recommends that the EPID system is used as the imaging
device to record the results. The EPID systems are currently widely in use and
available and has the shortest set-up, exposure, image retrieval time of all the imaging
devices examined in this thesis.

63
The investigator recommends that the test procedures be examined for the full photon
energy range available on the Linac system as well as at major gantry positions.
The investigator recommends that great caution should be taken in the commissioning
of IMRT or other small field techniques as the baseline of the system set up within the
required standards for the techniques must be well defined and evaluated to be able to
determine the reproducibility and stability of the MLC over time for these techniques.
The investigator recommends that the test procedures be examined using smaller
volume ion chambers, 2D arrays and new imaging devices functioning in low dose
small field dosimetry.

64
8. REFERENCES
1. F. M. Khan. The physics of radiation therapy, 4th edition. Lippincott Williams &
Wilkins, 2010.
2. AAPM Radiation Therapy Committee. Task Group 50.Basic applications of mul-
tileaf collimators. American Association of Physicists in Medicine. 2001. [Online]
Available from: https://www.aapm.org/pubs/reports/ [Accessed December 2013]
3. C. Liu, T. A. Simon, C. Fox, J. Li, & J. R. Palta. Multileaf collimator characteristics
and reliability requirements for IMRT Elekta system. International Journal of Radi-
ation Oncology Biology Physics, 2008, 71 (1), p. S89-S92.
4. G. A. Ezzell, J. M. Galvin, D. Low, J. R. Palta, I. Rosen, M. B. Sharpe, et al.
Guidance document on delivery, treatment planning, and clinical implementation of
IMRT: Report of the IMRT subcommittee of the AAPM radiation therapy committee.
Medical Physics, 2003. 30 (8), p.2089.
5. S. Webb. Volumetric-modulated arc therapy: its role in radiation therapy. Medical
Physics Web Article. 2009, [Online] Available from:
http://medicalphysicsweb.org/cws/article/opinion/39542 [Accessed May 2016]
6. D. Wyman, P. Munro, et al. Standards for Quality Control at Canadian Radiation
Treatment Centres: Linear Accelerator. 2005. Canadian Association of Provincial
Cancer Agencies (CAPCA). [Online] Available from:
http://www.medphys.ca/media.php?mid=134 [Accessed December 2012].
7. G. J. Kutcher, L. Coia, M. Gillin, W. F. Hanson, S. Leibel, R. J. Morton, et al. Com-
prehensive QA for radiation oncology: report of AAPM radiation therapy committee
Task Group 40. Medical Physics, 1994, 21, p.581.
8. M. Evans, C. Araujo, P. Dickof, et al. Standards for Quality Control at Canadian
Radiation Treatment Centres: Multileaf Collimator. 2006. Canadian Association of

65
Provincial Cancer Agencies. [Online] Available from:
http://www.medphys.ca/media.php?mid=135 [Accessed December 2012]
9. E. E. Klein, J. Hanley, J. Bayouth, F. F. Yin, W. Simon, S. Dresser, et al. Task Group
142 report: quality assurance of medical accelerators. Medical Physics, 2009, 36 (9),
p.4197.
10. C. Kirkby, E. Ghasroddashti, C. Angers, et al. Technical Quality Control Guidelines
for Canadian Radiation Treatment Centres: Medical Linear Accelerators and Multileaf
Collimators. Canadian Partnership for Quality Radiotherapy.2013, [Online]
Available from: https://www.medphys.ca/media.php?mid=3733 [Accessed December
2013]
11. T. J. LoSasso. IMRT delivery system QA. Intensity-modulated radiation therapy:
The State of Art. American Association of Physicists in Medicine, 2003, pp. 561-93.
12. T. J.LoSasso. IMRT delivery performance with a Varian multileaf collimator.
International Journal of Radiation Oncology Biology Physics, 2008, 71 (1), S85-
S88.
13. M. Sastre-Padro, U. A. van der Heide and H. Welleweerd. An accurate calibration
method of the multileaf collimator valid for conformal and intensity modulated
radiation treatments. Physics in Medicine and Biology, 2004, 49 (12), p. 2631.
14. E. E. Klein, W. B. Harms, D. A. Low, V. Willcut and J. A. Purdy. Clinical implemen-
tation of a commercial multileaf collimator: Dosimetry, networking, simulation, and
quality assurance. International Journal of Radiation Oncology Biology Physics,
1995, 33 (5), p. 1195-1208.
15. J. E. Bayouth. Siemens multileaf collimator characterization and quality assurance ap-
proaches for intensity-modulated radiotherapy. International Journal of Radiation
Oncology Biology Physics, 2008, 71 (1), p. S93-S97.

66
16. T. J. Jordan and P. C. Williams. The design and performance characteristics of a mul-
tileaf collimator. Physics of Medicine and Biology, 1994, 39 (2), p. 231-251.
17. S. J. Baker, G. J. Budgell, and R. I. Mackay. Use of an amorphous silicon electronic
portal imaging device for multileaf collimator quality control and calibration. Physics
in Medicine and Biology, 2005, 50 (7), p 1377-1392
18. M. Pasquino, V. C. Borca, P. Catuzzo, F. Ozzello, S. Tofani. Transmission, penumbra
and leaf positional accuracy in commissioning and quality assurance program of a
multileaf collimator for step-and-shoot IMRT treatments. Tumori. 2006, 92 (6), p 511
- 516.
19. J. E. Bayouth, D. Wendt, S. M. Morrill. MLC quality assurance techniques for IMRT
applications. Medical Physics. 2003, 30 (5), p 743-750.
20. J. Chang, C. H. Obcemea, J. Sillanpaa, J. Mechalakos, C. Burman. Use of EPID for
leaf position accuracy QA of dynamic multi-leaf collimator (DMLC) treatment.
Medical Physics. 2004, 31 (7), p 2091-2096.
21. J. M. Galvin, A. R. Smith, B. Lally. Characterization of a multileaf collimator system.
International Journal of Radiation Oncology Biology Physics. 1993, 25 (2), p 181-
192.
22. M. N. Graves, A. V. Thompson, M. K. Martel, D. L. McShan, B. A. Fraass.
Calibration and quality assurance for rounded leaf-end MLC systems. Medical
Physics. 2001, 28 (11), p 2227-2233.
23. A. R. Hounsell, T. J. Jordan. Quality control aspects of the Philips multileaf collimator.
Radiotherapy and Oncology. 1997, 45 (3), p225-233
24. M. S. Huq, I. J. Das, T. Steinberg, J. M. Galvin. A dosimetric comparison of various
multileaf collimators. Physics in Medicine and Biology. 2002, 47 (12), N159-N170
25. D. A. Low, J. W. Sohn, E. E. Klein, J. Markman, S. Mutic, J. F. Dempsey.
Characterization of a commercial multileaf collimator used for intensity modulated
radiation therapy. Medical Physics. 2001, 28 (5), p752-756

67
26. T. LoSasso, C. S. Chui, C. C. Ling. Physical and dosimetric aspects of a multileaf
collimation system used in the dynamic mode for implementing intensity modulated
radiotherapy. Medical Physics. 1998, 25 (10), p1919-1927
27. L. Parent, J. Seco, P. M. Evans, D. R. Dance. A. Fielding. Evaluation of two methods
of predicting MLC leaf positions using EPID measurements. Medical Physics. 2006;
33 (9), p 3174-3182
28. D. A. Low, J. M. Moran, J. F. Dempsey, L. Dong, and M. Oldham. Dosimetry tools
and techniques for IMRT. Medical Physics, 2011, 38 (3), p. 1313-1338.
29. G. Marinello. Overview on dosimetry for modern techniques using high energy X-rays.
In Proceeding of AAPM ISEP: training course on clinical dosimetry and quality
assurance for advanced radiation therapy techniques, Prague, Czech Republic, 16-
20 Jun. 2008. [Online] Available from
http://www.iaea.org/inis/collection/NCLCollectionStore/_Public/40/003/40003876.pdf
[Accessed on 1 May 2014]
30. H. Bouchard, J. Seuntjens, S. Duane, Y. Kamio and H. Palmans. Detector dose
response in megavoltage small photon beams. I. Theoretical concepts. Medical
Physics. 2015, 42 (10), p 6033-6047
31. H. Bouchard, Y. Kamio, H. Palmans, J. Seuntjens and S. Duane. Detector dose
response in megavoltage small photon beams. II. Pencil beam perturbation effects.
Medical Physics. 2015, 42 (10), p 6048-6061.
32. S. Pai, I. J. Das, J. F. Dempsey, K. L. Lam, T. J. Losasso, A. J. Olch, J. R. Palta, L. E.
Reinstein, D. Ritt and E. E. Wilcox. Task Group-69: Radiographic film for megavolt-
age beam dosimetry. Medical Physics, 2007, 34 (6), p 2228-2255
33. A. Niroomand-Rad, C. R. Blackwell, B. M. Coursey, K. P. Gall, J. M. Galvin, W. L.
McLaughlin, et al. Radiochromic film dosimetry: recommendations of AAPM radia-
tion therapy committee task group 55. Medical Physics, 1998, 25 (11), p 2093-2115.

68
APPENDIX
Similarity Summary Report

69