Embed Size (px)
Citation preview

DELTA CORPORATION LIMITED Annual Report 2017
1
Delta CorporationLIMITED
2017
b r i g h t e r t o g e t h e r

DELTA CORPORATION LIMITED Annual Report 2017
01
DELTA CORPORATION LIMITED Annual Report 2017
FOR THE YEAR ENDED 31 MARCH 2017
OUR VISION: TO BE THE MOST ADMIRED BEVERAGE BUSINESS IN THE REGION
Our Mission is to bring enjoyment and refreshment to our consumers by nurturing our brands and growing our business sustainably for the betterment of our employees and communities.
We value the accountability of our people, teamwork, our local communities, our customers and our reputation.
And this means that together we can prosper, creating a thriving, sociable, resilient, cleaner, and productive world.
We Are Delta Corporation.
Brighter Together.BRIGHTER TOGETHER IN THREE WAYS:
• People get more from life when they come together – our products make those moments shine BRIGHTER.• Our people shine brightest when they work TOGETHER in teams• Our involvement in communities helps to create a BRIGHTER future
To view the Online Annual Report, please visit our website at
www.delta.co.zw
02 Value Statements
04 Company Profile
06 Financial Highlights
08 Chairman’s Statement
10 Review of Operations
26 Report of the Directors
28 Corporate Governance
30 Directors’ Responsibility for Financial Reporting
31 Annual Financial Statements
79 Group Statistics
80 Sustainable Development Report
89 Group Structure
90 Portfolio of Businesses
91 Directorate and Management
92 Directorate
94 Group Management Committee
96 Notice to Members
97 Shareholders Analysis
CONTENTS
ANNUAL FINANCIAL STATEMENTS
To be the most admired Beverage Company in the Region.
• Creating a balanced portfolio of businesses• Building and nurturing strong
brand portfolios that earn the support and affection of our customers and consumers
• Growing the profitability of the business on a sustainable basis.• Building and sustaining alliances with business partners
We bring enjoyment and refreshment to our consumers by nurturing our brands and growing our business sustainably for the betterment of our employees and communities.
OUR PURPOSE
OUR VISION
OUR STRATEGIC PRIORITIES
• People are our enduring advantage• Accountability is clear and personal• We work and win in teams• We are customer and consumer focused• We do our best for local communities• Our reputation is indivisible
OUR VALUES

DELTA CORPORATION LIMITED Annual Report 2017 DELTA CORPORATION LIMITED Annual Report 2017
02 03
• The calibre and commitment of our people set us apart• We are a diverse and dynamic team• We select and develop people for the long term• Performance is what counts• Health and Safety issues receive priority attention
• We actively develop and share knowledge within the Group• We foster trust and integrity in internal relationships• We encourage camaraderie and a sense of fun
• We favour decentralizedmanagement and a practical maximum of local autonomy
• Goals and objectives are aligned and clearly articulated• We prize both intellectual rigour and passion for our work• We are honest about performance• We require and enable self- management
OUR PEOPLE ARE OUR ENDURING ADVANTAGE
ACCOUNTABILITY IS CLEAR AND PERSONAL
WE WORK AND WIN IN TEAMS
VALUE STATEMENTS
• We are endlessly concernedwith our customers’ needs and perceptions
• We build lasting relationships based on trust• We aspire to offer the preferred choices of product and service• We innovate and lead in a changing world
• We consciously balance local and group interests• We benefit the local
communities in which we operate
• We endeavour to conduct ourbusiness in an environmentally sustainable manner
• Our reputation relies on theactions and statements of every employee
• We build our reputation for the long term• We are fair and ethical in all our dealings
WE UNDERSTAND AND RESPECT OUR CUSTOMERS AND CONSUMERS
OUR REPUTATION IS INDIVISIBLE
WE DO OUR BEST FOR LOCAL COMMUNITIES

DELTA CORPORATION LIMITED Annual Report 2017 DELTA CORPORATION LIMITED Annual Report 2017
04 05
DELTA CORPORATION IS A MODERN BLUE CHIP COMPANY POISED FOR GROWTH IN ALL FACETS OF ITS BUSINESS.
The Company is a principally a beverages company with a diverse portfolio of local and international brands in lager beer, traditional beer, Coca-Cola franchised sparkling and alternative non-alcoholic beverages. It has investments in associate companies whose activities are in cordials and juice drinks, (Schweppes Holdings Africa Limited) wines and spirits (African Distillers Limited).
The Company is listed on the Zimbabwe Stock Exchange and was first listed in 1946 as Rhodesia Breweries Limited. Its origins, however, date back to 1898 when the country’s first brewery was established in Cameroon Street, (Salisbury) Harare, from where the brewing industry developed into a major industrial and commercial operation.
By 1950, the Company had built the Sable Brewery in Bulawayo, producing pale ale, milk stout and Sable Lager. Over the years the Company continued to expand its portfolio of businesses and diversified its brewing base. In 1978 the name was changed to Delta Corporation Limited and the Company assumed the mantle of a holding company for a broad range of interests serving the mass consumer market. These included lager and sorghum beer brewing, bottling of carbonated and non-carbonated soft drinks, supermarket and furniture retailing, tourism and hotels and various agro-industrial operations.
The hotel, supermarket and furniture retailing businesses were demerged from
the Group in 2001 to 2002 resulting in the Group focusing on the core beverages sectors. Some supply chain related investments remained part of the Group until 2014 when the plastic packaging entity, MegaPak, was demerged. The Company has a minority shareholding in the packaging group, Nampak Zimbabwe.
On 19 September 1946, a blue-chip company was born, when the office of the Registrar of Deeds and Companies issued a certificate of registration number 190/1946 for Rhodesian Breweries Limited, the company that is now Delta Corporation Limited.
COMPANY PROFILE
The new Chibuku Super Plant at Kwekwe Brewery, 2016
The principal risks facing the Group and considered by the Board and Group Management Committee are detailed below. These are not the only risks facing the Group. There may be additional risks not currently known to us or that we currently deem to be immaterial which may materially adversely affect the business financial condition or results of operations in future periods.
Unfavourable general economic and political conditions in the countryThe economic environment continues to deteriorate and this increases the overall risk of doing business. Consequently, fiscal revenues are inadequate. The political environment, although peaceful, remains turbid. The next general elections are in 2018 which could stoke political violence. Key members of the country’s leadership are on US and EU targeted restrictive measures. In addition, there is increased scrutiny of cross border financial transactions as the country aligns to international best practice.
Concerns about perceived negative health and social consequences of both alcoholic and non-alcoholic beverages.There is growing global concern and high profile debate over alcohol consumption, certain ingredients and advocacy for reduced consumption of sugar sweetened beverages. These issues would impact on consumer preferences, hence any restrictions on the permissible advertising style, media and messages and the marketing, labelling, packaging or sale of these beverages could impact on performance.
Product Safety and Quality Issues and TrademarksOur success depends in large part on our ability to maintain and enhance the image and reputation of our brands/products. We have rigorous product safety and quality standards which we endeavour to meet. Any product that becomes contaminated or adulterated may be subject to product liability claims and negative publicity which impacts on the business. Any failure to protect the company’s intellectual property rights, trademarks, patents, trade secrets and knowhow may have adverse effects on the business.
Increased Competition ActivityBoth the alcoholic and non-alcoholic beverage sectors are highly competitive. Competition is from local alternative beverages, imports of own franchise brands by retailers, private label brands and across beverage categories. The strength of the US dollar against the regional source market currencies will place pressure on local pricing of certain brands and packs. We continue to strengthen our capabilities in marketing and innovation and to review value chain costs.
Regulatory or Policy Risks a) Indirect Taxes
Our business is subject to numerous duties or taxes such as import duties, excise taxes and other levies. These taxes can be changed at short notice, thereby impacting on pricing and hence demand of our products.
b) PoliciesThe policy environment remains unpredictable particularly relating to fiscal compliance, financial markets and implementation of various regulations. Policy uncertainty impacts on our ability to plan for the future. Of particular note are issues related to currency management, bank transaction limitations and other measures that impact on the ability of consumers to purchase our products.
Environmental Management PoliciesThere is increasing concern and changing attitudes about solid waste streams and environmental responsibility and adoption of certain ecotaxes or fees charged in connection with use of certain beverage containers. Changes in such regulations affect the cost of doing business and force changes to our product development options and distribution models.
Information and Cyber SecurityThe Group relies on information technology systems to process, transmit, and store electronic information. There is increasing cyber-attacks capabilities, which could result in business interruptions. Any un-authorised access to the Company’s confidential data or strategic information or its public disclosure could harm the company’s reputation or impact on its
operations. There is also risk of tighter regulations on access to personal data of consumers and customers.
Default by counterparty financial institutions or customersWe have significant amounts of cash, cash equivalents and other investments on deposit with banks and financial institutions. We also extend both secured and unsecured credit to our retail customers. The risk of counterparty default or failure may be heightened during economic downturns and periods of uncertainty. In addition, there are challenges in meeting both in country and external payments or cash withdrawals. Losses could therefore arise from bankruptcy or insolvency of these counterparties. Instability in the supply of utilities and agricultural raw materialsThe business relies on agricultural raw materials such as sugar, maize, barley and sorghum whose supply is impacted by adverse weather patterns and decreased agricultural productivity in the country and the region. The reduced availability of these commodities and escalations in costs affect the viability of the Company and the food security of communities, farmers and the consumers. There is need to focus on sustainable water ecosystems and productive land use.
The supplies of water, electrical power and other utilities remain unstable, which could disrupt production, cold beverage availability and the sourcing of local materials and services.
Reliance on Franchise Arrangements and BrandsThe business produces a significant portion of brands that are franchised from third parties or are produced under license through bottler agreements that expire at various intervals. These arrangements can be terminated if certain conditions are breached giving rise to possibility of underutilisation of certain assets. The Company maintains healthy relations with its franchise partners and continues to support and nurture its own brands.
PRINCIPAL RISKS AND UNCERTAINTIES

DELTA CORPORATION LIMITED Annual Report 2017 DELTA CORPORATION LIMITED Annual Report 2017
06 07
2017 2016 2015 2014 2013
GROUP SUMMARY (US$’000)
Revenue 482 968 538 198 576 552 602 224 631 276
Earnings before interest, tax, depreciation and amortisation 112 758 128 928 143 168 158 704 161 519
Profit after tax 69 885 80 089 92 800 107 193 104 123
Attributable earnings 69 885 80 089 91 943 105 664 102 472
Net Funds 113 334 101 016 63 611 15 196 (3 517 )
Total Assets 704 089 696 238 663 665 619 886 561 938
Market Capitalisation 1 070 110 699 927 1 304 697 1 427 799 1 406 314
SHARE PERFOMANCE (US cents)
Earnings per share
Attributable earnings basis 5,70 6,49 7,44 8,55 8,49
Cash equivalent earnings basis 8,24 9,53 10,13 11,48 11,19
Cash flow per share 10,85 12,20 11,25 12,20 13,46
Dividends per share 5,45 4,70 3,65 3,55 3,40
Net asset value per share 41,11 39,53 36,96 32,87 28,21
Market price per share 86,00 56,25 105,00 115,00 115,00
FINANCIAL STATISTICS (%)
Return on equity 13,87 16,41 20,14 25,63 30,09
Operating margin (operating income to net sales) 19,07 20,00 22,08 25,02 24,73
FOR THE YEAR ENDED 31 MARCH
FINANCIAL HIGHLIGHTS
EBITDA DECREASED BY 13% TO
DECREASED BY 10% TO
DECREASED BY 12%
US5,70cents
US$483million
US$113million
HIGHLIGHTS
EARNINGS PER SHARE
REVENUE
OPERATINGINCOME
15% MILLIONUS$82
NET CASHUS$113million

DELTA CORPORATION LIMITED Annual Report 2017 DELTA CORPORATION LIMITED Annual Report 2017
08 09
CHAIRMAN’S LETTER TO SHAREHOLDERS
The Company experienced significant challenges during the year; characterised by constrained aggregate demand, limited access to cash and alternative payment platforms and delays in foreign remittances. The country received heavy rains, which although welcome, limited market access and significantly inhibited outdoor consumption occasions. As a consumer facing business, these challenges impacted the fortunes of the Company.
Notwithstanding the foregoing, the business remains
profitable albeit at reduced volume and revenues. Lager
beer volume is down 7%, Sparkling beverages down 11%
and Sorghum beer is down 3% against last year. There was
a marked increase of soft drinks imports in the second
half of the year while the inaccessibility of the markets
from heavy rains was more pronounced on the Sorghum
beer volume. Revenue is down 10% on last year due to mix
changes in favour of the more affordable brands and packs
within each category.
REAL RETURNS
DEAR SHAREHOLDER,
Total dividend for the year of US5,45 cents per share.
US5,45 cents
The lower volume and increased
contribution of value brands and packs
reduced the margin with operating
income and EBITDA down 15% and 13%
respectively.
Reduced investment in working capital
arising from softening volume, delayed
settlement of both foreign creditors and
dividends have increased net funding to
US$113 million.
SHAREHOLDER CHANGES Following the conclusion of the
combination of SABMiller and AB InBev
in October 2016, the Company is now an
associate of the new AB InBev Group.
THE COCA-COLA BOTTLER’S AGREEMENTThe Coca-Cola Company (TCCC) issued
a notice of its intention to terminate
the Bottler’s Agreements with Delta
Beverages and its associate Schweppes
Holdings Africa Limited following the said
shareholder changes. Subsequently TCCC
and AB InBev reached an agreement in
principle to explore options to restructure
the bottling operations in a number of
countries. The Company has issued a
cautionary statement in this regard.
All relevant parties are engaged in
discussions and stakeholders will be
updated on progress.
DIRECTORATEMr Mark Bowman resigned as a Director
of the Company and was replaced by Mr
Ricardo Tadeu, the Africa Zone President
of AB InBev with effect from 4 November
2016. I wish to thank Mr Bowman for his
invaluable contribution since 2007 and
welcome Mr Tadeu.
OUTLOOKThe projected good cereals output of
the 2016/17 summer cropping season
together with the expected higher volume
of tobacco and cotton may shore up
consumer spend. We continue to manage
our overhead base in line with volume
in order to deliver a positive return to
shareholders.
DIVIDENDThe Board declared two interim dividends
of US2,00 cents and US1,00 cent per
share. A final dividend of US2,45 cents per
share is proposed. This brings the total
dividend for the year ended 31 March 2017
to US5,45 cents per share.
C F DubeChairman
5 May 2017
CHAIRMAN’S LETTER TO SHAREHOLDERS (CONTINUED)

DELTA CORPORATION LIMITED Annual Report 2017 DELTA CORPORATION LIMITED Annual Report 2017
10 11
For most of the year there was limited supply of water in major
urban areas, this was partly due to the drying up of dams and
ground water sources as well as constraints faced by local
authorities in processing raw water and repairing the reticulation
infrastructure. The heavy rains that were experienced in the
country resulted in damage to road infrastructure reducing
market access and outdoor consumption occasions.
There were a number of fiscal and monetary policy interventions
which made the operating environment increasingly uncertain.
The revenue collection authority, ZIMRA and the traffic police’s
aggressive collection measures impacted economic activity as
not only did they affect consumer spending, the road blocks also
impeded the free movement of both vehicles and cargo.
Weakening regional currencies and favourable duty regimes
under the COMESA trade protocols resulted in considerable
imports of soft drinks from Zambia and Mozambique.
The business faced significant headwinds during the current financial year which impacted negatively on the volume performance across all the beverage categories. The consumers and traders were generally stretched due to shortages of bank notes, fundamental changes to the payment platforms and uncertainty around the introduction of bond notes. The tight liquidity conditions forced the Company to tighten the extension of credit to customers. The sourcing of imported raw materials and capital equipment was constrained by the delays in foreign remittances.
REVIEW OF OPERATIONSBEVERAGES BUSINESS OVERVIEW
BEVERAGE VOLUME PERFORMANCE (000HL)
0
500
1,000
1,500
2,000
2,500
3,000
3,500
Lagers Sparkling Sorghum Maheu
4,000
2013 20152014 2016 2017
REVIEW OF OPERATIONS (CONTINUED)
BEVERAGES BUSINESS OVERVIEW
BEVERAGE GROSS REVENUE PERFORMANCE (US$MIL)
0
100
200
300
Lagers Sparkling Sorghum Maheu
400
2013 20152014 2016 2017
The Retailer Development Program ran for a second year
to empower our traders and develop good business
skills. A total of 700 traders were trained during the
year in areas that covered business management,
product handling, customer care, responsible retailing
and consumption of alcohol as well as post-consumer
waste management. We collaborated with other value
chain partners to train our traders on outlet hygiene and
financial skills.

DELTA CORPORATION LIMITED Annual Report 2017 DELTA CORPORATION LIMITED Annual Report 2017
12 13
Lager beer volume was 7% below prior year as the category continued to decline from the historical peak of 2,0 million hectolitres achieved in the year to March 2013. There is some slowdown in the rate of decline, with brands such as Zambezi Premium Lager and Castle Lite registering growth in the current year.
The sales performance was largely constrained by the prevailing macro-economic factors, the down trading to affordable offerings and opportunistic imports. Our brands continue to collectively appeal to a wide cross section of consumers and command leading positions in the repertoire of Zimbabwean drinkers. The total market share has remained stable at above 95% of the lager beer category.
LAGER BEER BUSINESS
REVIEW OF OPERATIONS (CONTINUED)
LAGER VOLUME PERFORMANCE (000HL)
2013
2014
2015
2016
2017
0
500
1,000
1,500
2,000
2,500
� SPECIAL EVENTS 2%� BOTTLE STORE 11%� GENERAL DEALER 2%� HOTEL & RESTAURANT 2%� OTHER 2%� BAR 10%� SUPERMARKET 6%� WHOLESALE/DISTRIBUTOR 65%
LAGER BEER TRADE CHANNEL SALES % CONTRIBUTION
LAGER BEER BUSINESS
LAGER BEERVOLUME
REVIEW OF OPERATIONS (CONTINUED)
Manufacturing throughput was stable despite intermittent utilities outages. There were pronounced water supply disruptions during the period September to December 2016 whose impact was mitigated by higher finished product stock covers. The decline in volume negatively impacted capacity utilisation and production efficiency.
Our full brand and pack offerings continue to attract consumer attention through merchandising, upgraded labels, branded merchandise and various consumer promotions.
The Company continues to focus on marketing efforts in maintaining consumers within its franchise. Our mainstream brand line-up comprising Castle Lager, Carling Black Label and Lion Lager constitutes the bulk of our sales and dominates the lager beer category. These marketing activities promote consumer closeness, bonding, social development and outright pride in our country.
Castle Lager, our flagship brand’s essence is to be the bonding benchmark in all consumption occasions. It is the beer brand that brings people together for a better world as it boldly declares: “It all comes together with a Castle!!”
OUR BRANDS IN THE COMMUNITYThe Company remains committed to the development of sport and the arts through various brand sponsorships as it endeavours to connect its brands with both its consumers and the communities.
Soccer remains Zimbabwe’s premier sport hence brand Castle Lager has renewed its Premier Soccer League sponsorship for another three years, an investment of over one million dollars per year in Sponsorship and supporting activities.
Castle Lager brought consumers together for a worthy cause at the maiden Castle Lager Braai Day at Alexander Sports Club on 29 October 2016. The event saw consumers coming out to enjoy good music, braai and some cold Castle Lagers. Through this event, the brand will donate a year’s supply of meat to the country’s two biggest referral hospitals - Harare Hospital and Mpilo Hospital in Bulawayo.
Carling Black Label sponsors the National Pool tournament, a sport that has a rising following.
Zambezi Lager focuses on consumers eager to follow the call to embrace Zimbabwe’s great outdoor life. It remains the official beer for Kariba Invitational Tiger Fishing Tournament and the Victoria Falls Carnival, platforms that support tourism in Zimbabwe.
Castle Lite is a brand with a passionate purpose to unlock extraordinary enjoyment. The brand’s modern, fun and innovative personality makes it an obvious choice for the guy who is going places on a mission to improve his life. Castle Lite continued to bring new experiences to consumers and held two events - Castle Lite Extra Cold Block Party in Bulawayo and a New Year’s event at Westgate Mall in Harare.
BOOSTING COMMUNITIES THROUGH LOCAL INGREDIENTS
SORGHUM FOR EAGLE LAGER. Eagle Lager connects with Zimbabwe’s rural small-scale farmers who grow sorghum, its key brewing ingredient .While empowering rural farmers on the one hand, Eagle Lager provides consumers with a quality refreshing beer with an unbeatable value for money proposition.
A SMART BARLEY PARTNERSHIP. The Company resumed barley contracting this year after skipping 2015 due to excess stocks carried over from previous seasons. A total of 10 063 tons were delivered from the 2016 scheme. The improvement in yields is attributed to better crop husbandry, stable water and power supplies.
A total of 2 300 hectares have been contracted for the 2017 season. This should deliver sufficient barley for our needs. Of concern are the very high wheat prices offered by the Command Agriculture project as this competes with barley for winter irrigation capacity.
The price distortions may potentially cause disharmony with our farmers as we focus on reduced costs and increased productivity targeting regional parity pricing.
LAGER BEER BUSINESS (CONTINUED)
7% 1,2 millionHECTOLITRES
DELTA CORPORATION LIMITED Annual Report 2017 DELTA CORPORATION LIMITED Annual Report 2017
14 15
SORGHUM VOLUME PERFORMANCE (000HL)
2013
2014
2015
2016
2017
1,000
1,500
2,000
2,500
3,000
3,500
4,000
REVIEW OF OPERATIONS (CONTINUED)
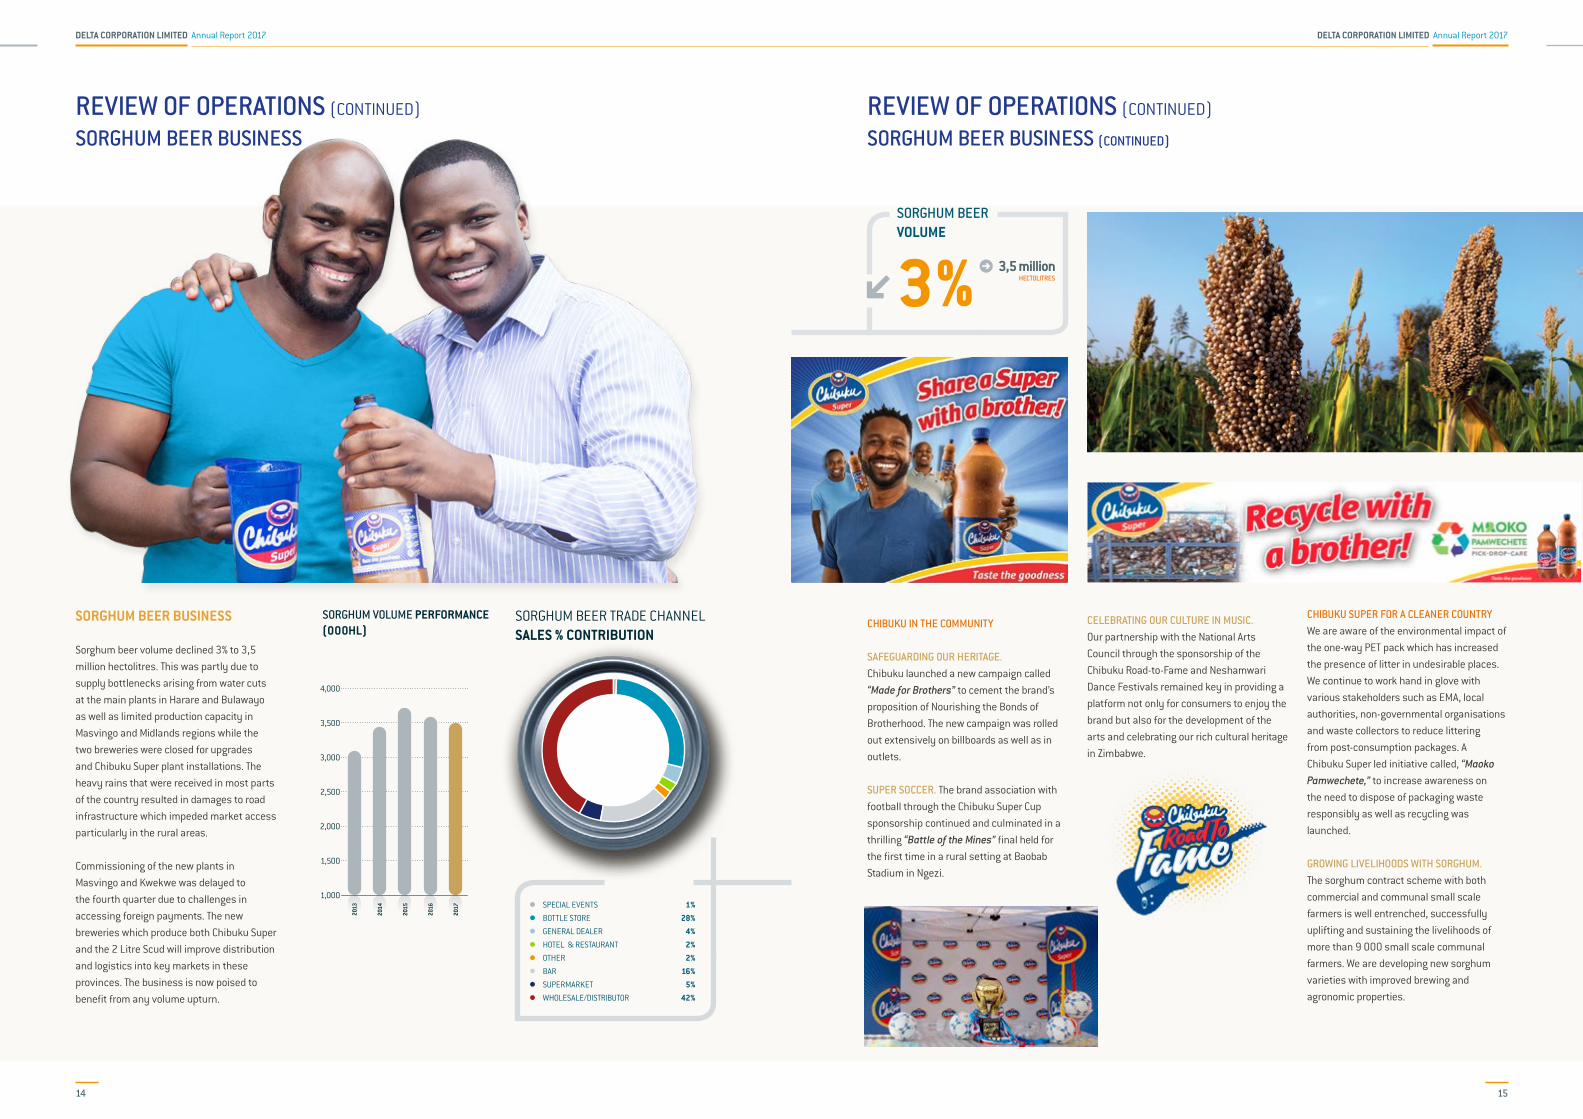
Sorghum beer volume declined 3% to 3,5 million hectolitres. This was partly due to supply bottlenecks arising from water cuts at the main plants in Harare and Bulawayo as well as limited production capacity in Masvingo and Midlands regions while the two breweries were closed for upgrades and Chibuku Super plant installations. The heavy rains that were received in most parts of the country resulted in damages to road infrastructure which impeded market access particularly in the rural areas.
Commissioning of the new plants in Masvingo and Kwekwe was delayed to the fourth quarter due to challenges in accessing foreign payments. The new breweries which produce both Chibuku Super and the 2 Litre Scud will improve distribution and logistics into key markets in these provinces. The business is now poised to benefit from any volume upturn.
SORGHUM BEER BUSINESS SORGHUM BEER TRADE CHANNEL SALES % CONTRIBUTION
� SPECIAL EVENTS 1%� BOTTLE STORE 28%� GENERAL DEALER 4%� HOTEL & RESTAURANT 2%� OTHER 2%� BAR 16%� SUPERMARKET 5%� WHOLESALE/DISTRIBUTOR 42%
SORGHUM BEER BUSINESS
SORGHUM BEERVOLUME
3% 3,5 millionHECTOLITRES
REVIEW OF OPERATIONS (CONTINUED)
CHIBUKU IN THE COMMUNITY
SAFEGUARDING OUR HERITAGE. Chibuku launched a new campaign called “Made for Brothers” to cement the brand’s proposition of Nourishing the Bonds of Brotherhood. The new campaign was rolled out extensively on billboards as well as in outlets.
SUPER SOCCER. The brand association with football through the Chibuku Super Cup sponsorship continued and culminated in a thrilling “Battle of the Mines” final held for the first time in a rural setting at Baobab Stadium in Ngezi.
CELEBRATING OUR CULTURE IN MUSIC. Our partnership with the National Arts Council through the sponsorship of the Chibuku Road-to-Fame and Neshamwari Dance Festivals remained key in providing a platform not only for consumers to enjoy the brand but also for the development of the arts and celebrating our rich cultural heritagein Zimbabwe.
CHIBUKU SUPER FOR A CLEANER COUNTRYWe are aware of the environmental impact of the one-way PET pack which has increased the presence of litter in undesirable places. We continue to work hand in glove with various stakeholders such as EMA, local authorities, non-governmental organisations and waste collectors to reduce littering from post-consumption packages. A Chibuku Super led initiative called, “Maoko Pamwechete,” to increase awareness on the need to dispose of packaging waste responsibly as well as recycling was launched.
GROWING LIVELIHOODS WITH SORGHUM. The sorghum contract scheme with both commercial and communal small scale farmers is well entrenched, successfully uplifting and sustaining the livelihoods of more than 9 000 small scale communal farmers. We are developing new sorghum varieties with improved brewing and agronomic properties.
SORGHUM BEER BUSINESS (CONTINUED)

DELTA CORPORATION LIMITED Annual Report 2017 DELTA CORPORATION LIMITED Annual Report 2017
16 17
The Sparkling Beverages volume of 1,24 million hectolitres was 11% below prior year, reflecting a very challenging trading environment. The sector has become increasingly competitive with new entrants and significant imports of Coca-Cola brands from COMESA source markets such as Zambia and Mozambique which are not subject to the protective import duties. The imports are also spurred by the currency arbitrage opportunities driven by the strong US dollar relative to the regional currencies.
The manufacturing platform was stable throughout the period other than disruptions caused by inadequate water supplies during the third quarter.
SPARKLING BEVERAGES BUSINESS
REVIEW OF OPERATIONS (CONTINUED)
SPARKLING VOLUME PERFORMANCE (000HL)
2013
2014
2015
2016
2017
0
500
1,000
1,500
2,000
SPARKLING BEVERAGES BUSINESS
SPARKLING BEVERAGE TRADE CHANNEL SALES % CONTRIBUTION
� SPECIAL EVENTS 3%� BOTTLE STORE 7%� GENERAL DEALER 12%� HOTEL & RESTAURANT 1%� OTHER 6%� BAR 3%� SUPERMARKET 18%� WHOLESALE/DISTRIBUTOR 50%
REVIEW OF OPERATIONS (CONTINUED)
The mix continues to shift in favour of more affordable bulk take home packs. The brand and market activations have sustained our portfolio at a market share in excess of 90%. Of note was the launch of the “Taste the feeling” global marketing campaign which superseded the previous “Open Happiness” campaign. The new campaign heralded in new television commercials, campaign images, music anthem, billboards and on the social media channels anchoring our market leadership.
The business extended its offering in the energy category with the launch of Monster Energy in Zimbabwe in three exciting varieties; Monster Energy, Monster Assault and Monster Khaos.
OPEN HAPPINESS IN THE COMMUNITY
PROMOTING SOCCER. The Coca-Cola brand continued to occupy its pivotal role in the development of grassroots soccer. All ten provinces participated in the COPA Coca-Cola Soccer tournament, with the finals being held in Gwanda in Matabeleland South. Rujeko High school emerged the champions while Chidyamakono took the prize for the girls. The tournament standard of play was at its finest. The brand offered the opportunity for two of the high school students to attend a training clinic in South Africa and France, a cherished experience.
ON THE BEAT WITH MUSIC. The Coca-Cola brand continued its long tradition of supporting music. Local music lovers were entertained through two Coca-Cola sponsored television programs, Coke on the Beat and Coke Studio, which also offer exciting prizes to local musicians and consumers at the annual music awards.
SUPPORTING ENTERPRISES. The business is engaged in the global Coca-Cola “5 by 20” Campaign which recognizes the role of women in national development through capacity and capability building in business. The women were equipped with entrepreneurial skills through a number of training sessions throughout the country.
We continue to empower informal traders by providing informal market equipment with some 3 000 vendors being provided with vending boxes.
SPARKLING BEVERAGES BUSINESS (CONTINUED)
SPARKLING BEVERAGES VOLUME
11% 1,24 millionHECTOLITRES

DELTA CORPORATION LIMITED Annual Report 2017 DELTA CORPORATION LIMITED Annual Report 2017
18 19
The volume performance of the alternative beverages under Shumba Maheu and SuperSip brands, recorded a 16% decline to 160 thousand hectolitres. This was partly due to increased competition from both local and imported brands and the price distortions arising from the changes in the value added tax regime.
The company continues to review the product offering with marketing initiatives focused on raising awareness of importance of the category as a meal replacement.
ALTERNATIVE BEVERAGES
REVIEW OF OPERATIONS (CONTINUED)
Successful consumer engagement activations were held at Harare Agricultural Show and the Zimbabwe International Trade Fair (ZITF). Super Sip is developing its sponsorship properties such as the Hoops for Hope Basketball Tournament held in five high-density suburbs of Harare in July 2016. The festival aimed at promoting good behavior amongst young people as well as highlight the importance of good Public Health practices.
ALTERNATVES VOLUME PERFORMANCE (000HL)
2013
2014
2015
2016
2017
0
50
100
150
200
ALTERNATIVE BEVERAGES VOLUME
160 thousandHECTOLITRES
ALTERNATIVE BEVERAGES

DELTA CORPORATION LIMITED Annual Report 2017 DELTA CORPORATION LIMITED Annual Report 2017
20 21
PROMOTING BEST PRACTICEOur procurement team interacts with local, regional and global suppliers to source the goods and services our business needs to produce and sell our beer and soft drinks. Our Supplier Partnering Program aims to collaborate with each suppler to ensure that they at least meet minimum requirements of the United Nations Framework and Guiding Principles on Business and Human Rights and the Company’s code of business ethics. The guiding principles relate to work place safety, avoiding child labour, basic labour standards and human rights and good manufacturing practice. Suppliers must act ethically and with integrity at all times and comply with local, national and international laws and regulations. They should avoid situations where a conflict of interest may occur, and must immediately disclose to Delta any conflicts of interest that arise.
REVIEW OF OPERATIONS (CONTINUED)
LEVERAGING OUR SUPPLY CHAIN AND LOGISTICSREVIEW OF OPERATIONS (CONTINUED)
PROMOTING LOCAL SOURCINGOver 70% of the Company’s inputs and services are sourced from the local market. The traditional contract farming arrangements for sorghum, barley and maize ensure sustainable sourcing of these key brewing materials whilst providing livelihoods to the Zimbabwean communities. The supplier partnering program aims to achieve gains in quality, cost and service levels through reduction in waste and poor materials performance.
IMPROVING THE EFFICIENCY OF OUR DISTRIBUTION LOGISTICS The Company operates an internal fleet comprising over 200 prime mover vehicles and in excess of 400 trailers, primarily for secondary distribution, which allows the Company to deliver its products directly to retail and wholesale customers.
There are ongoing initiatives to build internal capacity for primary freighting from the production centres to benefit from enhanced efficiencies. Our fleet travelled a combined 14,2 million kilometres this financial year.
There are current initiatives to deploy technology in the routing of deliveries, load pickings in the warehouses and vehicle and driver monitoring in order to improve vehicle productivity and distribution efficiency. There are however some challenges relating to poor road conditions, road congestion in urban centres and generally poor driving conditions in the country. Vehicle turnaround is also impacted by the high prevalence of police and VID roadblocks.
With over two hundred delivery vehicles plying our roads each day, it is a safety imperative for the Company to uprate driver skills. The division continues to invest in driver training and safety awareness. We work collaboratively with the Traffic Safety Council in the furtherance of programmes to reduce drinking and driving while promoting defensive driving. Our drivers continue to participate in the annual driving competitions within the Company and against other fleet operators.
LEVERAGING OUR SUPPLY CHAIN AND LOGISTICS (CONTINUED)

DELTA CORPORATION LIMITED Annual Report 2017 DELTA CORPORATION LIMITED Annual Report 2017
22 23
Schweppes Zimbabwe Limited is a manufacturer and distributor of noncarbonated, still beverages under licence from The Coca-Cola Company. The product portfolio currently includes cordials, fruit juices, bottled water and iced tea.
Volume performance for the twelve months to March 2017 was 6% below prior year on an undiluted basis. This reflects the challenging macroeconomic factors that are impacting the entire beverage sector. There was a notable recovery of market share in the very competitive bottled watercategory, benefiting from the launch of Bonaqua in late 2015.
SCHWEPPES ZIMBABWE LIMITED
REVIEW OF OPERATIONS: ASSOCIATES
The financial performance has been weighed down by the limited throughput at Beitbridge Juicing Company and the set up costs at Best Fruit Processors.
The after tax share of profits from this associate entity amounted to US$0,5 million for the year to March 2017 (2016: US$2,2million). The business remains in reasonable financial health.
African Distillers Limited is a public quoted company whose core business is the manufacture, distribution and marketing of branded wines, spirits, liqueurs and ciders for the Zimbabwean market.
The associate registered a commendable growth on both revenue and volume for the six months to December 2016. This was driven by the higher offtake of ready to drink products following the localisation of the bottling of ciders and reduced imports. Revenue rose 10% whilst volume was up 25% spurred by price moderation. Operating income was up 17% to US$2,5 million for the six months to December 2016.
AFRICAN DISTILLERS LIMITED
REVIEW OF OPERATIONS: ASSOCIATES (CONTINUED)
OPERATINGINCOME
17% MILLIONUS$2,5
DELTA CORPORATION LIMITED Annual Report 2017 DELTA CORPORATION LIMITED Annual Report 2017
24 25
REVIEW OF OPERATIONS: ASSOCIATES (CONTINUED)
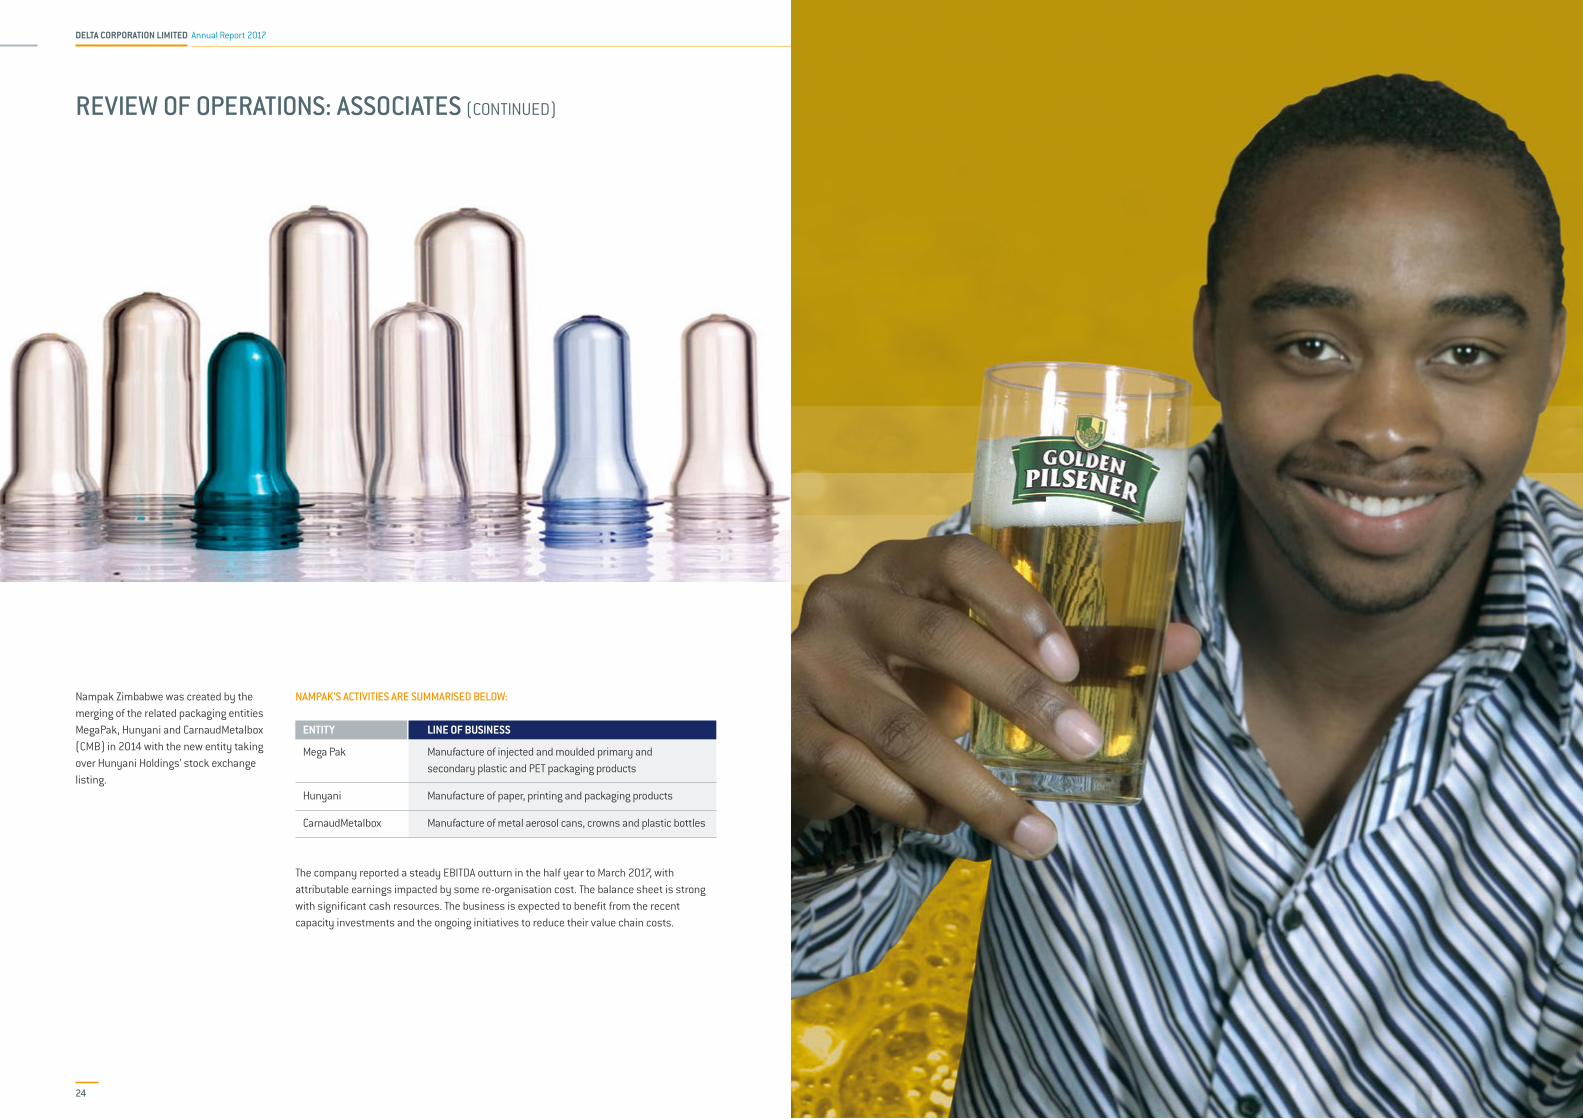
Nampak Zimbabwe was created by the merging of the related packaging entities MegaPak, Hunyani and CarnaudMetalbox (CMB) in 2014 with the new entity taking over Hunyani Holdings’ stock exchange listing.
The company reported a steady EBITDA outturn in the half year to March 2017, with attributable earnings impacted by some re-organisation cost. The balance sheet is strong with significant cash resources. The business is expected to benefit from the recent capacity investments and the ongoing initiatives to reduce their value chain costs.
NAMPAK’S ACTIVITIES ARE SUMMARISED BELOW:
ENTITY LINE OF BUSINESS
Mega Pak Manufacture of injected and moulded primary and secondary plastic and PET packaging products
Hunyani Manufacture of paper, printing and packaging products
CarnaudMetalbox Manufacture of metal aerosol cans, crowns and plastic bottles
NAMPAK ZIMBABWE

DELTA CORPORATION LIMITED Annual Report 2017 DELTA CORPORATION LIMITED Annual Report 2017
26 27
REPORT OF THE DIRECTORS
PROPERTY, PLANT AND EQUIPMENTCapital expenditure (inclusive of returnable containers) for the
year to 31 March 2017 totalled US $41,0 million. The capital
expenditure for the year to 31 March 2018 is planned at US$37
million.
INVESTMENTSThe Company’s effective shareholding in AFDIS Holdings Limited is
38,14%, Schweppes Holdings Africa Limited at 49% and 21,46% in
Nampak Zimbabwe Limited.
SHARE CAPITALThe authorised share capital of the Company remains at US$14,0
million comprising 1 400 000 000 ordinary shares of US$0,01
(one US cent) each. A total of 1 198 125 shares allotted in
accordance with the share option schemes, whilst 2 161 151
ordinary shares were cancelled from those held under treasury
stock. The ordinary shares in issue are 1 243 451 049. The
Company held a total of 21 218 614 of its own shares as treasury
stock.
TO THE SHAREHOLDERS OF DELTA CORPORATION LIMITED
The Directors present their 70th Annual Report together with the Audited Financial Statements of the Group for the year ended 31 March 2017.
YEAR’S RESULTS The year’s results are presented in United States Dollars, which is the
functional currency applicable to the Group.
US$000
Earnings attributable to Shareholders 69 885Transfer from share option reserve 239 70 124
Less Dividends First interim $0.02 per share paid December 2016 24 482 Second interim $0.01 per share paid March 2017 12 254 Final $0.0245 per share payable May 2017 29 891 Share Buy Back 5 285
AddDistributable Reserves at the beginning of the year 395 909Distributable Reserves at the end of the year
(net of proposed dividends) 394 121
REPORT OF THE DIRECTORS (CONTINUED)
Accordingly, the issued share capital is now US$44,2 million
comprising nominal capital of US$12,2 million and share premium
of US$32,0 million. The number of shares currently under option is
40 361 300 of which 17 230 000 are under the Share Appreciation
Rights Scheme.
The Company now maintains both a materialised certificate
register and an electronic de-materialised one maintained by
Chengetedzai Security Depository. Shareholders can opt to
maintain their shares either in paper certificates or in electronic/
dematerialised form through a nominated Custodian.
DIVIDENDSThe Board declared interim dividends of US3,0 cents per share and
a final dividend of US2,45 cents per share. This brings the total
dividend in respect of the year ended 31 March 2017 to US5,45
cents per share.
RESERVESThe movements in the Reserves of the Group and the Company are
shown in the Consolidated Statement of Comprehensive Income,
Group and Company Statements of Changes in Equity and in the
Notes to the Financial Statements.
PURCHASE OF OWN SHARESAt the last annual general meeting, authority was granted for the
company to purchase its own shares up to a maximum of 10% of
the number of shares in issue as at 31 July 2016. The authority is
due to expire at the conclusion of the next annual general meeting
in July 2017. The notice of the annual general meeting proposes
that shareholders approve a resolution renewing the authority for
the share buyback.
The authority was utilised to purchase a total of 9 902 787 shares
which are held as treasury stock. The number of the treasury
shares held as at 31 March 2017 was 21 218 614.
GOING CONCERNThe Directors have reviewed the Group’s performance for the year
and the principal risks its faces, together with the budget and cash
flow forecasts for the next twelve months, and the application of
reasonable sensitivities associated with such forecasts. Based on
this review, and in light of the current financial position and the
existing committed borrowing facilities, the directors are satisfied
that the Group has adequate resources to continue in operational
existence and therefore have continued to adopt the going concern
basis in preparing the consolidated financial statements.
DIRECTORSThe names and summarised resumes for the Directors are set out
on page 93. All the current Directors served throughout the period
except for Mr R T Almeida Cabral de Soares (Ricardo Tadeu) who
was appointed as non-executive director on 4 November 2016. He
replaced Mr M J Bowman who resigned on the same date.
Mr R Tadeu will retire at the end of his interim appointment and
offer himself for re-election. Prof H C Sadza and Messrs C F Dube, S
J Hammond, L E M Ngwerume and T N Sibanda are due to retire by
rotation. All being eligible, they will offer themselves for re-election.
No Director had, during or at the end of the year, any material
interest in any contract of significance in relation to the Group’s
businesses. Mr C F Dube is a senior partner at Dube, Manikai and
Hwacha Legal Practitioners, a firm that provides legal services to
the Group. The beneficial interests of the directors in the shares of
the Company are shown in note 18 of the financial statements.
AUDITORSMembers will be asked to reappoint Deloitte & Touche as Auditors
for the Company for the ensuing year.
ANNUAL GENERAL MEETINGThe 70th Annual General Meeting of the Company will be held at
12:30 hours on Friday 28 July 2017 at the Registered Office of the
Company at Sable House, Borrowdale, Harare.
BY ORDER OF THE BOARD
C F DUBE Chairman
P GOWERO Chief Executive
A MAKAMURECompany Secretary
5 May 2017
TO THE SHAREHOLDERS OF DELTA CORPORATION LIMITED

DELTA CORPORATION LIMITED Annual Report 2017 DELTA CORPORATION LIMITED Annual Report 2017
28 29
INTRODUCTIONThe corporate governance practices of Delta Corporation Limited
are based on the code of business conduct which sets out the
ethical standards to which all employees are expected to adhere.
The code incorporates and covers the Company’s operating,
financial and behavioural policies and endeavours to foster
responsible business conduct by all employees particularly as this
relates to compliance with all laws, disclosure of any conflicts of
interests, confidentiality of information, to act at all times in the
best interests of the Company and to conduct all their dealings
in an honest and ethical manner. The ethics code defines the
employees’ responsibilities and expected behaviour and covers the
limits on acceptance of gifts from suppliers or stakeholders, the
appropriate use of the Company’s property and the anti-corruption
policy. There are detailed policies and procedures in place across
the Group covering the regulation and reporting of transactions in
securities of Group companies by directors and officers. The Code
is applicable to the Company and its subsidiaries.
STAKEHOLDERS Delta strives to strike a balance between generating great
business results and managing its environmental and social
responsibilities through the various sustainable development
initiatives as detailed in a separate report. This outlines the
programs in the areas of responsible drinking, safety and
wellness, the environment and the communities.
The corporate governance framework accords with the recently
introduced Zimbabwe Code on Corporate Governance, and borrows
from the Cadbury and King reports, the national codes or listing
regulations applicable in the countries of primary listing of the
Company’s major shareholders such as those of United Kingdom,
Belgium and the United States. Delta has in place throughout the
Company, responsive systems of governance and practice which
the Board and management regard as entirely appropriate and in
accordance with the said codes.
Delta applies various participative practices in its relationships
with non-management employees, primarily in respect of operating
matters and plans, on the basis of mutual information sharing.
THE BOARD OF DIRECTORSThe Board of Directors of Delta is constituted with an equitable
ratio of executive to non-executive and independent directors
noting that some Directors represent certain shareholders. The
composition and structure of the Board is reviewed periodically to
align with best practice, respective skills, experience, background,
age and gender. The Board is chaired by a non-executive director
and meets at least quarterly. The Board governs through clearly
mandated board committees, which have specific written terms of
reference. Committee chairmen report orally on the proceedings of
their committees at the next meeting of the Board.
The Directors rotate and are re-appointed at least once every
three years, and are expected to retire at 70 years of age. Any
director that has served for more than three terms (nine years)
or is beyond 70 years of age is rotated and re-appointed annually
thereafter. There are transitional arrangements to meet any
departures from the governance codes.
Short biographies of each of the Directors are on pages 93.
DIRECTORS’ INTERESTSEach year Directors of the Company are required to submit in
writing whether they have any material interest in any contract
of significance with the Company or any of its subsidiaries which
could have given rise to a related conflict of interest. No such
conflicts were reported this year.
THE AUDIT COMMITTEEThe Audit Committee of the Board deals, inter alia, with compliance,
internal control and risk management. It is regulated by specific
terms of reference, is chaired by an independent non-executive
director and is comprised of non-executive directors and
incorporates the Chief Executive Officer who is a non-voting
member. The Finance Director attends and presents reports to the
Committee. The Audit Committee meets at least twice a year to
discuss accounting, auditing, internal control, financial reporting
and risk management matters. The Committee also reviews
compliance with ZSE listing requirements. The external and internal
auditors meet regularly with and have unrestricted access to the
Audit Committee.
CORPORATE GOVERNANCE
THE REMUNERATION COMMITTEEDelta’s Remuneration Committee is constituted and chaired by non-
executive board members, save for the membership of the Chief
Executive Officer. It acts in accordance with the Board’s written
terms of reference and is responsible for the assessment and
approval of the Group’s remuneration strategy and to review the
short-term and long-term remuneration of executive directors and
senior executives. It also acts as the general purpose committee
(in which case it co-opts additional members) to deal with ad-hoc
strategic issues. The Committee meets at least twice a year.
THE NOMINATION COMMITTEEThe Nomination Committee is the committee of the Board whose
main focus is to consider the composition of the Board and its
committees, the retirement, appointment and replacement of
directors, and makes appropriate recommendations to the Board.
It comprises the Chairman and at least two non-executive
directors.
RISK MANAGEMENTThe focus of risk management in Delta is on identifying, assessing,
managing and monitoring of all known forms of risk across the
Company. An appropriate risk analysis framework is used to
identify the major risks which the Company must manage in
serving its stakeholders.
The environment in which the Company operates is subject to such
levels of change that regular reassessment of risk is necessary to
protect the Company. In view of this, each part of the business has
developed detailed contingency action plans to minimise the lead-
time necessary to adapt to changes in circumstances. These plans
are then updated whenever a change is noted or anticipated.
The management of risk and loss control is decentralised, but
in compliance with Company policies on risk, the process is
reviewed centrally on a quarterly basis and is supervised by the
Audit Committee.
CORPORATE GOVERNANCE (CONTINUED)
DIRECTORS’ ATTENDANCE OF MEETINGS(From 1 April 2016 to 31 March 2017)
NAME OF DIRECTOR MAIN BOARD/AGM AUDIT COMMITTEE REMUNERATION COMMITTEE
Attended Possible Attended Possible Attended Possible
Mr P Gowero 6 6 2 2 3 3
Mr M J Bowman 2* 4 — — — —
Mr C F Dube 6 6 2 2 3 3
Mr S J Hammond 5 6 — — 2 3
Mr R T Almeida Cabral de Soares 1* 3 — — — —
Dr C C Jinya 6 6 — — — —
Mr J A Kirby 4* 6 2 2 3 3
Mr T Moyo 6 6 — — — —
Mr LEM Ngwerume 6 6 — — — —
Prof H C Sadza 5 6 — — — —
Mr T N Sibanda 6 6 2 2 — —
Mr M M Valela 6 6 — — — —
*Represented by an alternate director at meetings

DELTA CORPORATION LIMITED Annual Report 2017 DELTA CORPORATION LIMITED Annual Report 2017
30 31
DIRECTORS’ RESPONSIBILITY FOR FINANCIAL REPORTING
Delta Corporation Limited’s (“Delta” or “the Company”) Directors
are required by the Companies Act (Chapter 24:03) to maintain
adequate accounting records and to prepare financial statements
for each financial year which present a true and fair view of the
state of affairs of the Company and the Group at the end of the
financial year and of the profit and cash flows for the period. In
preparing the accompanying financial statements, generally
accepted accounting practices have been followed, suitable
accounting policies have been used, and applied consistently, and
reasonable and prudent judgements and estimates have been
made. The financial statements incorporate full and responsible
disclosure in line with the International Financial Reporting
Standards and best practice.
The Directors have reviewed the Group’s budget and cash flow
forecast for the year to 31 March 2018. On the basis of this review,
and in the light of the current financial position and existing
borrowing facilities, the Directors are satisfied that Delta is a going
concern and have continued to adopt the going concern basis in
preparing the financial statements.
The Company’s external auditors, Deloitte & Touche, have audited
the financial statements and their report appears on pages 32 to 36.
The Board recognises and acknowledges its responsibility
for the system of internal financial control. Delta’s policy on
business conduct, which covers ethical behaviour, compliance
with legislation and sound accounting practice, underpins the
Company’s internal financial control process. The internal control
system includes written accounting and control policies and
procedures, clearly defined lines of accountability and delegation
of authority, and comprehensive financial reporting and analysis
against approved budgets. The responsibility for operating the
system is delegated to the executive directors who confirm that
they have reviewed its effectiveness.
They consider that it is appropriately designed to provide
reasonable, but not absolute, assurance that assets are
safeguarded against material loss or unauthorised use and
that transactions are properly authorised and recorded. The
effectiveness of the internal financial control system is monitored
through management reviews, representation letters on
compliance signed by the senior executive responsible for each
major entity and a comprehensive program of internal audits. In
addition, the Company’s external auditors review and test aspects
of the internal financial control systems during the course of
their statutory examinations of the Company and the underlying
subsidiaries.
The Company’s Audit Committee has met with the external
auditors to discuss their report on the results of their work which
include assessments of the relative strengths and weaknesses
of key control areas. While in a group of the size, complexity and
diversity of Delta, it is to be expected that occasional breakdowns
in established control procedures may occur, no breakdowns
involving material loss have been reported to the Directors in
respect of the year under review.
PREPARER OF FINANCIAL STATEMENTSThese annual financial statements have been prepared under
the supervision of M M Valela, a qualified Chartered Accountant
(Zimbabwe) and have been audited in terms of section 29(1) of
the Companies Act (Chapter 24:03).
The financial statements for the year ended 31 March 2017, which
appear on pages 37 to 78 were approved by the Board of Directors
on 5 May 2017 and are signed on its behalf by:
C F DUBE CHAIRMAN
P GOWEROCHIEF EXECUTIVE OFFICER
FOR THE YEAR ENDED 31 MARCH 2017
ANNUAL FINANCIAL STATEMENTS
32 Independent Auditor’s Report
37 Consolidated Statement of Profit or Loss
and Other Comprehensive Income
38 Consolidated Statement of Financial Position
39 Consolidated Statement of Cash Flow
40 Consolidated Statement of Changes in Equity
41 Notes to the Financial Statements
75 Company Statement of Profit or Loss and
Other Comprehensive Income
76 Company Statement of Financial Position
77 Company Statement of Changes in Equity
78 Company Statement of Cash Flow
79 Group Statistics

DELTA CORPORATION LIMITED Annual Report 2017 DELTA CORPORATION LIMITED Annual Report 2017
32 33
INDEPENDENT AUDITOR’S REPORT
OPINIONWe have audited the consolidated and company financial
statements of Delta Corporation Limited and its subsidiaries
(the “Group”) set out on pages 37 to 78, which comprise the
consolidated and company statements of financial position as at
31 March 2017 and the consolidated and company statements of
profit or loss and other comprehensive income, the consolidated
and company statements of changes in equity and the
consolidated and company statements of cash flows for the year
then ended, and the notes to the financial statements, including a
summary of significant accounting policies.
In our opinion the consolidated and company financial statements
present fairly, in all material respects, the consolidated and
company financial position of Delta Corporation Limited as at
31 March 2017, and its consolidated and company financial
performance and its consolidated and company cash flows for
the year then ended in accordance with International Financial
Reporting Standards (IFRSs) and in the manner required by the
Companies Act (Chapter 24:03).
BASIS FOR OPINIONWe conducted our audit in accordance with International Standards
on Auditing (ISAs). Our responsibilities under those standards are
further described in the Auditor’s Responsibilities for the Audit of
the Financial Statements section of our report. We are independent
of the Company in accordance with the Public Accountants and
Auditors Board (PAAB) Code of Professional Conduct, which is
consistent with the International Ethics Standards Board for
Accountants Code of Ethics for Professional Accountants (Part A
and B), together with other ethical requirements that are relevant
to our audit of the financial statements in Zimbabwe, and we have
fulfilled our other ethical responsibilities in accordance with these
requirements. We believe that the audit evidence we have obtained
is sufficient and appropriate to provide a basis for our opinion.
KEY AUDIT MATTERSKey audit matters are those matters that, in our professional
judgment, were of most significance in our audit of the
consolidated financial statements of the current period. These
matters were addressed in the context of our audit of the
consolidated financial statements as a whole, and in forming our
opinion thereon, and we do not provide a separate opinion on these
matters.
TO THE SHAREHOLDERS OF DELTA CORPORATION LIMITED
INDEPENDENT AUDITOR’S REPORT (CONTINUED)
The macroeconomic environment is characterised by liquidity
constraints and increasing credit risks resulting in the
recoverability of receivables becoming doubtful.
The Group trades with entities with varying turnovers and
distribution footprints and the awarding of credit and accepting
of security is based on the respective circumstances of the
counterparty.
Significant judgements are applied by the Directors in establishing
an adequate impairment provision against receivables. The
provision is determined by taking into account the financial
position of the customer, any security tendered and the customer’s
payment history, particularly past default performance.
The allowance for credit losses amounted to US$7.4 million for the
year (refer to note 16).
The valuation of receivables has been considered a key audit
matter as it is subject to significant estimation and subjective
judgements.
In evaluating the valuation of receivables, our substantive
procedures included the following:
• Assessing the reasonableness of the methods and
assumptions used by the management to estimate the
allowance for credit losses;
• Obtaining the receivables age analysis and testing it for
completeness and accuracy as a basis for substantive audit
testing;
• Circularisation of a sample of customers on the receivables
age analysis to verify their existence;
• Obtaining subsequent receipts of the sampled receivables
so as to assess the recoverability of the balances;
• Assessing the fairness of valuation of security tendered for
balances receivable;
• Reviewing the terms of sale for receivables to assess the
Group’s risk of overtrading with customers against pre-set
credit terms;
• Obtaining correspondence from the Group’s legal
representatives and identifying customers with whom the
Group has legal action against in respect of outstanding
balances and tracing these counterparties to the listing of
allowances for credit losses.
We noted that the continued deterioration of economic
fundamentals has impacted the quality of the Group’s receivables
resulting in an increase in the allowance for credit losses. The
persistent liquidity challenges may impact this estimate and
result in future charges to profit or loss.
HOW OUR AUDIT ADDRESSED THE KEY AUDIT MATTERKEY AUDIT MATTER
VALUATION AND RECOVERABILITY OF RECEIVABLESREFER TO POLICY NOTE 4.11 AND 4.20 OF THE FINANCIAL STATEMENTS FOR THE GROUP’S POLICY ON DETERMINING THIS
ALLOWANCE FOR CREDIT LOSSES
TO THE SHAREHOLDERS OF DELTA CORPORATION LIMITED

DELTA CORPORATION LIMITED Annual Report 2017 DELTA CORPORATION LIMITED Annual Report 2017
34 35
Due to the nature of the Group’s operations, returnable beverage
containers are issued to customers on sale of products. These
remain the property of the Group.
A deposit is received from customers that is repayable on return of
the containers to the Group.
Annually, the Directors determine an estimate of containers in the
market against which the Group has a liability (the deposit) due
to the customer. The Group has recognised a liability of US$14.4
million at the year-end (2016: US$ 16.8 million). Refer to note 20.2.
The valuation of containers in the market is a key audit matter as
it requires significant management judgement in determining the
estimate.
The Group changed its financial reporting system during the year
under review and moved from Syspro to SAP.
System conversions are inherently susceptible to risks of
incomplete data transfer from the previous to the new systems as
well as divergence between expected and actual outcomes when
the new system becomes the primary live environment.
The system change-over was therefore considered to be a key
audit matter based on the above factors.
We performed various procedures, including the following:
• Obtaining the assumptions used in estimating the value
of containers in the market and comparing the assumptions
against prior year assumptions and global industry practice;
• Assessing whether assumptions applied in current year are
appropriate and reasonable based on market conditions e.g.
production output, container usage/turnover etc;
• Recalculating the value of estimated containers in the
market.
We found management’s assumptions in determining the
containers in the market provision to be reasonable. The
accounting treatment of this provision is consistent with
industry practice.
Our procedures included but were not limited to the following:
• Engaging IT audit specialists to obtain an understanding of
the system change-over controls implemented and
evaluating the adequacy of such controls in ensuring a
smooth transition;
• Obtaining an understanding of the challenges encountered
and how they were resolved during the systems conversion
in order to develop responses that were appropriate for
identified risks of material misstatement;
• Engaging data analytics to perform procedures to test the
accuracy and completeness of balances transferred between
the legacy and new financial reporting systems;
• Obtaining an understanding of the general and application
controls that are embedded in the new financial reporting
system, including evaluation of the adequacy of and testing
of the operating effectiveness of selected controls.
Whilst some areas of improvement were identified which have
or are being adopted, the change-over of the financial reporting
system did not adversely impact the accuracy and completeness
of the reported financial balances.
HOW OUR AUDIT ADDRESSED THE KEY AUDIT MATTERKEY AUDIT MATTER
VALUATION OF CONTAINERS IN THE MARKET (MARKET ABSORPTION)REFER TO POLICY NOTE 4.9 AND 4.20 OF THE FINANCIAL STATEMENTS FOR THE GROUP’S POLICY ON DETERMINING THIS ESTIMATE
CHANGE-OVER OF THE FINANCIAL REPORTING IT SYSTEM
INDEPENDENT AUDITOR’S REPORT (CONTINUED)
TO THE SHAREHOLDERS OF DELTA CORPORATION LIMITED
OTHER INFORMATIONThe Directors are responsible for the other information. The other
information comprises the Chairman’s Statement, Review of
operations, Report on principal risks and uncertainties, Report
of the Directors, Corporate Governance Report, the Sustainable
Development Report and the report on Directors’ Responsibility
for Financial Reporting, which we obtained prior to the date of
the auditor’s report. The other information does not include the
financial statements and our auditor’s report thereon.
Our opinion on the consolidated and company financial statements
does not cover the other information and we do not express any
form of assurance or conclusion thereon.
In connection with our audit of the consolidated and company
financial statements, our responsibility is to read the other
information and, in doing so, consider whether the other
information is materially inconsistent with the financial
statements or our knowledge obtained in the audit, or otherwise
appears to be materially misstated.
If, based on the work we have performed on the other information
that we obtained prior to the date of this auditor’s report, we
conclude that there is a material misstatement of this other
information, we are required to report that fact. We have nothing to
report in this regard.
RESPONSIBILITIES OF THE DIRECTORS FOR THE FINANCIAL STATEMENTSThe Directors are responsible for the preparation and fair
presentation of the financial statements in accordance with
International Financial Reporting Standards and in the manner
required by the Companies Act (Chapter 24:03), and Statutory
Instruments (SI 33/99 and SI 62/96), and for such internal control
as the Directors determine is necessary to enable the preparation
of financial statements that are free from material misstatement,
whether due to fraud or error.
In preparing the financial statements, the Directors are responsible
for assessing the Group’s ability to continue as a going concern,
disclosing, as applicable, matters related to going concern and
using the going concern basis of accounting unless the Directors
either intend to liquidate the Group or to cease operations, or have
no realistic alternative but to do so.
AUDITOR’S RESPONSIBILITIES FOR THE AUDIT OF THE FINANCIAL STATEMENTSOur objectives are to obtain reasonable assurance about whether
the financial statements as a whole are free from material
misstatement, whether due to fraud or error, and to issue an
auditor’s report that includes our opinion. Reasonable assurance
is a high level of assurance, but is not a guarantee that an audit
conducted in accordance with ISAs will always detect a material
misstatement when it exists. Misstatements can arise from
fraud or error and are considered material if, individually or in the
aggregate, they could reasonably be expected to influence the
economic decisions of users taken on the basis of these financial
statements.
As part of an audit in accordance with ISAs, we exercise
professional judgement and maintain professional scepticism
throughout the audit. We also:
• Identify and assess the risks of material misstatement of the
financial statements, whether due to fraud or error, design and
perform audit procedures responsive to those risks and obtain
audit evidence that is sufficient and appropriate to provide
a basis for our opinion. The risk of not detecting a material
misstatement resulting from fraud is higher than for one
resulting from error, as fraud may involve collusion, forgery,
intentional omissions, misrepresentations, or the override of
internal control.
• Obtain an understanding of internal control relevant to the
audit in order to design audit procedures that are appropriate
in the circumstances, but not for the purpose of expressing an
opinion on the effectiveness of the Group’s internal control.
• Evaluate the appropriateness of accounting policies used
and the reasonableness of accounting estimates and related
disclosures made by management.
• Conclude on the appropriateness of the Directors’ use of
the going concern basis of accounting and based on the audit
evidence obtained, whether a material uncertainty exists
related to events or conditions that may cast significant doubt
on the Group’s ability to continue as a going concern. If we
conclude that a material uncertainty exists, we are required to
draw attention in our auditor’s report to the related disclosures
in the financial statements or, if such disclosures are
inadequate, to modify our opinion. Our conclusions are based
on the audit evidence obtained up to the date of our auditor’s
report. However, future events or conditions may cause the
Group to cease to continue as a going concern.
INDEPENDENT AUDITOR’S REPORT (CONTINUED)
TO THE SHAREHOLDERS OF DELTA CORPORATION LIMITED

DELTA CORPORATION LIMITED Annual Report 2017 DELTA CORPORATION LIMITED Annual Report 2017
36 37
AUDITOR’S RESPONSIBILITIES FOR THE AUDIT OF THE FINANCIAL STATEMENTS (CONTINUED)
• Evaluate the overall presentation, structure and content of the
financial statements, including the disclosures, and whether
the financial statements represent the underlying transactions
and events in a manner that achieves fair presentation.
• Obtain sufficient appropriate audit evidence regarding the
financial information of the entities and business activities
within the Group to express an opinion on the financial
statements. We are responsible for the direction, supervision
and performance of the audit. We remain solely responsible for
our audit opinion.
We communicate with the Directors regarding, among other
matters, the planned scope and timing of the audit and significant
audit findings, including any significant deficiencies in internal
control that we identify during our audit.
We also provide the Directors with a statement that we
have complied with relevant ethical requirements regarding
independence, and to communicate with them all relationships
and other matters that may reasonably be thought to bear on our
independence, and where applicable, related safeguards.
From the matters communicated with the Directors, we determine
those matters that were of most significance in the audit of the
financial statements of the current period and are therefore the
key audit matters. We describe these matters in our auditors’
report unless law or regulation precludes public disclosure
about the matter or when, in extremely rare circumstances, we
determine that a matter should not be communicated in our report
because the adverse consequences of doing so would reasonably
be expected to outweigh the public interest benefits of such
communication.
REPORT ON OTHER LEGAL AND REGULATORY REQUIREMENTSIn our opinion, the financial statements have been prepared in
accordance with the disclosure requirements of the Companies
Act (Chapter 24:03) and the relevant statutory instruments (SI),
SI33/99 and SI 62/96.
Deloitte & TouchePer: Brian Mabiza
Partner
Registered Auditor
PAAB Registration Number 0419
5 May 2017
INDEPENDENT AUDITOR’S REPORT (CONTINUED)
TO THE SHAREHOLDERS OF DELTA CORPORATION LIMITED
FOR THE YEAR ENDED 31 MARCH
CONSOLIDATED STATEMENT OF PROFIT OR LOSS AND OTHER COMPREHENSIVE INCOME
2017 2016
Notes US$’000 US$’000
REVENUE 8 482 968 538 198
NET OPERATING COSTS 9.1 (400 924 ) (442 126 )
OPERATING INCOME 82 044 96 072
Finance cost (6 918 ) (5 726 )
Finance income 11 457 11 621
Share of profit of associates 13 1 834 3 944
Profit before taxation 88 417 105 911
Taxation 11.1 (18 532 ) (25 822 )
PROFIT FOR THE YEAR 69 885 80 089
Other comprehensive income for the year — —
TOTAL COMPREHENSIVE INCOME FOR THE YEAR 69 885 80 089
Weighted average shares in issue (millions) 1 225,7 1 234,2
EARNINGS PER SHARE (US CENTS)
Attributable earnings basis 5.5 5,70 6,49
Fully diluted earnings basis 5.5 5,69 6,48

DELTA CORPORATION LIMITED Annual Report 2017 DELTA CORPORATION LIMITED Annual Report 2017
38 39
AT 31 MARCH
CONSOLIDATED STATEMENT OF FINANCIAL POSITION
2017 2016 Notes US$’000 US$’000
ASSETSNon-current Assets Property, plant and equipment 12 354 947 345 332
Investments in associates 13 43 587 42 122
Trademarks 14.3 2 914 2 914
Investments and loans 14.2 9 623 9 740
411 071 400 108
Current Assets Inventories 15 77 753 86 431
Trade and other receivables 16 34 942 41 739
Other assets 1 391 1 944
Current tax asset 21.3 5 598 —
Cash and cash equivalents 21.8 173 334 166 016
293 018 296 130
Total Assets 704 089 696 238
EQUITY AND LIABILITIESCapital and Reserves
Share capital 17.2 12 222 12 310
Share premium 32 044 33 074
Share options reserve 7 389 5 985
Retained earnings 452 207 436 530
Total shareholders’ equity 503 862 487 899
Non-current Liabilities
Long-term borrowings 19.1 — 65 000
Deferred tax liabilities 11.3 50 022 48 833
50 022 113 833
Current Liabilities
Short-term borrowings 19.2 60 000 —
Trade and other payables 20.1 68 404 65 272
Provisions 20.2 19 932 21 171
Current tax liability 21.3 1 869 8 063
150 205 94 506
Total Equity and Liabilities 704 089 696 238
Net asset value per share (US Cents) 41,11 39,53
The financial statements were approved by the Board of Directors and authorised for issue on 5 May 2017.
P GOWERO M M VALELACHIEF EXECUTIVE OFFICER EXECUTIVE DIRECTOR - FINANCE
FOR THE YEAR ENDED 31 MARCH
CONSOLIDATED STATEMENT OF CASH FLOWS
2017 2016
Notes US$’000 US$’000
Cash flow from operating activities
Cash generated from operating activities 21.1 115 019 137 699
Decrease in working capital 21.2 17 920 12 876
Cash generated from operations 132 939 150 575
Finance cost (6 918 ) (5 726 )
Finance income 11 457 11 621
Income taxation paid 21.3 (29 135 ) (19 007 )
Net cash generated from operating activities 108 343 137 463
Cash flow from investing activities
Decrease / (increase) in loans and investments 117 (659 )
Dividend received from associates 369 668
Purchase of shares in associate — (5 372 )
Purchase of property, plant and equipment to expand operations (34 002 ) (27 407 )
Purchase of property, plant and equipment to maintain operations (7 032 ) (16 864 )
Proceeds from disposal of property, plant and equipment 88 208
Net cash utilised in investing activities (40 460 ) (49 426 )
Cash flow from financing activities
Payment of dividends 21.4 (49 162 ) (45 736 )
Repayment of long-term borrowings 21.5 (5 000 ) (5 000 )
Increase in shareholder funding 21.7 795 1 205
Share buy back 17.5 (7 198 ) (6 101 )
Net cash utilised in financing activities (60 565 ) (55 632 )
Net increase in cash and cash equivalents 7 318 32 405
Cash and cash equivalents at beginning of the year 166 016 133 611
Cash and cash equivalents at end of the year 21.8 173 334 166 016
Cash flow per share (US cents) 5.6 10,85 12,20
DELTA CORPORATION LIMITED Annual Report 2017 DELTA CORPORATION LIMITED Annual Report 2017
40 41
FOR THE YEAR ENDED 31 MARCH
CONSOLIDATED STATEMENT OF CHANGES IN EQUITY
Share
Share Share options Retained Total
capital premium reserve earnings equity
Notes US$’000 US$’000 US$’000 US$’000 US$’000
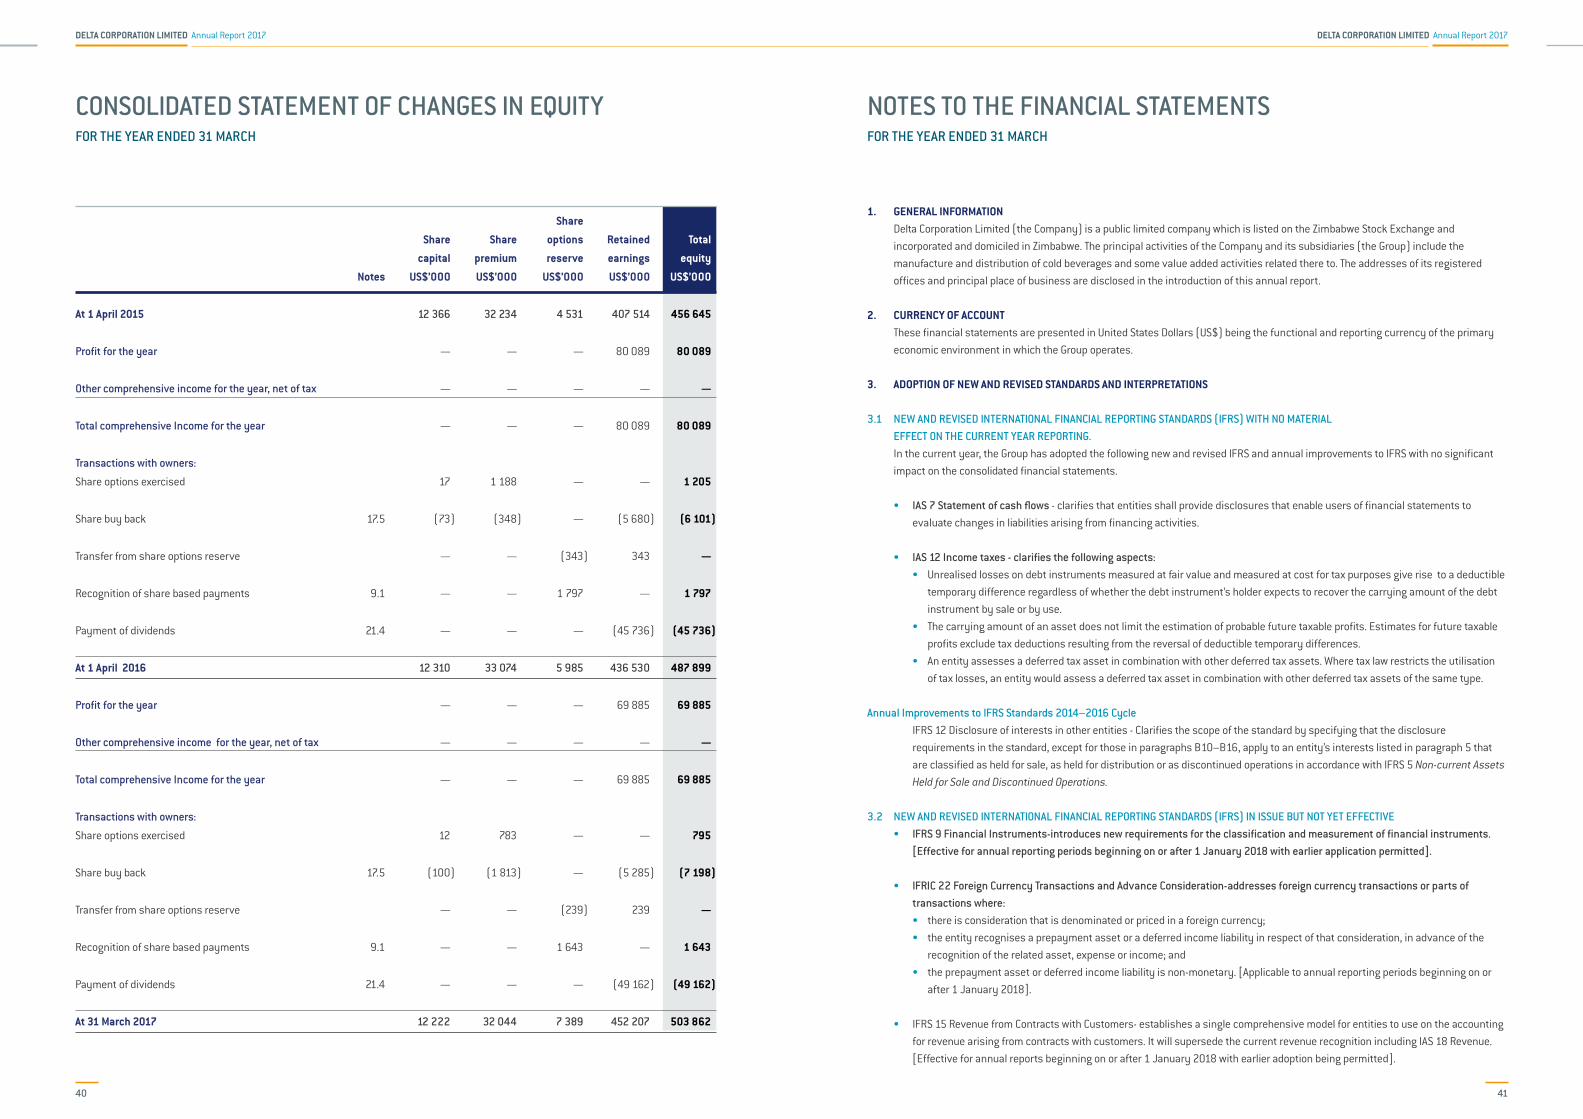
At 1 April 2015 12 366 32 234 4 531 407 514 456 645
Profit for the year — — — 80 089 80 089
Other comprehensive income for the year, net of tax — — — — —
Total comprehensive Income for the year — — — 80 089 80 089
Transactions with owners:
Share options exercised 17 1 188 — — 1 205
Share buy back 17.5 (73 ) (348 ) — (5 680 ) (6 101 )
Transfer from share options reserve — — (343 ) 343 —
Recognition of share based payments 9.1 — — 1 797 — 1 797
Payment of dividends 21.4 — — — (45 736 ) (45 736 )
At 1 April 2016 12 310 33 074 5 985 436 530 487 899
Profit for the year — — — 69 885 69 885
Other comprehensive income for the year, net of tax — — — — —
Total comprehensive Income for the year — — — 69 885 69 885
Transactions with owners:
Share options exercised 12 783 — — 795
Share buy back 17.5 (100 ) (1 813 ) — (5 285 ) (7 198 )
Transfer from share options reserve — — (239 ) 239 —
Recognition of share based payments 9.1 — — 1 643 — 1 643
Payment of dividends 21.4 — — — (49 162 ) (49 162 )
At 31 March 2017 12 222 32 044 7 389 452 207 503 862
FOR THE YEAR ENDED 31 MARCH
NOTES TO THE FINANCIAL STATEMENTS
1. GENERAL INFORMATIONDelta Corporation Limited (the Company) is a public limited company which is listed on the Zimbabwe Stock Exchange and
incorporated and domiciled in Zimbabwe. The principal activities of the Company and its subsidiaries (the Group) include the
manufacture and distribution of cold beverages and some value added activities related there to. The addresses of its registered
offices and principal place of business are disclosed in the introduction of this annual report.
2. CURRENCY OF ACCOUNTThese financial statements are presented in United States Dollars (US$) being the functional and reporting currency of the primary
economic environment in which the Group operates.
3. ADOPTION OF NEW AND REVISED STANDARDS AND INTERPRETATIONS
3.1 NEW AND REVISED INTERNATIONAL FINANCIAL REPORTING STANDARDS (IFRS) WITH NO MATERIAL EFFECT ON THE CURRENT YEAR REPORTING.
In the current year, the Group has adopted the following new and revised IFRS and annual improvements to IFRS with no significant
impact on the consolidated financial statements.
• IAS 7 Statement of cash flows - clarifies that entities shall provide disclosures that enable users of financial statements to
evaluate changes in liabilities arising from financing activities.
• IAS 12 Income taxes - clarifies the following aspects:• Unrealised losses on debt instruments measured at fair value and measured at cost for tax purposes give rise to a deductible
temporary difference regardless of whether the debt instrument’s holder expects to recover the carrying amount of the debt
instrument by sale or by use.
• The carrying amount of an asset does not limit the estimation of probable future taxable profits. Estimates for future taxable
profits exclude tax deductions resulting from the reversal of deductible temporary differences.
• An entity assesses a deferred tax asset in combination with other deferred tax assets. Where tax law restricts the utilisation
of tax losses, an entity would assess a deferred tax asset in combination with other deferred tax assets of the same type.
Annual Improvements to IFRS Standards 2014–2016 CycleIFRS 12 Disclosure of interests in other entities - Clarifies the scope of the standard by specifying that the disclosure
requirements in the standard, except for those in paragraphs B10–B16, apply to an entity’s interests listed in paragraph 5 that
are classified as held for sale, as held for distribution or as discontinued operations in accordance with IFRS 5 Non-current Assets Held for Sale and Discontinued Operations.
3.2 NEW AND REVISED INTERNATIONAL FINANCIAL REPORTING STANDARDS (IFRS) IN ISSUE BUT NOT YET EFFECTIVE• IFRS 9 Financial Instruments-introduces new requirements for the classification and measurement of financial instruments. [Effective for annual reporting periods beginning on or after 1 January 2018 with earlier application permitted].
• IFRIC 22 Foreign Currency Transactions and Advance Consideration-addresses foreign currency transactions or parts of transactions where:
• there is consideration that is denominated or priced in a foreign currency;
• the entity recognises a prepayment asset or a deferred income liability in respect of that consideration, in advance of the
recognition of the related asset, expense or income; and
• the prepayment asset or deferred income liability is non-monetary. [Applicable to annual reporting periods beginning on or
after 1 January 2018].
• IFRS 15 Revenue from Contracts with Customers- establishes a single comprehensive model for entities to use on the accounting
for revenue arising from contracts with customers. It will supersede the current revenue recognition including IAS 18 Revenue.
[Effective for annual reports beginning on or after 1 January 2018 with earlier adoption being permitted].

DELTA CORPORATION LIMITED Annual Report 2017 DELTA CORPORATION LIMITED Annual Report 2017
42 43
3. ADOPTION OF NEW AND REVISED STANDARDS AND INTERPRETATIONS (CONTINUED)
3.2 NEW AND REVISED INTERNATIONAL FINANCIAL REPORTING STANDARDS (IFRS) IN ISSUE BUT NOT YET EFFECTIVE (CONTINUED)
• IFRS 16 Leases - addresses issues raised by users on the need to record operating lease assets and related depreciation and
interest expense. Previously, the operating lease contracts were recorded off balance sheet, with lease payments being straight-
lined over the lease period. [Effective for annual periods beginning on or after 1 January 2019].
• IFRS 2 Share Based Payments - clarifies the standard in relation to the accounting for cash settled share based payment
transactions that include a performance condition, the classification of share based payment transactions with net settlement
features, and the accounting modifications of share based payment transactions from cash settled to equity settled. [Effective
for annual periods beginning on or after 1 January 2018].
Annual Improvements to IFRS Standards 2014–2016 Cycle [Effective for annual periods beginning on or after 1 January 2018].
• IFRS 1 First Time Adoption of IFRS - Deletes the short-term exemptions in paragraphs E3–E7 of IFRS 1, because they have now
served their intended purpose.
• IAS 28 Investments in Associates and Joint Ventures - Clarifies that the election to measure at fair value through profit or loss an
investment in an associate or a joint venture that is held by an entity that is a venture capital organisation, or other qualifying
entity, is available for each investment in an associate or joint venture on an investment-by-investment basis, upon initial
recognition.
4. SUMMARY OF SIGNIFICANT ACCOUNTING POLICIES
4.1 STATEMENT OF COMPLIANCEThe financial statements of the Company and the Group have been prepared in accordance with International Financial Reporting
Standards (IFRS) as issued by the International Accounting Standards Board (IASB). The financial statements have been prepared in
compliance with the Zimbabwe Companies Act (Chapter 24:03).
4.2 BASIS OF PREPARATIONThe financial statements of the Company and the Group are prepared under the historical cost convention. Historical cost is generally
based on the fair value of the consideration given in exchange for assets.
4.3 BASIS OF CONSOLIDATIONThe consolidated financial statements consist of the financial statements of Delta Corporation Limited and subsidiaries controlled by
the Group, together with an appropriate share of post acquisition results and reserves of its material associated companies. Control is
achieved when the Group:
• Has power over the investee;
• Is exposed, or has rights, to variable returns from its involvement with the investee; and
• Has the ability to use its power to affect its returns.
The Group re assess whether or not it controls an investee if facts and circumstances indicate that there are changes to one or more
of the three elements of control listed above.
All Group companies’ financial years end on 31 March with the exception of three associates, Schweppes Holdings Africa, which has
a 31 December year end, AFDIS Holdings Limited which has a 30 June year end and Nampak Zimbabwe Limited, which has a 30
September year end. The results and reserves of subsidiaries and associated companies are included from the effective dates of
acquisition up to the effective dates of disposal.
FOR THE YEAR ENDED 31 MARCH
NOTES TO THE FINANCIAL STATEMENTS (CONTINUED)
4.3 BASIS OF CONSOLIDATION (CONTINUED)
On acquisition, the assets and liabilities and contingent liabilities of a subsidiary are measured at their fair values at the date of
acquisition. Any excess of the cost of acquisition over the fair values of the identifiable net assets acquired is recognised as goodwill.
Where the cost of acquisition is below the fair values of the identifiable net assets acquired the gain is credited to profit or loss in the
period of acquisition.
Non-controlling interests in subsidiaries are identified separately from the Group’s equity therein. The interests of non-controlling
shareholders are stated at the non-controlling interests’ proportionate share of the fair value of the acquiree’s identifiable net assets.
Subsequent to acquisition, the carrying amount of non-controlling interests is the amount of those interests at initial recognition plus
the non-controlling interests’ share of subsequent changes in equity. Any losses applicable to the non-controlling interests in excess
of the non-controlling interest are allocated against the interest of the parent.
Where necessary, adjustments are made to the financial statements of subsidiaries to bring the accounting policies used into line
with those used by the Group. All intra-group transactions and balances are eliminated on consolidation.
4.4 INVESTMENTS IN ASSOCIATESAn associate is an entity in which the Company has a long term interest and over which the Group has significant influence. The
results, assets and liabilities of associates are incorporated in these financial statements using the equity method of accounting
except when classified as held for sale, in which case it is accounted for in accordance with IFRS 5. Investments in associates are
carried in the statement of financial position at cost as adjusted by post-acquisition changes in the Group’s share of the net assets
of the associate, less any impairment in the value of individual investments. Losses of the associates in excess of the Group’s
interest in those associates are not recognised. Any excess of the cost of acquisition over the Group’s share of the fair values of the
identifiable net assets of the associate at the date of acquisition is recognised as goodwill, which is included within the carrying
amount of the investment. Where the cost of acquisition is below the Group’s share of the fair values of the identifiable net assets of
the associate at the date of acquisition, the discount on acquisition is credited in profit or loss in the period of acquisition. Where a
Group company transacts with an associate of the Group, profits or losses are eliminated to the extent of the Group’s interest in the
relevant associate. Losses incurred by an associate may provide evidence of an impairment of the asset transferred in which case
appropriate provision is made for impairment.
4.5 NON-CURRENT ASSETS HELD FOR SALENon-current assets and disposal groups are classified as held for sale if their carrying amount will be recovered principally through a
sale transaction rather than through continuing use. This condition is regarded as met only when the sale is highly probable and the
asset (or disposal group) is available for immediate sale in its present condition. Management must be committed to the sale, which
should be expected to qualify for recognition as a completed sale within one year from the date of classification.
When the Group is committed to a sale plan involving cessation of control of a subsidiary, all of the assets and liabilities of that
subsidiary are classified as held for sale when the criteria described above are met, regardless of whether the Group will retain a non-
controlling interest in its former subsidiary after the sale.
Non-current assets (and disposal groups) classified as held for sale are measured at the lower of their previous carrying amount and
fair value less costs of selling.
4.6 GOODWILLGoodwill arising on consolidation represents the excess of the cost of acquisition over the Group’s interest in the fair value of the
identifiable assets acquired and liabilities assumed in a business combination. Goodwill is recognised as an asset and reviewed
for impairment at least annually. Any impairment is recognised immediately in profit or loss and is not subsequently reversed.
On disposal of a cash generating unit to which goodwill was allocated, the attributable amount of goodwill is included in the
determination of the profit or loss on disposal.
FOR THE YEAR ENDED 31 MARCH
NOTES TO THE FINANCIAL STATEMENTS (CONTINUED)

DELTA CORPORATION LIMITED Annual Report 2017 DELTA CORPORATION LIMITED Annual Report 2017
44 45
4. SUMMARY OF SIGNIFICANT ACCOUNTING POLICIES (CONTINUED)
4.7 FOREIGN CURRENCY TRANSACTIONS AND BALANCESThe Group’s financial statements are presented in United States Dollars, which is the Group’s functional and presentation currency.
Assets and liabilities denominated in foreign currencies are converted to United States Dollars at the rates of exchange ruling at the
end of the reporting date. Transactions in other currencies are translated to United States Dollars at rates of exchange ruling at the
time of the transactions.
Exchange differences on monetary assets and liabilities are recognised in profit and loss in the period in which they arise except for:
Exchange differences on foreign borrowings relating to assets under construction for future productive use are included in the cost of
the assets when they are regarded as an adjustment to interest costs on those foreign currency borrowings.
4.8 BORROWING COSTSBorrowing costs directly attributable to the acquisition, construction or production of qualifying assets, which are assets that
necessarily take a substantial period of time to get ready for their intended use or sale, are added to the cost of those assets,
until such time as the assets are substantially ready for their intended use or sale. Investment income earned on the temporary
investment of specific borrowings pending their expenditure on qualifying assets is deducted from the borrowing costs eligible for
capitalisation. All other borrowing costs are recognised in profit or loss in the period in which they are incurred.
4.9 PROPERTY, PLANT AND EQUIPMENTProperty, plant and equipment are stated at cost less accumulated depreciation and accumulated impairment.
Depreciation is not provided on freehold land and capital projects under development.
Other assets are depreciated on such bases as are deemed appropriate to reduce book values to estimated residual values over their
useful lives as follows:-
METHOD PERIOD Buildings: Freehold Straight line 60 years
Leasehold Straight line Over-lease
Plant and Equipment: Reducing balance and straight line 5-25 years
Vehicles: Straight line 4-10 years
Returnable Containers: Straight line 1-4 years
Returnable containersReturnable containers which comprise bottles and crates are considered to be property, plant and equipment which are sold and re-
purchased at their deposit prices at reporting date. Containers on hand are treated as a component of property, plant and equipment.
A further asset is shown in property, plant and equipment, together with its matching liability which is shown on the Statement of
financial position as container deposits, to reflect the estimated value of the returnable container population in the market and the
Group’s obligation to re-purchase all bottles and crates which are suitable for re-use. With the exception of returnable plastic bottles
which are considered to have a short useful life, the difference between the cost of purchasing new returnable containers and the
related current deposit price is included in property, plant and equipment and disclosed as deferred container expenditure. Deferred
container expenditure is amortised over four years (“expected useful life of containers”) following the year of purchase.
FOR THE YEAR ENDED 31 MARCH
NOTES TO THE FINANCIAL STATEMENTS (CONTINUED)
In the event of an increase in deposit prices the deferred container expenditure is reduced by the subsequent increase. Gains arising
from the deposit price increase of containers on hand after reducing deferred container expenditure to nil are included in income.
Increases in deposit prices of containers in the market are credited to current liabilities which indicate the Group’s obligation to
purchase the containers at the new deposit price. The value of any returnable containers scrapped is charged to profit or loss.
4.10 INTANGIBLE ASSETSIntangible assets with an indefinite useful life are carried at cost.
Internally-generated intangible assets: Expenditure on research and development activities is recognised as an expense in the period in which it is incurred. An internally-
generated intangible asset arising from development is recognised if, and only if, all of the following have been demonstrated:
• the technical feasibility of completing the intangible asset so that it will be available for use or sale;
• the intention to complete the intangible asset and use or sell it;
• the ability to use or sell the intangible asset;
• how the intangible asset will generate probable future economic benefits;
• the availability of adequate technical, financial and other resources to complete the development and to use or sell the
intangible asset; and
• the ability to measure reliably the expenditure attributable to the intangible asset during its development.
The amount initially recognised for internally-generated intangible assets is the sum of the expenditure incurred from the date
when the intangible asset first meets the recognition criteria listed above. Where no internally-generated intangible asset can be
recognised, development expenditure is recognised in profit or loss in the period in which it is incurred.
Subsequent to initial recognition, internally-generated intangible assets are reported at cost less accumulated amortisation and
accumulated impairment. The Group’s intangible assets pertain to trademarks.
4.11 IMPAIRMENT OF TANGIBLE AND INTANGIBLE ASSETS EXCLUDING GOODWILLTangible and intangible assets are assessed for potential impairment at each reporting date. If circumstances exist which suggest
that there may be impairment, a more detailed exercise is carried out which compares the carrying values of the assets to
recoverable value based on the higher of fair value less costs to sell and value in use. Value in use is determined using discounted
cash flows budgeted for each cash generating unit. Detailed budgets for the ensuing three years are used and, where necessary,
these are extrapolated for future years taking into account known structure changes. Service division assets and cash flows are
allocated to operating divisions as appropriate. Discount rates used are the medium term expected pre-tax rates of return. Intangible
assets with indefinite useful lives and intangible assets not yet available for use are tested for impairment at least annually, and
whenever there is an indication that the asset may be impaired. Impairments are recognised as an expense in profit or loss and the
carrying value of the asset and its annual depreciation are adjusted accordingly. When an impairment subsequently reverses, the
carrying amount of the asset is increased to the revised estimate of its recoverable amount, and the gain is recognised in profit or
loss. The increased carrying amount is limited to the value which would have been recorded had no impairment been recognised in
prior years.
Surpluses or deficits arising on the disposal of property, plant and equipment are dealt with in the operating income for the year.
FOR THE YEAR ENDED 31 MARCH
NOTES TO THE FINANCIAL STATEMENTS (CONTINUED)

DELTA CORPORATION LIMITED Annual Report 2017 DELTA CORPORATION LIMITED Annual Report 2017
46 47
4. SUMMARY OF SIGNIFICANT ACCOUNTING POLICIES (CONTINUED)
4.11 IMPAIRMENT OF TANGIBLE AND INTANGIBLE ASSETS EXCLUDING GOODWILL (CONTINUED)
Impairment of financial assetsFinancial assets, other than those at fair value through profit or loss, are assessed for indicators of impairment at the end of each
reporting period. Financial assets are considered to be impaired when there is objective evidence that, as a result of one or more
events that occurred after the initial recognition of the financial asset, the estimated future cash flows of the investment have been
affected. For categories of financial assets such as loans, trade receivables, are assessed for impairment on a collective basis even
if they were assessed not to be impaired individually. Objective evidence of impairment for a portfolio of receivables could include
the Group’s past experience of collecting payments, an increase in the number of delayed payments in the portfolio past the average
credit period, as well as observable changes in national or local economic conditions that correlate with default on receivables.
4.12 EMPLOYEE BENEFITS
Short term benefits and long term benefitsA liability is recognised for benefits accruing to employees in respect of wages, salaries and annual leave in the period the related
service is rendered at the undiscounted amount of the benefits expected to paid in exchange for the service.
Liabilities in respect of short term benefits are measured at the undiscounted amount of the benefits expected to be in exchange for
the related services.
The Group’s net obligation in respect of long-term employee benefits is the amount of future benefit that employees have earned in
return for their service in the current and prior periods.
Other long-term employee benefits
Termination benefitsTermination benefits are expensed at the earlier of when the Group can no longer withdraw the offer of those benefits and when the
Group recognises costs for a restructuring.
Long service awardsThe Group recognises the liability and an expense for long service awards where cash is paid to employees at certain milestone dates
in a career with the Group. Such accruals are appropriately discounted to reflect present values of the future payments.
Share based payment transactionsThe Group issues share options to certain employees. The options are valued at fair value at the date of grant. The fair value
determined is expensed on a straight-line basis over the vesting period, based on the Group’s estimate of equity instruments that
will eventually vest, and the liability is disclosed in a share options reserve which forms part of equity. At the end of each reporting
period, the Group revises its estimate of the number of equity instruments expected to vest. The impact of the revision of the original
estimates, if any, is recognised in profit or loss such that the cumulative expense reflects the revised estimate, with a corresponding
adjustment to the share options reserve. The fair value is calculated using the Black-Scholes option pricing model, as adjusted for
dividends by Robert Merton. The expected life used in the model has been adjusted, based on management’s best estimates, for the
effects of non-transferability, exercise restrictions as regards closed periods and behavioural considerations. The value transferred to
the share options reserve is amortised to retained earnings as the related share options are exercised or forfeited.
FOR THE YEAR ENDED 31 MARCH
NOTES TO THE FINANCIAL STATEMENTS (CONTINUED)
Equity-settled share-based payment transactions with parties other than employees are measured at the fair value of the goods or
services received, except where that fair value cannot be estimated reliably, in which case they are measured at the fair value of the
equity instruments granted, measured at the date the Group obtains the goods or the counterparty renders the service.
Cash-settled share based payment transactions are measured based on the fair value of the goods or services received unless this
cannot be reasonably determined, in which case the transaction is valued based on the fair value of the underlying shares. Where
services are rendered over a period, proportional accrual takes place on a straight line basis. The Group re-measures the fair value of
the liability at the end of each reporting period and at the date of settlement using the fair value of the underlying shares, with any
changes in fair value being recognised in the profit or loss for the period.
4.13 INVENTORIESInventories are valued at the lower of cost and net realisable value. Net realisable value represents the estimated selling price for
inventories less all estimated costs of completion and costs necessary to make the sale. Cost is determined on the following bases:
Merchandise, raw materials and consumable stores are valued at cost on a weighted average cost basis. Manufactured finished
products and products in process are valued at raw material cost, plus labour and a portion of manufacturing overhead expenses,
where appropriate.
4.14 FINANCIAL INSTRUMENTSFinancial assets and financial liabilities are recognised when a Group entity becomes party to the contractual provisions of the
instrument. Financial instruments are initially recorded at fair value which usually approximates cost. Transaction costs that are
directly attributable to the acquisition or issue of financial assets and financial liabilities (other than financial assets and financial
liabilities at fair value through profit or loss) are added to or deducted from the fair value of the financial assets or financial liabilities,
as appropriate, on initial recognition. Transaction costs directly attributable to the acquisition of financial assets or financial liabilities
at fair value through profit or loss are recognised immediately in profit or loss.
Financial AssetsFinancial assets are classified into the following specified categories: financial assets at fair value through profit or loss” (FVTPL),
‘held-to-maturity’ investments, ‘available-for-sale’ (AFS) financial assets and ‘loans and receivables’. The classification depends on
the nature and purpose of the financial assets and is determined at the time of initial recognition.
Loans and receivablesLoans and receivables are non-derivative financial assets with fixed or determinable payments that are not quoted in an active
market. Loans and receivables (including trade and other receivables, bank balances and cash, and staff loans) are measured at
amortised cost using the effective interest method, less any impairment.
Interest income is recognised by applying the effective interest rate, except for short-term receivables when the effect of discounting
is immaterial
The effective interest method is a method of calculating the amortised cost of a debt instrument and of allocating interest income
over the relevant period. The effective interest rate is the rate that exactly discounts estimated future cash receipts (including all
fees and points paid or received that form an integral part of the effective interest rate, transaction costs and other premiums or
discounts) through the expected life of the debt instrument, or, where appropriate, a shorter period, to the net carrying amount on
initial recognition
FOR THE YEAR ENDED 31 MARCH
NOTES TO THE FINANCIAL STATEMENTS (CONTINUED)

DELTA CORPORATION LIMITED Annual Report 2017 DELTA CORPORATION LIMITED Annual Report 2017
48 49
4. SUMMARY OF SIGNIFICANT ACCOUNTING POLICIES (CONTINUED)
4.14 FINANCIAL INSTRUMENTS (CONTINUED)
Available for sale investments (AFS)
AFS financial assets are non-derivatives that are either designated as AFS or are not classified as (a) loans and receivables, (b) held-
to-maturity investments or (c) financial assets at fair value through profit or loss
AFS financial assets for which fair value can be reliably determined are stated at fair value with the change in value being credited or
debited to other comprehensive income.
Unquoted investments and financial assets regarded as held for trading, but for which fair value cannot be reliably determined, are
shown at cost unless the directors are of the opinion that there has been impairment in value, in which case provision is made and
charged to profit or loss. The Group’s investments are unquoted AFS investments measured at cost.
Where the Group has financial instruments which have a legally enforceable right of offset and the Group intends to settle them on a
net basis or to realise the asset and liability simultaneously, the financial asset and liability and related revenues and expenses are
offset and the net amount reported in the statement of financial position and statement of comprehensive income respectively.
Other financial instrumentsOther financial instruments, including borrowings and payables, are initially measured at fair value, net of transaction costs.
Subsequent measurement is at amortised cost using the effective interest method, with the interest expense recognised on an
effective yield basis.
4.15 REVENUE RECOGNITIONRevenue is measured at the fair value of the consideration received or receivable. It comprises sales (net of trade discounts), fees
and rentals and excludes value added tax. Intra-group revenue which arises in the normal course of business is excluded from Group
revenue.
The Group presents revenue gross of excise duties because unlike value added tax, excise is not directly related to the value of sales.
It is not generally recognised as a separate item on invoices. The Group therefore considers excise as a cost to the Group and reflects
it as a production cost.
Interest incomeInterest income is recognised when it is probable that the economic benefits will flow to the Group and the amount of revenue can be
measured reliably. Interest revenue is accrued on a time basis, by reference to the principal outstanding and at the effective interest
rate applicable, which is the rate that exactly discounts estimated future cash receipts through the expected life of the financial asset
to that asset’s net carrying amount on initial recognition.
Rental incomeRental income from operating leases is recognised on a straight-line basis over the term of the relevant lease. Initial direct costs
incurred in negotiating and arranging an operating lease are added to the carrying amount of the leased asset and recognised on a
straight-line basis over the lease term.
Dividend incomeDividend income from investments is recognised when the shareholders’ rights to receive payment have been established (provided
that it is probable that the economic benefits will flow to the Group) and the amount of revenue can be measured reliably.
FOR THE YEAR ENDED 31 MARCH
NOTES TO THE FINANCIAL STATEMENTS (CONTINUED)
4.16 TAXATION
Current tax The tax currently payable is based on taxable profit for the year. Taxable profit differs from profit as reported in the statement of
comprehensive income because it excludes items of income or expense that are taxable or deductible in other years and it further
excludes items that are never taxable or deductible. The Group’s liability for current tax is calculated using tax rates that have been
enacted or substantively enacted by the reporting date.
Deferred tax Deferred tax is recognised on temporary differences between the carrying amounts of assets and liabilities in the financial
statements and the corresponding tax bases used in the computation of taxable profit. Deferred tax liabilities are generally recognised
for all taxable temporary differences. Deferred tax assets are generally recognised for all deductible temporary differences to the
extent that it is probable that taxable profits will be available against which those deductible temporary differences can be utilised.
Such deferred tax assets and liabilities are not recognised if the temporary difference arises from goodwill or from the initial
recognition (other than in a business combination) of other assets and liabilities in a transaction that affects neither the taxable profit
nor the accounting profit.
Deferred tax liabilities are recognised for taxable temporary differences associated with investments in subsidiaries and associates,
and interests in joint ventures, except where the Group is able to control the reversal of the temporary difference and it is probable
that the temporary differences will not reverse in the foreseeable future. Deferred tax assets arising from deductible temporary
differences associated with such investments and interests are only recognised to the extent that it is probable that there will be
sufficient taxable profits against which to utilise the benefits of the temporary differences and they are expected to reverse in the
foreseeable future.
The carrying amount of deferred tax assets is reviewed at the end of each reporting period and reduced to the extent that it is no
longer probable that sufficient taxable profits will be available to allow all or part of the asset to be recovered.
Deferred tax assets and liabilities are measured at the tax rates that are expected to apply in the period in which the liability is settled
or the asset realised, based on tax rates (and tax laws) that have been enacted or substantively enacted by the end of the reporting
period. The measurement of deferred tax liabilities and assets reflects the tax consequences that would follow from the manner in
which the Group expects, at the end of the reporting period, to recover or settle the carrying amount of assets and liabilities.
Deferred tax assets and liabilities are offset when there is a legally enforceable right to set off current tax assets against current tax
liabilities and when they relate to income taxes levied by the same taxation authority and the Group intends to settle its current tax
assets and liabilities on a net basis.
Current and deferred tax for the periodCurrent and deferred tax are recognised as income or as an expense in profit or loss, except when they relate to items that are
recognised outside profit or loss (whether in other comprehensive income or directly in equity), in which case the tax is also
recognised outside profit or loss, or where they arise from the initial accounting for a business combination. In the case of a business
combination, the tax effect is included in the accounting for the business combination.
FOR THE YEAR ENDED 31 MARCH
NOTES TO THE FINANCIAL STATEMENTS (CONTINUED)

DELTA CORPORATION LIMITED Annual Report 2017 DELTA CORPORATION LIMITED Annual Report 2017
50 51
4. SUMMARY OF SIGNIFICANT ACCOUNTING POLICIES (CONTINUED)
4.17 RETIREMENT BENEFIT COSTSRetirement benefits are provided for Group employees through various independently administered defined contribution funds,
including the National Social Security Authority. Contributions to defined contribution retirement benefit plans are recognised as an
expense when employees have rendered service entitling them to the contributions.
The Group’s pension scheme is a defined contribution scheme and the cost of the retirement benefit is determined by the level of
contribution made in terms of the rules.
The cost of the retirement benefit applicable to the National Social Security Authority scheme is determined by the systematic
recognition of legislated contributions.
4.18 LEASE PAYMENTSOperating lease payments are recognised as an expense on a straight-line basis over the lease term, except where another
systematic basis is more representative of the time pattern in which economic benefits from the leased asset are consumed.
Contingent rentals arising under operating leases are recognised as an expense in the period in which they are incurred.
In the event that lease incentives are received to enter into operating leases, such incentives are recognised as a liability. The
aggregate benefit of incentives is recognised as a reduction of rental expense on a straight-line basis, except where another
systematic basis is more representative of the time pattern in which economic benefits from the leased asset are consumed.
4.19 PROVISIONS Provisions are recognised when the Group has a present obligation (legal or constructive) as a result of a past event; it is probable
that the Group will be required to settle the obligation; and a reliable estimate can be made of the amount of the obligation.
The amount recognised as a provision is the best estimate of the consideration required to settle the present obligation at the end of
the reporting period, taking into account the risks and uncertainties surrounding the obligation. Where a provision is measured using
the cash flows estimated to settle the present obligation, its carrying amount is the present value of those cash flows.
Onerous contractsPresent obligations arising under onerous contracts are recognised and measured as provisions. An onerous contract is considered
to exist when the Group has a contract under which the unavoidable costs of meeting the obligations under the contract exceed the
economic benefits expected to be received under it.
RestructuringsA restructuring provision is recognised when the Group has developed a detailed formal plan for the restructuring and has raised a
valid expectation in those affected that it will carry out the restructuring by starting to implement the plan or announcing its main
features to those affected by it. The measurement of a restructuring provision includes only the direct expenditures arising from the
restructuring, which are those amounts that are both necessarily entailed by the restructuring and not associated with the ongoing
activities of the entity.
FOR THE YEAR ENDED 31 MARCH
NOTES TO THE FINANCIAL STATEMENTS (CONTINUED)
4.20 CRITICAL ACCOUNTING JUDGEMENTS AND KEY SOURCES OF ESTIMATION UNCERTAINTYIn the application of the Group’s accounting policies, which are described in note 4, management is required to make judgements,
estimates and assumptions about the carrying amounts of assets and liabilities that are not readily apparent from other sources. The
estimates and associated assumptions are based on historical experience and other factors that are considered to be relevant. Actual
outcomes may differ from these estimates.
The estimates and underlying assumptions are reviewed on an ongoing basis. Revisions to accounting estimates are recognised in
the period in which the estimate is revised if the revision affects only that period, or in the period of the revision and future periods if
the revision affects both current and future periods.
The following are the key assumptions concerning the future, and other key sources of estimation uncertainty at the reporting
date, that have a significant risk of causing a material adjustment to the carrying amounts of assets and liabilities within the next
financial year.
Critical judgements in applying accounting policies
• Share based payments The assumptions and methodology underlying the valuation of share based payments are fully described in Note 17.
• Fair value of share options issued in the current yearOptions were valued using the Black Scholes model. Expected volatility is based on the Company’s historical share price volatility
since dollarisation (Refer to note17.4).
• Long service awardsIncluded in provisions (note 20.2) is a liability for long service awards which are awarded to employees on reaching certain
employment period milestones. The amount recognised is the present value of future cash flows adjusted for life expectancy,
salary levels and probability of early contractual terminations. Management uses market and non-market information to come up
with these estimates.
• Impairment of financial assets Impairment of financial assets is an area that requires significant judgement. Refer to Note 4.11 for more details.
• Useful lives and residual values of property, plant and equipmentThe Group assesses useful lives and residual values of property, plant and equipment each year, taking into account past
experience and technology changes. The useful lives are set out in note 4.9 and no changes to those useful lives have been
considered necessary during the year. In the case of plant, the residual value at the end of useful life has been assessed as
negligible due to the specialist nature of the plant, technology changes and likely de-commissioning costs. Heavy motor vehicles
are considered to have a residual value, at end of useful life, of approximately 20% of their original cost.
• Containers in the market
In determining the quantity of useable containers in the market the population is determined based on the actual purchases of
containers for the past five years, which is the estimated normal period of use for each container.
As explained in note 4.9 the deferred container expenditure is amortised from 1 to 4 years following the year of purchase. The
Group recognises write offs for containers in excess of 4 years only to the extent to which the Group has re-purchased and
destroyed containers on hand.
FOR THE YEAR ENDED 31 MARCH
NOTES TO THE FINANCIAL STATEMENTS (CONTINUED)

DELTA CORPORATION LIMITED Annual Report 2017 DELTA CORPORATION LIMITED Annual Report 2017
52 53
4. SUMMARY OF SIGNIFICANT ACCOUNTING POLICIES (CONTINUED)
4.20 CRITICAL ACCOUNTING JUDGEMENTS AND KEY SOURCES OF ESTIMATION UNCERTAINTY (CONTINUED)
Critical judgements in applying accounting policies (continued)
• Fair value measurement and valuation processes for associates acquiredOn acquisition of an investment in associate, any excess of the cost of investment over the Group’s share of the net fair value
of the identifiable assets and liabilities of the investee is recognised as goodwill. Any excess of the Group’s share of the net
fair value of the identifiable assets and liabilities over the cost of the investment is recognised immediately in profit or loss. In
estimating the fair value of an associate’s asset or a liability, the Group uses market-observable data to the extent it is available.
Where observable inputs are not available, the Group engages third party qualified valuers to perform the valuation. Management
works closely with the qualified external valuers to establish the appropriate valuation techniques and inputs to the model.
• Recognition of tax contingencyTax matters involve inherently uncertainties arising from interpretation of tax regulations. The Group has disclosed a contingent
liability as a result of a pending tax matter, refer to Note 11.4 for more details.
5. DEFINITIONS
5.1 TAXED INTEREST PAYABLEThis is calculated by taxing interest payable at the standard rate of taxation.
5.2 INTEREST COVER (TIMES)This is the ratio which the aggregate of operating income, non-recurring items and equity accounted earnings bears to interest
payable (inclusive of capitalised interest).
5.3 NET ASSETSThese are equivalent to shareholders’ equity.
5.4 PRETAX RETURN ON TOTAL ASSETSThis is calculated by relating to closing total assets, income before tax inclusive of dividend income and equity accounted earnings.
FOR THE YEAR ENDED 31 MARCH
NOTES TO THE FINANCIAL STATEMENTS (CONTINUED)
FOR THE YEAR ENDED 31 MARCH
NOTES TO THE FINANCIAL STATEMENTS (CONTINUED)
5.5 EARNINGS PER SHARE
Attributable and fully diluted earnings basisThe calculations are based on the earnings attributable to ordinary shareholders. Account is taken of the number of shares in issue
for the period during which they have participated in the income of the Group. Dilution arising in respect of share options granted
amounts to 0,22% and 0,16% for 2017 and 2016 respectively.
The weighted number of shares was:
2017 2016 Number of Shares Number of Shares in millions in millions
Ordinary shares 1 226 1 234
Share options 2 2
Fully diluted number of shares 1 228 1 236
5.6 CASH FLOW PER SHAREThis focuses on the cash stream actually achieved in the year under review. It is calculated by dividing the cash flow from operations
by the weighted average number of ordinary shares in issue.
5.7 FINANCIAL GEARING RATIOThis represents the ratio of interest bearing debt to total shareholders’ equity.
6. COUNTRY OF INCORPORATION AND CURRENCY
All Group companies are incorporated in Zimbabwe. The financial statements are expressed in United States Dollars (US$).
7. SEGMENTAL REPORTING
The distinct operating segments for the Group are shown in the table below:
REPORTABLE SEGMENTS OPERATIONS
Lager Beer division Manufacture and distribution of lager beer (malt and sorghum based clear beers).
Sparkling Beverages division Manufacture and distribution of carbonated soft drinks and alternative non-alcoholic beverages.
Sorghum Beer division Manufacture and distribution of sorghum based opaque beer.
Other operations include barley and sorghum malting and provision of transport services, which are functional departments for the
above mentioned divisions. None of these segments met the quantitative thresholds for reportable segments in 2017 nor 2016.
There are varying levels of integration between the Lagers, Sparkling Beverages and Sorghum segments. This integration includes
shared primary and secondary distribution services and facilities. The Group has a centralised treasury function.

DELTA CORPORATION LIMITED Annual Report 2017 DELTA CORPORATION LIMITED Annual Report 2017
54 55
FOR THE YEAR ENDED 31 MARCH
NOTES TO THE FINANCIAL STATEMENTS (CONTINUED)
7. SEGMENTAL REPORTING (CONTINUED)
Information about reportable segments Information related to each reportable segment is set out below. Segment operating income is used to measure performance because management believes that this information is the most relevant in evaluating the results of the respective segments relative to other entities that operate in the same industries.
Reportable segments
Total Lager Sparkling Sorghum reportable All other2017 Beer Beverages Beer segments segments Total US$’000 US$’000 US$’000 US$’000 US$’000 US$’000
External revenue 183 363 142 349 154 567 480 279 18 994 499 273Inter-segment revenue — — — — (16 305 ) (16 305 )Segment revenue 183 363 142 349 154 567 480 279 2 689 482 968
Segment operating income 22 866 14 295 34 986 72 147 9 897 82 044
Segment net working capital* 13 370 10 342 9 979 33 691 105 393 139 084Segment trade and other payables** (22 029 ) (27 414 ) (12 304 ) (61 747 ) (86 589 ) (148 336 )Segment working capital assets 35 399 37 756 22 283 95 438 191 982 287 420
Segment property, plant and equipment 124 169 94 257 97 019 315 445 39 502 354 947
** Included in trade and other payables are short term borrowings of US$60 million.
Reportable segments
Total Lager Sparkling Sorghum reportable All other2016 Beer Beverages Beer segments segments Total US$’000 US$’000 US$’000 US$’000 US$’000 US$’000
External revenue 199 209 167 392 164 011 530 612 24 390 555 002
Inter-segment revenue — — — — (16 804 ) (16 804 )Segment revenue 199 209 167 392 164 011 530 612 7 586 538 198
Segment operating income 25 575 22 525 39 108 87 208 8 864 96 072
Segment net working capital* 10 265 11 142 24 216 45 623 164 064 209 687
Segment trade and other payables (22 600 ) (21 176 ) (8 764 ) (52 540 ) (12 732 ) (65 272 )
Segment working capital assets 40 606 40 456 32 134 113 196 182 934 296 130
Segment property, plant and equipment 133 587 106 565 61 853 302 005 43 327 345 332
* Net working capital comprises of cash and cash equivalents, receivables, inventories, payables excluding provision for tax. The accounting policies of the reportable segments are the same as the Group’s accounting policies described in note 4. Segment operating income represents segment income before allocation of central administration costs. This is the measure reported to the chief operating decision maker for the purposes of resource allocation and assessment of segment performance.
No single customer contributed 10% or more to the Group’s or individual segment’s revenue.
FOR THE YEAR ENDED 31 MARCH
NOTES TO THE FINANCIAL STATEMENTS (CONTINUED)
7. SEGMENTAL REPORTING (CONTINUED)
Reconciliations of information on reportable segments to IFRS measures (continued)
2017 2016
US$’000 US$’000
i) Revenue
Total revenue for reportable segments 480 279 530 612
Revenue for other segments 18 994 24 390
Elimination of inter-segment revenue (16 305 ) (16 804 )
Consolidated revenue 482 968 538 198
ii) Operating income
Total operating income for reportable segments 72 147 87 208
Operating income for other segments 9 897 8 864
- Finance income 11 457 11 621
- Finance cost (6 918 ) (5 726 )
- Share of profit of equity-accounted investees 1 834 3 944
Consolidated profit before tax 88 417 105 911
iii) Assets
Total working capital assets for reportable segments 95 438 113 196
Working capital assets for other segments 191 982 182 935
Total property, plant and equipment for reportable segments 315 445 302 005
Property, plant and equipment for other segments 39 502 43 327
Equity-accounted investees 43 587 42 122
Other unallocated amounts 18 135 12 653
Consolidated total assets 704 089 696 238
iv) Liabilities
Total trade and other payables for reportable segments 56 402 52 540
Trade and other payables for other segments 12 002 12 732
Borrowings 60 000 65 000
Provisions 19 932 21 171
Deferred tax liabilities 50 022 48 833
Current tax liability 1 869 8 063
Consolidated total liabilities 200 227 208 339
The Sparkling Beverages Business and associate entity Schweppes Holdings Africa produce brands under licence from The Coca-
Cola Company (TCCC) in terms of bottlers’ agreements. Following the merger of SABMiller and AB InBev in October 2016, TCCC has
indicated an intention to terminate these bottlers agreements and that TCCC and AB InBev are pursuing strategies that could result in
a restructure of these business entities. No specific formal positions have been reached regarding these matters, and consequently
the entities have not been identified as a disposals group.

DELTA CORPORATION LIMITED Annual Report 2017 DELTA CORPORATION LIMITED Annual Report 2017
56 57
FOR THE YEAR ENDED 31 MARCH
NOTES TO THE FINANCIAL STATEMENTS (CONTINUED)
8. REVENUE
2017 2016 US$’000 US$’000
Gross sales 562 933 632 938
Less VAT and discounts (79 965 ) (94 740 )
Revenue 482 968 538 198
Less excise duties and levies 9.1 (52 702 ) (57 888 )
Net sales 430 266 480 310
All income has been derived from the sale of goods.
9. OPERATING INCOME
Operating income is arrived at after charging:-
9.1 NET OPERATING COSTS
2017 2016 US$’000 US$’000
Raw materials and consumables used 171 294 194 747
Depreciation of property, plant and equipment 9.2 30 714 32 856
Staff costs 78 855 84 360
Excise duties and levies 52 702 57 888
Share option expenses 1 643 1 797
Repairs and maintenance 18 887 19 421
Container breakages* 3 783 6 072
Selling and marketing expenses 13 279 13 042
Royalties and technical fees 8 130 10 541
Security cost 5 438 5 721
Administration and operating costs 16 199 15 681
400 924 442 126
*Container breakages relate to containers that have come to the end of their useful life.
FOR THE YEAR ENDED 31 MARCH
NOTES TO THE FINANCIAL STATEMENTS (CONTINUED)
9. OPERATING INCOME (CONTINUED)
9.2 DEPRECIATION OF PROPERTY, PLANT AND EQUIPMENT
2017 2016 US$’000 US$’000
Buildings 2 572 1 774
Plant and equipment 20 942 20 457
Vehicles 3 858 3 617
Containers (deferred container expenditure) 3 342 7 008
30 714 32 856
9.3 AUDITORS’ REMUNERATION
2017 2016 US$’000 US$’000
Included in administration and operating costs are current year audit fees and expenses as follows:Current year audit fees and expenses
- Group 355 355
- Company 45 45
Total 400 400
10. THE GROUP AS A LESSEE
10.1 LEASING ARRANGEMENTSOperating leases relate mainly to leases of land and buildings with lease terms of between 5 and 10 years. All operating lease
contracts over 5 years contain clauses for annual market rental reviews. The Group does not have an option to purchase the leased
properties at the expiry of the leased periods.
10.2 NET LEASING EXPENSE
2017 2016 US$’000 US$’000
Lease payments: - Minimum lease payments 1 313 1 447
10.3 NET FUTURE OPERATING LEASE COMMITMENTS
Lease payments: - Payable within one year 997 906
- Payable within two to five years 3 531 3 034
4 528 3 940
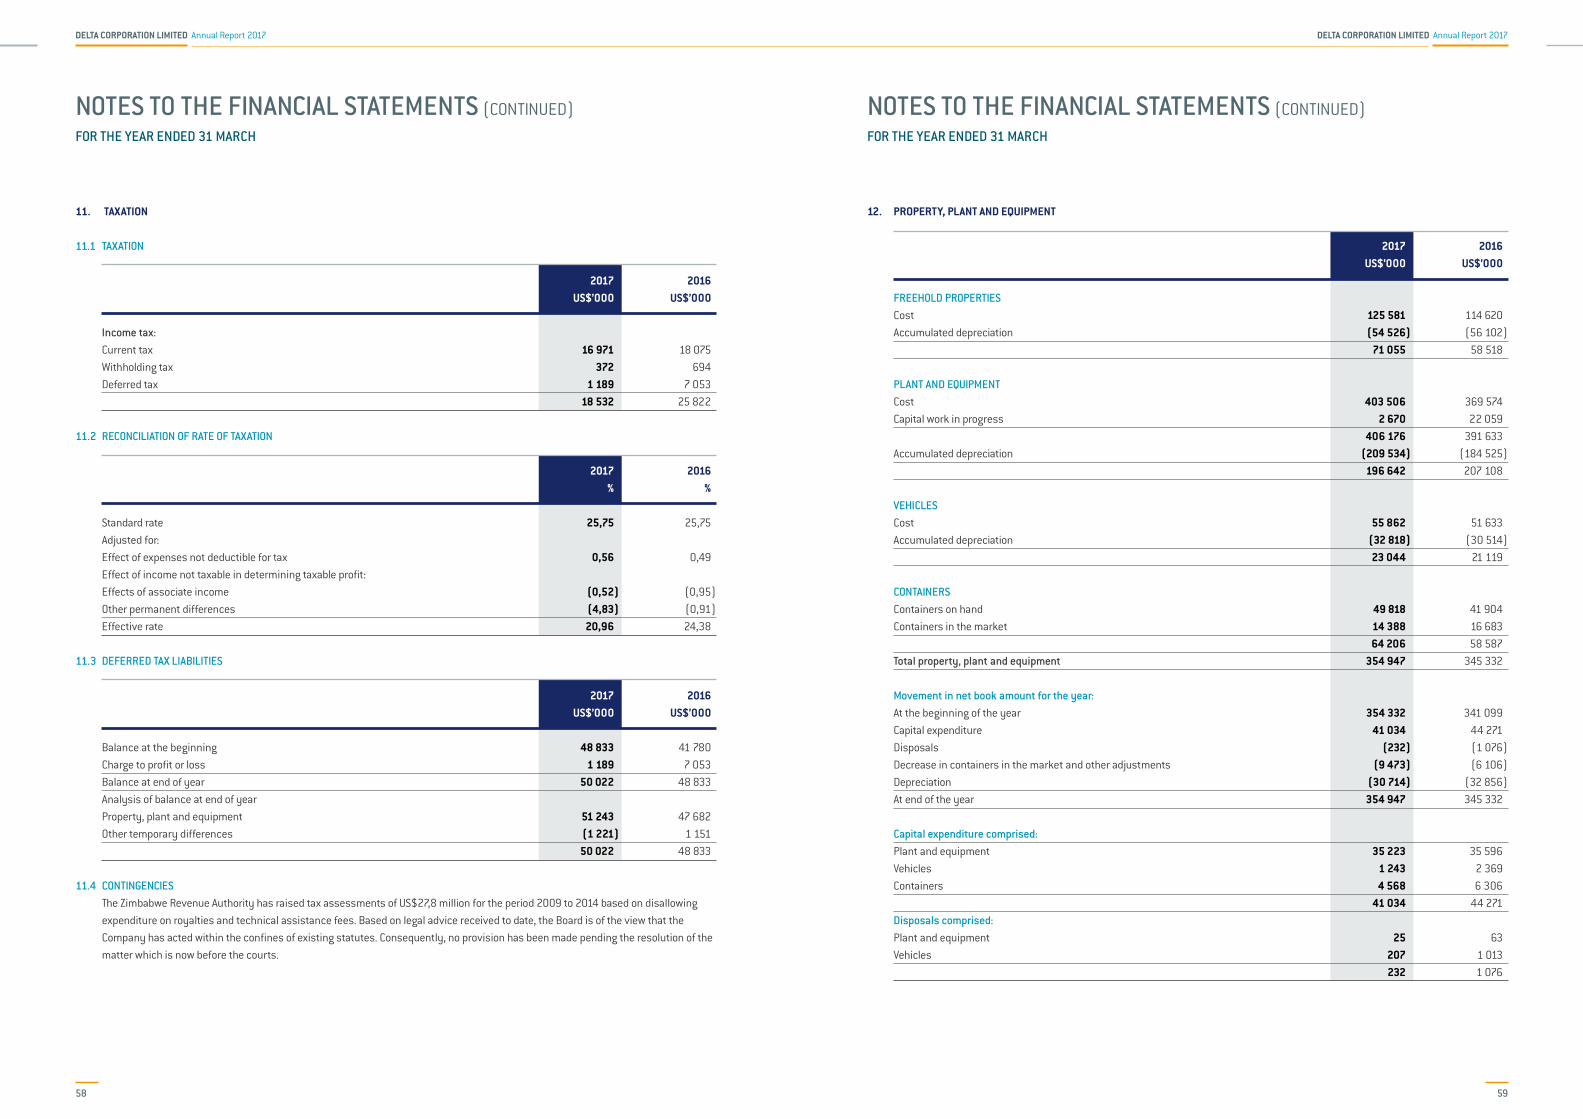
DELTA CORPORATION LIMITED Annual Report 2017 DELTA CORPORATION LIMITED Annual Report 2017
58 59
FOR THE YEAR ENDED 31 MARCH
NOTES TO THE FINANCIAL STATEMENTS (CONTINUED)
11. TAXATION
11.1 TAXATION
2017 2016 US$’000 US$’000
Income tax: Current tax 16 971 18 075
Withholding tax 372 694
Deferred tax 1 189 7 053
18 532 25 822
11.2 RECONCILIATION OF RATE OF TAXATION
2017 2016 % %
Standard rate 25,75 25,75
Adjusted for:
Effect of expenses not deductible for tax 0,56 0,49
Effect of income not taxable in determining taxable profit:
Effects of associate income (0,52 ) (0,95 )
Other permanent differences (4,83 ) (0,91 )
Effective rate 20,96 24,38
11.3 DEFERRED TAX LIABILITIES
2017 2016 US$’000 US$’000
Balance at the beginning 48 833 41 780
Charge to profit or loss 1 189 7 053
Balance at end of year 50 022 48 833
Analysis of balance at end of year
Property, plant and equipment 51 243 47 682
Other temporary differences (1 221 ) 1 151
50 022 48 833
11.4 CONTINGENCIESThe Zimbabwe Revenue Authority has raised tax assessments of US$27,8 million for the period 2009 to 2014 based on disallowing
expenditure on royalties and technical assistance fees. Based on legal advice received to date, the Board is of the view that the
Company has acted within the confines of existing statutes. Consequently, no provision has been made pending the resolution of the
matter which is now before the courts.
FOR THE YEAR ENDED 31 MARCH
NOTES TO THE FINANCIAL STATEMENTS (CONTINUED)
12. PROPERTY, PLANT AND EQUIPMENT
2017 2016 US$’000 US$’000
FREEHOLD PROPERTIES Cost 125 581 114 620
Accumulated depreciation (54 526 ) (56 102 )
71 055 58 518
PLANT AND EQUIPMENT Cost 403 506 369 574
Capital work in progress 2 670 22 059
406 176 391 633
Accumulated depreciation (209 534 ) (184 525 )
196 642 207 108
VEHICLES
Cost 55 862 51 633
Accumulated depreciation (32 818 ) (30 514 )
23 044 21 119
CONTAINERS
Containers on hand 49 818 41 904
Containers in the market 14 388 16 683
64 206 58 587
Total property, plant and equipment 354 947 345 332
Movement in net book amount for the year: At the beginning of the year 354 332 341 099
Capital expenditure 41 034 44 271
Disposals (232 ) (1 076 )
Decrease in containers in the market and other adjustments (9 473 ) (6 106 )
Depreciation (30 714 ) (32 856 )
At end of the year 354 947 345 332
Capital expenditure comprised: Plant and equipment 35 223 35 596
Vehicles 1 243 2 369
Containers 4 568 6 306
41 034 44 271
Disposals comprised: Plant and equipment 25 63
Vehicles 207 1 013
232 1 076

DELTA CORPORATION LIMITED Annual Report 2017 DELTA CORPORATION LIMITED Annual Report 2017
60 61
FOR THE YEAR ENDED 31 MARCH
NOTES TO THE FINANCIAL STATEMENTS (CONTINUED)
13. INVESTMENTS IN ASSOCIATES
2017 2016 US$’000 US$’000
Shares at cost 20 093 20 093
Post acquisition reserves 23 494 22 029
43 587 42 122
Analysis of results and statement of financial position of associates.
2017 2016 US$’000 US$’000
AFDIS Holdings Limited (38, 14%) (2016: 38,14%) Shares at cost 10 493 10 493
Group’s share of post-acquisition profits 1 618 1 134
Dividend received from associate (982 ) (873 )
11 129 10 754
Total assets 25 856 21 479
Total liabilities (8 563 ) (5 564 )
Net assets 17 293 15 915
Group’s share of net assets of associate 6 596 6 070
Total revenue 35 732 34 322
Total profit for the year 1 268 1 958
Group’s share of profit of associate 484 747
The market value of the Group’s interest in AFDIS Holdings Limited, the controlling entity of African Distillers Limited which is listed on
the stock exchange in Zimbabwe, was US$24,2 million (2016: US$19,8 million).
FOR THE YEAR ENDED 31 MARCH
NOTES TO THE FINANCIAL STATEMENTS (CONTINUED)
13. INVESTMENTS IN ASSOCIATES (CONTINUED)
2017 2016 US$’000 US$’000
Schweppes Holdings Africa Limited (49%) (2016: 49%) Shares at cost 530 530
Gain arising on acquisition 9 278 9 278
Group’s share of post-acquisition distributable reserves 12 414 11 885
Dividend received from associate (505 ) (245 )
21 717 21 448
Total assets 70 528 78 318
Total liabilities (48 263 ) (47 033 )
Net assets 22 265 31 285
Group’s share of net assets of associate 10 910 15 330
Total revenue 89 857 94 901
Total profit for the year 1 080 4 905
Group’s share of profit of associate 529 2 404
2017 2016 US$’000 US$’000
Nampak Zimbabwe Limited (21,46%) (2016: 21,46 %)Shares at cost 9 070 9 070
Group’s share of post-acquisition distributable reserves 1 671 850
10 741 9 920
Total assets 109 689 96 923
Total liabilities (47 116 ) (38 018 )
Net assets 62 573 58 905
Group’s share of net assets of associate 13 428 12 641
Total revenue for the year 43 139 47 664
Total profit for the year 3 825 3 695
Group’s share of profit of associate 821 793
The market value of the Group’s interest in Nampak Zimbabwe Limited which is listed on the stock exchange in Zimbabwe was
US$4,9 million (2016: US$2,4 million).

DELTA CORPORATION LIMITED Annual Report 2017 DELTA CORPORATION LIMITED Annual Report 2017
62 63
FOR THE YEAR ENDED 31 MARCH
NOTES TO THE FINANCIAL STATEMENTS (CONTINUED)
14. TRADEMARKS, INVESTMENTS AND LOANS
2017 2016 US$’000 US$’000
14.1 INVESTMENTS Unlisted - at cost 244 110
14.2 LOANS Secured-Related Parties 9 379 9 630
Total investments and loans 9 623 9 740
14.3 TRADEMARKS At cost 2 914 2 914
14.4 Included in the Group’s secured loans of US$9,4 million are loans to employees made in terms of a Group housing and vehicle
ownership scheme. This includes loans to Directors and officers of the Group amounting to US$ 5,6 million (2016: US$ 6,0 million).
During the year, US$ 0,120 million was advanced and US$ 0,578 million was repaid. Housing loans are secured through mortgage
bonds, share options and terminal benefits whilst the underlying assets under the car loan scheme are pledged as security. The loans
are of various tenure and are in line with the employees’ contracts of employment and attract variable interest rates of up to 16% per
annum depending on the nature of the loan. The interest rates are reviewed periodically by the Remuneration Committee. None of the
loans were past due or impaired at the end of the reporting period.
The Group holds trademarks for the manufacture of various beverages and for corporate brands. The trademarks are assessed for
impairment on an annual basis. No impairment has been recognised in the current year.
15. INVENTORIES
2017 2016 US$’000 US$’000
Consumable stores 24 193 26 116
Finished products 18 402 18 701
Raw materials 33 118 39 110
Work in progress 2 040 2 504
77 753 86 431
The cost of inventories recognised as an expense during the year was US$ 138 million (2016: US$157 million).
FOR THE YEAR ENDED 31 MARCH
NOTES TO THE FINANCIAL STATEMENTS (CONTINUED)
16. TRADE AND OTHER RECEIVABLES
2017 2016 US$’000 US$’000
Trade receivables 35 666 35 786
Other receivables 6 680 9 829
Allowances for credit losses (7 404 ) (3 876 )
34 942 41 739
The Group holds collateral on some receivable balances. The estimated value of this collateral is US$6,5 million (2016: US$13 million).
The Group does not hold other credit enhancements over these balances nor does it have a legal right of offset against any amounts
owed by the Group to the counterparty. The average debtor days is 23 (2016: 21).
The Group has recognised an allowance for credit losses of US$3,6 million (2016: US$2,7 million) based on the historical past default
performance of the counterparty and the analysis of the counterparty financial position.
Before accepting any new customer the Group uses a credit scoring system to assess the potential customer’s credit quality and
define the credit limits by customer. Limits and customer performance are reviewed regularly. During the year 79% (2016: 80%) of
receivables are neither past due nor impaired.
Trade receivables disclosed above include amounts (see below for age analysis) that are past due but at the end of the reporting
period for which the Group has not recognised an allowance for credit losses because there has not been a significant change in
credit quality and the amounts are still considered recoverable.
2017 2016 US$’000 US$’000
60-90 days 1 425 279
Over 90 days 3 502 3 933
Movement in the allowance of doubtful receivables Balance at the beginning of the year 3 876 4 223
Impairment recognised on receivables 3 645 2 652
Amounts written off during the year as uncollectable — (2 950 )
Amounts recovered during the year (117 ) (49 )
Balance at the end of the year 7 404 3 876
In determining the recoverability of a trade receivable, the Group considers any change in the credit quality of the trade receivable
from the date the credit was initially granted up to the end of the reporting period. The concentration risk is limited due to the fact that
the customer base is large and unrelated.
2017 2016 US$’000 US$’000
Ageing of impaired trade receivables
Over 90 days 7 404 3 876

DELTA CORPORATION LIMITED Annual Report 2017 DELTA CORPORATION LIMITED Annual Report 2017
64 65
FOR THE YEAR ENDED 31 MARCH
NOTES TO THE FINANCIAL STATEMENTS (CONTINUED)
17. SHARE CAPITAL
17.1 AUTHORISED SHARE CAPITALAuthorised share capital comprises 1 400 000 000 ordinary shares of US$0,01 (one US cent) per share.
17.2 ORDINARY SHARES ISSUED AND FULLY PAID
2017 2016 Number of shares Number of shares in millions in millions
At beginning of year 1 231 1 237
Exercise of share options 1 2
Share buy back (10 ) (7 )
At end of year 1 222 1 232
17.3 UNISSUED SHARESSubject to the limitations imposed by the Companies Act (Chapter 24:03), in terms of a special resolution of the Company in the
General Meeting, the unissued share capital comprising 156 595 876 (2016: 155 686 025) ordinary shares has been placed at the
disposal of the directors for an indefinite period.
17.4 SHARES UNDER OPTIONThe directors are empowered to grant share options to certain employees of the Group. These options are exercisable for a period of
ten years at a price determined by the middle market price ruling on the Zimbabwe Stock Exchange on the day prior to the granting
of the options. Each employee share option converts into one ordinary share of Delta Corporation Limited on exercise. No amounts
are paid or payable by the recipient on receipt of the option. The number of shares subject to option is approved by shareholders in
a General Meeting, and the number of options granted is calculated in accordance with the performance-based formula approved by
the Remuneration Committee. The numbers of share options are limited in line with the Zimbabwe Stock Exchange (ZSE) regulations.
Details of the number of shares under option outstanding during the year are as follows:
Number Number of Shares of Shares Subscription 2017 2016 Date of Grant Date of expiry Prices US$ ‘000 ‘000
1 March 2009 1 March 2019 0,150 520 520
8 May 2009 8 May 2019 0,150 150 165
2 January 2010 2 January 2020 0,505 56 56
3 January 2011 3 January 2021 0,636 1 101 1 121
3 November 2011 3 November 2021 0,746 2 828 3 036
2 August 2012 2 August 2022 0,680 7 026 7 945
1 June 2013 1 June 2023 1,450 5 195 5 195
1 June 2014 1 June 2024 1,148 6 255 6 255
Total options 23 131 24 293
12 February 2016 13 February 2026 0,525 7 528 7 616
6 May 2016 6 May 2026 0,730 9 702 —
Total Share Incentives 40 361 31 909
FOR THE YEAR ENDED 31 MARCH
NOTES TO THE FINANCIAL STATEMENTS (CONTINUED)
17. SHARE CAPITAL (CONTINUED)
17.4 SHARES UNDER OPTION (CONTINUED)
2017 2016 ‘000 ‘000
Movements in share options during the year: Outstanding at beginning of year 31 909 26 038
New options/SARS granted during year 9 702 7 616
Exercised during year (1 250 ) (1 745 )
Outstanding at end of year 40 361 31 909
All options expire, if not exercised, ten years after the date of grant.
The weighted average price of exercise of share options and the weighted average stock exchange price on the date of exercise were
US$0,69 (2016: US$0,69) and US$0,94 (2016: US$0,94) respectively. No shares were forfeited in 2017 (2016: 0 shares).
Share options granted under the employee share option plan carry no rights to dividends and no voting rights.
In terms of the Company share option scheme, options were granted on 1 June 2014. The estimated fair value of the options granted
on this date was US$2,6 million. The options granted mature after three years and, accordingly, the fair value will be amortised over
that period. The Group recognised total expenses of US$ 1,6 million (2016: US$1,8 million) in respect of share options in issue.
The fair value of the options granted in the current year was calculated using the Black-Scholes option pricing model as adjusted for
dividends by Robert Merton, and the following weighted average assumptions were made.
Date of Issue MAY FEBRUARY 2016 2016
Grant date share price – US$ 0,7297 0,525
Exercise price per share – US$ 0,7297 0,525
Expected volatility Variable 25%
Dividend yield 3,6% 2,5%
Risk-free interest rate 5% 4%
In prior years, expected volatility and dividend yield was determined by reference to an entity in a similar industry (SABMiller) and
market due to the circumstances that prevailed in the country. Ordinarily the historical volatility of the Company’s share over four
years and dividend yield realised was the basis of calculation. The expected life was based on experience over a ten year period, but
the life used in the model has been adjusted, based on management’s best estimates, for the effects of non-transferability, exercise
restrictions as regards closed periods and behavioural considerations. The weighted average value took into account an expected 0%
level of forfeiture.
Expected volatility is based on the Company’s historical share price volatility since dollarisation.

DELTA CORPORATION LIMITED Annual Report 2017 DELTA CORPORATION LIMITED Annual Report 2017
66 67
FOR THE YEAR ENDED 31 MARCH
NOTES TO THE FINANCIAL STATEMENTS (CONTINUED)
17. SHARE CAPITAL (CONTINUED)
17.5 SHARE BUY BACK
The effect of the cost of the share buy back (treasury shares) has been debited to reserves. The cost of the shares bought back
during the year to March 2017 was US$7,2 million – 9 903 281 shares (2016: US$6,1 million – 7 317 320 shares). The Company held a
total of 21 358 025 (2016: 13 376 978) of its own shares as treasury stock.
18. DIRECTORS’ SHAREHOLDINGS
In both current and prior year, the Directors held directly and indirectly the following number of shares in the Company:
2017 2016
M J Bowman — 33 481
C C Jinya 4 431 4 431
H C Sadza 764 764
M M Valela 4 833 350 4 066 250
4 838 545 4 104 926
No changes in Directors’ shareholdings have occurred between the financial year end and 5 May 2017, being the date of the last
meeting of the Directors.
19. BORROWINGS
2017 2016 US$’000 US$’000
19.1 LONG-TERM BORROWINGS-AMORTISED COST
At beginning of year 65 000 70 000
Repayment (5 000 ) (5 000 )
Transfer to short-term borrowings (60 000 ) —
Balance at end of year — 65 000
19.2 SHORT-TERM BORROWINGS-AMORTISED COST
At beginning of year — —
Transfer from long-term borrowings 60 000 —
Balance at end of year 60 000 —
Borrowings, which are unsecured, form part of the core borrowings of the Group and are renewed on maturity in terms of ongoing
facilities negotiated with the relevant financial institutions. In terms of a resolution of the Company in a general meeting, borrowings
shall not exceed, in aggregate, shareholders’ equity, which amounts to US$503,9 million.
The outstanding balances are repayable within twelve months.
FOR THE YEAR ENDED 31 MARCH
NOTES TO THE FINANCIAL STATEMENTS (CONTINUED)
20. TRADE, OTHER PAYABLES AND PROVISIONS
2017 2016 US$’000 US$’000
20.1 TRADE AND OTHER PAYABLES Trade payables 30 967 11 063
Accruals and other payables 37 437 54 209
68 404 65 272
The carrying amount of trade and other payables is approximately equal to their fair values.
The average credit period on purchases of certain goods is 30 days. No interest is charged on the trade payables. The Group has financial risk management policies in place to ensure that all payables are paid within the pre-agreed credit terms.
20.2 PROVISIONS
2017 2016 US$’000 US$’000
Employee benefits 5 544 4 488
Containers in the market 14 388 16 683
19 932 21 171
Employee Containers in benefits the market
Balance at beginning of year 4 488 16 683
Additional provision recognised 1 056 —
Container market absorption movement — (2 295 )
Balance at end of year 5 544 14 388
* The provision for employee benefits represents annual leave entitlements and long service awards accrued.
** Containers in the market is the estimated value of the returnable containers population in the market and the Group’s obligation to re-purchase these containers for re-use. Refer to note 4.9 for further details.
21. CASH FLOW INFORMATION
2017 2016 US$’000 US$’000
21.1 CASH GENERATED FROM OPERATING ACTIVITIESOperating income 82 044 96 072
Depreciation 30 714 32 856
Loss on disposal of property, plant and equipment 144 868
Share option expense 1 643 1 797
Other non cash items 474 6 106
115 019 137 699

DELTA CORPORATION LIMITED Annual Report 2017 DELTA CORPORATION LIMITED Annual Report 2017
68 69
FOR THE YEAR ENDED 31 MARCH
NOTES TO THE FINANCIAL STATEMENTS (CONTINUED)
21. CASH FLOW INFORMATION (CONTINUED)
2017 2016 US$’000 US$’000
21.2 INCREASE/(DECREASE) IN WORKING CAPITALDecrease in inventories 8 678 11 831
Decrease in receivables and other assets 7 350 1 541
Decrease in obligation for containers in the market (2 295 ) (4 607 )
Increase in trade and other payables 4 187 4 111
17 920 12 876
21.3 INCOME TAXATION PAIDBalance at beginning of year (8 063 ) (8 301 )
Current and withholding tax (Ref note 11.1) (17 343 ) (18 769 )
(Net tax asset) / liability at end of year (3 729 ) 8 063
Income taxation paid (29 135 ) (19 007 )
* The tax asset is a net of the current tax asset of US$5 598 and the tax liability of
US$1 869 as shown per consolidated statement of financial position.
21.4 DIVIDEND PAID By the company: Proposed dividend at the beginning of year (40 621 ) (28 440 )
Current year dividends (Ref note 22) (66 627 ) (57 917 )
Balance at end of year 58 086 40 621
Payment of dividends (49 162 ) (45 736 )
21.5 MOVEMENTS IN LONG TERM BORROWINGSBalance at beginning of year 65 000 70 000
Transfer to short-term loan (60 000 ) —
Amount repaid (5 000 ) (5 000 )
Balance at end of year — 65 000
21.6 MOVEMENTS IN SHORT TERM BORROWINGSBalance at beginning of year — —
Transfer from long-term loan 60 000 —
Amount repaid — —
Balance at end of year 60 000 —
21.7 INCREASE IN SHAREHOLDER FUNDING Proceeds of shares issued: By the Company – share options exercised 795 1 205
795 1 205
21.8 CASH AND CASH EQUIVALENTSMade up as follows: Bank balances and cash 173 334 166 016
173 334 166 016
FOR THE YEAR ENDED 31 MARCH
NOTES TO THE FINANCIAL STATEMENTS (CONTINUED)
22. DIVIDENDS
2017 2016 2017 2016 US Cents US Cents US$’000 US$’000
Interim 3,00 2,35 36 736 28 990
Final – proposed 2,45 2,35 29 891 28 927
5,45 4,70 66 627 57 917
23. RELATED PARTY TRANSACTIONS
23.1 PARTIES WITH SIGNIFICANT INFLUENCE OVER THE GROUPThe entities and individuals known to be significant shareholders (owning more than 5% of a class of equity) of Delta Corporation
Limited are shown on page 97 of this report.
AB Inbev Group entities are considered to be related parties of the Group by virtue of its 40% equity shareholding. Details of the
transactions are shown below.
23.2 RELATED PARTY TRANSACTIONSBalances and transactions between the Company and its subsidiaries, which are related parties, have been eliminated on
consolidation and are not disclosed in this note. Details of transactions between Group companies and other related parties are
disclosed below.
Royalties, Amounts Amounts Purchases Technical & Rental Owed by Owed to of goods other fees payments Related parties related parties US$’000 US$’000 US$’000 US$’000 US$’000 2017
AB InBev Companies 94 273 8 130 — — (28 741 )
Associates 5 061 — — — (22 )
Delta Pension Fund — — 288 — —
99 334 8 130 288 — (28 763 )
2016
SABMiller Companies 33 806 10 541 — — (5 745 )
Associates 20 926 — — 146 (315 )
Delta Pension Fund — — 290 — —
54 732 10 541 290 146 (6 060 )
During the course of the year Dube Manikai and Hwacha, a law firm in which the Group Chairman is a partner, provided legal services
to the Group amounting to US$0,096 million (2016: US$0,122 million).
Transactions with related parties are carried out at arm’s length. The amounts outstanding are unsecured and will be settled on
normal terms. No expense has been recognised in the current or prior periods for bad or doubtful debts in respect of the amounts
owed by related parties.

DELTA CORPORATION LIMITED Annual Report 2017 DELTA CORPORATION LIMITED Annual Report 2017
70 71
FOR THE YEAR ENDED 31 MARCH
NOTES TO THE FINANCIAL STATEMENTS (CONTINUED)
23. RELATED PARTY TRANSACTIONS (CONTINUED)
23.3 REMUNERATION OF DIRECTORS AND OTHER KEY MANAGEMENTThe remuneration of Directors and other members of key management during the year was as follows:
2017 2016 US$’000 US$’000
Short-term benefits 3 477 4 655
Post-employment benefits 478 486
Share based payments 1 162 1 213
5 117 6 354
Included in the above amounts are the following in respect of Directors’ emoluments:
For services as directors 226 167
For managerial services 1 334 2 480
1 560 2 647
23.4 SUBSIDIARIES, ASSOCIATES AND JOINT VENTURES
Name Country of Principal activity Effective Interest
Incorporation 2017 2016
Delta Beverages (Private) Limited Zimbabwe Beverages Manufacture 100% 100%
National Breweries Limited Zimbabwe Dormant 100% 100%
Chibuku Breweries Limited Zimbabwe Dormant 100% 100%
United Bottlers (Private) Limited Zimbabwe Dormant 100% 100%
Bevcool (Private) Limited Zimbabwe Dormant 100% 100%
Polycon Converters (Private) Limited Zimbabwe Dormant 100% 100%
Matchwell Investments (Private) Limited Zimbabwe Dormant 100% 100%
Headend (Private) Limited Zimbabwe Dormant 92% 92%
Food & Industrial Processors (Private) Limited Zimbabwe Starch Distributor 49% 49%
Schweppes Holdings Africa Limited Zimbabwe Beverages Manufacture 49% 49%
Afdis Holdings Limited / Afdis Limited Zimbabwe Beverages Manufacture 38% 38%
Mandel Training Centre (Private) Limited Zimbabwe Training 26% 26%
Nampak Zimbabwe Limited Zimbabwe Plastics & Paper Manufacture 21% 21%
PetrecoZim (Private) Limited Zimbabwe Plastics Recycling 15% 15%
Food & Industrial Processors is a starch distribution entity and the investment was written off in prior years. The Group does not have
significant influence over the investee as they do not participate in the policy making process. The investment has been considered
immaterial.
PetrecoZim is a PET plastic recycling entity which the Group invested in as part of the post-consumer waste management initiative
in line with its sustainable development framework. The Group does not expect to derive any future economic benefits from this
investment and does not wield significant influence and as such all contributions towards the investment have been written off and
are considered immaterial to the Group.
FOR THE YEAR ENDED 31 MARCH
NOTES TO THE FINANCIAL STATEMENTS (CONTINUED)
24. COMMITMENTS FOR CAPITAL EXPENDITURE
2017 2016 US$’000 US$’000
Contracts and orders placed 2 500 19 623
Authorised by directors but not contracted 34 889 27 283
37 389 46 906
The capital expenditure is to be financed out of the Group’s own resources and existing borrowing facilities.
25. PENSION FUNDS
Group operating companies and all employees contribute to one or more of the following independently administered pension funds.
25.1 DELTA GROUP PENSION FUNDAll Group employees are members of the Delta Beverages Pension Fund. The funds are independently administered defined
contribution funds and are, accordingly, not subject to actuarial valuations.
25.2 NATIONAL SOCIAL SECURITY AUTHORITY SCHEMEThis is a defined contribution scheme promulgated under the National Social Security Authority Act 1989. The Group’s obligations
under the scheme are limited to specific contributions legislated from time to time. These are presently 3,5% of pensionable
emoluments up to a maximum of US$700 per month for each employee.
2017 2016 US$’000 US$’000
25.3 PENSION COSTS RECOGNISED AS AN EXPENSE FOR THE YEAR
Delta Group Pension Fund 4 220 4 409
National Social Security Authority Scheme 1 037 964
5 257 5 373
26. FINANCIAL RISK MANAGEMENT
26.1 TREASURY RISK MANAGEMENTThe Group Management Committee, consisting of senior executives of the Group, meets on a regular basis to analyse, amongst other
matters, currency and interest rate exposures and re-evaluate treasury management strategies against revised economic forecasts.
Compliance with Group policies and exposure limits is reviewed at quarterly Board meetings.
26.2 FOREIGN CURRENCY MANAGEMENTExposure to exchange rate fluctuations and foreign loans is limited by Group treasury policy and is monitored by the Group
Management Committee. Operating subsidiaries manage short-term currency exposures relating to trade imports and exports within
approved parameters.

DELTA CORPORATION LIMITED Annual Report 2017 DELTA CORPORATION LIMITED Annual Report 2017
72 73
FOR THE YEAR ENDED 31 MARCH
NOTES TO THE FINANCIAL STATEMENTS (CONTINUED)
26. FINANCIAL RISK MANAGEMENT (CONTINUED)
26.2 FOREIGN CURRENCY MANAGEMENT (CONTINUED)
The carrying amounts of the Group’s foreign currency denominated monetary assets and liabilities at the end of the reporting period
were as follows:
Liabilities Assets Net exposure
2017 2016 2017 2016 2017 2016 US$’000 US$’000 US$’000 US$’000 US$’000 US$’000
Euro (190 ) (610 ) 1 480 667 1 290 57
Rand (7 166 ) (2 976 ) 134 1 159 (7 032 ) 1 818
The following table details the Group’s sensitivity to a 10% and 22% increase in the United States Dollar against the Euro and South
African Rand respectively. The 22% and 10% represents management’s assessment of the reasonably possible change in foreign
exchange rates. The sensitivity analysis includes only outstanding foreign currency denominated monetary items and adjusts their
translation at the period end for a percentage change in foreign currency rates. A positive number below indicates an increase in
profit where the United States Dollar strengthens or weakens in a favourable manner against the net exposure.
Euro Impact Rand Impact
2017 2016 2017 2016 US$’000 US$’000 US$’000 US$’000
(Loss)/Profit (129 ) (6 ) 1 547 400
26.3 INTEREST RISK MANAGEMENTGroup policy is to adopt a non-speculative approach to managing interest rate risk. Approved funding instruments include bankers’
acceptances, call loans, overdrafts, commercial paper, foreign loans and where appropriate, long-term loans. Approved investment
instruments include fixed and call deposits. The risk is limited as there are no variable/floating rate instruments held.
26.4 LIQUIDITY RISK MANAGEMENTThe Group has established an appropriate liquidity risk management framework for the management of the Group’s short, medium-
and long-term funding and liquidity management requirements. The Group manages liquidity risk by maintaining adequate reserves,
banking facilities and reserve borrowing facilities, by continuously monitoring forecast and actual cash flows, and by matching the
maturity profiles of financial assets and liabilities.
FOR THE YEAR ENDED 31 MARCH
NOTES TO THE FINANCIAL STATEMENTS (CONTINUED)
26. FINANCIAL RISK MANAGEMENT (CONTINUED)
26.4 LIQUIDITY RISK MANAGEMENT (CONTINUED)
Liquidity and Interest rate tablesThe following tables detail the Group’s remaining contractual maturity for its financial liabilities with agreed repayment periods and
fixed interest rates. There are no financial liabilities with floating rates. The tables have been drawn up based on the undiscounted
cash flows of financial liabilities based on the earliest date on which the Group can be required to pay. The tables include both interest
and principal cash flows. All interest rate cash flows are fixed in nature. The contractual maturity is based on the earliest date on
which the Group may be required to pay.
Weighted average effective 0-2 2-12 12-36 interest rate months months months Total % US$’000 US$’000 US$’000 US$’000 31 March 2017Fixed interest rate instruments 7,5 — 60 000 — 60 000Trade and other payables — 59 015 — — 59 015 59 015 60 000 — 119 015
31 March 2016Fixed interest rate instruments 7,5 — — 65 000 65 000Trade and other payables — 65 272 — — 65 272 65 272 — 65 000 130 272
The Group has access to financing facilities of which US$10 million were unused at the end of the reporting period. The Group expects
to meet its other obligations from operating cash flows.
2017 2016 US$’000 US$’000
FINANCING FACILITIES
Unsecured bank loan facility with various maturity dates through to November 2017 and of which: Total available 70 000 80 000
Amount used (60 000 ) (65 000 )
Amount unused 10 000 15 000
The directors consider that the carrying amounts of financial assets and financial liabilities in the financial statements approximate
their fair values.
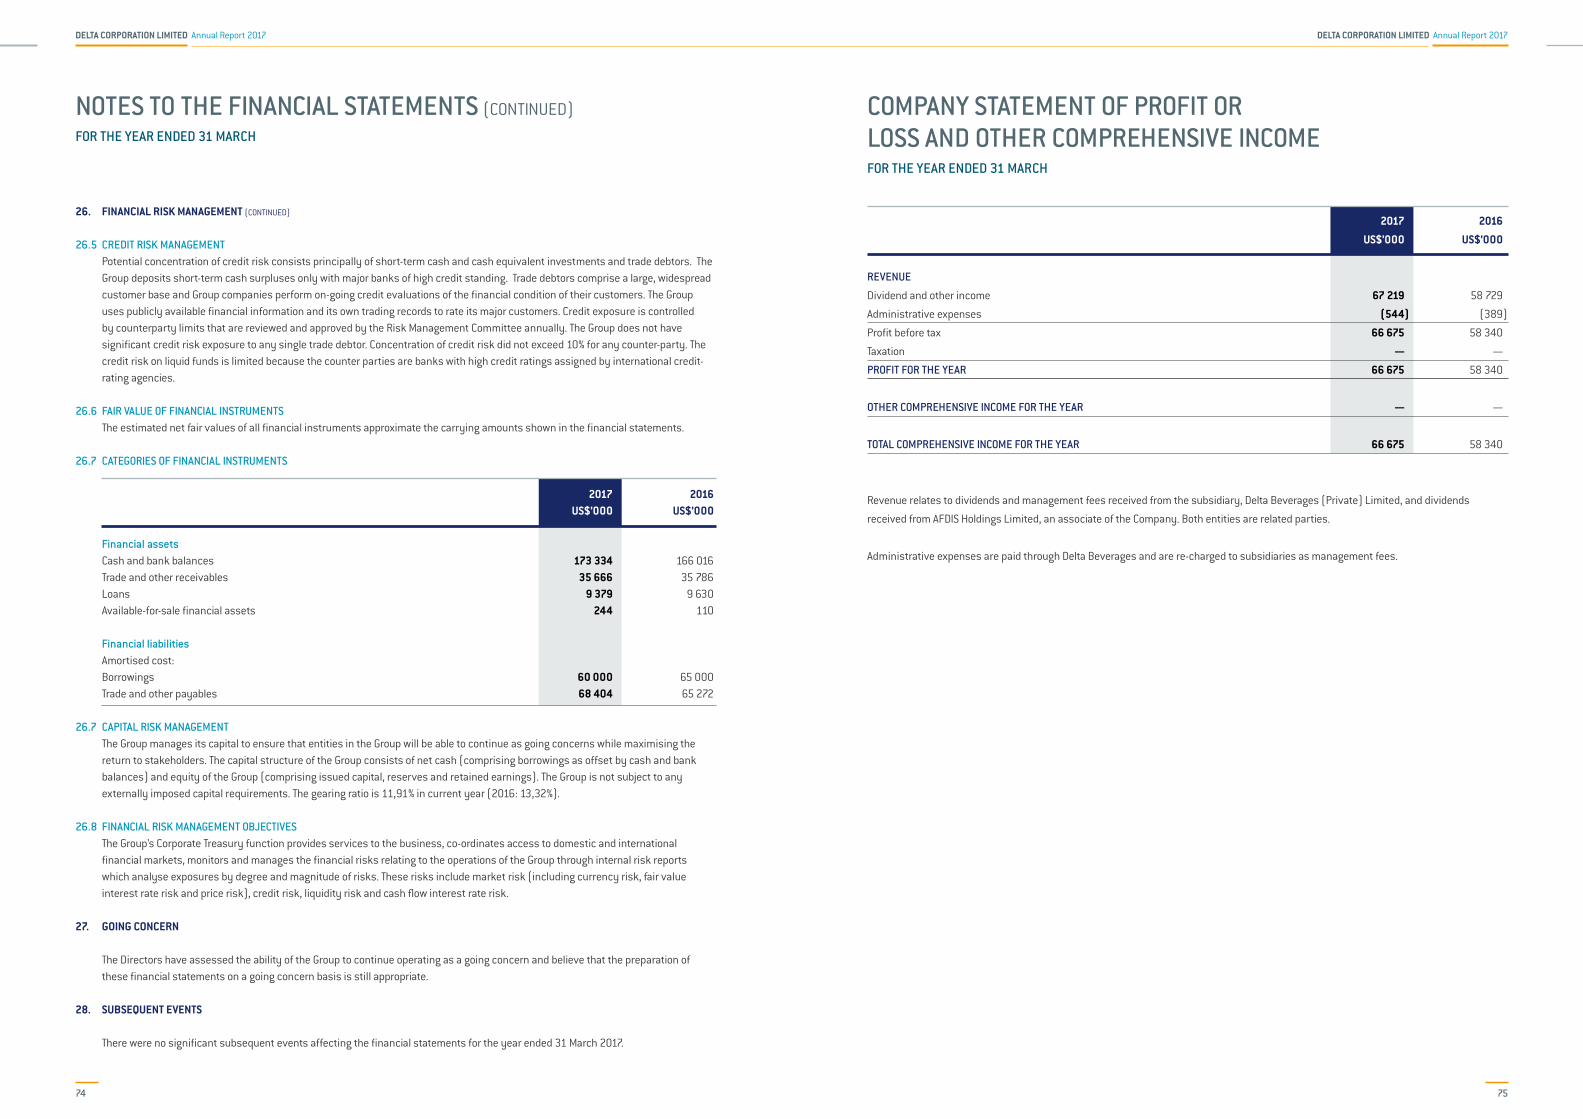
DELTA CORPORATION LIMITED Annual Report 2017 DELTA CORPORATION LIMITED Annual Report 2017
74 75
FOR THE YEAR ENDED 31 MARCH
NOTES TO THE FINANCIAL STATEMENTS (CONTINUED)
26. FINANCIAL RISK MANAGEMENT (CONTINUED)
26.5 CREDIT RISK MANAGEMENTPotential concentration of credit risk consists principally of short-term cash and cash equivalent investments and trade debtors. The Group deposits short-term cash surpluses only with major banks of high credit standing. Trade debtors comprise a large, widespread customer base and Group companies perform on-going credit evaluations of the financial condition of their customers. The Group uses publicly available financial information and its own trading records to rate its major customers. Credit exposure is controlled by counterparty limits that are reviewed and approved by the Risk Management Committee annually. The Group does not have significant credit risk exposure to any single trade debtor. Concentration of credit risk did not exceed 10% for any counter-party. The credit risk on liquid funds is limited because the counter parties are banks with high credit ratings assigned by international credit-rating agencies.
26.6 FAIR VALUE OF FINANCIAL INSTRUMENTSThe estimated net fair values of all financial instruments approximate the carrying amounts shown in the financial statements.
26.7 CATEGORIES OF FINANCIAL INSTRUMENTS 2017 2016 US$’000 US$’000 Financial assets Cash and bank balances 173 334 166 016Trade and other receivables 35 666 35 786Loans 9 379 9 630Available-for-sale financial assets 244 110 Financial liabilities Amortised cost: Borrowings 60 000 65 000Trade and other payables 68 404 65 272
26.7 CAPITAL RISK MANAGEMENTThe Group manages its capital to ensure that entities in the Group will be able to continue as going concerns while maximising the return to stakeholders. The capital structure of the Group consists of net cash (comprising borrowings as offset by cash and bank balances) and equity of the Group (comprising issued capital, reserves and retained earnings). The Group is not subject to any externally imposed capital requirements. The gearing ratio is 11,91% in current year (2016: 13,32%).
26.8 FINANCIAL RISK MANAGEMENT OBJECTIVESThe Group’s Corporate Treasury function provides services to the business, co-ordinates access to domestic and international financial markets, monitors and manages the financial risks relating to the operations of the Group through internal risk reports which analyse exposures by degree and magnitude of risks. These risks include market risk (including currency risk, fair value interest rate risk and price risk), credit risk, liquidity risk and cash flow interest rate risk.
27. GOING CONCERN
The Directors have assessed the ability of the Group to continue operating as a going concern and believe that the preparation of these financial statements on a going concern basis is still appropriate.
28. SUBSEQUENT EVENTS
There were no significant subsequent events affecting the financial statements for the year ended 31 March 2017.
FOR THE YEAR ENDED 31 MARCH
COMPANY STATEMENT OF PROFIT OR LOSS AND OTHER COMPREHENSIVE INCOME
2017 2016
US$’000 US$’000
REVENUE
Dividend and other income 67 219 58 729
Administrative expenses (544 ) (389 )
Profit before tax 66 675 58 340
Taxation — —
PROFIT FOR THE YEAR 66 675 58 340
OTHER COMPREHENSIVE INCOME FOR THE YEAR — —
TOTAL COMPREHENSIVE INCOME FOR THE YEAR 66 675 58 340
Revenue relates to dividends and management fees received from the subsidiary, Delta Beverages (Private) Limited, and dividends
received from AFDIS Holdings Limited, an associate of the Company. Both entities are related parties.
Administrative expenses are paid through Delta Beverages and are re-charged to subsidiaries as management fees.

DELTA CORPORATION LIMITED Annual Report 2017 DELTA CORPORATION LIMITED Annual Report 2017
76 77
AT 31 MARCH
COMPANY STATEMENT OF FINANCIAL POSITION
2017 2016 Notes US$’000 US$’000
ASSETS
Non-current Assets
Interest in associated companies 13, E 19 563 19 563
Interest in subsidiaries A 255 87
Other investments 134 —
19 952 19 650
Current Assets Loans to subsidiaries B 87 806 64 620
Trade and other receivables C 30 668 41 398
118 474 106 018
Total Assets 138 426 125 668
EQUITY AND LIABILITIES
Capital and Reserves
Share capital 12 222 12 310
Share premium 32 044 33 074
Share options reserve 7 389 5 985
Retained earnings 85 321 72 854
Total Equity 136 976 124 223
Current Liabilities
Trade and other payables D 1 450 1 445
Total Equity and Liabilities 138 426 125 668
The financial statements were approved by the Board and authorised for issue on 5 May 2017.
A. INTEREST IN SUBSIDIARIESDetails of all subsidiaries are provided in the Group structure included on note 23.4. This is an interest in Delta Beverages (Private) Limited, National Breweries, United Bottlers and Chibuku Breweries recognised at cost.
B. LOANS TO SUBSIDIARIESLoans to subsidiaries relate to loans issued to Delta Beverages (Private) Limited. The loans do not have fixed repayment dates and have nil interest. There are no amounts that are past due or impaired.
C. TRADE AND OTHER RECEIVABLES Receivables relate to dividends owing from the subsidiary Delta Beverages (Private) Limited as well as dividends paid over to the share transfer secretaries, but not yet distributed to shareholders. There are no amounts that are past due or impaired.
D. TRADE AND OTHER PAYABLESOutstanding dividends are those which have been declared but not collected by the shareholders from the share transfer secretaries.
E. INTEREST IN ASSOCIATED COMPANIES Associated companies relate to investments in Afdis Holdings Limited and Nampak Zimbabwe Limited disclosed in note 13. These are recognised at cost.
F. ACCOUNTING POLICIES The Company financial statements have been prepared in accordance with the policies detailed in notes 1 to 4 of this Annual Report.
FOR THE YEAR ENDED 31 MARCH
COMPANY STATEMENT OF CHANGES IN EQUITY
Share
Share Share options Retained Total
capital premium reserve earnings equity
Notes US$’000 US$’000 US$’000 US$’000 US$’000
At 1 April 2015 12 366 32 234 4 531 65 587 114 718
Profit for the year — — — 58 340 58 340
Other Comprehensive income for the year, net of tax — — — — —
Total Comprehensive Income for the year — — — 58 340 58 340
Transactions with owners:
Share options exercised 17 1 188 — — 1 205
Share buy back 17.5 (73 ) (348 ) — (5 680 ) (6 101 )
Transfer from share options reserves — — (343 ) 343 —
Recognition of share based payments 9.1 — — 1 797 — 1 797
Payment of dividends 21.4 — — — (45 736 ) (45 736 )
At 1 April 2016 12 310 33 074 5 985 72 854 124 223
Profit for the year — — — 66 675 66 675
Other comprehensive income for the year, net of tax — — — — —
Total Comprehensive Income for the year — — — 66 675 66 675
Transactions with owners:
Share options exercised 12 783 — — 795
Share buy back 17.5 (100 ) (1 813 ) — (5 285 ) (7 198 )
Transfer from share options reserves — — (239 ) 239 —
Recognition of share based payments 9.1 — — 1 643 — 1 643
Payment of dividends 21.4 — — — (49 162 ) (49 162 )
At 31 March 2017 12 222 32 044 7 389 85 321 136 976
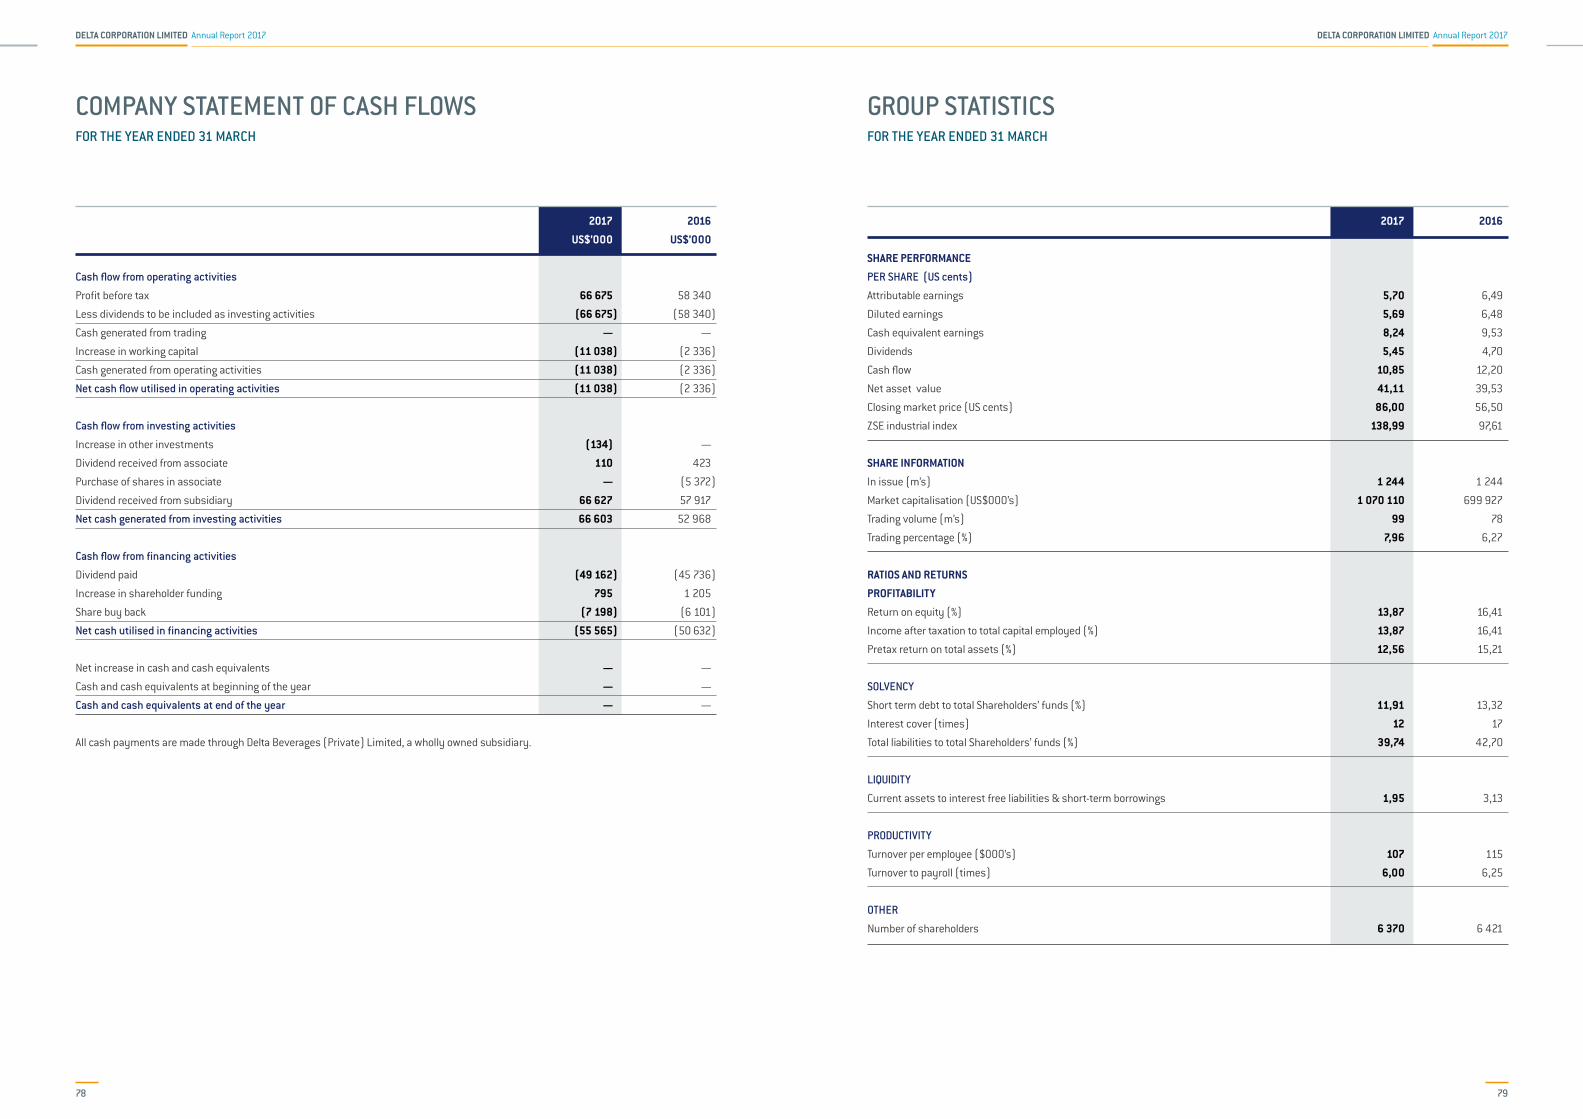
DELTA CORPORATION LIMITED Annual Report 2017 DELTA CORPORATION LIMITED Annual Report 2017
78 79
FOR THE YEAR ENDED 31 MARCH
COMPANY STATEMENT OF CASH FLOWS
2017 2016
US$’000 US$’000
Cash flow from operating activities
Profit before tax 66 675 58 340
Less dividends to be included as investing activities (66 675 ) (58 340 )
Cash generated from trading — —
Increase in working capital (11 038 ) (2 336 )
Cash generated from operating activities (11 038 ) (2 336 )
Net cash flow utilised in operating activities (11 038 ) (2 336 )
Cash flow from investing activities
Increase in other investments (134) —
Dividend received from associate 110 423
Purchase of shares in associate — (5 372 )
Dividend received from subsidiary 66 627 57 917
Net cash generated from investing activities 66 603 52 968
Cash flow from financing activities
Dividend paid (49 162 ) (45 736 )
Increase in shareholder funding 795 1 205
Share buy back (7 198 ) (6 101 )
Net cash utilised in financing activities (55 565 ) (50 632 )
Net increase in cash and cash equivalents — —
Cash and cash equivalents at beginning of the year — —
Cash and cash equivalents at end of the year — —
All cash payments are made through Delta Beverages (Private) Limited, a wholly owned subsidiary.
FOR THE YEAR ENDED 31 MARCH
GROUP STATISTICS
2017 2016
SHARE PERFORMANCE
PER SHARE (US cents)
Attributable earnings 5,70 6,49
Diluted earnings 5,69 6,48
Cash equivalent earnings 8,24 9,53
Dividends 5,45 4,70
Cash flow 10,85 12,20
Net asset value 41,11 39,53
Closing market price (US cents) 86,00 56,50
ZSE industrial index 138,99 97,61
SHARE INFORMATION
In issue (m’s) 1 244 1 244
Market capitalisation (US$000’s) 1 070 110 699 927
Trading volume (m’s) 99 78
Trading percentage (%) 7,96 6,27
RATIOS AND RETURNS
PROFITABILITY
Return on equity (%) 13,87 16,41
Income after taxation to total capital employed (%) 13,87 16,41
Pretax return on total assets (%) 12,56 15,21
SOLVENCY
Short term debt to total Shareholders’ funds (%) 11,91 13,32
Interest cover (times) 12 17
Total liabilities to total Shareholders’ funds (%) 39,74 42,70
LIQUIDITY
Current assets to interest free liabilities & short-term borrowings 1,95 3,13
PRODUCTIVITY
Turnover per employee ($000’s) 107 115
Turnover to payroll (times) 6,00 6,25
OTHER
Number of shareholders 6 370 6 421

DELTA CORPORATION LIMITED Annual Report 2017 DELTA CORPORATION LIMITED Annual Report 2017
80 81
SUSTAINABLE DEVELOPMENT REPORT
Our Group is a multi-beverage business with a focus on beer and
soft drinks. We do business in a way that improves livelihoods
and helps build communities. We do this by delivering to our
consumers refreshing and enjoyable high quality products.
In doing so, we create jobs, pay taxes, build skills; which
demonstrates that business growth and sustainable development
can be mutually reinforcing rather than be in conflict. In the
current year Delta generated more than US$563 million of
economic value as measured in terms of sales billings. We
distributed this value to employees, shareholders and investors,
lenders, suppliers, government and to local communities through
our various corporate social investment activities. The multiplier
effect of our investments and business operations through the
value chains is a catalyst for national development.
We know that many communities in which we operate across the
country face big challenges in their environments and societies,
which we share with them. We strive for a Better, Brighter World so
that as we strengthen our business we also contribute to society.
The challenges that we face require that we work in partnership
with others to find and implement solutions.
Our program borrowed from that of the former SABMiller Plc’s
Prosper framework which has now been integrated into the
Anheuser-Busch InBev’s (AB InBev) Better World strategy under
the theme “Bringing People Together for a Better World”. This
summarises the UN Sustainable Development Goals (SDGs) into
three pillars:
• A GROWING WORLD, where everyone has an opportunity to
improve their livelihood;
• A CLEANER WORLD, where natural resources are shared and
preserved for the future; and
• A HEALTHIER WORLD, where every experience with beer is a
positive one, for lives well lived.
We draw learnings from The Coca-Cola Company’s sustainability
framework that is known as “Me, We, World”. This program’s focus
goals are in the areas of personal well-being; women’s economic
empowerment; sustainable management of water, energy, and
packaging use; as well as sustainable sourcing of agricultural
ingredients.
OUR PURPOSE “...and growing our business sustainably for the betterment of our employees and communities”.We continue to adjust the key pillars of our sustainability framework to ensure their alignment to the UN Sustainable Development Goals (SDGs).
SUSTAINABLE DEVELOPMENT REPORT (CONTINUED)
The Company responds to disasters, provide humanitarian relief
as well as ad-hoc requests for donations. Where we can, we
support worthy causes in order to deliver positive change in the
communities where we operate. These programs are guided by the
Group’s ethics and donations policies which exclude donations to
certain areas such as:
• Political and religious organisations particularly projects that
are designed to facilitate the spread of their ideologies and
beliefs
• Individuals, commercial or profit-making businesses or
organisations
• Publications, exhibitions, marketing campaigns and general
research
• Sports sponsorships and music festivals except for the brand
led properties
GROWING WORLD
“We want a growing world where everyone has the opportunity to improve their livelihoods. And that means accelerating growth and social development across our value chain – from our growers to our retailers. We aim to build local programs that promote innovation, entrepreneurship and productivity.”
SUPPORTING LOCAL COMMUNITIESDelta Corporation is a truly Zimbabwean company with its
foundation routed in the local communities, with a history dating
back to 1898 when the brewery was established in Cameron street
in Harare. The Group is a significant contributor to the Zimbabwean
economy, providing direct employment to over 4 800 people and
indirectly by supporting livelihoods through both our upstream
and downstream value chain partners in sourcing inputs and the
distribution and retailing of our beverages. The multiplier effects of
our operations permeate through various facets of the Zimbabwean
economy, thereby creating wealth and improving the welfare of the
communities in which we work.
The Company continues to support the construction of learning
facilities at primary schools in marginalized areas; the project for
2016 was at Mutsamvu Primary School in Chimanimani - eastern
Zimbabwe. This initiative includes construction of model classroom
blocks, supply of furniture and other amenities. Communities are
encouraged to participate by contributing their labour to mould
bricks and supply water during construction in order to instil
a sense of ownership which is important for maintaining the
facilities.
The Company runs a bursary scheme to support gifted but under-
privileged students to enrol for A level and university studies, with
a current enrolment of 62 learners. We had a total of 5 learners
graduating from local universities in 2016. The alumni from this
scheme have been enlisted to become mentors under a Peer-to-
Peer Mentorship Program. This is a platform for former bursary
beneficiaries to encourage current beneficiaries to excel in their
endeavors.

DELTA CORPORATION LIMITED Annual Report 2017 DELTA CORPORATION LIMITED Annual Report 2017
82 83
SUSTAINABLE DEVELOPMENT REPORT (CONTINUED)
SUPPORTING WOMEN THROUGH THE COCA-COLA GLOBAL 5 BY 20 INITIATIVE As our share of the 5 by 20 Coca-Cola program to empower five
million women by year 2020 worldwide, we plan to recruit and train
over 5 000 women as part of the upgrading of the informal market
traders and small to medium enterprises. Over 1 000 women have
been trained so far.
The female managerial employees of the Coca-Cola system
in Zimbabwe participate in the local chapter of The Coca-Cola
Women’s Business Resource Group, Women’s linc, which is focused
on engaging, inspiring and developing the women of The Coca-
Cola Company to drive total business performance and establish
a strong reputation as a great place to work for women. The
program also challenges women to work for their communities as
volunteers. Women’s Linc Zimbabwe ran a “Feed a Child and Keep
Them in School” campaign in which food packs were donated to
Cheuchi Primary School in Mashonaland West province.
WHY AGRICULTURE MATTERS TO USAs a beverage manufacturer, we need agricultural crops to brew
our beers and as sweeteners of our soft drinks. We are creating
secure, sustainable supply chains both for malting barley, maize
and sorghum including key agricultural raw materials such
as sugar and juicing fruits. We are helping farmers increase
profitability, productivity and social development while reducing
environmental impact.
We support over 9 000 subsistence farmers to grow sorghum for
use in brewing our sorghum and Eagle Lager beer. The longstanding
barley contract scheme which was disrupted in 2015 resumed in
2016 with an intake of 10 063 tonnes of barley. The scheme has
been scaled down due to the depressed lager beer sales and the loss
of malt export markets due to uncompetitive barley and malt prices.
SUPPORTING SMALL RETAILERS The Retailer Development Programme is designed to equip our
retailers, particularly the small sized outlets, with basic business
management skills to help improve their businesses and incomes.
A total of 700 retailers were trained in 2016 covering the key
modules such as financial management, product handling,
understanding a beer business and responsible retailing and
environmental awareness. The company’s contribution to
the development of the retail sector was recognised by the
Confederation of Zimbabwe Retailers with a Corporate Social
Responsibility Award.
SUSTAINABLE DEVELOPMENT REPORT (CONTINUED)
HEALTHIER WORLD
We aspire for a healthier world where every experience with beer is a positive one. We are passionate about brewing great beers for our consumers to enjoy, but not all the drinking choices of our consumers are the right ones all the time. The harmful use of alcohol remains an issue of significant concern to governments, society and to us”
The majority of our consumers enjoy beer in moderation with
friends and families but there is a minority who drink too much,
putting themselves and people around them at risk of harm. Our
efforts include programs that shift social norms and behaviours
around harmful alcohol use and therefore empower consumers to
make smart drinking choices.
There is no simple solution to addressing alcohol related harm,
nor can the issue be resolved by a single company acting alone.
The industry and key stakeholders can work towards making a
difference; making sure the information about alcohol is accurate
and balanced, initiatives that combat drinking and driving,
underage drinking and disorderly conduct and that help is offered
to people that are at risk.
We believe that our policies on employee behaviour, commercial
communication, product labelling and the company-wide education
programmes reinforce high levels of conduct in relation to alcohol
consumption. The key programmes during the year included:
INFLUENCING SOCIAL NORMS AND BEHAVIOUR
RESPONSIBLE CONSUMPTION
Working with 11 universities in Zimbabwe under the BOOST Fellowship, Enactus under which tertiary students undertake projects that
communicate and advance behaviour change around alcohol in their communities and at their campuses.
UNDERAGE DRINKING (PLEDGE<18)
Pledge <18, Launched in 2015, is a programme that advocates against underage drinking while driving the commitment of young people
to this cause through signing their pledges. This also partners ZIMPACT, BOOST and National Blood Services.
OUR 6 CORE PRINCIPLES
1. Our beer adds to the enjoyment oflife for the overwhelming majority of our consumers.
2. We care about the harmful effects of irresponsible consumption.
3. Alcoholic drinks are for adults, andconsumption is a matter of individual judgement and accountability.
4. Information provided to consumers about alcohol consumption should be accurate and balanced.
5. We engage stakeholders and work withthem to address irresponsible consumption.
6. We expect our employees to aspire tohigh levels of conduct in relation to alcohol consumption.

DELTA CORPORATION LIMITED Annual Report 2017 DELTA CORPORATION LIMITED Annual Report 2017
84 85
TOGETHER FOR SAFER ROADS
RESPONSIBLE RETAILING AND CONSUMPTION
ROAD SAFETY
Road Safety remains topical in Zimbabwe particularly as it relates to traffic accidents attributed to human error and speeding, of which
the influence of alcohol is a notable factor. We therefore work collaboratively with our industry association, ZABMA and the Traffic Safety
Council of Zimbabwe in “Taming the Traffic Jungle”. The concept of a designated driver was successfully used at some musical events in a
partnership with ZIMPACT.
We intensified our Respect the Road campaign which is aimed at equipping our heavy and light motor vehicle drivers to deal with hazards
encountered behind the wheel, to keep them safer and contribute to overall road safety.
RESPONSIBLE RETAILING
• We enlist the support of our retailers in advocating for responsible alcohol consumption through our retailer training program.
• Collaboration with local authorities, the Liquor Licensing Board and the police to ensure compliance to the trading regulations.
• Contribution to development of alcohol policies.
• Guidance to retailers, advertising agents and the media on alcohol communication and advertising.
STRENGTHENING OUR INTERNAL GOVERNANCE SYSTEMS
• Training employees in the Alcohol Intelligence Quotient (AIQ)
and the Alcohol Behaviour & Communication (AB&C)
Programmes.
• Subjecting all marketing material to review by the compliance
committee which has an external and independent chairman.
• Introduction of the responsible drinking icons on adverts and
beer labels.
• Placing age gates on all websites that link to information
on alcoholic products and reference to the website
www.talkingalcohol.com.
In addition to the initiatives on alcoholic beverages we also have
specific programs that relate to our sparkling and nutritious
beverages. Our longstanding commitment to consumers’ well-
being begins with ensuring that each and every beverage we
deliver is safe, delicious and refreshing. Further, we work to
inspire consumers to pursue happier, healthier lives - and provide
opportunities to do so - through the wide variety of products we
offer, our transparent labeling practices, our responsible marketing
practices and the many physical activity programs we support
around the world.
SUSTAINABLE DEVELOPMENT REPORT (CONTINUED)
HEALTHIER WORLD (continued)
SUSTAINABLE DEVELOPMENT REPORT (CONTINUED)
We continued with the Make A Difference (MAD) campaign
which enlists the support of community groups in taking care
of the hygiene and cleanliness of the localities, discouraging
littering particularly by motorists and the segregation of waste
in the home. We are encouraging our employees to volunteer in
the clean-up campaigns.
• ELIMINATING WASTE FROM OUR PRODUCTION PROCESSES: A significant amount of the waste from our brewing operations
is organic material such as spent grains which are sold to
farmers as stock feed.
• REDUCING SUPPLY CHAIN EMISSIONS: Our production and
distribution processes use significant amounts of fossil
fuels and generate CO2 emissions. We continue to record and
analyse data on the levels of these emissions for comparison
to set benchmarks. There are ongoing collaborative efforts
across the supply chain to implement projects that reduce CO2
emissions.
• INJECTING CO2- BASED HFC-FREE COOLERS: We continue to
replace HFC refrigerants in our coolers; reducing global warming
potential and energy demand. This also includes use of solar
powered and low energy demand equipment.
• DRIVING EFFICIENCY: Each production centre tracks the usages
of water and energy against both internal and international
benchmarks as part of the business key performance
indicators. The key initiatives such as the light-weighting of
primary and secondary packaging, use of light weight trailers,
use of natural lighting, installation of energy management
devices and LED lighting have resulted in significant progress
in the various energy usage measures.
Cleaner World
Climate change has far-reaching consequences for our business and the communities where we live and work, from water scarcity and energy constraints to reduced food security and increased health risks. Our own factory emissions, the packaging and trade refrigeration of beverages, all have a significant carbon footprint. We therefore strive for a cleaner world where natural resources are shared and preserved for the future.
We will work with suppliers, distributors, retailers, municipalities
and consumers to reduce emissions and waste across our
value chain, and reuse and recycle waste and packaging and to
conserve water.
• RETURNABLE BOTTLES: EMBEDDING THE CULTURE OF REUSE.The Group believes in the use of returnable glass bottles as a
trusted and effective way to reduce the environmental impact
of our packaging as they are much more resource efficient than
the one-way packages such as cans and PET.
The growth of the contribution of sorghum beer packaged in
PET has increased the need for sustainable solutions to reduce
litter from used primary packages such as PET and cans. We are
working collaboratively with the environmental agency (EMA),
local authorities and other environmental groups to intensify
the education of consumers on segregation of litter, placement
of litter in bins and general consciousness on a cleaner
environment.
The consumer waste cages that have been installed at major
shopping centres are now being used to accumulate used cans
and PET. The used cans are crushed and pressed into tin cake
for export. The change over from steel to aluminium cans is
largely complete, which creates secondary usage of the used
cans. The PetrecoZim PET recycling factory is fully functional
and can absorb all material that is recovered and delivered to
it. This has now created income generating opportunities for
waste collectors.
� RETURNABLE PLASTIC 24%� RETURNABLE GLASS 30%� DRAUGHT BEER 0%� NON RETURNABLE PLASTIC 43%� NON RETURNABLE GLASS 1%� CANS 3%
VOLUME SPLIT BY PACK TYPE % (2017)
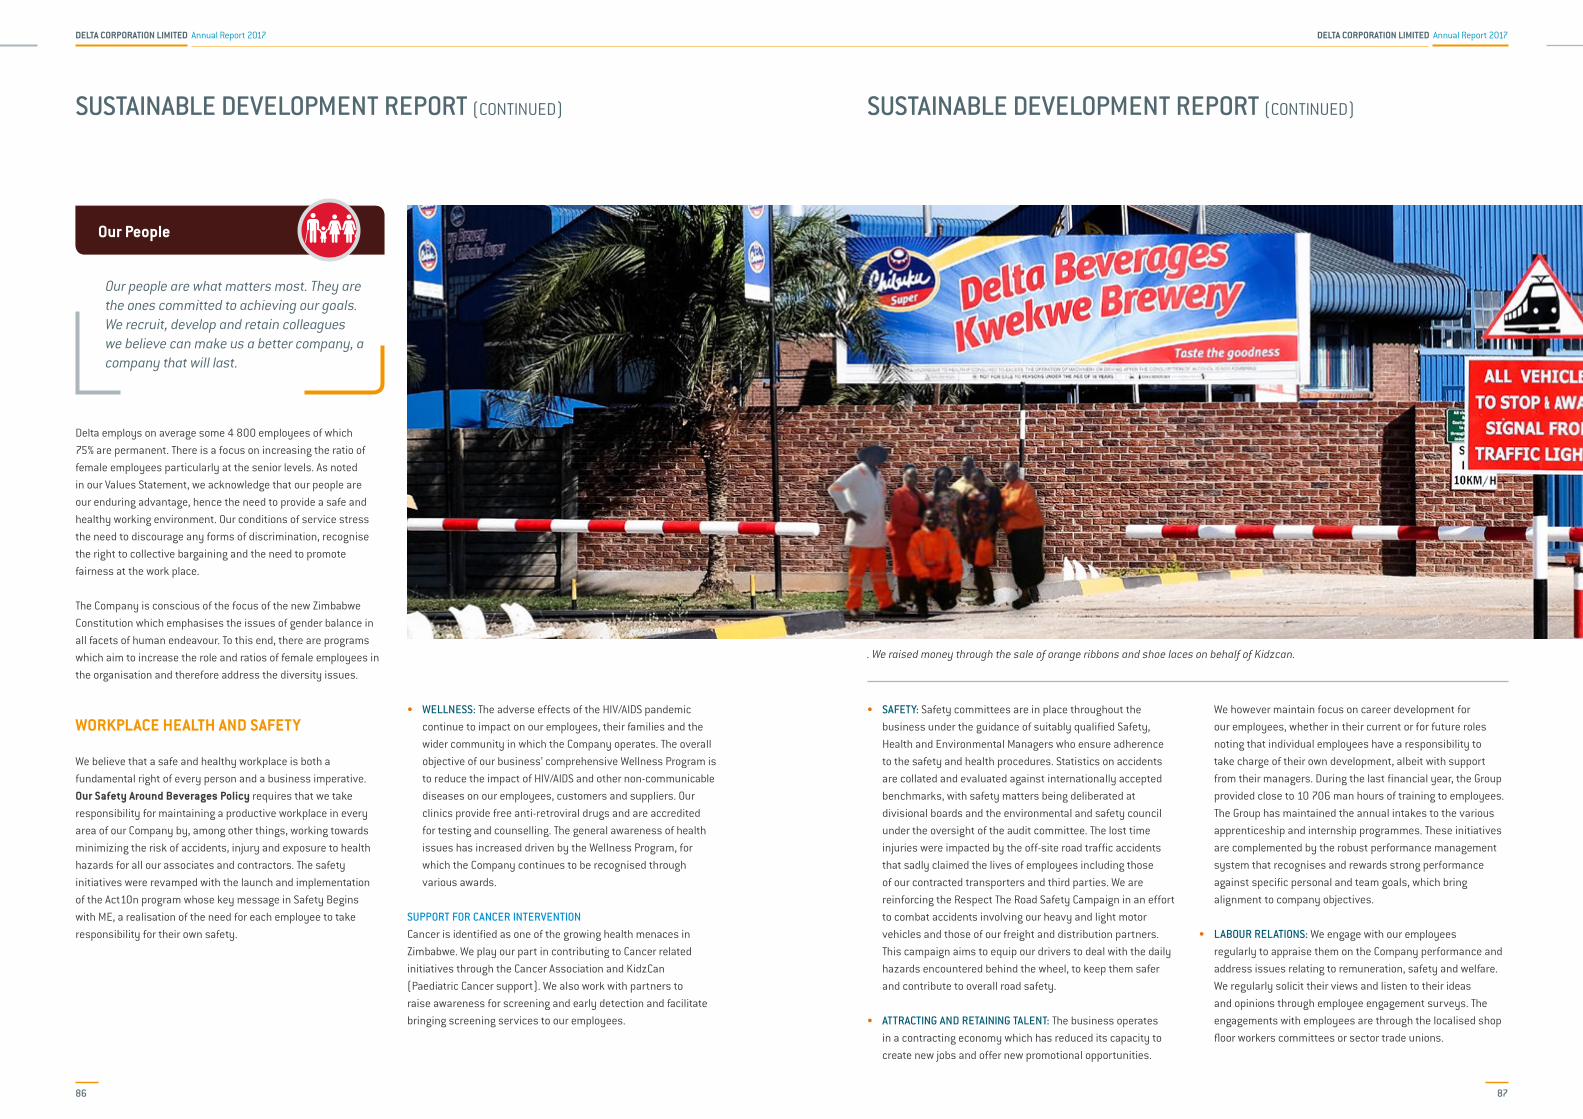
DELTA CORPORATION LIMITED Annual Report 2017 DELTA CORPORATION LIMITED Annual Report 2017
86 87
SUSTAINABLE DEVELOPMENT REPORT (CONTINUED)
Our People
Our people are what matters most. They are the ones committed to achieving our goals. We recruit, develop and retain colleagues we believe can make us a better company, a company that will last.
Delta employs on average some 4 800 employees of which
75% are permanent. There is a focus on increasing the ratio of
female employees particularly at the senior levels. As noted
in our Values Statement, we acknowledge that our people are
our enduring advantage, hence the need to provide a safe and
healthy working environment. Our conditions of service stress
the need to discourage any forms of discrimination, recognise
the right to collective bargaining and the need to promote
fairness at the work place.
The Company is conscious of the focus of the new Zimbabwe
Constitution which emphasises the issues of gender balance in
all facets of human endeavour. To this end, there are programs
which aim to increase the role and ratios of female employees in
the organisation and therefore address the diversity issues.
WORKPLACE HEALTH AND SAFETY
We believe that a safe and healthy workplace is both a
fundamental right of every person and a business imperative.
Our Safety Around Beverages Policy requires that we take
responsibility for maintaining a productive workplace in every
area of our Company by, among other things, working towards
minimizing the risk of accidents, injury and exposure to health
hazards for all our associates and contractors. The safety
initiatives were revamped with the launch and implementation
of the Act10n program whose key message in Safety Begins
with ME, a realisation of the need for each employee to take
responsibility for their own safety.
• WELLNESS: The adverse effects of the HIV/AIDS pandemic
continue to impact on our employees, their families and the
wider community in which the Company operates. The overall
objective of our business’ comprehensive Wellness Program is
to reduce the impact of HIV/AIDS and other non-communicable
diseases on our employees, customers and suppliers. Our
clinics provide free anti-retroviral drugs and are accredited
for testing and counselling. The general awareness of health
issues has increased driven by the Wellness Program, for
which the Company continues to be recognised through
various awards.
SUPPORT FOR CANCER INTERVENTION Cancer is identified as one of the growing health menaces in
Zimbabwe. We play our part in contributing to Cancer related
initiatives through the Cancer Association and KidzCan
(Paediatric Cancer support). We also work with partners to
raise awareness for screening and early detection and facilitate
bringing screening services to our employees.
SUSTAINABLE DEVELOPMENT REPORT (CONTINUED)
• SAFETY: Safety committees are in place throughout the
business under the guidance of suitably qualified Safety,
Health and Environmental Managers who ensure adherence
to the safety and health procedures. Statistics on accidents
are collated and evaluated against internationally accepted
benchmarks, with safety matters being deliberated at
divisional boards and the environmental and safety council
under the oversight of the audit committee. The lost time
injuries were impacted by the off-site road traffic accidents
that sadly claimed the lives of employees including those
of our contracted transporters and third parties. We are
reinforcing the Respect The Road Safety Campaign in an effort
to combat accidents involving our heavy and light motor
vehicles and those of our freight and distribution partners.
This campaign aims to equip our drivers to deal with the daily
hazards encountered behind the wheel, to keep them safer
and contribute to overall road safety.
• ATTRACTING AND RETAINING TALENT: The business operates
in a contracting economy which has reduced its capacity to
create new jobs and offer new promotional opportunities.
We however maintain focus on career development for
our employees, whether in their current or for future roles
noting that individual employees have a responsibility to
take charge of their own development, albeit with support
from their managers. During the last financial year, the Group
provided close to 10 706 man hours of training to employees.
The Group has maintained the annual intakes to the various
apprenticeship and internship programmes. These initiatives
are complemented by the robust performance management
system that recognises and rewards strong performance
against specific personal and team goals, which bring
alignment to company objectives.
• LABOUR RELATIONS: We engage with our employees
regularly to appraise them on the Company performance and
address issues relating to remuneration, safety and welfare.
We regularly solicit their views and listen to their ideas
and opinions through employee engagement surveys. The
engagements with employees are through the localised shop
floor workers committees or sector trade unions.
. We raised money through the sale of orange ribbons and shoe laces on behalf of Kidzcan.

DELTA CORPORATION LIMITED Annual Report 2017 DELTA CORPORATION LIMITED Annual Report 2017
88 89
SUSTAINABLE DEVELOPMENT REPORT (CONTINUED)
Delta Corporation Limited, its subsidiary and associated companies are registered in Zimbabwe.
100%
100%
100%
49%
49%
38%
21%
BEVERAGES MANUFACTURINGAND DISTRIBUTION
KWEKWE MALTINGS
FOOD AND INDUSTRIALPROCESSORS (PRIVATE) LIMITED
SCHWEPPES HOLDINGS AFRICA LIMITED
AFDIS HOLDINGSLIMITED
NAMPAK ZIMBABWELIMITED
DELTA BEVERAGES(PRIVATE) LIMITED
DELTA CORPORATION LIMITED
GROUP STRUCTURE

DELTA CORPORATION LIMITED Annual Report 2017 DELTA CORPORATION LIMITED Annual Report 2017
90 91
PORTFOLIO OF BUSINESSES
BEVERAGES MANUFACTURING AND DISTRIBUTION
LAGER BEER BUSINESS Brewing lager beer, 2 Breweries
Castle Lager, Castle Lite, Golden Pilsener, Lion Lager,
Carling Black Label, Zambezi Lager, Bohlinger’s Lager, Eagle Lager
IMPORTED BRANDS: Castle 1895 Draught, Castle Milk Stout,
Carling Blue Label, Redds, Flying Fish
TRADITIONAL BEER BUSINESSBrewing sorghum beer,9 Breweries
Chibuku, Chibuku Super and Thabani
SPARKLING BEVERAGES BUSINESSBottling carbonated sparkling beverages, 3 Bottling Plants
Coca-Cola, Coca Cola Light,Coke Zero, Fanta, Sparletta, Sprite,
Sprite Zero, Schweppes, Burn, Powerplay, Monster, Novida
TRANSPORT AND DISTRIBUTION BUSINESSProvision and maintenance of primary and secondary distribution
vehicles & the distribution of beverage products
23 Heavy Vehicle Workshops, 23 Delta Beverage Centres
& 2 Customer Collection Depots
ALTERNATIVE BEVERAGES Shumba Maheu & Super Sip, Super Sip Yoghurt, 1 factory
AGRO INDUSTRIAL
KWEKWE MALTINGS Barley and Sorghum malting, 2 Malting Plants
SCHWEPPES HOLDINGS AFRICA LIMITED
Bottling of Non-carbonated cordials,
2 Plants Mazoe, Calypso, Ripe & Ready, Still Water,
Minute Maid, Fuze Tea
AFRICAN DISTILLERS LIMITED Wine & spirit producer, 1 Distillery, 6 Depots plus imported
wines & ciders
NAMPAK ZIMBABWE LIMITED Comprises Hunyani - paper packaging; CarnaudMetalBox – crown
corks, tin cans and plastics packaging and MegaPak - manufacture
of PET, injection and blow moulded plastic products
FOOD AND INDUSTRIAL PROCESSORS (PRIVATE) LIMITED Wholesale distributor of starches and glucose
MANDEL TRAINING CENTRE (PRIVATE) LIMITED Training and leadership development
1 Training & Conference Centre
PETRECOZIM (PRIVATE) LIMITED Recycling of PET plastics
1 Factory
ACTIVITIES
DIRECTORATE AND MANAGEMENT
BOARD OF DIRECTORS
CHAIRMANC F Dube LLB; MBA ¤
EXECUTIVE DIRECTORSP Gowero - Chief Executive Officer BSc Econ (Hons); MBL ¤M M Valela - Finance Director B Tech (Accounts); CA(Z)
NON-EXECUTIVE DIRECTORSS J Hammond B. Comm; CA(Z) ¤Dr C C Jinya B A Econ, DBS (Honoris Causa)J A Kirby B Acc; CA(SA) ¤*T Moyo B Acc; CA(Z) * L E M Ngwerume BA; MBA; IMSProf H C Sadza B.Sc; MA; Phd; MIPMZ; MzimT N Sibanda B Acc; CA(Z) *R Tadeu Soares LLB; LLM
* Member of the Audit Committee ¤ Member of the Remuneration Committee
GROUP MANAGEMENT COMMITTEE
P Gowero BSc Econ (Hons); MBL * ¤ Chief Executive OfficerM M Valela B Tech (Accounts); CA(Z) Executive Director - FinanceE R Mpisaunga B.Sc (Hons) Operations Director - BeveragesM P Karombo B Tech (Mgmt); MBA; MCIM Marketing Director M Gambiza B. Compt (Hons); CA(Z) General Manager - Sparkling BeveragesA Makamure B. Acc (Hons); CA(Z) Company Secretary/Group TreasurerC D Malaba (Mrs) B Acc(Hons) B Compt; CA(Z)/SA Supply Chain DirectorD Mange B.Sc; MBL Information Technology DirectorDr M G Nyandoroh B.Sc (Hons); M.Sc; Phd General Manager - Lager BeerM Pemhiwa BSc Psych; MBA Human Resources DirectorT Rinomhota BSc Eng; MBA General Manager - Sorghum Beer

DELTA CORPORATION LIMITED Annual Report 2017 DELTA CORPORATION LIMITED Annual Report 2017
92 93
DIRECTORATE
CANAAN FARIRAI DUBELLB; MBACanaan Dube joined the board in February
2004 and was appointed as Chairman
in August 2010. He is a member of the
Remuneration and Audit committees.
Canaan is a senior partner with law firm
Dube, Manikai and Hwacha. He sits on the
boards of Barclays Bank Zimbabwe, Edgars
Stores Limited, Bata Zimbabwe (Pvt) Ltd, and
Quality Corporate Governance Centre (Pvt)
Ltd t/a Zimbabwe Leadership Forum. He
was recently the chairman of the Midlands
State University Council. He is studying for a
doctorate, focusing on corporate governance.
PEARSON GOWEROBsc Econ (Hons); MBLPearson Gowero was appointed as Chief
Executive in June 2012. He joined the Group
in 1997 as Marketing Director of the then
Chibuku Breweries Division, becoming the
unit Managing Director in 2001.
He has held various senior positions in
the beverages business and became
an executive director in 2003. Pearson
spent some 5 years on secondment to the
SABMiller Group from 2006 to 2011 where
he was the Managing Director of Zambian
Breweries Group. Prior to joining Delta, he
had worked for some prominent clothing
retail chains. Mr Gowero sits on the boards
of the Company’s subsidiary and associate
companies (Afdis & Nampak) and Seed
Company of Zimbabwe.
HOPE CYNTHIA SADZABSc; MA; PhD; MIPMZ, IODZ, MZIMProf Hope Sadza joined the board in June
2007. She is a co-founder and Vice Chancellor
of the Women’s University in Africa since
2002. She has won several academic and
professional awards including the Fulbright
Scholarship. Prof Sadza sits on the boards of
Securico Security Services, BAT Zimbabwe,
National Blood Services Zimbabwe, University
of Venda, the International Association of
Universities Board and several local and
foreign trusts.
MATLHOGONOLO MOTHIBEDI VALELAB Tech (Accounts); CA (Z)Matlhogonolo Valela was appointed as
Executive Director - Finance in June 2011.
He joined the Group in December 1996 as
an accountant at the National Breweries
division. He moved up the ranks through
a number of operational finance positions
to become the Group Treasurer in 2003.
Matts sits on the boards of the Company’s
subsidiary companies and associates;
African Distillers and Schweppes Zimbabwe.
He also sits on the board of Cimas Medical
Society .
JONATHAN ANDREW KIRBYB Acc; CA(SA)Jon Kirby joined the board in August 2012. He
is a member of the Remuneration Committee
and an alternate member of the Audit
Committee. Jon is the Finance Director of AB
InBev, a group he joined in 1992. He has held
various finance positions in SABMiller Africa
and Asia and sits on a number of subsidiary
company boards.
1
5
4
4
3
2
321 5
DIRECTORATE
LUKE EDWARD MATHEW NGWERUMEBA; MBA; IMSLuke Ngwerume joined the board in
November 2007. He is the Chief Executive
of ZimSelector.com and chairs Stiefel
Investments (Private) Limited, an
investment entity. He also sits on the boards
of Cimas Medical Society, CABS, Old Mutual
Nigeria, Standard Telephone & Cables and
chairs the board of Axia Corporation. He
retired from the position of Chief Executive
of Old Mutual Zimbabwe in 2013 after serving
the group for many years.
RICARDO TADEU ALMEIDA CABRAL DE SOARESLLB; LLM (Havard)Ricardo Tadeu Soares serves as the Zone
President of Africa at Anheuser-Busch InBev,
a role he assumed in October 2016. Most
recently he served as Zone President for
Mexico and CEO of Grupo Modelo, having
joined AmBev in 1995. He joined the Delta
board in November 2016 and sits on the
boards of other AB InBev entities.
CHARITY CHIRATIDZO JINYA B A Econ; DBA (Hons Causa); Fellow Institute of BankersDr Charity Chiratidzo Jinya joined the
board on 1 April 2016. She is currently the
Managing Director of MBCA Bank, a member
of Nedbank Group and President of the
Bankers Association of Zimbabwe. Dr Jinya
has had a long career in banking, having also
served as Managing Director and Executive
Director of leading listed banks in Zimbabwe
and Uganda. She was recently crowned as
the Director of the Year 2015 awarded by
the Institute of Directors Zimbabwe. She
is involved with various charities in the
education and church sectors and youth
mentorship programmes.
SIMON JAMES HAMMONDB.Com; CA(Z)Simon Hammond joined the Board in
December 2000 as a nominee of Old Mutual
Zimbabwe. He is Chairman of both the
Remuneration and Nominations committees.
He is the Managing Director of CABS, the
banking unit of Old Mutual and has held
various senior positions within the Old
Mutual Group in Zimbabwe and Africa, having
joined the group in 1999. Previously he was
a partner of KPMG in Zimbabwe and is a
past President of the Institute of Chartered
Accountants of Zimbabwe. He is also member
of the board of governors at Peterhouse
Group of Schools.
THEMBINKOSI SIBANDAB.Acc Hons; CA(Z)Themba Sibanda joined the board in April
1994. He is the Chairman of the Audit
Committee and a member of the Nominations
Committee. Themba has been a partner at
Schmulian & Sibanda and has accumulated
over 30 years’ experience in compliance and
audit services. He also sits on the boards
of a number of listed entities in Zimbabwe
such as Innscor Africa Limited, Edgars
Stores Limited, Padenga Holdings Limited,
Simbisa Brands and Pretoria Portland Cement
Limited.
TODD MOYOB Acc, CA (Z)Todd Moyo joined the board on 1 April 2016.
He is currently the Managing Director of
Datlabs (Private) Limited. He sits on a
number of boards including PPC South Africa
and is currently non-executive chairman
of National Foods and PPC Zimbabwe. Todd
participates in several charitable trusts
and committees in the education, medical
services and civic arenas. He actively
participates in the activities of professional
associations such as the Institute of
Chartered Accountants of Zimbabwe and
industry bodies such as the Confederation of
Zimbabwe Industries.
6 10
11
9
7
8
6 107 8 119

DELTA CORPORATION LIMITED Annual Report 2017 DELTA CORPORATION LIMITED Annual Report 2017
94 95
3. ETHERTON RUNYARARO MPISAUNGA – BSC (HONS)
Operations Director – BeveragesEtherton Mpisaunga was appointed as Operations Director – Beverages in 2010. He re-joined the Group in 1995 and has held various senior management positions within the Sorghum and Lager Beer Divisions. Having initially joined the Group in 1984, he left for a while during which period he worked for Coca-Cola Central Africa for three years.
4. MAXEN KAROMBO – B.TECH (MGMT.); MBA; MCIM
Marketing DirectorMaxen Karombo re-joined the Group in January 2011 as Marketing Director. He worked for Unilever in various senior roles in marketing, sales and general management in the company’s East and Southern Africa region. He was country Managing Director in both Zimbabwe and Uganda. He initially joined the
Natbrew (Lager Beer Division) in 1997 in the marketing department. He is a non-executive director on the boards of Zimnat Life Assurance and Leonard Cheshire Disability Trust of Zimbabwe.
5. ALEX MAKAMURE – B.ACC (HONS); CA (Z)
Company Secretary/ Group TreasurerAlex was appointed as Company Secretary in January 2006. He is currently also responsible for corporate and legal affairs, group accounting and tax administration. He joined the Group as a Finance Manager at Chibuku Breweries in May 1998 and has occupied various roles in finance and administration in the Beverages Business. He sits on the board of Schweppes Zimbabwe as a company representative and is a non-executive director of Africa Sun Limited, chairing the audit committee.
6. MARSHALL PEMHIWA – BSC. (HONS) PSYCH; HR DIP; DIP OCC. PSYCH; MBA
Human Resources DirectorMarshall Pemhiwa was appointed Human Resources Director in April 2011. He joined the Group in March 1998 as a Graduate Trainee Psychologist/HR. He held various management positions before assuming the position of HR Executive – Beverage Operations in 2009. He sits on the board of Mandel Training Centre and is the immediate past president of the Institute of People Management.
7. DR MUNYARADZI GODFREY NYANDOROH - BSC (HONS) (UZ); MSC (UZ); PHD (KENT)
General Manager – Lager Beer BusinessMunyaradzi Nyandoroh was appointed General Manager – Lager Beer Business in April 2014. He joined the Group in 1985 working in the technical department of the then Chibuku Breweries division. He left the organization in 1992 to pursue
THE PROFILES OF THE CHIEF EXECUTIVE OFFICER AND EXECUTIVE DIRECTOR-FINANCE ARE INCLUDED UNDER BOARD OF DIRECTORS.
GROUP MANAGEMENT COMMITTEE
3 4 521
further studies and re-joined in 1996 as Technical Director for Chibuku Breweries. He was appointed General Manager for the Agro-Services in 2002, and as GM Operations for the Southern Region and thereafter the Northern Region.
8. TICHAFA RINOMHOTA – BSC ENG; MBAGeneral Manager – Sorghum Beer BusinessTichafa Rinomhota was appointed the General Manager – Sorghum Beer in April 2017. He was recently the Group Technical Director since 2011. He also has functional responsibility for the Malting business unit. He joined the group at the then National Breweries division in 1999 as Engineering Manager and rose through the ranks to become the General Manager – Technical for the Lager Business in 2007. He has previously worked for a number of mining and construction companies.
9. CYNTHIA DINKA MALABA – B.ACC (UZ); B.COM (HONS) (UNISA); CA (Z); CA (SA)
Supply Chain DirectorCynthia Malaba was appointed as Director - Supply Chain in April 2013. She joined the Group in 1999 as an Internal Auditor at OK Zimbabwe and promoted to the Head of Risk and Internal Audit in 2003. In 2010 she was seconded to The Coca-Cola Company in East Africa on a senior management development program. This culminated in her promotion to the Group Management Committee as General Manager – Operations Southern Region in April 2011. She sits on the board of The Culture Fund and is a member of the Business Council for Sustainable Development Zimbabwe.
10. MOSES GAMBIZA – B.COMPT (HONS); CA (Z)
General Manager – Sparkling Beverages Moses Gambiza was appointed General Manager – Sparkling Beverages in
April 2014. He joined the Group on 1 May 2000 as a Financial Controller at the then National Breweries. He held various positions in finance until being appointed to the Group Management Committee as General Manger – Southern Region in May 2013.
11. DAVISON MANGE – BSC (UZ); MBL (UNISA)
Information Communications Technology DirectorDave Mange was appointed to Director Information Technology in 2011. He joined the Group through the IT Internship programme in 1990. He has held various management positions covering business systems and computerisation before his appointment as General Manager - Information Technology in 2007.
GROUP MANAGEMENT COMMITTEE
119 106 7 8

DELTA CORPORATION LIMITED Annual Report 2017 DELTA CORPORATION LIMITED Annual Report 2017
96 97
NOTICE IS HEREBY GIVEN THAT THE 70TH ANNUAL GENERAL MEETING OF MEMBERS OF DELTA CORPORATION LIMITED WILL BE HELD AT THE REGISTERED OFFICE OF THE COMPANY AT NORTHRIDGE CLOSE, BORROWDALE ON FRIDAY 28 JULY 2017 AT 12:30 HOURS FOR THE FOLLOWING PURPOSES.
ORDINARY BUSINESS
1. STATUTORY FINANCIAL STATEMENTSTo receive and adopt the Financial Statements for the year
ended 31 March 2017, together with the Report of Directors
and Auditors thereon.
2. To appoint Directors Mr Ricardo Tadeu Soares retires at the end of his interim
appointment and will offer himself for re-election. Prof H C
Sadza and Messrs C F Dube, S J Hammond, L E M Ngwerume
and T N Sibanda are due to retire by rotation. All being eligible,
they will offer themselves for re-election.
3. Directors FeesTo approve the directors’ fees for the financial year ended 31
March 2017.
4. To appoint Auditors for the current year and to approve their
remuneration for the year past.
SPECIAL BUSINESS
1. SHARE BUY BACKShareholders will be asked to consider and if deemed
fit, to resolve with or without amendments, THAT the
Company authorises in advance, in terms of Section 79 of
the Companies Act (Chapter 24:03) the purchase by the
Company of its own shares upon such terms and conditions
and in such amounts as the Directors of the Company may
from time to time determine and such authority hereby
specifies that:
a. the authority shall expire on the date of the Company’s
next Annual General Meeting;
b. acquisitions shall be of ordinary shares which, in
aggregate in any one financial year, shall not exceed 10%
(ten percent) of the Company’s issued ordinary share
capital.
c. the maximum and minimum prices, respectively, at
which such ordinary shares may be acquired will be not
more than 5% (five percent) above and 5 (five percent)
below the weighted average of the market price at which
such ordinary shares are traded on the Zimbabwe Stock
Exchange, as determined over the 5 (five) business days
immediately preceding the date of purchase of such
ordinary shares by the Company;
d. a press announcement will be published as soon as the
Company has acquired ordinary shares constituting, on
a cumulative basis in the period between Annual General
Meetings, 3% (three percent) of the number of ordinary
shares in issue prior to the acquisition.
It will be recorded that, in terms of Companies Act and
the regulations of the Zimbabwe Stock Exchange, it is the
intention of the Directors of the Company to utilise this
authority at a future date provided the cash resources of
the Company are in excess of its requirements and the
transaction is considered to be in the best interests of
shareholders generally. In considering cash resource
availability the Directors will take account of, inter alia, the
long term cash need of the Company, and will ensure the
Company will remain solvent after the re-purchase.
BY THE ORDER OF THE BOARD
A MAKAMURECompany Secretary
Sable House
Northridge Close
Borrowdale
Harare
Zimbabwe
30 June 2017
NOTICE TO MEMBERS SHAREHOLDERS ANALYSIS
SIZE OF NUMBER OF ISSUEDSHAREHOLDING SHAREHOLDERS % SHARES %
1 to 5 000 5 054 79,3 4 425 407 0,4
5 001 to 10 000 319 5,0 2 261 267 0,2
10 001 to 25 000 318 5,0 5 115 927 0,4
25 001 to 50 000 179 2,8 6 336 165 0,5
50 001 to 100 000 142 2,2 10 083 587 0,8
100 001 to 500 000 211 3,3 50 487 773 4,0
Over 500 000 147 2.4 1 164 740 923 93,7
6 370 100,0 1 243 451 049 100,0
CATEGORY
Local Companies 767 12,0 128 567 251 10,3
Foreign Companies 7 0,1 496 278 158 40,0
Pension Funds 357 5,6 140 648 634 11,3
Nominees, local 93 1,5 598 224 0,1
Nominees, foreign 112 1,8 291 722 122 23,5
Insurance Companies 42 0,7 6 453 393 0,5
Resident Individuals 4 436 69,6 170 646 956 13,8
Non Resident Individuals 202 3,2 1 760 830 0,1
Investments & Trusts 225 3,5 2 950 578 0,2
Fund Managers 50 0,8 2 344 860 0,2
Deceased Estates 77 1,2 464 716 0,0
Other Organisations 2 0,0 15 326 0,0
6 370 100,0 1 243 451 049 100,0
Included in the category of ‘over 500 000 shares’ is Delta Employee Participation Trust Company (Private) Limited which holds
14 378 711 shares on behalf of 2 650 employees who participate in the scheme.
TOP TEN SHAREHOLDERS
SHAREHOLDER 2017 % 2016 %
SABMiller Zimbabwe BV (NNR)* 281 951 325 22,7 281 951 325 22,7
Stanbic Nominees (Pvt) Ltd NNR 269 055 501 21,6 312 440 839 25,1
Rainer Inc.* 193 137 519 15,5 193 137 519 15,5
Old Mutual Life Assurance Co.** 141 133 519 11,4 138 945 997 11,2
Old Mutual Zimbabwe Ltd** 36 153 890 2,9 36 153 890 2,9
Standard Chartered Nominees - NNR 34 975 184 2,8 33 949 197 2,7
Browning Investments NV* 22 178 835 1,8 22 178 835 1,8
National Social Security Authority (NPS) 21 424 933 1,7 21 461 214 1,7
Delta Corporation Limited 21 218 614 1,7 13 376 978 1,1
Delta Employees Share Participation Trust Co. 14 378 711 1,2 14 411 211 1,2
Other 207 843 018 16,7 176 306 970 14,2
1 243 451 049 100,0 1 244 313 975 100,0

DELTA CORPORATION LIMITED Annual Report 2017 DELTA CORPORATION LIMITED Annual Report 2017
98 99
MAJOR SHAREHOLDERS 2017 % 2016 %
Old Mutual** 177 287 409 14,2 175 099 887 14,0
SABMiller* 497 267 679 40,0 497 267 679 40,0
674 555 088 54,2 672 367 566 54,0
RESIDENT AND NON-RESIDENT SHAREHOLDERS
Resident 442 212 272 35,6 412 201 580 33,1
Non-Resident 801 238 777 64,4 832 112 395 66,9
1 243 451 049 100,0 1 244 313 975 100,0
The residency of a shareholder is based on place of domicile as recorded in the share register as defined for Exchange Control purposes and does not denote status in terms of the indigenisation regulations.
SHARE PRICE INFORMATION
MID RANGE PRICE (US CENTS) AT:30 June 2016 67,030 September 2016 60,031 December 2016 88,531 March 2017 86,0
PRICE RANGE:Highest: 13 December 2016 94,0Lowest: 15 June 2016 50,0
CALENDAR
70th Annual General Meeting 28 July 2017Financial Year End 31 March 2018
INTERIM REPORTS: ANTICIPATED DATES:6 months to 30 September 2017 November 201712 months to 31 March 2018 and Final dividend declaration May 2018Dividend Payment Date – final June 2018Annual Report Published July 2018
REGISTERED OFFICE: TRANSFER SECRETARIES:Sable House Corpserve (Private) LimitedNorthridge Close 2nd FloorNorthridge Park Intermarket Centre(P O Box BW294) Cnr. Kwame Nkrumah / 1st StreetBorrowdale (P O Box 2208)Harare HarareZimbabwe ZimbabweTelephone: 263 4 883865 Telephone: 263 4 751559/61E-mail: [email protected] E-mail: [email protected]
SHAREHOLDERS ANALYSIS (CONTINUED) NOTES

DELTA CORPORATION LIMITED Annual Report 2017 DELTA CORPORATION LIMITED Annual Report 2017
100 101
NOTES


