Embed Size (px)
Citation preview

ACPD7, 14813–14894, 2007
Lightning activity inBrazilian
thunderstorms
H. Huntrieser et al.
Title Page
Abstract Introduction
Conclusions References
Tables Figures
J I
J I
Back Close
Full Screen / Esc
Printer-friendly Version
Interactive Discussion
EGU
Atmos. Chem. Phys. Discuss., 7, 14813–14894, 2007www.atmos-chem-phys-discuss.net/7/14813/2007/© Author(s) 2007. This work is licensedunder a Creative Commons License.
AtmosphericChemistry
and PhysicsDiscussions
Lightning activity in Brazilianthunderstorms during TROCCINOX:implications for NOx production
H. Huntrieser1, U. Schumann1, H. Schlager1, H. Holler1, A. Giez2, H.-D. Betz3,D. Brunner4,*, C. Forster5,**, O. Pinto Jr.6, and R. Calheiros7
1Institut fur Physik der Atmosphare, Deutsches Zentrum fur Luft- und Raumfahrt (DLR),Oberpfaffenhofen, Germany2Flugabteilung, Deutsches Zentrum fur Luft- und Raumfahrt (DLR), Oberpfaffenhofen,Germany3Physics Department, University of Munich, Germany4Institute for Atmospheric and Climate Science, ETH Zurich, Switzerland5Norwegian Institute for Air Research (NILU), Atmosphere and Climate Change Department,Kjeller, Norway6National Institute for Space Research, INPE, Brazil7Instituto de Pesquisas Meteorologicas – Universidade Estadual Paulista, IPMet/UNESP,Bauru, Brazil
14813
ACPD7, 14813–14894, 2007
Lightning activity inBrazilian
thunderstorms
H. Huntrieser et al.
Title Page
Abstract Introduction
Conclusions References
Tables Figures
J I
J I
Back Close
Full Screen / Esc
Printer-friendly Version
Interactive Discussion
EGU
∗now at: Laboratory for Air Pollution and Environmental Technology, Empa, Swiss FederalLaboratories for Materials Testing and Research, Dubendorf, Switzerland∗∗now at: Institut fur Physik der Atmosphare, Deutsches Zentrum fur Luft- und Raumfahrt (DLR),Oberpfaffenhofen, Germany
Received: 12 September 2007 – Accepted: 5 October 2007 – Published: 16 October 2007
Correspondence to: H. Huntrieser ([email protected])
14814

ACPD7, 14813–14894, 2007
Lightning activity inBrazilian
thunderstorms
H. Huntrieser et al.
Title Page
Abstract Introduction
Conclusions References
Tables Figures
J I
J I
Back Close
Full Screen / Esc
Printer-friendly Version
Interactive Discussion
EGU
Abstract
During the TROCCINOX field experiment in January and February 2005, the contribu-tion of lightning-induced nitrogen oxides (LNOx) from tropical and subtropical thunder-storms in Southern Brazil was investigated. Airborne trace gas measurements (NO,NOy, CO and O3) were performed up to 12.5 km with the German research aircraft5
Falcon. During anvil penetrations in selected tropical and subtropical thunderstormsof 4 and 18 February, NOx mixing ratios were on average enhanced by 0.7–1.2 and0.2–0.8 nmol mol−1 totally, respectively. The relative contributions of boundary layerNOx (BL-NOx) and LNOx to anvil-NOx were derived from the NOx-CO correlations.On average ∼80–90% of the anvil-NOx was attributed to LNOx. A Lightning Location10
Network (LINET) was set up to monitor the local distribution of cloud-to-ground (CG)and intra-cloud (IC) radiation sources (here called “strokes”) and compared with light-ning data from the operational Brazilian network RINDAT (Rede Integrada Nacional deDeteccao de Descargas Atmosfericas). The horizontal LNOx mass flux out of the anvilwas determined from the mean LNOx mixing ratio, the horizontal outflow velocity and15
the size of the vertical cross-section of the anvil, and related to the number of strokescontributing to LNOx. The values of these parameters were derived from the airbornemeasurements, from lightning and radar observations, and from a trajectory analysis.The amount of LNOx produced per LINET stroke depending on measured peak currentwas determined. The results were scaled up with the Lightning Imaging Sensor (LIS)20
flash rate (44 flashes s−1) to obtain an estimate of the global LNOx production rate. Thefinal results gave ∼1 and ∼2–3 kg(N) per LIS flash based on measurements in threetropical and one subtropical Brazilian thunderstorms, respectively, suggesting that trop-ical flashes may be less productive than subtropical ones. The equivalent mean annualglobal LNOx nitrogen mass production rate was estimated to be 1.6 and 3.1 Tg a−1, re-25
spectively. By use of LINET observations in Germany in July 2005, a comparison withthe lightning activity in mid-latitude thunderstorms was also performed. In general, thesame frequency distribution of stroke peak currents as for tropical thunderstorms over
14815

ACPD7, 14813–14894, 2007
Lightning activity inBrazilian
thunderstorms
H. Huntrieser et al.
Title Page
Abstract Introduction
Conclusions References
Tables Figures
J I
J I
Back Close
Full Screen / Esc
Printer-friendly Version
Interactive Discussion
EGU
Brazil was found. The different LNOx production rates per stroke in tropical thunder-storms compared with subtropical and mid-latitude thunderstorms seem to be relatedto the different stroke lengths (inferred from comparison with laboratory data and ob-served lengths). In comparison, the impact of other lightning parameters as strokepeak current and stroke release height was assessed to be minor. The results from5
TROCCINOX suggest that the different vertical wind shear may be responsible for thedifferent stroke lengths.
1 Introduction
A general introduction to the LNOx topic and overviews of past and present measure-ments of LNOx in thunderstorms are given in accompanying papers by Huntrieser et10
al. (2007) (HH07) and by Schumann and Huntrieser (2007) (SH07). Observations fromlocal field experiments have been extrapolated to the global scale to estimate the aver-age amount of LNOx produced annually over the globe which is one crucial, yet highlyuncertain, parameter in the global NOx budget. A LNOx nitrogen mass source strengthbetween 2 and 20 Tg a−1 has frequently been given in the literature in the past (WMO,15
1995; Bradshaw et al., 2000). More recently, lower values between 1 and 14 Tg a−1
have been reported based on estimates from airborne and satellite measurements(Huntrieser et al., 2002; Beirle et al., 2004; Ridley et al., 2004; Boersma et al., 2005;Beirle et al., 2006; Ott et al., 2007b). Furthermore, chemical transport models (CTMs)have been used to reduce the LNOx range by a comparison of modelled NOx concen-20
trations, for different LNOx source strengths and vertical distributions, with local fieldand satellite measurements. The results obtained with model fits indicate best-estimatevalues for the global LNOx nitrogen mass between 2 and 8 Tg a−1 (SH07).
Different methods have been used to estimate the amount of LNOx based on ground-based, airborne and laboratory measurements, and theoretical calculations, as re-25
viewed by SH07. Airborne NOx measurements can be combined with lightning obser-vations to estimate the amount of LNOx produced per flash or per metre flash length.
14816

ACPD7, 14813–14894, 2007
Lightning activity inBrazilian
thunderstorms
H. Huntrieser et al.
Title Page
Abstract Introduction
Conclusions References
Tables Figures
J I
J I
Back Close
Full Screen / Esc
Printer-friendly Version
Interactive Discussion
EGU
These numbers have been scaled up with the mean flash length and the annual globalflash frequency. A large uncertainty in the estimate of LNOx still results from the as-sumed NO production rates by CG and IC flashes (Martin et al., 2007). It has beensuggested that most components of a discharge produce NOx with varying, not deter-mined efficiencies (Chameides, 1986; Coppens et al., 1998; Dye et al., 2000; Rahman5
et al., 2007). In addition, it has been pointed out that the different flash lengths for CGand IC flashes may play an important role in the LNOx production rate (Defer et al.,2003).
Results from the European Lightning Nitrogen Oxides Experiment (EULINOX) andStratosphere-Troposphere Experiment: Radiation, Aerosols, and Ozone (STERAO)10
(DeCaria et al., 2000; Fehr et al., 2004; DeCaria et al., 2005; Ridley et al., 2005; Ottet al., 2007b) indicate that IC flashes produce about as much NO per flash as CGflashes (IC/CG production ratio 0.5–2). In addition, laboratory results from Gallardoand Cooray (1996) and model simulations from Zhang et al. (2003) support that IC andCG flashes are similarly energetic. On the other hand, laboratory studies by Wang15
et al. (1998) showed that LNOx depends less on energy and more on atmosphericpressure and the peak current of the flash. They concluded that “NO production permetre discharge length as a function of peak current appears to provide a more ap-propriate scaling factor for estimates of total global NO production”. The present studymakes use of this finding by combining Wang et al. (1998) NOx measurements for20
laboratory flashes with our NOx and lightning peak current measurements from thefield. First results were briefly presented in Huntrieser et al. (2006), indicating differ-ences for tropical and subtropical thunderstorms in Brazil, which are discussed herein more detail. A further study is in preparation by Ott et al. (2007a1). The authorsfind that the mean peak currents and the NO production amounts per flash in five25
different thunderstorms decrease with increasing latitude: the lowest value of NO pro-
1 Ott, L. E., Pickering, K. E., DeCaria, A. J., Stenchikov, G. L., Lin, F.-F., Wang, D., Lang,S., and Tao, W.-K.: Production of lightning NOx and its vertical distribution calculated from 3-Dcloud scale chemical transport simulations, in preparation, J. Geophys. Res., 2007a.
14817

ACPD7, 14813–14894, 2007
Lightning activity inBrazilian
thunderstorms
H. Huntrieser et al.
Title Page
Abstract Introduction
Conclusions References
Tables Figures
J I
J I
Back Close
Full Screen / Esc
Printer-friendly Version
Interactive Discussion
EGU
duction (360 moles/flash) was found for a EULINOX storm (48◦ N) and the largest valueof NO production (700 moles/flash) was found for a CRYSTAL-FACE storm (26◦ N). Re-cently, Barthe et al. (2007) incorporated the relationship between produced LNOx perm laboratory spark and atmospheric pressure according to Wang et al. (1998) in theirsimulations with an explicit electrical scheme and a 3-D mesoscale model (Meso-NH).5
Up to now, only a few airborne experiments have been conducted that are suit-able to provide an estimate of the LNOx production rate in the tropics (see SH07). Inthis paper we present measurements from the “Tropical Convection, Cirrus and Nitro-gen Oxides Experiment“ (TROCCINOX) carried out in the wet season in January andFebruary 2005 in the State of Sao Paulo and its surroundings in southern Brazil (10◦ S10
to 28◦ S and 38◦ W to 55◦ W). Both tropical and subtropical thunderstorms were inves-tigated, since the operation area was located along the South Atlantic convergencezone (SACZ) (HH07). The main questions of this study are: 1.) How much LNOx isproduced by these tropical and subtropical thunderstorms? 2.) What are the relativecontributions from strokes with different peak currents? 3.) How large is the LNOx pro-15
duction rate per stroke or flash? 4.) Is this LNOx production rate different for tropicaland subtropical thunderstorms? 5.) What are the possible reasons for the difference?6.) Can the findings from TROCCINOX help to explain the large LNOx productivityobserved in Florida thunderstorms during CRYSTAL-FACE?
To answer these questions we analyse airborne measurements of NO, NOy, CO,20
and O3 mixing ratios, the J(NO2) photolysis rate and meteorological parameters per-formed in the outflow of thunderstorms, trajectory analyses with the FLEXPART modeland measurements from LINET, which was set up during TROCCINOX to monitor thelocal lightning distribution (Sect. 2). This system registers very low and low frequency(VLF/LF) radiation sources (here called “strokes”) from both CG and IC flashes. LINET25
data are compared with data from the operational Brazilian lightning detection networkRINDAT (Sect. 3) and with LIS data (Sect. 4). Airborne NOx and ground-based light-ning measurements are combined to give an estimate of the amount of LNOx producedper LINET stroke, and as a function of peak current according to Wang et al. (1998)
14818
ACPD7, 14813–14894, 2007
Lightning activity inBrazilian
thunderstorms
H. Huntrieser et al.
Title Page
Abstract Introduction
Conclusions References
Tables Figures
J I
J I
Back Close
Full Screen / Esc
Printer-friendly Version
Interactive Discussion
EGU
(Sect. 4). From the ratio between LIS and LINET during one overpass, the amount ofLNOx per LIS flash is determined. Knowing the global and annual LIS flash rate (44±5 flashes s−1, Christian et al., 2003; Christian and Petersen, 2005), the equivalentannual global LNOx production rate based on individual TROCCINOX thunderstormsis estimated (Sect. 4). The different LNOx production rates estimated in tropical and5
subtropical thunderstorms are investigated through a comparison of LINET measure-ments, e.g. frequency distributions of stroke peak currents and mean peak currents(Sect. 5). In addition, the lightning properties are compared with those in mid-latitudethunderstorms over Germany, where the same lightning location network (LINET) wasset up in July 2005. Airborne NOx measurements over Germany are available from10
previous campaigns (Huntrieser et al., 1998, 2002), but not for July 2005 (Sect. 5).The results are discussed and summarised in Sects. 6–7. The present study is thefirst to our knowledge that investigates whether tropical, subtropical and mid-latitudethunderstorms have different potentials to produce LNOx by combining lightning peakcurrent measurements with airborne NOx and meteorological measurements.15
2 Data and model description
For general information on the TROCCINOX field experiment, see the papers by Schu-mann et al. (2004), HH07 and SH07. The following subsections describe the airbornedata obtained mainly from the research aircraft Falcon of the Deutsches Zentrum furLuft- und Raumfahrt (DLR) as well as partly from the Russian M55 Geophysica aircraft20
(Sect. 2.1), lightning data from LINET, LIS and RINDAT (Sect. 2.2) and model simula-tions from FLEXPART (Sect. 2.3). In addition, we use data from two S-band Dopplerradars in Bauru (22.4◦ S, 49.0◦ W) and in Presidente Prudente (22.1◦ S, 51.4◦ W) oper-ated by the Instituto de Pesquisas Meteorologicas (IPMet). Two different radar reflec-tivity products are presented: surveillance Plan Position Indicator (PPI, range 450 km)25
and 3.5 km Constant Altitude PPI (CAPPI, range 240 km). The meteorological envi-ronment of tropical, subtropical and mid-latitude thunderstorms was characterised with
14819

ACPD7, 14813–14894, 2007
Lightning activity inBrazilian
thunderstorms
H. Huntrieser et al.
Title Page
Abstract Introduction
Conclusions References
Tables Figures
J I
J I
Back Close
Full Screen / Esc
Printer-friendly Version
Interactive Discussion
EGU
analysis data (temperature, water vapour mixing ratio, pressure, wind velocity and di-rection) from the European Centre for Medium Range Weather Forecasts (ECMWF)with 3 h temporal resolution, 1◦ horizontal resolution and 60 vertical levels. The equiv-alent potential temperature is calculated as described in HH07. The separation oftropical and subtropical air masses is based on meteorological data, as already dis-5
cussed for the two selected flights of 4 and 18 February 2005 in HH07. The 4 and 18February flights were classified as tropical and subtropical, respectively.
2.1 Airborne instrumentation: Falcon and Geophysica
Airborne measurements up to 12.5 km were carried out with the Falcon, which wasequipped with DLR instruments to measure NO, NOy, O3, CO and J(NO2). The chemi-10
cal instrumentation is the same as that used during several DLR field campaigns in thepast (HH07). Position, altitude, temperature, humidity, pressure and the 3-dimensionalwind vector (u, v and w) were measured with the standard Falcon meteorological mea-surement systems (Schumann et al., 1995). Wind and pressure were measured witha Rosemount flow angle sensor (model 858) at the Falcon’s noseboom tip. The aero-15
dynamic measurements were analysed according to an extensive in-flight calibrationprogramme (Bogel and Baumann, 1991).
In addition, NO and CO measurements were obtained from the high-flying Geo-physica aircraft (∼20 km) (Stefanutti et al., 2004). The SIOUX instrument, developedand operated by the DLR, measures the NO mixing ratio (chemiluminescence tech-20
nique) with a time resolution of 1 s, and an accuracy and precision of 10% and 5%,respectively. The CO-TDL instrument (cryogenic Tunable Diode Laser technique) op-erated by the Istituto Nazionale di Ottica Applica/Consiglio Nazionale delle Ricerche(INOA/CNR), measures the CO mixing ratio with an averaging time of 5 s, the accuracyand precision being 5% and 2%, respectively.25
All flight altitude values refer to pressure height and all times to UTC (CoordinatedUniversal Time) time (see also HH07).
14820

ACPD7, 14813–14894, 2007
Lightning activity inBrazilian
thunderstorms
H. Huntrieser et al.
Title Page
Abstract Introduction
Conclusions References
Tables Figures
J I
J I
Back Close
Full Screen / Esc
Printer-friendly Version
Interactive Discussion
EGU
2.2 Lightning measurements: LINET, LIS and RINDAT
During the TROCCINOX field campaign from 21 January to 27 February 2005, theVLF/LF (5–300 kHz) lightning detection network LINET was used to monitor the locallightning distribution with high spatial resolution. LINET was set up by DLR in coop-eration with IPMet. The network included six sensors from DLR to observe the area5
19.5–24.5◦ S and 46.5–51.5◦ W (see Table 1). The average distance to the next closestsensor was ∼80 km. For comparison of lightning characteristics, measurements fromsouthern Germany in summer 2005 with 19 sensors (from both DLR and the Universityof Munich), monitoring the area 47–51◦ N and 5–14◦ E, were also included in this study(Table 1). The average distance to the next closest sensor was ∼80 km in the outer10
region and ∼20 km in the inner region. The basically similar features of the LINET ar-rays in Germany and Brazil allow comparison of the characteristics of thunderstormssystems in both regions (Schmidt et al., 2005).
The LINET system has been developed by the University of Munich and the sen-sor technology and measurement procedures have been described in detail by Betz et15
al. (2004), Schmidt et al. (2004, 2005), Betz et al. (2007) and Schmidt (2007). Foran overview of system characteristics see SH07. LINET continuously measures thetransient magnetic components of VLF/LF emissions from lightning discharges. Thesesignals are emitted by certain components of the flashes, and therefore a direct com-parison with published flash statistics (e.g., IC/CG ratio) is not possible. At the current20
stage, VLF sources are considered separately. A routine algorithm to combine theminto flashes is under development. In Sect. 6a small set of strokes were combinedmanually to flash “components”, which indicate that LINET locates few VLF strokes perflash components (on average 3 and up to 9).
It is known that the amplitude of a measured electromagnetic signal is proportional to25
the peak current (Uman et al., 1975; Rakov et al., 1992; Cummins et al., 1998; Orville,1999; Jerauld et al., 2005; Schulz et al., 2005). Thus, the peak current of LINET strokesis estimated from the VLF pulse amplitude. The registered amplitude depends on the
14821
ACPD7, 14813–14894, 2007
Lightning activity inBrazilian
thunderstorms
H. Huntrieser et al.
Title Page
Abstract Introduction
Conclusions References
Tables Figures
J I
J I
Back Close
Full Screen / Esc
Printer-friendly Version
Interactive Discussion
EGU
distance between the VLF pulse and the measuring LINET sensor. The registeredpulse is normalised by the reciprocal value of the distance between pulse source andsensor, and averaged over all sensors that registered the VLF pulse. Owing to refinedantenna techniques, optimised waveform handling and a shorter sensor base line of<100 km, a high detection efficiency of low peak currents is possible. The detection5
efficiency, stroke-current dependent, is highest in the LINET centre area (2◦×2◦) anddecreases rapidly down to 30% towards the periphery. Currents as low as ∼1–2 kA canbe detected by the system within the LINET centre area (periphery ∼5 kA). In compar-ison, most other VLF/LF lightning networks report only strokes >5–10 kA (Cummins etal., 1998).10
In addition to LINET data, spaceborne measurements from LIS on board the Tropi-cal Rainfall Measurement Mission (TRMM) satellite (Christian et al., 1999; Thomas etal., 2000; Boccippio et al., 2002) were used to estimate the total regional flash density(sum of CG and IC flashes) over the TROCCINOX area. For an overview of systemcharacteristics see SH07. Locally, the duration of a measurement is 90 s, which is15
long enough to estimate the flashing rate of most thunderstorms in the field of viewduring the passage (see http://thunder.msfc.nasa.gov/lis/). At noon the detection ef-ficiency is 73±11% and at night 93±4% (Boccippio et al., 2002). Here we used LISscience products (total count of flashes) from the “LIS space time domain search” (seehttp://thunder.nsstc.nasa.gov/lightning-cgi-bin/lis/LISSearch.pl). A recent comparison20
between LIS and LINET data showed a good agreement between two systems that arebased on completely different measurement techniques (Schmidt et al., 2005). HereLIS data for one overpass of 4 February 2005 were compared with LINET data (seeSect. 4.5). LNOx estimates per LINET stroke were scaled up with LIS observations toprovide an estimate of the regional and global strength of the LNOx production.25
LINET data were also compared with data from the operational Brazilian lightningdetection network RINDAT (see http://www.rindat.com.br/). Like LINET, RINDAT oper-ates in the VLF/LF range. The detection efficiency for strokes with peak currents above10 kA is 80–90% and the location accuracy is 0.5–2.0 km (Pinto and Pinto, 2003). The
14822

ACPD7, 14813–14894, 2007
Lightning activity inBrazilian
thunderstorms
H. Huntrieser et al.
Title Page
Abstract Introduction
Conclusions References
Tables Figures
J I
J I
Back Close
Full Screen / Esc
Printer-friendly Version
Interactive Discussion
EGU
RINDAT system mainly registers CG flashes. A recent comparison between LINET andRINDAT strokes indicates reasonable agreement for CG strokes when LINET peak cur-rents are above 12 kA (Schmidt et al., 2005); see further comparisons in Sect. 3.
2.3 Transport modelling: FLEXPART
The distribution of LNOx in the vicinity of thunderclouds was simulated with the La-5
grangian particle dispersion model FLEXPART. General information on FLEXPARTused for TROCCINOX is given in HH07. The model has mainly been used for studyinglong-range air pollution transport (e.g. Stohl et al., 2003a, b; Huntrieser et al., 2005),but also to investigate LNOx transport (Stohl et al., 2003b; Beirle et al., 2006; Cooperet al., 2006).10
The LNOx emissions used here as input for FLEXPART were based on lightningstroke data from the LINET system. LNOx was released uniformly in the vertical be-tween 5 km (freezing level with negative charge centre) and 13 km altitude (cloud top) atthe accurate horizontal position of observed VLF sources. Because of the low resolu-tion of the ECMWF wind fields (0.5◦ horizontally) used as input for FLEXPART (HH07),15
the distribution of lightning sources is assumed to be uniform in the vertical. A hundredparticles were released per stroke, carrying the mass of LNOx produced (here set to1 kg). The convection scheme, used in these FLEXPART applications, transports theparticles upward into the anvil, from where they follow trajectories computed with theECMWF wind fields. No quantitative estimate of the amount of LNOx is possible from20
these simulations; they can, however, be used to estimate the extension of the LNOxfield advected out of the anvil region.
3 Observations during the field experiment
An overview of the observations on the two selected TROCCINOX days, 4 and 18February 2005 with thunderstorms in tropical and subtropical air masses, respectively,25
14823

ACPD7, 14813–14894, 2007
Lightning activity inBrazilian
thunderstorms
H. Huntrieser et al.
Title Page
Abstract Introduction
Conclusions References
Tables Figures
J I
J I
Back Close
Full Screen / Esc
Printer-friendly Version
Interactive Discussion
EGU
is given in HH07. Here we briefly focus on the performance of the lightning detectionnetwork LINET (Sect. 3.1) and on the representation of the Falcon measurements inthe anvil outflow (Sect. 3.2).
3.1 Performance of LINET compared with RINDAT
To evaluate the performance of the LINET system in more detail, a comparison with5
the operational lightning detection network in Brazil (RINDAT) was carried out for 4 and18 February 2005. Horizontal distributions of RINDAT and LINET strokes were com-pared for the LINET centre area on 4 February 2005 (Fig. 1a), and for the northernLINET periphery area on 18 February 2005 (Fig. 1b), 00:00 UTC–24:00 UTC. Overall,a general agreement was found, but with a slight shift of RINDAT strokes to the west10
compared with LINET strokes. In some areas the density of LINET strokes was muchlarger than of RINDAT strokes (probably because IC strokes and strokes with low peakare not registered by RINDAT). The correlations between LINET and RINDAT peak cur-rents (absolute values) for 222 and 173 selected strokes of 4 February (21.5–22.5◦ Sand 48.5–49.5◦ W) and 18 February (19.4–20.0◦ S and 47.7–49.2◦ W) are shown in15
Figs. 2a and b, respectively. On 4 February only negative CG strokes were com-pared. On 18 February no separation between CG and IC strokes was possible for theLINET data, owing to the location of the selected strokes along the northern periph-ery area. LINET strokes were therefore compared with both positive and negative CGstrokes from RINDAT. About 10% of the selected LINET strokes were positive ones.20
The strokes shown in Fig. 2 were selected manually to represent peak current valuesover the entire current range. LINET peak currents above 13–14 kA are in general alsodetected by RINDAT, occasionally even LINET peak currents down to 7 kA. The slope(0.83) seen in Fig. 2a indicates that a 20 kA LINET stroke is on average registered as14 kA by RINDAT. In Fig. 2b the slope is slightly lower (0.68) owing to the lower LINET25
detection efficiency along the northern periphery. In addition, the mean peak currentis higher for LINET strokes (35 kA in Fig. 2a and 31 kA in Fig. 2b) than for RINDATstrokes (27 kA in Fig. 2a and 20 kA in Fig. 2b). The high correlation coefficient (r2=
14824

ACPD7, 14813–14894, 2007
Lightning activity inBrazilian
thunderstorms
H. Huntrieser et al.
Title Page
Abstract Introduction
Conclusions References
Tables Figures
J I
J I
Back Close
Full Screen / Esc
Printer-friendly Version
Interactive Discussion
EGU
0.92 and 0.95, respectively) between the peak currents of the two systems indicatesa good agreement in general. Lower RINDAT CG+ peak currents (<30 kA) are fre-quently registered as IC+ by LINET (∼40%) and stronger RINDAT CG- peak currents(>100 kA) are frequently registered as IC- by LINET (∼40%). This finding can be com-pared with results from EULINOX in Germany where flashes registered with a LPATS5
system (same technology as used for RINDAT) were compared with the French Of-fice National d’Etudes et de Recherches Aerospatiales (ONERA) VHF interferometermeasurements. Thery (2001) found that 61% of the positive LPATS flashes (those oflow intensity) and 32% of the negative LPATS flashes were in fact IC flashes. A re-cent study by Pinto et al. (2007) also confirmed that a large percentage of the positive10
CG flashes registered by RINDAT over Brazil are in fact IC flashes. For the analyseddataset we found that weak positive RINDAT peak currents (<10 kA) are occasionally(<10%) registered as negative strokes by LINET.
3.2 NOx in the anvil outflow derived from aircraft measurements
In HH07 it was briefly discussed whether the outflow altitude where LNOx maximises15
was reached with the Falcon aircraft (important question for comparison with resultsfrom other field campaigns and for further calculations in Sect. 4). It was concludedthat this altitude was reached with certainty on 18 February, but on 4 February theFalcon measured the largest mixing ratios in the uppermost flight levels so that largermixing ratios at higher altitudes inside the anvil cannot be excluded. Therefore, for20
the latter day measurements from the high-flying Geophysica in the upper part of thisthunderstorm were briefly analysed as discussed below.
The Falcon measurements in two of the anvils of 4 February (anvil 1a and 5a, listedin Table 2a and described in Sect. 4.1) can be compared with coincident measure-ments with the high-flying Geophysica. The Geophysica penetrated anvil 1a during25
ascent between 15.9 and 16.6 km (penetration at flight time: 67 070–67 298 s, at posi-tion: 21.3–21.5◦ S and 49.1–49.3◦ W) and anvil 5a during descent between 17.2 and16.5 km (penetration at flight time: 66 569–66 696 s, at position: 21.8–21.9◦ S and
14825

ACPD7, 14813–14894, 2007
Lightning activity inBrazilian
thunderstorms
H. Huntrieser et al.
Title Page
Abstract Introduction
Conclusions References
Tables Figures
J I
J I
Back Close
Full Screen / Esc
Printer-friendly Version
Interactive Discussion
EGU
48.5–48.7◦ W). The mean NO mixing ratios in anvil 1a and anvil 5a were 0.30 and0.35 nmol mol−1, respectively. The mean anvil-NO mixing ratio is the mean value of allNO 1s-values measured between the entrance and exit of the anvil (determined fromthe distinct increase and decrease in the NO mixing ratio). The mean mixing ratiosmeasured by the Geophysica between ∼16–17 km altitudes are distinctly lower than the5
NO mixing ratios measured by the Falcon at lower altitudes (10.6–10.7 km): 0.80 and1.16 nmol mol−1 in anvil 1a and anvil 5a, respectively. The Geophysica measurementsin the anvils on 4 February indicate an increase in NO mixing ratios with decreasingaltitude, opposite to the Falcon measurements. Hence the outflow level where NO mix-ing ratios maximise was likely to be located between the altitudes at which the Falcon10
and Geophysica penetrated the anvils. CO measurements from the Geophysica (per-sonal communication P. Mazzinghi, INOA/CNR) can be used to determine this outflowlevel more precisely (on the assumtion that LNOx maximises where CO maximises).The vertical CO profile (ascent and descent in the vicinity of the selected anvils) showsenhanced mixing ratios mainly between ∼10–14 km altitudes. The mixing ratios were15
rather constant throughout this layer, ∼130–140 nmol mol−1. The outflow level, wherethe CO mixing ratio maximises (132–138 nmol mol−1), was located between ∼12.0–12.5 km, about 1.5–2 km above the Falcon penetration. At the levels where the Falconpenetrated the anvils (10.6–10.7 km), however, the CO mixing ratio (132 nmol mol−1)was similar to the lowest Geophysica CO mixing ratios in the outflow level. The Falcon20
data may therefore underestimate the mean NO mixing ratios in the selected anvils to adegree which cannot be quantified from the available dataset. These mean NO mixingratios are needed for further calculations in the next section. Preliminary results fromcloud-resolved modelling for the 4 February thunderstorms by Pickering et al. (2007)suggest that the anvil outflow NO maximum is located between 12 and 13 km, which25
supports our estimates derived from the vertical CO profile.
14826

ACPD7, 14813–14894, 2007
Lightning activity inBrazilian
thunderstorms
H. Huntrieser et al.
Title Page
Abstract Introduction
Conclusions References
Tables Figures
J I
J I
Back Close
Full Screen / Esc
Printer-friendly Version
Interactive Discussion
EGU
4 Estimate of the LNOx production rate per flash and per year
In this section the measurements in selected tropical and subtropical thunderstorms of4 and 18 February 2005 are discussed in more detail. The spatial and temporal dis-tributions of LINET strokes are presented (Sect. 4.1). The contribution from observedLINET strokes to measured anvil-NOx mass and the resulting LINET stroke rates are5
estimated (Sect. 4.2). Furthermore, the contribution of BL-NOx and LNOx to measuredanvil-NOx is estimated (Sect. 4.3). The horizontal LNOx mass flux rate out of the anvilsis calculated by means of estimated LNOx mixing ratios and horizontal outflow wind ve-locities from the flights combined with the size of the vertical cross-section of the anvils(Sect. 4.4). LNOx nitrogen mass flux rates (g s−1) and LINET stroke rates (strokes s−1)10
are combined to estimate the production rate of LNOx (in g of nitrogen mass or numberof NOx molecules) per LINET stroke and per LIS flash (Sect. 4.5). Finally, the annualglobal LNOx nitrogen mass production rate is estimated (in Tg a−1). Figure 3 givesan overview of these different steps described in detail in the following subsections,starting with the selection of a thunderstorm (TS) and ending with an estimate of the15
annual global LNOx production rate G(LNOx).
4.1 Spatial and temporal LINET stroke distributions
The spatial distributions of LINET strokes of 4 and 18 February 2005 are shown inFigs. 4a and b, respectively. For the selected thunderstorms, strokes occurring beforethe penetrations by the Falcon are highlighted in colour. Superimposed is the Falcon20
track showing the successful, repeated penetrations of the subtropical thunderstormsystem of 18 February, and the zigzag pattern between the tropical thunderstorms(labelled 1a, 5a and 2b) of 4 February. The time periods of the anvil penetrations arelisted in Table 2a. The direction of the thunderstorm movement (red arrows in Fig. 4)is inferred from lightning data. The main wind direction in the anvil outflow (green25
arrows), as inferred from Falcon wind measurements, controls the transport of LNOxout of the anvils. On 4 February the main wind direction in the flight level (influenced
14827
ACPD7, 14813–14894, 2007
Lightning activity inBrazilian
thunderstorms
H. Huntrieser et al.
Title Page
Abstract Introduction
Conclusions References
Tables Figures
J I
J I
Back Close
Full Screen / Esc
Printer-friendly Version
Interactive Discussion
EGU
by the Bolivian High, see Fig. 5c in HH07) varied between north-east and south-east invicinity of anvil 1a and 2b, and was from the south-west in the vicinity of anvil 5a. TheNOx mixing ratio along the flight track is also superimposed in Fig. 4. Elevated mixingratios exceeding 0.6 nmol mol−1 NOx were frequently measured in the anvil outflowdownstream of nearby lightning strokes.5
The selected thunderstorms of 4 and 18 February occurred in the centre and at thenorthern border line of the LINET network, respectively. Because of a higher sen-sitivity in the network centre, the fraction of strokes with low currents (<10 kA) wasmuch higher on 4 February (87%) than on 18 February (45%). For the latter thun-derstorm system no separation between IC and CG strokes was possible because of10
the large distance from the centre. For an adequate comparison of the stroke rates inthese storms, it was necessary to restrict comparisons to higher stroke peak currents(≥10 kA) which were observed with about the same detection efficiency, independentlyof their location within the LINET network. On 4 February strokes were widespreadwith some at the LINET periphery. LINET strokes were therefore compared with LIS15
flashes and RINDAT strokes to determine the detection efficiency of the LINET systemrelative to the other two systems. The change in detection efficiency for these selectedLINET strokes towards the LINET periphery was only minor (<10%) compared with theother two systems and not considered further.
The temporal distributions of LINET stroke rates in the selected thunderstorms for20
peak currents ≥10 kA are presented in Fig. 5. The storms of 4 February were mainly ina mature stage during the aircraft passage. In comparison, the long-lived storm systemof 18 February was in a decaying stage and probed long after the peak lightning activity(first lightning was registered already 6 h before the first penetration).
4.2 Contribution of LNOx to anvil-NOx and determining LINET stroke rates25
For evaluation of the LNOx production rate per stroke, it is necessary to estimate whichof the LINET strokes during the storm lifetime contributed to the measured anvil-NOxenhancement and its horizontal and vertical extension. This is a very difficult task
14828

ACPD7, 14813–14894, 2007
Lightning activity inBrazilian
thunderstorms
H. Huntrieser et al.
Title Page
Abstract Introduction
Conclusions References
Tables Figures
J I
J I
Back Close
Full Screen / Esc
Printer-friendly Version
Interactive Discussion
EGU
which might be best performed by using cloud-scale modelling. First cloud-resolvingmodel simulations have been performed for selected TROCCINOX storms of 4 Febru-ary 2005 by Chaboureau et al. (2007) and by Pickering et al. (2007) but cloud-resolvingsimulations are presently not available for the thunderstorm system of 18 February2005. Instead we make use of FLEXPART lightning tracer simulations, as explained5
in Sect. 2.3. The simulations follow lightning tracers from the horizontal LINET strokedistributions (Fig. 4b) using ECMWF wind fields. For the long-lived thunderstorm caseof 18 February, ambient wind velocities were strong and LNOx was advected far down-wind. The ECMWF wind agrees well with Falcon measurements of wind velocity anddirection, except in the core of the anvil penetrations (Fig. 6). As shown later in this10
section, comparison of the ECMWF wind fields and FLEXPART results with radar andairborne wind and anvil-NOx observations, as indicated in Fig. 3, supports the validityof the FLEXPART simulations of the 18 February thunderstorm system, in spite of thecoarse horizontal resolution (0.5◦) of the ECMWF wind velocity fields used.
For the thunderstorm system of 18 February, a time sequence of FLEXPART light-15
ning tracer simulations (Fig. 7) indicates a rather fast development of an elongatedarea with enhanced LNOx downwind of the storm system, following the wind in theupper troposphere (UT). Tracer distributions for six different simulations are shown inthis figure (output resolution: 30 min and 0.08 degrees, horizontal cross-sections at10 km altitude corresponding to the flight level) considering transport of emissions from20
strokes in various time intervals. The simulated tracer distributions may be comparedwith the anvil-NOx observations from the Falcon (Fig. 4b). Only the last four simula-tions (Fig. 7c–f) indicate distinctly enhanced LNOx along the right anvil transect, asobserved by the Falcon. Furthermore, mixing ratios in the left transects, closer to thecore, were twice as high as in the right transects. Given the measured UT wind veloc-25
ity of 15 to 20 m s−1, it is clear that strokes that occurred between 19:00–19:30 UTC(along the left anvil transect, 49.7–49.8◦ W) or earlier do not contribute to the anvil-NOxenhancement observed along the right anvil transect. The air with enhanced LNOx isadvected further downwind to the right in Figs. 7d–f. Only strokes after 19:30 and be-
14829

ACPD7, 14813–14894, 2007
Lightning activity inBrazilian
thunderstorms
H. Huntrieser et al.
Title Page
Abstract Introduction
Conclusions References
Tables Figures
J I
J I
Back Close
Full Screen / Esc
Printer-friendly Version
Interactive Discussion
EGU
fore 20:55 UTC (when the storm decayed) (Fig. 7c) were therefore considered to havecontributed to the observed anvil-NOx. During this 85 min period about 130 strokes withpeak currents ≥10 kA were detected, corresponding to a stroke rate of 0.025 strokess−1 (Table 2a).
For the 18 February 2005 thunderstorm system, the horizontal extension (∆x) of5
FLEXPART lightning tracer in Fig. 7c, perpendicular to the wind direction (see Fig. 4b),was estimated to be ∼30–35 km. This width agrees well with the extension of theflight path segment with enhanced NOx observed during the single anvil transects (28–35 km); see the grey scale along the flight track in Fig. 4b and Table 2. This parameter(∆x) will be used to estimate the horizontal LNOx mass flux out of the anvil in Sect. 4.4.10
Finally, a radar image of the 18 February thunderstorm system (Bauru radar, eleva-tion angle 0◦), indicates a pronounced, elongated structure of the storm system (Fig. 8),similar to the FLEXPART result at 10 km altitude. The 18 February thunderstorm sys-tem is located in the upper, northern domain of the radar range, about 240 km from theradar site. Unfortunately, the radar information is sparse in this region and no more15
detailed data are available since the domain is out of the quantification range wherevolumetric data are collected.
For the thunderstorms of 4 February, no FLEXPART simulations were performedsince the storms just developed ∼1 h ago and this time was considered too short forrealistic simulations. In addition, the ambient UT wind velocities were low (4–7 m s−1)20
and LNOx remained in the vicinity of the storms. Instead, as indicated in Fig. 3, theLNOx production rate per stroke and the width ∆x were estimated from a combinationof horizontal LINET stroke distributions, radar images, Falcon wind and anvil-NOx ob-servations. The average altitude (arithmetical mean) of all IC strokes (Table 4a) in anvil1a (10.0 km) and anvil 5a (11.6 km) was below or just above the flight level (10.6 km and25
10.7 km, respectively; see Table 2a), indicating that the majority of LNOx, produced bythe observed strokes left the anvil at about the flight level.
It is assumed that all LINET strokes observed in the vicinity of these storms betweenstorm initiation and Falcon penetration (coloured in Fig. 4a) contributed to the observed
14830

ACPD7, 14813–14894, 2007
Lightning activity inBrazilian
thunderstorms
H. Huntrieser et al.
Title Page
Abstract Introduction
Conclusions References
Tables Figures
J I
J I
Back Close
Full Screen / Esc
Printer-friendly Version
Interactive Discussion
EGU
anvil-NOx (Fig. 4a). (This is a working hypothesis with large uncertainties, which cannotbe quantified without cloud-model simulations.) For comparison with the 18 Februarycase, only the number of strokes with peak currents ≥10 kA is counted. In anvil 1aabout 278 strokes were registered between 16:55 and 18:20 UTC, in anvil 5a about130 strokes were registered between 18:05 and 18:45 UTC and in anvil 2b about 3115
strokes were registered between 17:55 and 19:20 UTC; see Fig. 5, which correspondsto the following stroke rates: 0.055, 0.054 and 0.061 strokes s−1, respectively (seeTable 2a).
For each of the three anvil penetrations, the width (∆x) of the LNOx plume perpendic-ular to the wind direction was estimated from the horizontal LINET stroke distribution,10
from the anvil-NOx observations (Fig. 4a) and from the radar images at the time of thepenetrations (shown only hourly in Fig. 9). The ∆x values are ∼35, ∼25 and ∼45 kmfor anvils 1a, 5a and 2b, respectively (see Table 2a).
4.3 Contribution of BL-NOx to anvil-NOx
The boundary layer (BL) contribution (χBL−NOx) to the NOx mixing ratio in the anvil15
(χAnvil−NOx) is derived from the correlation between NOx and CO mixing ratios in theBL and in the anvil. It is assumed, that BL air is transported upwards rapidly withinstrong, well-developed updrafts with little ambient mixing and without chemical loss ofNOx and CO. Hence, about the same CO mixing ratio is observed in the main anviloutflow (χAnvil−CO) as in the BL layer (χBL−CO):20
χAnvil−CO = χBL−CO (1)
and LNOx (χLNOx) is the difference between anvil-NOx and BL-NOx:
χLNOx = χAnvil−NOx − χBL−NOx (2)
These assumptions are supported by cloud-model simulations (Pickering et al., 1992;Thompson et al., 1997; Ott et al., 2007b) and airborne thunderstorm observations25
(Dickerson et al., 1987; Hauf et al., 1995; Huntrieser et al., 1998; Holler et al., 1999;14831

ACPD7, 14813–14894, 2007
Lightning activity inBrazilian
thunderstorms
H. Huntrieser et al.
Title Page
Abstract Introduction
Conclusions References
Tables Figures
J I
J I
Back Close
Full Screen / Esc
Printer-friendly Version
Interactive Discussion
EGU
Huntrieser et al., 2002; Lopez et al., 2006; Bertram et al., 2007; Koike et al., 2007). Theratio of NOx to CO in the BL (<2 km) is conserved during the rapid upward transportinto the anvil:
χBL−NOx/χBL−CO = (χAnvil−NOx − χLNOx)/χAnvil−CO (3)
Vertical NOx, CO, and O3-profiles from the 18 February flight are shown in Fig. 10a.5
The CO mixing ratios, measured during the anvil penetrations, are in a similar rangeas those measured at ∼2 km altitude (see red box), supporting the assumption of rapidupward transport from the top of the BL into the anvils. Unfortunately, no NOx mea-surements are available below 3 km for this flight. Instead, NOx measurements in theBL were only available for ten TROCCINOX “fair weather” flights without active thun-10
derstorms (Fig. 1a in HH07). NOx and CO data from all available flights in the BL(<2 km) were therefore used to estimate the average BL NOx-CO correlation. It can bejustified that this relationship is representative, since CO mixing ratios in the BL were inthe same range both for “thunderstorm” and for “fair weather” flights. The BL data weresampled mainly during take-off and landing near the campaign base. Hence, it was15
assumed that these values are representative for the entire BL covered by the selectedflights.
In Fig. 10b the correlation between measured NOx and CO for the Falcon flight of18 February is shown (black dots). Different types of air mass origin (Pacific, Ama-zon basin, anvil and background), as discussed in HH07, are marked. The measured20
NOx mixing ratios were mainly below 0.2 nmol mol−1, except during the anvil penetra-tions. The average NOx-CO correlation in the BL for all TROCCINOX flights (data fromFig. 1 in HH07) is also shown in Fig. 10b (red-yellow dots). Average CO mixing ratiosduring the anvil penetrations of the 18 and 4 February flights were 95–105 and 105–115 nmol mol−1, respectively. From the measured BL-CO (90–120 nmol mol−1) and the25
correlation, the average BL-NOx mixing ratio and its standard deviation (std) were es-timated to be 0.11±0.07 nmol mol−1. For the anvil penetrations of 4 and 18 Februarylisted in Table 2a, average LNOx volume mixing ratios (χLNOx) were determined by sub-
14832
ACPD7, 14813–14894, 2007
Lightning activity inBrazilian
thunderstorms
H. Huntrieser et al.
Title Page
Abstract Introduction
Conclusions References
Tables Figures
J I
J I
Back Close
Full Screen / Esc
Printer-friendly Version
Interactive Discussion
EGU
traction of the mean BL-NOx contribution (0.11 nmol mol−1) from the mean anvil-NOx
values. The mean values for anvil-NOx range between 0.2–0.8 nmol mol−1 in the sub-tropical thunderstorm of 18 February and between 0.7–1.2 nmol mol−1 in the tropicalthunderstorms of 4 February (Table 2a in HH07). As a result, χLNOx values in the rangefrom 0.1 to 1.1 nmol mol−1 were obtained, as listed in Table 2a in the present paper.5
Overall, the contribution of BL-NOx to anvil-NOx in the selected thunderstorms of 4February (anvil 1a, 5a, and 2b) and 18 February (only anvil penetrations I, III and Vclosest to the core considered here) was ∼10–20%. This range is slightly lower thanthe average found in European thunderstorms with 25 to 40% (Huntrieser et al., 1998,2002). In the investigated TROCCINOX thunderstorms, the contribution from LNOx10
clearly dominated the anvil-NOx budget with ∼80–90%. This contribution is higherthan observed during the TRACE-A experiment at the end of the dry (burning) season,where only 30–40% of anvil-NOx was attributed to LNOx (Pickering et al., 1996).
4.4 Estimate of the horizontal LNOx mass flux
Cloud-model simulations indicate that most LNOx produced in a thunderstorm is trans-15
ported into the anvil (Skamarock et al., 2003). If the total LNOx mass in the anvilregion (dependent on the LNOx mixing ratio and the volume covered by this LNOx)and the total number of flashes in the thunderstorm that contributed to this LNOx wereknown, the LNOx production rate per flash could be estimated, assuming a constantLNOx production per flash. Up to now, however, no method exists which can determine20
the required parameters exactly. Model approaches have e.g. estimated the horizontalNOx flux out of the anvil through a vertical control surface (Skamarock et al., 2003;Barthe et al., 2007). A combination of in situ aircraft observations and cloud-modelsimulations was used to separate the outflow flux into a LNOx flux and an environ-mental NOx flux. This approach was originally introduced by Chameides et al. (1987)25
for airborne measurements in thunderstorms during GTE/CITE and has also been ap-plied by us for measurements in LINOX and EULINOX thunderstorms (Huntrieser et
14833
ACPD7, 14813–14894, 2007
Lightning activity inBrazilian
thunderstorms
H. Huntrieser et al.
Title Page
Abstract Introduction
Conclusions References
Tables Figures
J I
J I
Back Close
Full Screen / Esc
Printer-friendly Version
Interactive Discussion
EGU
al., 1998, 2002). Alternatively, the NO content in the thunderstorm is estimated fromthe product of airborne in situ measurements of NO at certain levels in the anvil andthe estimated volume of the appropriate cloud segments (Ridley et al., 2004). The totalvolume is derived from the sum of the vertically staggered flight segments. The twomethods are described in more detail in SH07.5
The TROCCINOX thunderstorm penetrations listed in Table 2a provide only snap-shots of the conditions at a certain level of the cloud at a certain time. It is not knownhow representative these anvil penetrations are for the average anvil conditions (seealso discussion in Sect. 3.2). These are, however, the only measurements that areavailable. Time series of trace gas measurements (NOx, CO, and O3) during the pene-10
trations listed in Table 2a have already been presented and discussed in HH07. On the18 February flight, the anvil outflow from the selected thunderstorm system was suc-cessfully penetrated 6 times (Fig. 4b). In addition to the mentioned trace gases, NOywas measured and mixing ratios during the 6 penetrations are shown together with thevertical velocity (absolute values) in Fig. 11. The 1 s absolute velocity values mainly15
varied between 0.1 and 1.0 m s−1 indicating that the measurements were carried outoutside the core region of the thunderstorm cell, where far higher vertical velocitiesare to be expected. The highest NOy mixing ratios were measured during the anvilpenetrations with the strongest vertical velocities, which is closer to the core region(∼10–30 km) where most lightning occurs (penetration I, III and V). The closest pene-20
tration to the maximum anvil outflow level was penetration III, where the mean updraftvelocity (0.8 m s−1) was distinctly higher than the mean downdraft velocity (0.2 m s−1),and the highest mean NOy mixing ratio (1.1 nmol mol−1) was measured. About 30 kmfurther downwind (penetration II, IV, VI), the measurements indicate that a large partof the outflow already mixed with the ambient air (similar mean updraft and downdraft25
velocities).Moreover, on 4 February the selected thunderstorms were penetrated only once, but
rather close to the core. Hence, too few repeated anvil penetrations and limited radarreflectivity data are available to apply the method introduced by Ridley et al. (2004). We
14834

ACPD7, 14813–14894, 2007
Lightning activity inBrazilian
thunderstorms
H. Huntrieser et al.
Title Page
Abstract Introduction
Conclusions References
Tables Figures
J I
J I
Back Close
Full Screen / Esc
Printer-friendly Version
Interactive Discussion
EGU
therefore use a modified version of the method introduced by Chameides et al. (1987)and assume that the measurements during each anvil penetration (snapshots) arerepresentative average anvil conditions. We consider the horizontal mass flux of LNOxthrough a vertical control surface. The vertical surface dimensions can be estimatedfrom the combination of e.g. airborne measurements and FLEXPART simulations as5
explained before in Sect. 4.2 and as indicated in Fig. 3. Repeated penetrations ofthe 18 February thunderstorm system indicated that ∆z was >1.3 km (10.7–9.4 km,Table 2a). The entire vertical extent of the anvil outflow can be most clearly seen invertical profiles of the CO mixing ratio measured by the high-flying Geophysica (per-sonal communication, P. Mazzinghi, INOA/CNR). On 18 February the most distinct10
enhancement in the CO mixing ratio was observed between ∼9–12 km altitudes and∆z was set to ∼3 km (see Table 2a). On 4 February the enhancement in CO was lessclear owing to elevated background mixing ratios: enhanced mixing ratios were mainlyobserved between ∼10–14 km altitudes and ∆z was set to ∼4 km (see Table 2a).
The horizontal LNOx mass flux FLNOx (in nitrogen mass per time, g s−1) was calcu-15
lated for each thunderstorm penetration listed in Table 2a according to:
FLNOx = χLNOx ·MN
Mair· ρa(Va − Vs) ·∆x ·∆z (4)
where χLNOx is the mean NOx volume mixing ratio produced by lightning (mol mol−1),MN and Mair are the molar masses of nitrogen (14 g mole−1) and air (29 g mole−1),respectively, ρa is the air density (g m−3) calculated from measured temperature and20
pressure in the anvil, and Va − Vs is the difference between the wind vectors in the anviloutflow and at the steering level (see Table 2b). The last term ∆x·∆z is the area (m2)of the vertical cross-section perpendicular to the wind direction in the anvil outflow.In general, the wind at the steering level (∼700 hPa) determines the mean motion ofa thunderstorm cell (Keenan and Carbone, 1992), but this parameter is not available25
from the airborne measurements. Instead, horizontal LINET stroke distributions, asshown in Fig. 4, were plotted with a higher temporal resolution (10 min) and the storm
14835

ACPD7, 14813–14894, 2007
Lightning activity inBrazilian
thunderstorms
H. Huntrieser et al.
Title Page
Abstract Introduction
Conclusions References
Tables Figures
J I
J I
Back Close
Full Screen / Esc
Printer-friendly Version
Interactive Discussion
EGU
motion (Vs) was determined from the temporal stroke evolution. The parameters inEq. 4, except ∆x (Sect. 4.2) and ∆z, were calculated directly from Falcon measure-ments by averaging the measured data over the time period when the thundercloudwas penetrated (between entry and exit of anvil), see Table 2a.FLNOx values were calculated for the selected thunderstorms by insertion of the pa-5
rameters listed in Table 2a into Eq. 4, which give nitrogen mass flux values between48 and 178 g s−1 (Table 2a). The flux values for subtropical thunderstorms (only anvilI, II, and V considered) and tropical thunderstorms are within a similar range. The fluxvalues in Table 2a can be divided by the molar mass for nitrogen and the area of thevertical cross-section (∆x·∆z) to estimate the flux in the unit mol m−2 s−1. The range of10
these fluxes, 3.3–7.1×10⁻⁸ mol m−2 s−1, is well comparable to nitrogen mass flux val-ues simulated by Barth et al. (2007) who ran different cloud-scale models (range 2.7–13.0×10⁻⁸ mol m−2 s−1) and to Barthe et al. (2007), who simulated 6×10⁻⁸ mol m−2 s−1
on average in the anvil outflow of a STERAO storm.The parameters listed in Table 2a have large uncertainties. The relative maximal15
error of the FLNOx estimate was therefore calculated. The uncertainty for χLNOx isgiven by the standard deviation (on average ∼50% of the mean value); for Va − Vsthe standard deviations listed in Table 2b indicate an uncertainty of up to ∼50%; for∆x the uncertainty was ∼5–10 km corresponding to ∼40%; and for ∆z the verticalanvil extension on 4 February varied between 3.5–6 km and on 18 February between20
2–4 km indicating an uncertainty up to ∼50%. Summing up these uncertainties, therelative maximal error of the FLNOx estimate is ∼190%.
4.5 Estimate of the LNOx production rate per stroke and per year
For the estimate of the LNOx production rate PLNOx (nitrogen mass per stroke, in gstroke−1), the horizontal LNOx mass flux FLNOx (g s−1) is divided by the LINET stroke25
14836

ACPD7, 14813–14894, 2007
Lightning activity inBrazilian
thunderstorms
H. Huntrieser et al.
Title Page
Abstract Introduction
Conclusions References
Tables Figures
J I
J I
Back Close
Full Screen / Esc
Printer-friendly Version
Interactive Discussion
EGU
rate RLINET (strokes s−1):
PLNOx =FLNOx
RLINET(5)
PLNOx estimates for the selected anvil penetrations resulted in values between 1.9 and5.6 kg stroke−1, see Table 2a. Unfortunately, the dataset in Table 2a is very sparse.Nevertheless, mean PLNOx values for three tropical and one subtropical thunderstorms5
(only anvil penetrations I, III and V considered) are estimated to 2.4 and 4.5 kg stroke−1,respectively, which corresponds to 4.8×1025 and 9.0×1025 molecules NO stroke−1.These results suggest that a subtropical thunderstorm may produce more LNOx perLINET stroke than a tropical thunderstorm (factor ∼2). Possible reasons for this differ-ence will be discussed in Sects. 5 and 6.10
For comparison with other published results, the PLNOx estimates per LINET strokewere scaled to PLNOx estimates per LIS flash. During the TROCCINOX field periodfrom 21 January to 27 February 2005, only one overpass of 4 February at 21:23:45–21:25:21 UTC provided a sufficient large set of coincident LINET and LIS measure-ments. On this day, lightning activity in the LINET centre area (21.5–22.5◦ S and 48.5–15
49.5◦ W) and close-by (covering totally 20.0–23.0◦ S and 48.5–50.5◦ W) was suitablefor comparison. Overall 82 LIS flashes and 481 LINET strokes were registered in thestudied area during the ∼90 s measurement. LINET strokes with peak currents down toat least 4 kA (absolute value) were sensed by LIS. For the selected time period, Fig. 12shows the horizontal distributions of all available LINET strokes (black dots) and LIS20
flashes (red dots) for the area where most lightning occurred (21.4–22.4◦ S and 48.5–50.0◦ W) together with radar reflectivity (grey). For the PLNOx estimate, only strongerLINET strokes with peak currents ≥10 kA are considered (in total 41 strokes, yellowdots) as mentioned before in Sect. 4.1. The LIS detection efficiency at night (0.93) wastaken into account (21:23–21:25 UTC = 19:23–19:25 Brazilian Summer Time). This25
implies a LINET/LIS ratio of about (41/82)×0.93=0.5, considering only LINET strokeswith peak currents ≥10 kA.
14837

ACPD7, 14813–14894, 2007
Lightning activity inBrazilian
thunderstorms
H. Huntrieser et al.
Title Page
Abstract Introduction
Conclusions References
Tables Figures
J I
J I
Back Close
Full Screen / Esc
Printer-friendly Version
Interactive Discussion
EGU
By means of this ratio, the mean values for PLNOx per LIS flash for tropical andsubtropical thunderstorms (only anvil penetrations I, III, and V considered) are 1.2and 2.2 (range 0.9–2.8) kg, respectively, corresponding to 2.4 and 4.5 (range 1.9–5.6)×1025 molecules NO. These estimates for TROCCINOX are well within the rangeof more recent estimates. From a review of previous investigations, SH07 derive a5
best-estimate of 3.5 (range 0.5–10) kg of nitrogen per flash.The estimates for PLNOx per LIS flash were multiplied with the number of LIS flashes
occurring globally, 44 flashes s−1. If the selected tropical and subtropical TROCCINOXthunderstorms were representative for the globe, the implied mean annual global LNOxproduction rate GLNOx would be ∼1.6 and 3.1 Tg a−1, respectively (factor ∼2 difference).10
These values are close to previous best estimates for mid-latitude thunderstorms overEurope, 3–4 Tg a−1 (Huntrieser et al., 1998, 2002). The individual estimates for the sin-gle thunderstorm penetrations listed in Table 2a, however, range from 1.3 to 3.9 Tg a−1,indicating a wide range of values and large uncertainties depending on where (horizon-tally and vertically) the anvil was penetrated.15
Finally, the relative maximal errors of the PLNOx and GLNOx estimates (Table 2a) werecalculated. The uncertainty for RLINET was estimated from the standard deviationsof the time series of the LINET stroke rates (Fig. 5). The standard deviations var-ied between 50–90% of the mean values. From the estimates for FLNOx ∼190% andRLINET ∼90%, the relative maximal error of the PLNOx estimate for LINET strokes was20
∼280%. For the PLNOx estimate for LIS flashes, it was assumed that the uncertaintyin the conversion of LINET strokes (≥10 kA) to LIS flashes was ∼30% (depending onwhich LIS detection efficiency was used: day or night). This gives a relative maximalerror of ∼310%. For the GLNOx estimate, the uncertainty in the global LIS flash ratewas given with ∼10%, which gives a final relative maximal error of ∼320%. Given this25
relative maximum error, the final range for the GLNOx values listed in Table 2a is be-tween 0.4 and 12 Tg a−1. This range is comparable to other ranges given for GLNOx inprevious publications (see Sect. 1 and SH07).
14838

ACPD7, 14813–14894, 2007
Lightning activity inBrazilian
thunderstorms
H. Huntrieser et al.
Title Page
Abstract Introduction
Conclusions References
Tables Figures
J I
J I
Back Close
Full Screen / Esc
Printer-friendly Version
Interactive Discussion
EGU
5 Possible explanations for different LNOx production rates in tropical, sub-tropical and mid-latitude thunderstorms
The results in the previous section lead us to hypothesise that tropical thunderstormsover Brazil may produce less LNOx per stroke than subtropical thunderstorms. In thissection we investigate whether these differences in the LNOx production rate may be5
related to differences in the stroke peak currents (Sect. 5.1), stroke lengths (Sect. 5.1)or stroke release heights (Sect. 5.2) (relationships investigated by Wang et al., 1998,in the laboratory). Furthermore, mean stroke peak currents observed by LINET arecompared for several tropical and mid-latitude thunderstorms and for one subtropicalthunderstorm (Sects. 5.3–5.4).10
5.1 LNOx production rate as a function of stroke peak current
In this subsection we combine the result of laboratory measurements by Wang etal. (1998) with our field measurements to determine the LNOx production rate as afunction of peak current. Wang et al. (1998) determined the NO production rate perunit laboratory spark, whereas our analysis provides the NO production rate per LINET15
stroke in the field. We assume that both follow the same dependency on peak currentas given by Wang et al. (1998). Hence, both differ only by a constant factor, whichhas the dimension of laboratory spark length per LINET stroke. This factor will bedetermined below.
The relationship between the peak current and NO produced per spark as found by20
Wang et al. (1998) from measurements in the laboratory (at 1.01×10⁵ Pa) is given by:
nNOlab(I) = a + b × I + c × I2 (6)
where nNOlab(I) is the NO production normalised to 1 m spark length (1021 moleculesNO m−1), a=0.14, b=0.026, and c=0.0025 and I is the peak current of the spark (kA).The number of NO molecules can be converted to the mass of nitrogen according to:25
MNOlab(I) = MW × nNOlab
(I) (7)14839

ACPD7, 14813–14894, 2007
Lightning activity inBrazilian
thunderstorms
H. Huntrieser et al.
Title Page
Abstract Introduction
Conclusions References
Tables Figures
J I
J I
Back Close
Full Screen / Esc
Printer-friendly Version
Interactive Discussion
EGU
where MNOlab(I) is the nitrogen production per to 1 m spark length (10−3 g m−1) andMW is a constant (molecular weight of N, unit g molecule−1). According to Eq. (7) alaboratory spark with 10 kA would produce 0.015 g nitrogen m−1.
Furthermore, Eq. (7) was multiplied with a constant factor CLINET (m laboratory sparkper LINET stroke) to convert the production per laboratory sparks and metre to the total5
number of LINET strokes. Here we assume that all LINET strokes in one specific anvilhave the same length, independent of peak current and flash component, since nofurther information is available from our dataset. The factor CLINET was estimated fromEq. (8). Values from Table 3 for anvil 1a (lower half of table, here only strokes ≥10 kAconsidered) were inserted in Eq. (8); the mean LNOx mass flux, FLNOx, (120 g s−1),10
and the LINET stroke rate (strokes s−1), RLINET(I), for a given peak current I :
FLNOx = CLINET
∞∫I=10
RLINET(I) ×MNOlab(I) dI (8)
where RLINET(I) was estimated from Eq. (9):
RLINET(I) =1t
t∫t=0
NLINET(I, t) dt (9)
and NLINET(I, t) is the number of LINET strokes for a given peak current and time.15
The value of RLINET in Eq. (9), integrated over all peak currents (here ≥10 kA), is0.055 strokes s−1 (Table 3 lower half, anvil 1a). The total integral in Eq. (8) (peak cur-rents from anvil 1a inserted) is estimated to 2.71×10⁻³ strokes s−1 g m−1laboratoryspark. The corresponding LINET factor, CLINET, was estimated to 44.4×10³
(=120/(2.71×10−3)) m laboratory spark stroke−1 (see Table 3). We expect a LINET20
stroke in the atmosphere to be shorter than this calculated length (44 km), but probablybroader than a laboratory spark. One metre LINET stroke is therefore probably moreefficient in producing LNOx than a laboratory spark.
14840

ACPD7, 14813–14894, 2007
Lightning activity inBrazilian
thunderstorms
H. Huntrieser et al.
Title Page
Abstract Introduction
Conclusions References
Tables Figures
J I
J I
Back Close
Full Screen / Esc
Printer-friendly Version
Interactive Discussion
EGU
Applied to LINET strokes, Eq. (7) changes to:
MNOlinet(I) = CLINET ×MNOlab
(I) (10)
where MNOlinet(I) is the nitrogen mass production per LINET stroke (g stroke−1). ALINET stroke with a peak current of 10 kA (anvil 1a) would produce 0.7 kg nitrogenaccording to Eq. (10). This value is rather large because peak currents <10 kA were5
neglected (Table 3, lower half) and the total LNOx mass was distributed only overstrokes ≥10 kA in Eq. (8).
The same calculations were performed for other selected thunderstorm penetrationsof 4 and 18 February 2005, as shown in Figs. 13a–d and as listed in Table 3. In Table 3every thunderstorm penetration is listed twice. For the first calculation (upper half in10
the table) all registered strokes were considered (peak currents down to 2 and 6 kA,depending on the detection efficiency in that area). For a comparison between the4 and 18 February selected penetrations, however, only strokes with peak currents≥10 kA were considered, as listed in the lower half of the table.
In Figs. 13a–d the frequency distributions of LINET strokes (grey bars) per 1 kA peak15
current interval are shown for the selected thunderstorms of 4 and 18 February 2005.The stroke frequency rapidly decreases with increasing peak current. Superimposedare the laboratory results by Wang et al. (1998) concerning the NO dependency onpeak current modified for LINET strokes (blue dashed line) according to Table 3 (differ-ent CLINET values considered), and in addition the estimated total amount of nitrogen20
mass produced per 1 kA LINET stroke interval for the selected thunderstorm systems(red line). The total mass estimates are listed in Table 3.
In Fig. 13e–f the same type of calculations were performed for datasets with a largernumber of LINET strokes to point out more clearly the differences between the strokepeak current frequency distributions of 4 and 18 February. All strokes (≥10 kA) in25
the LINET centre area on 4 February between 00:00 and 24:00 UTC were consid-ered in Fig. 13e. In Fig. 13f the same calculations were performed for the selectedthunderstorm system of 18 February for all strokes (≥10 kA) between 14:00 UTC and
14841

ACPD7, 14813–14894, 2007
Lightning activity inBrazilian
thunderstorms
H. Huntrieser et al.
Title Page
Abstract Introduction
Conclusions References
Tables Figures
J I
J I
Back Close
Full Screen / Esc
Printer-friendly Version
Interactive Discussion
EGU
21:00 UTC (see Fig. 4b). The integral over all peak currents gives a total nitrogen massof 8.8×10³ kg produced by 4359 tropical strokes on 4 February (Fig. 13e), and a largervalue of 11.2×10³ kg produced by 2034 subtropical strokes on 18 February (Fig. 13f).This example also suggests that a subtropical stroke may produce a larger amountof nitrogen mass than a tropical stroke (here by a factor 2.7), mainly owing to differ-5
ences in the stroke length (160 and 44 km, respectively). The higher production rateof LNOx by subtropical strokes was not caused by the stroke peak currents, since thisfrequency distribution was shifted to lower peak currents on 18 February (mean 31 kA,calculated from data in Fig. 2) compared with 4 February (mean 35 kA), as indicated inFigs. 13e–f.10
From the stroke frequency distributions of 4 February it was estimated that strokeswith peak currents ≥5 kA (only 30% of all strokes) produce the bulk amount (70%) ofthe total nitrogen mass. This result indicates that the numerous weak strokes with peakcurrents <5 kA are less important for the LNOx production. In Fig. 14 the same strokefrequency distribution separated, however, into IC and CG strokes, indicates that these15
weak strokes are mainly IC strokes. Furthermore, Figs. 13a–b indicates that there wasa large fraction of these strokes with low peak currents in anvil 1a compared with anvil5a. Yet, the high stroke rate in anvil 1a (0.252 s−1) produces a similar mean LNOxmass flux, FLNOx, value as in anvil 5a with a much lower stroke rate (0.167 s−1) (Ta-ble 3, upper half). (The calculations for FLNOx are based on similar penetration levels:20
10.6 and 10.7 km.) Furthermore, the calculated stroke length was slightly shorter inanvil 5a (∼25 km) compared with anvil 1a (∼30 km), and the IC stroke release height(Table 4a) was slightly higher in anvil 5a (11.6 km) compared with anvil 1a (10.0 km).This result indicates that the lower stroke rate, shorter stroke length and higher strokerelease height (see Sect. 5.2) in anvil 5a cannot explain the similar FLNOx values de-25
termined for anvil 1a and 5a. Only if the higher stroke peak currents in anvil 5a (mean12 kA, Table 4a) compared with anvil 1a (mean 8 kA) are considered, these may givean explanation in this case.
14842

ACPD7, 14813–14894, 2007
Lightning activity inBrazilian
thunderstorms
H. Huntrieser et al.
Title Page
Abstract Introduction
Conclusions References
Tables Figures
J I
J I
Back Close
Full Screen / Esc
Printer-friendly Version
Interactive Discussion
EGU
5.2 LNOx production rate as a function of atmospheric pressure
A further explanation for the different LNOx production rates of tropical and subtropicalstrokes in the selected Brazilian thunderstorms may be related to the release height ofthe strokes. Laboratory measurements by Wang et al. (1998) indicate that the LNOxproduction rate increases with increasing atmospheric pressure:5
nNOlab(p) = a + b × p (11)
where nNOlab(p) is the NO production normalised to 1 m spark length(1021 molecules NO m−1), a=0.34, and b=1.30, and p is the pressure (105 Pa).A laboratory spark at 1000 hPa (ground level) would produce 0.038 gN m−1; at 500 hPa(300 hPa) about 0.023 (0.017) gN m−1 would be produced. The average height of IC10
strokes at mid-latitudes (Table 4a) is ∼10.0 km (270 hPa) and in the tropics ∼10.5 km(250 hPa) (Table 4a). The calculated difference in LNOx production rate (factor 1.1)between these two altitudes (0.016 and 0.015 gN m−1, respectively) is only minor andcannot explain the distinctly higher LNOx production rate of subtropical strokes. Only ifwe make the unrealistic assumption that all subtropical strokes are CG strokes (mean15
release height ∼700 hPa) and all tropical strokes are IC strokes (mean release height250 hPa) can a factor of ∼2 (=0.029/0.015) difference be achieved.
In the last subsection it was concluded that weak strokes with peak currents <5 kAare less important for the LNOx production. The majority of strokes with peak currents<5 kA are IC strokes according to the frequency distributions of IC and CG strokes in20
Fig. 14. These IC strokes are released in the UT at low pressure. Taking this furtherrelationship into account (decreasing LNOx production rate with decreasing pressure),we find that the large number of very weak strokes with peak currents <5 kA only havea minor contribution to the LNOx budget.
14843

ACPD7, 14813–14894, 2007
Lightning activity inBrazilian
thunderstorms
H. Huntrieser et al.
Title Page
Abstract Introduction
Conclusions References
Tables Figures
J I
J I
Back Close
Full Screen / Esc
Printer-friendly Version
Interactive Discussion
EGU
5.3 Comparison of mean stroke peak currents in several tropical and one subtropicalBrazilian thunderstorms
The results in the previous subsections lead us to hypothesise that the different strokelengths (calculated) may mainly contribute to the different LNOx production rates de-termined for several tropical and one subtropical Brazilian thunderstorms. The con-5
tribution from the different stroke peak current frequency distributions was found tobe minor, but maybe important to explain differences between single tropical thunder-storms as mentioned in Sect. 5.1. In this subsection, values of the mean peak current(also separated for CG and IC strokes) are analysed in detail for a larger number oftropical Brazilian thunderstorms in the period with available LINET measurements (2110
January–27 February 2005) to investigate the differences between a number of tropicalthunderstorms and the subtropical thunderstorm of 18 February.
For an equivalent comparison only strokes in the centre of the LINET detection net-work (from 21.5◦ S to 22.5◦ S and 48.5◦ W to 49.5◦ W, 00:00–24:00 UTC) were con-sidered to avoid changes in detection efficiency and in the IC/CG VLF source ratio15
towards the border line. Selected days with a large number of LINET strokes suitablefor statistical calculations are listed in Table 4a (4b) for peak currents ≥1 kA (≥10 kA).
The selected days were classified according to HH07 into different categories: trop-ical, transition tropical-subtropical and subtropical cases, by use of the meteorologicalparameters listed in Table 4c (daily mean values) and as indicated in Fig. 15 (3 h val-20
ues). In Table 4c the equivalent potential temperature (Θe) at 850 and 500 hPa, andthe wind velocity and direction at 200 hPa are listed for the selected LINET days in Ta-ble 4a–b. As suggested in HH07, Θe in tropical air masses exceeded 345 K at 850 hPaand 332 K at 500 hPa and the UT wind velocity was in general low ∼5–10 m s−1, influ-enced by the Bolivian High.25
The 4 February 2005 was selected as a case representative for tropical thunderstormactivity in general. In the selected region ∼36 000 strokes were registered during thewhole day (Table 4a). As expected for tropical thunderstorms, the fraction of IC strokes
14844

ACPD7, 14813–14894, 2007
Lightning activity inBrazilian
thunderstorms
H. Huntrieser et al.
Title Page
Abstract Introduction
Conclusions References
Tables Figures
J I
J I
Back Close
Full Screen / Esc
Printer-friendly Version
Interactive Discussion
EGU
dominates over CG strokes and amounts to at least 57%. The ≥ symbol indicates thatthe fraction of IC strokes may be even larger. The 3D procedure applied to discriminatebetween IC and CG strokes categorises some strokes as uncertain. In most cases, thisstroke is a CG stroke (and was here defined as CG), but for unfavourable positions ofthe measuring network stations it cannot be excluded that it is an IC stroke. Note that5
we do not deal here with flash counts but with flash component (stroke) counts. In Table4a the fraction of positive and negative IC and CG strokes for 4 February (all data) wasdetermined to ≥35% (IC+), ≥22% (IC-), <24% (CG-) and <19% (CG+). The overallmean peak current (magnitude) was 6 kA. The mean peak currents for the differenttypes of strokes (as mentioned above) were +4, −5, −10 and +5 kA, respectively. The10
ratio of positive to negative strokes was 1.2. The mean height of IC strokes was 9.7 km.Furthermore, the last column in Table 4a indicates that the fraction of peak currents≥10 kA was 12%.
These results from the 4 February tropical thunderstorms can be compared withother tropical thunderstorms (see Table 4a–b) and the 18 February subtropical thun-15
derstorm. In Table 4a a high mean peak current of 13 kA is given for the 18 Februarywhich, however, is not comparable to the rest of the data in Table 4a, since the stormwas located along the northern periphery of the LINET network (detection efficiencylower). For an equivalent comparison, only strokes ≥10 kA, as listed in Table 4b, wereconsidered and an area along the northern periphery of the LINET detection network20
(19.4–20.0◦ S and 47.7–49.2◦ W, see Fig. 4b), where the subtropical thunderstorm of18 February 2005 developed, was selected. The calculated mean peak currents forthis area indicate a slightly lower mean peak value, 17 kA, for the subtropical thunder-storm of 18 February compared with the mean peak value for tropical thunderstormsof 4 February for the same area, 20 kA (same value as found for the LINET centre25
area listed in Table 4b, indicating that the detection efficiency for higher peak currentsis about the same in the LINET centre and along the northern periphery, as also dis-cussed in Sect. 4.1).
Overall, the mean peak currents in different tropical thunderstorms of 4 February
14845

ACPD7, 14813–14894, 2007
Lightning activity inBrazilian
thunderstorms
H. Huntrieser et al.
Title Page
Abstract Introduction
Conclusions References
Tables Figures
J I
J I
Back Close
Full Screen / Esc
Printer-friendly Version
Interactive Discussion
EGU
(and other tropical thunderstorms listed in Table 4b) were highly variable between 18and 26 kA (probably depending on thunderstorm intensity). In the next section thesevalues are compared with mean peak currents in mid-latitude thunderstorms over Ger-many to investigate if any major differences exist.
5.4 Comparison of mean stroke peak currents in several tropical and mid-latitude5
thunderstorms
The LINET network was also operated in southern Germany in summer 2005(Sect. 2.2). LINET measurements covered an area reaching from 47◦ N to 51◦ N andfrom 5◦ E to 14◦ E. The 29 July 2005 was one of the days in summer 2005 with thehighest lightning activity over Germany. In the LINET area ∼500 000 strokes were reg-10
istered during the whole day. In Fig. 16a–b the cloud distribution over Europe on thisday is shown together with the horizontal distribution of LINET strokes over southernGermany and the positions of the LINET sensors, respectively.
For further estimates with LINET data, only data in the LINET centre region wereconsidered (here 48.5◦ N to 49.5◦ N and 11◦ E to 12◦ E), as mentioned previously. Other15
days during the German field campaign in June and July 2005 with a high LINET strokeactivity in this area were 29 June and 4, 10 and 15 July. The stroke statistics from thesedays are listed in Table 4a–b (for peak currents ≥1 kA and ≥10 kA, respectively) (lowerhalf of table) and can be compared with LINET stroke statistics from Brazil (upper halfof table). On 29 June and 29 July strokes in two intense, isolated fast-moving thunder-20
storms (TS) with high flash rates were considered. On 4, 10 and 15 July all strokes inthe LINET centre area were considered. The mean peak currents on the latter days(Table 4a) were 5–6 kA, comparable to the lowest values observed in tropical Brazil-ian thunderstorms with 5–12 kA (probably lower over Germany owing to the slightlyhigher detection efficiency in the LINET centre because of a more dense network of25
LINET sensors). For the same reasons, the fraction of peak currents ≥10 kA in theseGerman thunderstorms with 10–15% was comparable to the lowest values in tropicalBrazilian thunderstorms with 8–34%. If only strokes with peak currents ≥10 kA are
14846
ACPD7, 14813–14894, 2007
Lightning activity inBrazilian
thunderstorms
H. Huntrieser et al.
Title Page
Abstract Introduction
Conclusions References
Tables Figures
J I
J I
Back Close
Full Screen / Esc
Printer-friendly Version
Interactive Discussion
EGU
considered, however, (Table 4b), the stroke statistics results from the 4, 10 and 15 JulyGerman thunderstorms (mean peak current 19–20 kA, ratio of peak currents ≥10 kA is30–32%) are within the range for tropical Brazilian thunderstorms (18–26 kA, 24–50%).
On 29 June and 29 July 2005 two strong, isolated fast moving thunderstorm systemsahead of cold fronts over Germany with a high stroke frequency were selected, as5
listed in Table 4a–b and as marked in Fig. 16b for 29 July. In Table 4a the mean peakcurrents (≥1 kA) in these storms were higher with 9 kA compared with 4, 10 and 15July, and also the ratio of peak currents ≥10 kA was higher with 25 and 29%, moresimilar to the upper values in Brazilian thunderstorms. As expected for mid-latitudethunderstorms (e.g. Prentice and Mackerras, 1977), the fraction of IC strokes ≥19–10
46% was on average less than in tropical Brazilian thunderstorms and the CG fractiondominated with <54–81% (all mid-latitude cases in Table 4a considered). Furthermore,the mean height of IC strokes was ∼0.5 km lower over Germany compared with Brazil.
To investigate how the different configurations and numbers of sensors over Ger-many and Brazil influenced the results, an additional dataset was analysed. For all15
selected German days, a dataset with a reduced number of LINET sensors was cre-ated. In the original LINET dataset from 29 July between 5 and 8 sensors (average7) were considered for the stroke determination in the selected thunderstorm system(indicated in Fig. 16b). In the reduced LINET dataset between 4 and 6 sensors wereused (average 5). The number and position of these sensors were selected to be as20
similar as possible to the configuration over Brazil (on 4 February four sensors) foran equivalent comparison. The dataset of 29 July with a reduced number of sensorsregisters fewer strokes and a slightly enhanced mean peak current of 11 kA comparedwith the original dataset (Table 4a, last line). If only strokes ≥10 kA are considered (Ta-ble 4b, last line), however, no differences between the original dataset and the dataset25
with a reduced number of sensors were found, which is also the case for the rest of theselected German days (not shown). LINET measurements over Brazil and Germanyare therefore well comparable (except for the lowest peak currents), in agreement withthe findings by Schmidt et al. (2005).
14847

ACPD7, 14813–14894, 2007
Lightning activity inBrazilian
thunderstorms
H. Huntrieser et al.
Title Page
Abstract Introduction
Conclusions References
Tables Figures
J I
J I
Back Close
Full Screen / Esc
Printer-friendly Version
Interactive Discussion
EGU
In Fig. 17a frequency distributions of LINET strokes (in the LINET centre area) asa function of peak current for the two different datasets on 29 July are given in colour(for comparison all curves were normalised). The general agreement between thetwo curves in red and blue is good, except that the reduced dataset (lower detectionefficiency) registers fewer strokes with low peak currents. The distributions show that5
strokes with a peak current of 2–3 kA were most frequently measured. For comparison,the frequency distribution in tropical thunderstorms over Brazil of 4 February 2005 isalso shown (in black). Distinctly more strokes with low peak currents (<7 kA) and fewerhigh peak currents (≥7 kA) were registered in these thunderstorms compared with theselected intense Germany thunderstorm system of 29 July. Next, a larger dataset is10
used to investigate this observed difference in peak current distributions for selectedGerman and Brazilian thunderstorms.
In Fig. 17b frequency distributions of LINET strokes (all strokes in the LINET cen-tre area) as a function of peak current for different datasets given in colour are shown(for comparison all curves were normalised). Five different datasets are compared:15
1.) tropical Brazil (78 745 strokes) including 230105, 040205 and 250205 (days witha large number of strokes, as listed in Table 4a–b), 2.) tropical Brazil (36 207 strokes)including only 040205, 3.) mid-latitude Germany (58 543 strokes) including 290605(here all data), 040705, 100705, 150705 and 290705 (here all data), 4.) mid-latitudeGermany (6738 strokes) including only 290605 (selected intense thunderstorm), 5.)20
mid-latitude Germany (3444 strokes) including only 290705 (selected intense thun-derstorm). This comparison shows no distinct differences in general between thestroke frequency distributions over Germany and over Brazil (dark blue and black lines).Again, this result confirms that the two LINET configurations are comparable.
For an estimate of the LNOx mass produced by the observed strokes, the stroke25
frequency distributions in Fig. 17a were multiplied with the modified Wang et al., 1998relationship (Eq. 10), as described in Sect. 5.1. In Fig. 17c the estimated amount ofNO produced per 1 kA stroke interval for the dataset in Fig. 17a is shown, with differentvalues for the calculated stroke lengths CLINET (from Table 3). The amount of produced
14848

ACPD7, 14813–14894, 2007
Lightning activity inBrazilian
thunderstorms
H. Huntrieser et al.
Title Page
Abstract Introduction
Conclusions References
Tables Figures
J I
J I
Back Close
Full Screen / Esc
Printer-friendly Version
Interactive Discussion
EGU
NO in Fig. 17c is a factor ∼8 higher for the selected intense mid-latitude German thun-derstorm system of 29 July 2005 (both distributions) compared with tropical Brazilianthunderstorms of 4 February 2005 in general (based on normalised distributions). Inthis example, the wide range of calculated stroke lengths (126 and 30 km, respectively)and stroke peak currents inserted (mean 10 and 6 kA, respectively) indicates that a5
large difference in the LNOx production rate may result in selected cases.In the tropical Brazilian thunderstorms of 4 February 2005 the majority of the strokes
∼90% have peak currents <10 kA. Figure 17c indicates that these strokes produceonly ∼50% of the total LNOx amount. In addition, ∼70% of all strokes have peak cur-rents <6 kA, but these produce only 30% of the total LNOx amount. In comparison, in10
the mid-latitude German intense thunderstorm system of 29 July 2005, about half ofthe strokes (∼50%) have peak currents <6 kA, but these strokes produce only ∼10%of the LNOx amount. Only a small fraction of all strokes ∼10% have peak currents>20 kA, which produce ∼60% of the total LNOx amount. These examples again indi-cate that the LNOx amount produced by a thunderstorm mainly depends on the number15
of strokes with peak currents >5 kA.
6 Discussion
The results in the previous section indicate that the amount of nitrogen produced bylightning in a thunderstorm is not well correlated with the number of strokes only (Ta-ble 3). We suggest, in accordance with Wang et al. (1998) and Barthe et al. (2007),20
that other lightning parameters such as stroke length, peak current and release heightalso necessarily have to be taken into account. The amount of nitrogen produced perm flash and kA for a given pressure level, see parameter S in Table 3, would be moreappropriate for comparison, but all of these parameters are in general not availablefrom operational lightning detection networks. Up to now, all these parameters have25
not been taken into account concurrently, which may explain the wide range of valuesfor the LNOx production rate per flash given in the literature (SH07). Furthermore, for
14849

ACPD7, 14813–14894, 2007
Lightning activity inBrazilian
thunderstorms
H. Huntrieser et al.
Title Page
Abstract Introduction
Conclusions References
Tables Figures
J I
J I
Back Close
Full Screen / Esc
Printer-friendly Version
Interactive Discussion
EGU
a more equivalent comparison it would also be desirable to always relate the estimatesfrom a specific lightning detection network to global lightning detection systems suchas LIS.
From the analyses of TROCCINOX data, which suggest a higher LNOx productionrate for a subtropical thunderstorm compared with several tropical thunderstorms, the5
stroke length was found to be the most important parameter responsible for the differ-ences. The calculated stroke length was on average a factor ∼3 longer in the inves-tigated subtropical thunderstorm (Table 3). We suggest that the reason for the longerstrokes may be related to the enhanced vertical shear in the horizontal wind in thisthunderstorm compared with tropical thunderstorms. In the subtropical case, the verti-10
cal wind velocity difference between the pressure levels 200 hPa and 700 hPa (Va − Vs)is 2–3 times larger than in the tropical thunderstorm (Table 2a–b, see also Fig. 14in HH07). The elevated vertical wind shear may distribute charged particles in thesubtropical cloud over longer horizontal distances generating longer flashes. Recentsimulations by Barthe and Pinty (2007) of an ideal supercellular storm case, using a15
3-D mesoscale model with an explicit lightning flash scheme, give some hints in thisdirection. Furthermore, conceptual models of the electrical structure in a mesoscaleconvective system (MCS) by Stolzenburg et al. (1994) and in a supercell by Wiens etal. (2005) (both storm types related to elevated wind shear) indicate that the chargedregions in the upper part of the cloud may stretch far away from the convective region20
with precipitation. A lateral displacement of upper level charge because of verticalwind shear was first suggested by Pierce (1955), Brook et al. (1982) and Hill (1988).Later, observations by Rutledge and MacGorman (1988) of MCS and by Engholm etal. (1990) of summer as well as winter storms confirmed a tilted deformation of thecharge centre by the vertical wind shear. More recently, these findings have been25
discussed by Gilmore and Wicker (2002) and Carey and Buffalo (2007).Unfortunately, for our dataset the actual stroke length cannot be determined from the
available lightning data. From the RINDAT data it is possible, however, to compare thelength between different VLF sources along a flash (“flash component”). VLF sources
14850

ACPD7, 14813–14894, 2007
Lightning activity inBrazilian
thunderstorms
H. Huntrieser et al.
Title Page
Abstract Introduction
Conclusions References
Tables Figures
J I
J I
Back Close
Full Screen / Esc
Printer-friendly Version
Interactive Discussion
EGU
within <1 s were grouped to a flash component. In Fig. 18a–b the horizontal loca-tions of the flash components are shown for two selected cases. For the 18 Februarysubtropical thunderstorm (strokes considered from 14:00 UTC–21:00 UTC, Fig. 4b) aclear pattern with longer flash components mainly between NW and SE results, in-fluenced by the strong vertical wind shear (Fig. 18a). In contrast, for the 4 February5
tropical thunderstorms (17:00 UTC–18:00 UTC, Fig. 4a) the horizontal distribution ofthese flash components shows no preferred direction (Fig. 18b), owing to the lowervertical wind shear. In addition, the flash components are on average shorter com-pared with the subtropical thunderstorm. The average length of the selected 224 flashcomponents on 4 February was 1.6 km compared with 3.1 km on 18 February based10
on the 173 flash components, a factor 1.9 difference in the lengths.The thunderstorm observations during TROCCINOX can also be compared with ob-
servations in Florida thunderstorms during CRYSTAL-FACE. Ridley et al. (2004) ob-served that NO mixing ratios in fresh (not heavily polluted) anvils were distinctly higherthan observed anywhere else up to then in fresh anvils. Average anvil-NO mixing ratios15
varied between ∼1–4 nmol mol−1, compared with 0.2–1.6 nmol mol−1NOx on averagein Brazilian anvils during TROCCINOX (HH07) and 1.3±0.7 nmol mol−1 NOx in morepolluted thunderstorms during EULINOX (Huntrieser et al., 2002). For two thunder-storms during CRYSTAL-FACE, Ridley et al. (2004) determined (3.3–6.6) × 1025 and(17–23) ×1025 molecules NO per flash (LIS) for a moderate size and a large storm,20
respectively. Only the values for the moderate size storm are within the range of themean value for a subtropical thunderstorm during TROCCINOX: 4.5 ×1025 moleculesNO per flash (LIS), respectively.
The reason for these extreme NO production rates in Florida anvils may be relatedto a combination of the lightning parameters mentioned above. First, the high flash25
rate in these storms may play an important role. The high flash density over Florida(>9 flashes km−2 a−1, Orville et al., 2002), however, is comparable to that of Brazil(mean 6–8 flashes and up to 10–15 flashes km−2 a−1 based on National LightningDetection Network (NLDN) and RINDAT, respectively) (Pinto and Pinto, 2003). Fur-
14851

ACPD7, 14813–14894, 2007
Lightning activity inBrazilian
thunderstorms
H. Huntrieser et al.
Title Page
Abstract Introduction
Conclusions References
Tables Figures
J I
J I
Back Close
Full Screen / Esc
Printer-friendly Version
Interactive Discussion
EGU
thermore, it has been reported that the mean peak current of CG flashes is shiftedto higher values in Florida thunderstorms compared with other regions in the UnitedStates: see mean peak values for different regions listed in Table 5. The NLDN de-tection efficiency for flashes with peak currents >5 kA is 80–90% since the upgradeof the system in 1994–1995 (Cummins et al., 1998) and 90–95% since the upgrade5
in 2002–2003 (Cummins et al., 2006). Values based on LINET data are also listedin Table 5 for comparison, which indicate a low mean value in the investigated sub-tropical thunderstorm, but just within the range of mean LINET values for tropical andmid-latitude thunderstorms. In the latter two storm types, the range of the mean peakcurrents is comparable, but the highest values were observed in tropical thunderstorms.10
The results presented in Table 5 indicate a latitudinal variation of mean peak currentfor NLDN, but not for LINET. Finally, the higher wind velocities in the UT over Florida(15 and 20 m s−1, Garrett et al., 2005) compared with tropical Brazil indicates that thestroke length may be longer in Florida thunderstorms. We therefore conclude that sev-eral lightning parameters, such as flash density, mean peak current and possibly flash15
length (related to UT wind velocity), achieve especially high values in Florida thun-derstorms, which may be responsible for the high anvil-NO mixing ratios and LNOxproduction rates per stroke observed. Other authors also mentioned that the most se-vere thunderstorms on earth occur in the central-eastern United States owing to theunique combination of steep lapse rates, moist boundary layer inflow and substantial20
wind shear (Doswell, 2001; Del Genio et al., 2007).Furthermore, in our study we find that the LNOx production rate per stroke may be a
factor ∼2 (up to 8) larger for subtropical and mid-latitude strokes than for tropical strokes(Table 2a-b, Fig. 17c). We therefore suggest that different estimates for the amount ofLNOx produced per stroke depending on region are needed for more accurate global25
LNOx estimates, taking stroke peak currents, stroke release height and stroke lengths(related to the vertical wind shear between upper and lower troposphere) into account.In agreement, recent simulations with the GEOS-CHEM model (Hudman et al., 2007)reveal that upper tropospheric NOx mixing ratios observed over the southern United
14852

ACPD7, 14813–14894, 2007
Lightning activity inBrazilian
thunderstorms
H. Huntrieser et al.
Title Page
Abstract Introduction
Conclusions References
Tables Figures
J I
J I
Back Close
Full Screen / Esc
Printer-friendly Version
Interactive Discussion
EGU
States during ICARTT (July–August 2004) can only be reproduced if the LNOx yield inthe model is increased by a factor 4 relative to the Ott et al. (2007b) value estimatedfrom EULINOX and other mid-latitude and subtropical storms. For the same model andperiod Martin et al. (2006) increased northern mid-latitude lightning NOx emissions bya factor 4 to fit aircraft observations while tropical lightning NOx emissions remained5
unchanged. Furthermore, preliminary cloud-model results from Pickering et al. (2007)for the 4 February 2005 case suggest that IC flashes in tropical thunderstorms in Brazilproduce less LNOx (factor 1.6) compared with previous cloud-model results based on5 mid-latitude and one subtropical thunderstorms. From our analyses of TROCCINOXdata, we suggest that mainly the different vertical wind shear in these regions (as it10
impacts the stroke length) may explain why different LNOx production rates per strokeare needed in the models.
7 Summary and conclusions
During the TROCCINOX field experiment in southern Brazil in the wet season of 2005,lightning-produced NOx (LNOx) in and around tropical and subtropical thunderstorms15
was investigated in large detail with the DLR Falcon and partly with the high-flying M55Geophysica aircraft. On two selected days (4 and 18 February), enhanced NOx mixingratios in the range of 0.2 to 1.2 nmol mol−1 (width 25–45 km) on average were observedduring anvil penetrations at 9–11 km altitudes. The main part of this NOx enhancement,80–90%, was attributed to LNOx while the contribution from the boundary layer (BL)20
was in general less important (10–20%). Overall, NOx mixing ratios in the anvil outflowregion were comparable in magnitude to those measured at mid-latitudes during othercampaigns (SH07), but distinctly lower than observed in fresh anvils during CRYSTAL-FACE over Florida, ∼1–4 nmol mol−1 NO (Ridley et al., 2004).
A lightning detection network, LINET, was set up to monitor the local stroke distri-25
bution (here VLF sources), which generally agreed well with observations from theoperational lightning detection network in Brazil, RINDAT, and with observations from
14853

ACPD7, 14813–14894, 2007
Lightning activity inBrazilian
thunderstorms
H. Huntrieser et al.
Title Page
Abstract Introduction
Conclusions References
Tables Figures
J I
J I
Back Close
Full Screen / Esc
Printer-friendly Version
Interactive Discussion
EGU
LIS. The horizontal LNOx mass flux in TROCCINOX thunderstorms was estimatedfrom the airborne measurements and trajectory simulations, and combined with LINETstroke rates. The average LNOx production rate per stroke and per LIS flash wereestimated. The final results gave ∼1 and ∼2–3 kg per LIS flash for three tropical andone subtropical Brazilian thunderstorms, respectively, suggesting a higher LNOx pro-5
duction rate in the latter storm type (factor ∼2). The estimated LNOx production rateswere multiplied with the number of LIS flashes occurring globally, 44 flashes s−1. Fromthese values, the mean annual global LNOx production rate was estimated to 1.6 and3.1 Tg a−1, respectively, from the two storm types mentioned above. These values arewell within the range of more recent estimates in SH07. The spread of the results for10
different thunderstorms penetrations (1.3–3.9 Tg a−1), however, indicates a large vari-ability. This variety mainly results from the extrapolation from single measurements inthe anvil outflow, which depends on the aircraft position relative to the thunderstormcore. The large uncertainty (∼320% relative max. error) in the estimates gives a finalrange of 0.4–12 Tg a−1.15
The analyses from TROCCINOX indicate that the amount of nitrogen produced bylightning in a thunderstorm is not well correlated with the number of strokes only. Itis suggested, from laboratory findings by Wang et al. (1998), that other lightning pa-rameters such as stroke length, peak current and release height also necessarily haveto be taken into account. Wang et al. (1998) observed a positive correlation between20
NO production rates per m laboratory spark and stroke peak currents and ambientpressure, which was applied to the present study. According to the first relationship,data from TROCCINOX indicate that the total amount of nitrogen produced by a thun-derstorm mainly depends on the number of strokes with peak currents >5 kA. Theanalyses from TROCCINOX further suggest that the reason for the higher LNOx pro-25
duction rate in the subtropical thunderstorm of 18 February (factor ∼2), compared withtropical thunderstorms of 4 February, may be related to the different stroke lengths (fac-tor ∼3 longer calculated for the subtropical storm) and is not related to differences inthe mean stroke peak current (slightly lower in the subtropical thunderstorm compared
14854

ACPD7, 14813–14894, 2007
Lightning activity inBrazilian
thunderstorms
H. Huntrieser et al.
Title Page
Abstract Introduction
Conclusions References
Tables Figures
J I
J I
Back Close
Full Screen / Esc
Printer-friendly Version
Interactive Discussion
EGU
with the tropical thunderstorms). Furthermore, the mean IC stroke height was ∼0.5 kmlower in the subtropical thunderstorm, though this difference may cause only a minordifference in the LNOx production rate. From these results it was suggested that thelonger stroke length in the subtropical thunderstorm may be related to the higher verti-cal wind shear between 200 and 700 hPa (factor ∼2–3), spreading charged particles in5
the anvil over larger distances. We therefore suggest that the vertical wind shear maybe an important parameter influencing the amount of LNOx produced per flash, whichhas not been taken into account up to now. For future model studies with CTMs, werecommend the incorporation of global meteorological fields of the vertical wind shearto account for the different regional LNOx production rates per stroke. Furthermore,10
for future field campaigns we suggest using lightning location systems that determinethe flash length more precisely (e.g. the French ONERA VHF interferometric mapperor the New Mexico Tech Lightning Mapping Array, LMA).
In addition, a comparison between the lightning activity in TROCCINOX thunder-storms over Brazil and in mid-latitude thunderstorms over Germany was carried out,15
as measurements with the LINET system were available for both areas in 2005. Thestroke frequency distribution as a function of peak current and the range of mean peakcurrents were in general similar in Brazilian tropical thunderstorms and German mid-latitude thunderstorms. For a selected case, however, it was estimated that the LNOxproduction rate per LINET stroke may be distinctly higher in intense German mid-20
latitude thunderstorms compared with tropical Brazilian thunderstorms in general (upto factor ∼8), owing to the longer stroke length (related to higher vertical wind shear)and the higher mean peak current in these storms.
Finally, the results from Brazilian thunderstorms during TROCCINOX were comparedwith Florida thunderstorms during CRYSTAL-FACE, where especially high anvil-NO25
mixing ratios and LNOx production rates per flash have been observed. Results fromthe available literature indicate that several lightning parameters, such as flash density,mean peak current and stroke length (related to UT wind velocity), all achieve espe-cially high values in Florida thunderstorms compared with other regions, which we
14855

ACPD7, 14813–14894, 2007
Lightning activity inBrazilian
thunderstorms
H. Huntrieser et al.
Title Page
Abstract Introduction
Conclusions References
Tables Figures
J I
J I
Back Close
Full Screen / Esc
Printer-friendly Version
Interactive Discussion
EGU
suggest may be responsible for the high NO mixing ratios observed in Florida storms.We conclude that one advantage of the present study is the use of a lightning location
system where the whole spectra of peak currents down to ∼1 kA can be detected. Inaddition, CG and IC strokes can be separated, and measurements with the same sys-tem were performed in tropical, subtropical and mid-latitude regions. With this system5
new insights into the LNOx potential for different types of strokes are possible, but it hasto be pointed out that the present study is based on a very limited dataset containingfew, random airborne penetrations of single subtropical and tropical thunderstorm sys-tems. Unfortunately, it is not known how representative these measurements are. Themain uncertainties originate from the estimate of mean anvil-NOx mixing ratios during10
few anvil penetrations, and from the limited altitude range covered by the aircraft. Alsothe attribution of the set of observed stroke events to the LNOx increase is very un-certain. Furthermore, the data were obtained only from a small set of thunderstormsystems over Germany and Brazil. Finally, the scaling between LINET and LIS obser-vations is uncertain because only one short time segment was available to compare15
both systems directly. Owing to these restrictions the uncertainties in the presentedresults may be large and the stated generalisations ought to be used with caution. Weare aware of the very limited dataset presented in this paper, but with this paper wewould like to give a hint in which direction further research concerning measurementsof LNOx in the field could take. Recently during AMMA (August 2006), the anvil out-20
flow from African thunderstorms was probed with several aircraft. In addition, recentmeasurements in tropical thunderstorms over Australia (Darwin) from the SCOUT cam-paign in December 2005 can be investigated in the same manner as presented in thispaper. During both field experiments lightning measurements were carried out with theLINET system.25
Even though the majority of global lightning occurs in the tropics (Christian et al.,2003), our study suggests that subtropical and mid-latitude thunderstorms may con-tribute with an essential fraction to global LNOx, since we observe a tendency thatthe stroke length (related to the vertical wind shear) is longer in these storms. As a
14856

ACPD7, 14813–14894, 2007
Lightning activity inBrazilian
thunderstorms
H. Huntrieser et al.
Title Page
Abstract Introduction
Conclusions References
Tables Figures
J I
J I
Back Close
Full Screen / Esc
Printer-friendly Version
Interactive Discussion
EGU
result, more LNOx may be produced per stroke in these storms with elevated verticalwind shear compared with tropical low-shear thunderstorms as observed over Brazil.Finally, we would like to point out that the estimated amount of LNOx produced perflash, as given in many studies (SH07), largely depends on the type of lightning detec-tion system used and therefore these estimates should be compared more carefully in5
future. Furthermore, the relationship between the used lightning system and LIS mustbe known if the values are scaled up with the annual global LIS flash rate (44 s−1), asdemonstrated in this paper.
Acknowledgements. TROCCINOX was partially funded by the Commission of the EuropeanCommunity under the contract EVK2-CT-2001-00122 and by the DLR (Deutsches Zentrum fur10
Luft- und Raumfahrt) and other TROCCINOX partners. TROCCINOX was performed as a co-ordinated action of European and Brazilian research institutes and agencies together with theBrazilian project Tropical Convection and Cirrus Experiment Brazil (TroCCiBras), see detailedacknowledgements in HH07. Furthermore, we are especially grateful to A. Minikin for his con-tribution to flight planning and his work as mission scientist on some of the flights, to A. Roiger,15
M. Lichtenstern and P. Stock (DLR-Oberpfaffenhofen) for instrument preparation, to C. Schwierz(ETH-Zurich) for meteorological support during the field campaign and post-campaign mete-orological analyses and to A. Stohl (NILU-Kjeller) for post-campaign meteorological analysesand helpful comments on draft manuscripts. We thank the Falcon pilots (M. Grossrubatscher,D. Gunther, M. Hinterwaldner and R. Welser), engineers and scientists of the flight department20
of DLR for the excellent support during the campaigns and the Geophysica team (especiallyP. Mazzinghi, F. D’Amato and S. Viciani, INOA/CNR, for the CO measurements). Further,T. Fehr (DLR), the Brazilian IPMet team and K. Schmidt, B. Fuchs and W. P. Oettinger fromthe LINET team (University of Munich) are greatly acknowledged for setting up and running theLINET system in Brazil and Germany. We thank P. S. Borges (IPMet, Sao Paolo State Uni-25
versity/UNESP, Bauru) for preparing the radar images from southern Brazil. We express ourgratitude to the lightning team at MSFC-NASA for the access to the LIS data. The EuropeanCentre for Medium Weather Forecasts (ECMWF) and the German Weather Service (DWD) areacknowledged for permitting access to the ECMWF archives. Finally, we are especially gratefulto E. Defer (LERMA, Observatoire de Paris), who critically reviewed draft manuscripts and gave30
insightful comments and helpful suggestions for the data analysis.
14857
ACPD7, 14813–14894, 2007
Lightning activity inBrazilian
thunderstorms
H. Huntrieser et al.
Title Page
Abstract Introduction
Conclusions References
Tables Figures
J I
J I
Back Close
Full Screen / Esc
Printer-friendly Version
Interactive Discussion
EGU
References
Barth, M. C., Kim, S.-W., Wang, C., et al.: Cloud-scale model intercomparison of chemicalconstituent transport in deep convection, Atmos. Chem. Phys. Discuss., 7, 8035–8085, 2007,http://www.atmos-chem-phys-discuss.net/7/8035/2007/.
Barthe, C. and Pinty, J.-P.: Simulation of a supercellular storm using a three-dimensional5
mesoscale model with an explicit lightning flash scheme, J. Geophys. Res., 112, D06210,doi:10.1029/2006JD007484, 2007.
Barthe, C., Pinty, J.-P., and Mari, C.; Lightning-produced NOx in an explicit electrical schemetested in a Stratosphere-Troposphere Experiment: Radiation, Aerosols, and Ozone casestudy, J. Geophys. Res., 112, D04302, doi:10.1029/2006JD007402, 2007.10
Beirle, S., Platt, U., Wenig, M., and Wagner, T.; NOx production by lightning estimated withGOME, Adv. Space Res., 34, 793–797, 2004.
Beirle, S., Spichtinger, N., Stohl, A., Cummins, K. L., Turner, T., Boccippio, D., Cooper, O.R., Wenig, M., Grzegorski, M., Platt, U., and Wagner, T.: Estimating the NOx produced bylightning from GOME and NLDN data: a case study in the Gulf of Mexico, Atmos. Chem.15
Phys., 6, 1075–1089, 2006.Bertram, T. H., Perring, A. E., Wooldridge, P. J., et al.: Direct measurements of the convective
recycling of the upper troposphere, Science, 315, 816–820, 2007.Betz, H.-D., Schmidt, K., Oettinger, W. P., and Wirz, M.: Lightning detection with 3D-
discrimination of intracloud and cloud-to-ground discharges, Geophys. Res. Lett., 31,20
L11108, doi:10.1029/2004GL019821, 2004.Betz, H.-D., Schmidt, K., Fuchs, B., Oettinger, W. P., and Holler, H.: Cloud lightning: Detection
and utilization for total lightning measured in the VLF/LF regime, J. Lightning Res., 2, 1–17,http://www.jorl.org., 2007.
Boccippio, D. J., Koshak, W. J., and Blakeslee, R. J.: Performance assessment of the tropical25
transient detector and lightning imaging sensor. Part I: Predicted diurnal variability, J. Atmos.Oceanic Technol., 19, 1318–1332, 2002.
Boersma, K. F., Eskes, H. J., Meijer, E. W., and Kelder, H. M.: Estimates of lightning NOxproduction from GOME satellite observations, Atmos. Chem. Phys., 5, 2311–2331, 2005.
Bogel, W. and Baumann, R.: Test and calibration of the DLR Falcon wind measuring system by30
maneuvers, J. Atmos. Oceanic Technol., 8, 5–18, 1991.Bradshaw, J., Davis, D., Grodzinsky, G., Smyth, S., Newell, R., Sandholm, S., and Liu, S.:
14858

ACPD7, 14813–14894, 2007
Lightning activity inBrazilian
thunderstorms
H. Huntrieser et al.
Title Page
Abstract Introduction
Conclusions References
Tables Figures
J I
J I
Back Close
Full Screen / Esc
Printer-friendly Version
Interactive Discussion
EGU
Observed distributions of nitrogen oxides in the remote free troposphere from the NASAglobal tropospheric experiment programs, Rev. Geophys., 38, 61–116, 2000.
Brook, M., Nakano, M., Krehbiel, P., and Takeuti, T: The electrical structure of the Hokurikuwinter thunderstorms, J. Geophys. Res., 87, 1207–1215, 1982.
Carey, L. D. and Buffalo, K. M.: Environmental control of cloud-to-ground lightning polarity in5
severe storms, Mon. Wea. Rev., 135, 1327–1353, 2007.Chaboureau, J.-P., Cammas, J.-P., Duron, J., Mascart, P. J., Sitnikov, N., and Voessing, H.-J.:
A numerical study of tropical cross-tropopause transport by convective overshoots, Atmos.Chem. Phys., 7, 1731–1740, 2007, http://www.atmos-chem-phys.net/7/1731/2007/.
Chameides, W. L.: The role of lightning in the chemistry of the atmosphere, in The Earth’s10
Electrical Environment, pp. 70–77, Nat. Acad. Press, Washington, D.C., 1986.Chameides, W. L., Davis, D. D., Bradshaw, J., Rodgers, M., Sandholm, S., and Bai, D. B.: An
estimate of the NOx production rate in electrified clouds based on NO observations from theGTE/CITE 1 fall 1983 field operation, J. Geophys. Res., 92, 2153–2156, 1987.
Chowdhuri, P., Anderson, J. G., Chisholm W. A., et al.: Parameters of lightning strokes: A15
Review, IEEE Transactions on Power Delivery, Vol. 20, No. 1, 346–358, 2005.Christian, H. J., Blakeslee, R. J., Goodman, S. J., et al.: The Lightning Imaging Sensor, Pro-
ceedings of the 11th International Conference on Atmospheric Electricity, Guntersville, Al-abama, June 7–11, 1999, pp. 746–749, 1999.
Christian, H. J., Blakeslee, R. J., Boccippio, D. J., et al.: Global frequency and distribution of20
lightning as observed from space by the Optical Transient Detector, J. Geophys. Res., 108,4005, doi: 10.1029/2002JD002347, 2003.
Christian, H. J. and Petersen, W.: Global lightning activity, Conference on Meteorological Ap-plications of Lightning Data, 85th AMS Annual Meeting, San Diego, CA, 10–12 January,2005.25
Cooper, O. R., Stohl, A., Trainer, M., et al.: Large upper tropospheric ozone enhance-ments above mid-latitude North America during summer: In situ evidence from theIONS and MOZAIC ozone measurement network, J. Geophys. Res., 111, D24S05,doi:10.1029/2006JD007306, 2006.
Coppens, F., Berton, R., Bondiou-Clergerie, A., and Gallimberti, I.: Theoretical estimate of NOx30
production in lightning corona, J. Geophys. Res., 103, 10 769–10 785, 1998.Cummins, K. L., Murphy, M. J., Bardo, E. A., Hiscox, W. L., Pyle, R. B., and Pifer, A. E.: A
combined TOA/MDF technology upgrade of the U.S. National Lightning Detection Network,
14859

ACPD7, 14813–14894, 2007
Lightning activity inBrazilian
thunderstorms
H. Huntrieser et al.
Title Page
Abstract Introduction
Conclusions References
Tables Figures
J I
J I
Back Close
Full Screen / Esc
Printer-friendly Version
Interactive Discussion
EGU
J. Geophys. Res., 103, 9035–9044, doi:10.1029/98JD00153, 1998.Cummins, K., Cramer, J. A., Biagi, C. J., Krider, E. P., Jerauld, J., Uman, M. A., and Rakov,
V. A.: The U.S. national lightning detection network: post-upgrade status, The 86th AMSAnnual Meeting, 2nd Conference on Meteorological Applications of Lightning Data, Paper6.1, 28 January–3 February 2006, Atlanta, GA, 2006.5
DeCaria, A. J., Pickering, K. E., Stenchikov, G. L., Scala, J. R., Stith, J. L., Dye, J. E., Ridley, B.A., and Laroche, P.: A cloud-scale model study of lightning-generated NOx in an individualthunderstorm during STERAO-A, J. Geophys. Res., 105, 11 601–11 616, 2000.
DeCaria, A. J., Pickering, K. E., Stenchikov, G. L., and Ott, L. E.: Lightning-generated NOxand its impact on tropospheric ozone production: A three-dimensional modelling study of a10
Stratosphere-Troposphere Experiment: Radiation, Aerosols, and Ozone (STERAO-A) thun-derstorm, J. Geophys. Res., 110, D14303, doi:10.1029/2004JD005556, 2005.
Defer, E., Laroche, P., Dye, J. E., and Skamarock, W.: Use of total lightning lengths to estimateNOx production in a Colorado thunderstorm, paper presented at 12th International Confer-ence on Atmospheric Electricity, 9–13 June, Int. Comm. on Atmos. Electr., Versailles, France,15
2003.Del Genio, A. D., Yao, M.-S., and Jonas, J.: Will moist convection be stronger in a warmer
climate?, Geophys. Res. Lett., 34, L16703, doi:10.1029/2007GL030525, 2007.Dickerson, R. R., Huffman, G. J., Luke, W. T., et al.: Thunderstorms: An important mechanism
in the transport of air pollutants, Science, 235, 460–465, 1987.20
Doswell, C. A., III: Severe Convective Storms, Meteorol. Monogr. Ser., Vol. 28(50), 570 pp.,Am. Meteorol. Soc., Boston, Mass., USA, 2001.
Dye, J. E., Ridley, B. A., Skamarock, W., et al.: An overview of the Stratospheric-TroposphericExperiment: Radiation, aerosols, and ozone (STERAO)-Deep convection experiment withresults for the July 10, 1996 storm, J. Geophys. Res, 105, 10 023–10 045, 2000.25
Engholm, C. D., Williams, E. R., and Dole R. M.: Meteorological and electrical conditionsassociated with positive cloud-to-ground lightning, Mon. Wea. Rev., 118, 470–487, 1990.
Fehr, T., Holler, H., and Huntrieser, H.: Model study on production and transport oflightning-produced NOx in an EULINOX supercell storm, J. Geophys. Res., 109, D09102,10.1029/2003JD003935, 2004.30
Gallardo, L. and Cooray, V.: Could cloud-to-cloud discharges be as effective as cloud-to-grounddischarges in producing NOx?, Tellus, 48B, 641–651, 1996.
Garrett, T. J., Navarro, B. C., Twohy, C. H., et al.: Evolution of a Florida cirrus anvil, J. Atmos.
14860

ACPD7, 14813–14894, 2007
Lightning activity inBrazilian
thunderstorms
H. Huntrieser et al.
Title Page
Abstract Introduction
Conclusions References
Tables Figures
J I
J I
Back Close
Full Screen / Esc
Printer-friendly Version
Interactive Discussion
EGU
Sci., 62, 2352–2372, 2005.Gilmore, M. S. and Wicker, L. J.: Influences of the local environment on supercell cloud-to-
ground lightning, radar characteristics, and severe weather on 2 June 1995, Mon. Wea.Rev., 130, 2349–2372, 2002.
Hauf, T., Schulte, P., Alheit, R., and Schlager, H.: Rapid vertical trace gas transport by an5
isolated mid-latitude thunderstorm, J. Geophys. Res., 100, 22 957–22 970, 1995.Hill, R. D.: Interpretation of bipole patterns in a mesoscale storm, Geophys. Res. Lett., 23,
643–645, 1988.Holler, H., Finke, U., Huntrieser, H., Hagen, M., and Feigl, C.: Lightning produced NOx (LINOX)
- Experimental design and case study results, J. Geophys. Res., 104, 13 911–13 922, 1999.10
Hudman, R. C., Jacob, D. J., Turquety, S., et al.: Surface and lightning sources of nitrogenoxides in the United States: Magnitudes, chemical evolution, and outflow, J. Geophys. Res.,112, D12S05, doi:10.1029/2006JD007912, 2007.
Huntrieser, H., Schlager, H., Feigl, C., and Holler, H.: Transport and production of NOx inelectrified thunderstorms: Survey of previous studies and new observations at mid-latitudes.15
J. Geophys. Res., 103, 28 247–28 264, 1998.Huntrieser, H., Feigl, C., Schlager, H., Schroder, F., Gerbig, C., van Velthoven, P., Flatøy, F.,
Thery, C., Petzold, A., Holler, H., and Schumann, U.: Airborne measurements of NOx, tracerspecies and small particles during the European Lightning Nitrogen Oxides Experiment, J.Geophys. Res., 107 (D11), 4113, doi: 10.1029/2000JD000209, ACH 5-1 - ACH 5-24, 2002.20
Huntrieser, H., Heland, J., Schlager, H., et al.: Intercontinental air pollution transport fromNorth America to Europe: Experimental evidence from airborne measurements and surfaceobservations, J. Geophys. Res., 110, D01305, doi:10.1029/2004JD005045, 2005.
Huntrieser, H., Schlager, H., Holler, H., Schumann, U., Betz, H.-D., Boccippio, D., Brunner,D., Forster, C., and Stohl, A.: Lightning-produced NOx in tropical, subtropical and mid-25
latitude thunderstorms: New insights from airborne and lightning observations, EuropeanGeosciences Union, General Assembly 2006, Vienna, Austria, 2–7 April 2006, Oral PaperNr. EGU06-A-03286, Geophys. Res. Abstracts, Vol. 8, 2006.
Huntrieser, H., Schlager, H., Roiger, A., Schumann, U., Holler, H., Kurz, C., Brunner, D.,Schwierz, C., Richter, A., and Stohl, A.: Lightning-produced NOx over Brazil during TROC-30
CINOX: airborne measurements in tropical and subtropical thunderstorms and the im-portance of mesoscale convective systems, Atmos. Chem. Phys., 7, 2987–3013, 2007,http://www.atmos-chem-phys.net/7/2987/2007/.
14861

ACPD7, 14813–14894, 2007
Lightning activity inBrazilian
thunderstorms
H. Huntrieser et al.
Title Page
Abstract Introduction
Conclusions References
Tables Figures
J I
J I
Back Close
Full Screen / Esc
Printer-friendly Version
Interactive Discussion
EGU
Jerauld, J., Rakov, V. A., Uman, M. A., Rambo, K. J., Jordan, D. M., Cummins, K. L., andCramer, J. A.: An evaluation of the performance characteristics of the U.S. National Light-ning Detection Network in Florida using rocket-triggered lightning, J. Geophys. Res., 110,D19106, doi:10.1029/2005JD005924, 2005.
Keenan, T. D. and Carbone, R. E.: A preliminary morphology of precipitation systems in tropical5
northern Australia, Q. J. R. Meteorol. Soc., 118, 283–326, 1992.Koike, M., Kondo, Y., Kita, K., et al.: Measurements of reactive nitrogen pro-
duced by tropical thunderstorms during BIBLE-C, J. Geophys. Res., 112, D18304,doi:10.1029/2006JD008193, 2007.
Langford, A. O., Portmann, R. W., Daniel, J. S., Miller, H. L., and Solomon, S.: Spectro-10
scopic measurements of NO2 in a Colorado thunderstorm: Determination of the meanproduction by cloud-to-ground lightning flashes, J. Geophys. Res., 109, D11304, doi:10.1029/2003JD004158, 2004.
Lopez, J. P., Fridlind, A. M., Jost, H.-J., et al.: CO signatures in subtropical convectiveclouds and anvils during CRYSTAL-FACE: An analysis of convective transport and entrain-15
ment using observations and a cloud-resolving model, J. Geophys. Res., 111, D09305,doi:10.1029/2005JD006104, 2006.
Lyons, W. A., Uliasz, M., and Nelson, T. E.: Large peak current cloud-to-ground lightning flashesduring the summer months in the contiguous United States, Mon. Wea. Rev., 126, 2217–2233, 1998.20
Martin, R. V., Sioris, C. E., Chance, K., et al.: Evaluation of space-based constraints on globalnitrogen oxide emissions with regional aircraft measurements over and downwind of easternNorth America, J. Geophys. Res., 111, D15308, doi:10.1029/2005JD006680, 2006.
Martin, R. V., Sauvage, B., Folkins, I., et al.: Space-based constraints on the production of nitricoxide by lightning, J. Geophys. Res., 112, D09309, doi:10.1029/2006JD007831, 2007.25
Orville, R. E.: Peak-current variations of lightning return strokes as a function of latitude, Nature,343, 149–151, 1990.
Orville, R. E.: Comments on “Large peak current cloud-to-ground lightning flashes during thesummer months in the contiguous United States”, Mon. Wea. Rev., 127, 1937–1938, 1999.
Orville, R. E. and Huffines, G. R.: Lightning ground flash measurements over the contiguous30
United States: 1995–1997, Mon. Wea. Rev., 127, 2693–2703, 1999.Orville, R. E., Huffines, G. R., Burrows, W. R., Holle, R. L., and Cummins, K. L.: The North
American lightning detection network (NALDN) – First results: 1998–2000, Mon. Wea. Rev.,
14862

ACPD7, 14813–14894, 2007
Lightning activity inBrazilian
thunderstorms
H. Huntrieser et al.
Title Page
Abstract Introduction
Conclusions References
Tables Figures
J I
J I
Back Close
Full Screen / Esc
Printer-friendly Version
Interactive Discussion
EGU
130, 2098–2109, 2002.Ott, L. E., Pickering, K. E., Stenchikov, G. L., Huntrieser, H., and Schumann, U.: Effects of
lightning NOx production during the July 21 European Lightning Nitrogen Oxides Projectstorm studied with a three-dimensional cloud-scale chemical transport model, J. Geophys.Res., 112, D05307, doi:10.1029/2006JD007365, 2007b.5
Petersen, W. A. and Rutledge, S. A.: Some characteristics of cloud-to-ground lightning in trop-ical northern Australia, J. Geophys. Res., 97, 11 553–11 560, 1992.
Petersen, W. A., Christian, H. J., and Rutledge, S. A.: TRMM observations of the globalrelationship between ice water content and lightning, Geophys. Res. Lett., 32, L14819,doi:10.1029/2005GL023236, 2005.10
Pickering, K. E., Thompson, A. M., Scala, J. R., Tao, W.-K., Dickerson, R. R., and Simpson,J.: Free tropospheric ozone production following entrainment of urban plumes into deepconvection, J. Geophys. Res., 97, 17 985–18 000, 1992.
Pickering, K. E., Thompson, A. M., Wang, Y., et al.: Convective transport of biomass burningemissions over Brazil during TRACE A, J. Geophys. Res., 101, 23 993–24 012, 1996.15
Pickering, K. E., Huntemann, T., Ott, L., Barth, M., Huntrieser, H., Schlager, H., Schumann,U., Vaughan, G., and Volz-Thomas, A.: Cloud-resolved simulations of lightning-NOx in ob-served tropical thunderstorms, European Geosciences Union, General Assembly 2007, Vi-enna, Austria, 15–20 April 2007, Oral Paper Nr. EGU2007-A-11013, Geophys. Res. Abstr.,Vol. 9, 2007.20
Pierce, E. T.: The development of lightning discharges, Quart. J. Roy. Meteor. Soc., 81, 229–240, 1955.
Pinto, I. R. C. A. and Pinto , O., Jr.: Cloud-to-ground lightning distributions in Brazil, J. Atmos.Solar-Terrestrial Physics, 65, 733–737, 2003.
Pinto, O., Jr., Pinto, I. R. C. A., and Naccarato, K. P.: Maximum cloud-to-ground lightning flash25
densities observed by lightning location systems in the tropical region: A review, Atmos.Res., 84, 189–200, 2007.
Price, C., Penner, J., and Prather, M.: NOx from lightning: 1. Global distribution based onlightning physics, J. Geophys. Res., 102, 5929–5941, 1997.
Prentice, S. A., and Mackerras, D.: The ratio of cloud to cloud-ground lightning flashes in30
thunderstorms, J. Appl. Meteorol., 16, 545–550, 1977.Rahman, M., Corray, V., Rakov, V. A., Uman, M. A., Liyanage, P., DeCarlo B. A., Jerauld, J.,
and Olsen III, R. C.: Measurements of NOx produced by rocket-triggered lightning, Geophys.
14863

ACPD7, 14813–14894, 2007
Lightning activity inBrazilian
thunderstorms
H. Huntrieser et al.
Title Page
Abstract Introduction
Conclusions References
Tables Figures
J I
J I
Back Close
Full Screen / Esc
Printer-friendly Version
Interactive Discussion
EGU
Res. Lett., 34, L03816, doi:10.1029/2006GL027956, 2007.Rakov, V. A., Thottapillil, R., and Uman, M. A.: On the empirical formula of Willett et al. relating
lightning return-stroke peak current and peak electric field, J. Geophys. Res., 97, 11 527–11 533, 1992.
Ridley, B. A., Dye, J. E., Walega, J. G., Zheng, J., Grahek, F. E., and Rison, W.: On the5
production of active nitrogen by thunderstorms over New Mexico, J. Geophys. Res., 101,20 985–21 005, 1996.
Ridley, B. A., Ott, L., Pickering, K., et al.: Florida thunderstorms: A faucet of reactive nitrogen tothe upper troposphere, J. Geophys. Res., 109, D17305, doi:10.1029/2004JD004769, 2004.
Ridley, B. A., Pickering, K. E., and Dye, J. E.: Comments on the parameterization of lightning-10
produced NO in global chemistry-transport models, Atmos. Environ., 39, 6184–6187, 2005.Rutledge, S. A. and MacGorman, D. R.: Cloud-to-ground lightning activity in the 10–11 June
1985 mesoscale convective system observed during the Oklahoma-Kansas PRE-STORMproject, Mon. Wea. Rev., 116, 1393–1408, 1988.
Schmidt, K., Betz, H.-D., Oettinger, W. P., Wirz, M., and Diendorfer, G.: A new lightning de-15
tection network in southern Germany, 27th International Conference on Lightning Protection(ICLP), September 2004, Avignon, France, 2004.
Schmidt, K., Betz, H.-D., Oettinger, W. P., Wirz, M., Pinto Jr., O., Naccarato, K. P., Holler,H., Fehr, T., and Held, G.: A comparative analysis of lightning data during the EU-BrazilTROCCINOX / TroCCiBras campaign, VIII International Symposium on Lightning Protection20
(SIPDA), 21–25 November 2005, Sao Paulo, Brazil, 2005.Schmidt, K.: Ortung und Analyse von Blitzentladungen mittels Registrierung von VLF-
Atmospherics innerhalb eines Messnetzes, Ph.D. thesis, Ludwig-Maximilians-Universitat,Munich, Germany, 2007.
Schulz, W., Cummins, K., Diendorfer, G., and Dorninger, M.: Cloud-to-ground lightning in Aus-25
tria: A 10-year study using data from a lightning location system, J. Geophys. Res., 110,D09101, doi:10.1029/2004JD005332, 2005.
Schumann, U., Konopka, P., Baumann, R., Busen, R., Gerz, T., Schlager, H., Schulte P., andVolkert, H.: Estimate of diffusion parameters of aircraft exhaust plumes near the tropopausefrom nitric oxide and turbulence measurements, J. Geophys. Res., 100, 14 147–14 162,30
1995.Schumann, U., Huntrieser, H., Schlager, H., Bugliaro, L., Gatzen, C., and Hoeller, H.: Nitro-
gen Oxides from thunderstorms- Results from experiments over Europe and the Continental
14864

ACPD7, 14813–14894, 2007
Lightning activity inBrazilian
thunderstorms
H. Huntrieser et al.
Title Page
Abstract Introduction
Conclusions References
Tables Figures
J I
J I
Back Close
Full Screen / Esc
Printer-friendly Version
Interactive Discussion
EGU
Tropics, paper presented at Deutsch-Osterreichisch-Schweizerische Meteorologen-Tagung(DACH), Deutsche Meteorologische Gesellschaft, Karlsruhe, Germany, 7–10 September,2004.
Schumann, U. and Huntrieser, H.: The global lightning-induced nitrogen oxides source rate, At-mos. Chem. Phys., 7, 3823–3907, 2007, http://direct.sref.org/1680-7324/acp/2007-7-3823.5
Skamarock, W. C., Dye, J. E., Defer, E., Barth, M. C., Stith, J. L., Ridley, B. A., and Baumann,K.: Observational- and modelling-based budget of lightning-produced NOx in a continentalthunderstorm, J. Geophys. Res., 108, 4305, doi:10.1029/2002JD002163, 2003.
Stefanutti, L., MacKenzie, A. R., Santacesaria, V., et al.: The APE-THESEO Tropical Campaign:An overview, J. Atmos. Chem., 48, 1–33, 2004.10
Stohl, A., Forster, C., Eckhardt, S., Huntrieser, H., Heland, J., Schlager, H., Aufmhoff, H.,Arnold, F., and Cooper, O.: A backward modelling study of intercontinental pollution transportusing aircraft measurements, J. Geophys. Res., 108, 4370, doi: 10.1029/2002JD002862,2003a.
Stohl, A., Huntrieser, H., Richter, A., Beirle, S., Cooper, O., Eckhardt, S., Forster, C., James, P.,15
Spichtinger, N., Wenig, M., Wagner, T., Burrows, J., and Platt, U.: Rapid intercontinental airpollution transport associated with a meteorological bomb, Atmos. Chem. Phys., 3, 969–985,2003b.
Stolzenburg, M., Marshall, T. C., Rust, W. D., et al.: Horizontal distribution of electrical andmeteorological conditions across the stratiform region of a mesoscale convective system,20
Mon. Wea. Rev., 122, 1777–1797, 1994.Thery, C.: Evaluation of LPATS data using VHF interferometric observations of lightning flashes
during the Eulinox experiment, Atmos. Res., 56, 397–409, 2001.Thomas, R. J., Krehbiel, P. R., Rison, W., Hamlin, T., Boccippio, D. J., Goodman, S. J., and
Christian, H. J.: Comparison of ground-based 3–dimensional lightning mapping observations25
with satellite-based LIS observations in Oklahoma, Geophys. Res. Lett., 27, 1703–1706,2000.
Thompson, A. M., Tao, W.-K., Pickering, K. E., Scala, J. R., and Simpson, J.: Tropical deepconvection and ozone formation, Bull. Am. Meteorol. Soc., 78, 1043–1054, 1997.
Uman, M. A., McLain, D. K., and Krider, E. P.: The electromagnetic radiation from a finite30
antenna, Am. J. Phys., 43, 33–38, 1975.Wacker, R. S. and Orville, R. E.: Changes in measured lightning flash count and return stroke
peak current after the 1994 U.S. National Lightning Detection Network upgrade: 1. Observa-
14865

ACPD7, 14813–14894, 2007
Lightning activity inBrazilian
thunderstorms
H. Huntrieser et al.
Title Page
Abstract Introduction
Conclusions References
Tables Figures
J I
J I
Back Close
Full Screen / Esc
Printer-friendly Version
Interactive Discussion
EGU
tion, J. Geophys. Res., 104, 2151–2157, 1999.Wang, Y., DeSilva, A. W., and Goldenbaum, G. C.: Nitric oxide production by simulated light-
ning: Dependence on current, energy, and pressure, J. Geophys. Res., 103, 19 149–19 159,1998.
Wiens, K. C., Rutledge, S. A., and Tessendorf, S. A.: The 29 June 2000 supercell observed5
during STEPS. Part II: Lightning and charge structure, J. Atmos. Sci., 62, 4151–4177, 2005.WMO: Scientific Assessment of Ozone Depletion: 1994, World Meteorological Organization
Global Ozone Research and Monitoring Project, Report No. 37, 1995.Zhang, X. J., Helsdon, J. H., and Farley, R. D.: Numerical modeling of lightning-produced NOx
using an explicit lightning scheme: 1. Two-dimensional simulations as a “proof of concept”,10
J. Geophys. Res., 108, 4579, doi:10.1029/2002JD003224, 2003.
14866

ACPD7, 14813–14894, 2007
Lightning activity inBrazilian
thunderstorms
H. Huntrieser et al.
Title Page
Abstract Introduction
Conclusions References
Tables Figures
J I
J I
Back Close
Full Screen / Esc
Printer-friendly Version
Interactive Discussion
EGU
Table 1. Positions of LINET sensors in Brazil (Jan–Feb 2005) and Germany (July 2005).
Country/ Station Name Latitude Longitude
Brazil ◦ S ◦ WMarilia 22.235 49.965Novo Horizonte 21.466 49.226Bauru 22.358 49.027Qurinhos 22.951 49.896Araquara 21.813 48.199Botucatu 22.848 48.432
Germany ◦ N ◦ ERavensburg 47.801 09.696Regensburg 49.043 12.103Weissenburg 49.019 10.960Berchtesgaden 47.634 13.001Lahr 48.365 07.828Karlsruhe 49.093 08.426Basel 47.561 07.969Bamberg 49.880 10.914Weiden 49.667 12.184Stegen 48.076 11.139Passau 48.572 13.424Garching 48.269 11.674Peissenberg 47.801 11.010Geretsried 47.870 11.476Buchloe 48.037 10.728Stadtbergen 48.349 10.850Lichtenau 47.881 11.080Lagerlechfeld 48.181 10.840Oberpfaffenhofen 48.087 11.280
14867

ACPD7, 14813–14894, 2007
Lightning activity inBrazilian
thunderstorms
H. Huntrieser et al.
Title Page
Abstract Introduction
Conclusions References
Tables Figures
J I
J I
Back Close
Full Screen / Esc
Printer-friendly Version
Interactive Discussion
EGU
Table 2a. Estimates of horizontal LNOx mass flux FLNOx, LINET stroke rate RLINET, LNOxproduction rate per LINET stroke and per LIS flash PLNOx, and global LNOx production rate peryear GLNOx.
Flight Entry and Exit Pressure Mean, |Va − Vs |1, ρa, kg ∆x, ∆z, km F 2
LNOx, R3LINET, PLNOx, g(N) PLNOx, g(N) GLNOx,
and Anvil Time (UTC), s Altitude, χLNOx m s−1 m−3 km g(N) s−1 (LINET (LINET (LIS flash)−1 Tg(N) a−1
Penetration / km nmol strokes)s−1 stroke)−1
tropical (t) mol−1
or subtropical (s)
040205 1a (t) 66 199–66 433 10.6 0.76 6.5 0.36 35 4 120 0.055 2205 1103 1.5040205 5a (t) 67 682–67 833 10.7 1.10 5.9 0.36 25 4 113 0.054 2082 1041 1.4040205 2b (t) 69 905–70 169 10.1 0.57 9.2 0.39 45 4 178 0.061 2914 1457 2.0
mean tropical4 2400 1200 1.6180205b I (s) 74 056–74 209 10.6 0.42 17.7 0.36 28 3 109 0.025 4258 2129 3.0180205b II (s) 74 453–74 623 10.7 0.18 20.0 0.36 33 3 62 0.025 2430 1215 1.7180205b III (s) 75 013–75 186 10.1 0.65 12.2 0.39 32 3 143 0.025 5623 2811 3.9180205b IV (s) 75 601–75 761 10.1 0.21 20.0 0.39 30 3 71 0.025 2792 1396 1.9180205b V (s) 76 102–76 280 9.4 0.39 11.9 0.41 33 3 91 0.025 3568 1784 2.5180205b VI (s) 76 584–76 757 9.4 0.13 17.7 0.41 35 3 48 0.025 1876 938 1.3
mean subtropical4 4483 2241 3.1relative max. error ∼50% ∼50% ∼40% ∼50% ∼190% ∼90% ∼280% ∼310% ∼320%
1 Horizontal anvil outflow velocity, calculated from values in Table 2b.2 The horizontal LNOx mass flux out of the anvil, see Eq. (4).3 Only LINET strokes with peak currents ≥10 kA were considered for an equivalent comparisonbetween 040205 (strokes mainly inside the LINET centre) and 180205b (strokes along LINETperiphery).4 The mean value for the tropical anvil penetrations 1a, 5a and 2b of 4 February 2005 isgiven. The mean value for the subtropical anvil penetrations I, III, and V of 18 February 2005(penetrations closest to the maximum anvil outflow) is given.
14868

ACPD7, 14813–14894, 2007
Lightning activity inBrazilian
thunderstorms
H. Huntrieser et al.
Title Page
Abstract Introduction
Conclusions References
Tables Figures
J I
J I
Back Close
Full Screen / Esc
Printer-friendly Version
Interactive Discussion
EGU
Table 2b. Measured wind velocity and direction in the anvil outflow and at the steering level1.
Flight and Measured Measured Wind WindAnvil Wind Wind Direction VelocityPenetration Direction Velocity in at Steering at
in Anvil Anvil Level1ds,◦ Steering
Outflow Outflow Level1Vs,da, ◦ Va, m s−1 m s−1
040205 1a 71±31 5.2±1.7 160 3.9040205 5a 182±50 3.9±2.7 280 3.9040205 2b 107±23 6.9±2.0 350 3.7180205b I 283±12 16.6±4.1 185 4.3180205b II 277±4 19.4±2.3 185 4.3180205b III 274±11 11.5±5.3 185 4.3180205b IV 279±5 19.2±1.3 185 4.3180205b V 268±10 11.6±5.7 185 4.3180205b VI 278±5 16.9±1.4 185 4.3
1 The wind at the steering level ∼3 km (∼700 hPa) determines the mean motion of a thunder-storm cell.
14869

ACPD7, 14813–14894, 2007
Lightning activity inBrazilian
thunderstorms
H. Huntrieser et al.
Title Page
Abstract Introduction
Conclusions References
Tables Figures
J I
J I
Back Close
Full Screen / Esc
Printer-friendly Version
Interactive Discussion
EGU
Table 3. Lightning-produced NO mass per LINET stroke PLNOx, for tropical and subtropicalthunderstorms considering different stroke peak currents.
Flight and Anvil Registered/ Duration, Number RLINET, F(LNOx)3, Integral4, CLINET5, m Total PLNOx
7, S,g(N) Pressure,Penetration/ Considered of Stroke of LINET (LINET g(N) s−1 strokes s−1 laboratory Nitrogen g(N) (kA)−1 hPatropical (t) or Stroke Peak Activity2 Strokes2 strokes) ×10−3g m−1 spark Mass (LINET (×103
subtropical (s) Currents1, min s−1 laboratory stroke−1 Produced6, stroke)−1 laboratorykA spark ×103g spark)−1
040205 1a (t) ≥ 2 85 1287 0.252 120 4.04 29732 613 476 2.0 240040205 5a (t) ≥2 40 400 0.167 113 4.52 24 946 271 677 2.3 235040205 2b (t) ≥2 85 1492 0.293 178 4.31 41 239 906 607 1.8 260180205b III (s) ≥ 6 85 236 0.046 143 1.13 126 393 731 3097 1.9 260040205 1a (t) ≥ 10 85 278 0.055 120 2.71 44 390 613 2205 2.8 240040205 5a (t) ≥ 10 40 130 0.054 113 3.72 30 285 271 2082 2.6 235040205 2b (t) ≥ 10 85 311 0.061 178 2.48 71 516 906 2914 2.1 260180205b III (s) ≥ 10 85 130 0.025 143 0.89 160 324 731 5623 2.1 260
1 On 4 February 2005 strokes with peak currents down to 2 kA were registered (mainly within the LINET centre). On 18 February 2005 only strokes with peakcurrents ≥6 kA were registered (mainly along the LINET periphery). Thus, on 18 February the detection efficiency for low peak currents was lower than on 4February and the stroke characteristics are not comparable (upper half of the table). For a more equivalent comparison between the 4 and 18 February onlystrokes with peak currents ≥10 kA were considered (lower half of the table).2 On 4 February 2005 the registered/considered strokes until penetration were active from 16:55 to 18:20 UTC within anvil 1a (85 min.), from 17:55 to19:20 UTC within anvil 2b (85 min) and from 18:05 to 18:45 UTC within anvil 5a (40 min) On 18 February 2005 the registered/considered strokes until stormdecay were active between 19:30 and 20:55 UTC (85 min).3 The horizontal LNOx mass flux out of the anvil (see Eq. 4). Values from Table 2a are given.4 For every 1 kA, the total number of strokes NLINET , within the duration of the stroke activity, are summed up and divided by the duration of the stroke activity
which gives RLINET(I) (see Eq. 9). RLINET(I) is then multiplied with the Wang et al. 1998 laboratory relationship MNOlab(I) (see below6 and Eq. 7) and summed
up over all 1 kA intervals (part of Eq. 8 and Eq. 9):∞∫I=1
RLINET(I) ×MNOlab(I) dI where RLINET(I) = 1
t
t∫t=0
NLINET(I, t) dt
5 Conversion of the Wang et al. 1998 laboratory relationship to LINET strokes (see Eq. 8): CLINET = FLNOx/∞∫I=1
RLINET(I) ×MNOlab(I) dI
6 The total nitrogen mass produced by the thunderstorm within the duration of the stroke activity. For every 1 kA interval and the duration of the stroke activity,MNO lab(I) (Eq. 7) modified for LINET (Eq. 10) is multiplied with the total number of strokes NLINET(I) and summed up over all peak currents.7 Nitrogen mass produced per considered stroke.
14870

ACPD7, 14813–14894, 2007
Lightning activity inBrazilian
thunderstorms
H. Huntrieser et al.
Title Page
Abstract Introduction
Conclusions References
Tables Figures
J I
J I
Back Close
Full Screen / Esc
Printer-friendly Version
Interactive Discussion
EGU
Table 4a. LINET statistics of positive and negative CG and IC stroke fractions (here VLFpulses) and mean peak currents estimated for strokes with peak currents ≥1 kA.
Date Type of Thunderstorms/ Area1,2 Number Mean Peak CG IC Height Ratio Mean Peak Mean Peak Mean Peak Mean Peak Peakof Current, Strokes Strokes IC Positive/ Current Current Current Current CurrentStrokes3 kA (Fraction), (Fraction), Strokes, Negative (Fraction) (Fraction) (Fraction) (Fraction) ≥10 kA
% % km Strokes for CG-, for CG+, for IC-, for IC+, (Fraction),kA (%) kA (%) kA (%) kA (%) %
Tropical (Brazil)230105 LINET centre 11 324 6 <44 ≥56 10.3±2.9 1.0 −9 (23) +5 (21) −5 (28) +4 (28) 10240105 LINET centre 419 6 37 63 10.5±3.3 1.1 −11 (21) +5 (16) −5(26) +4 (37) 11250105 LINET centre 848 7 47 53 9.6±2.8 1.6 −11 (21) +5 (26) −8 (17) +5 (36) 15040205 LINET centre 36 234 6 43 57 9.7±3.1 1.2 −10 (24) +5 (19) −5 (22) +4 (35) 12040205 LINET centre: anvil 1a* 1278 8 24 76 10.0±3.4 0.7 −15 (20) +5 (4) −8 (40) +5 (36) 22040205 LINET centre: anvil 5a** 439 12 88 12 11.6±3.2 0.7 −17 (55) +7 (33) −4 (5) +4 (7) 34040205 outside LINET centre: anvil 2b*** 1466 8 (55) (45) (14.0±2.5) 0.7 −11 (34) +6 (21) −7 (25) +6 (20) 21250205 LINET centre 31 221 5 42 58 10.3±3.6 1.5 −7 (19) +5 (23) −5 (20) +4 (38) 8
Transition Trop.-Subtrop. (Brazil)290105 LINET centre 419 6 40 60 8.6±3.0 1.3 −12 (25) +5 (15) −6 (19) +4 (41) 16050205 LINET centre 1608 6 66 34 9.1±3.3 1.8 −9 (25) +6 (41) −5 (11) +5 (23) 13190205 LINET centre 17 228 5 47 53 9.6±3.3 1.6 −9 (21) +5 (26) −5 (17) +4 (36) 9
Subtropical (Brazil)180205 LINET periphery**** 3368 (13) – – – 0.5 - – – – (57)180205 LINET periphery: anvil I-VI***** 236 (13) – – – 0.6 - – – – (55)
Mid-latitude or Subtr. (Germany)290605 LINET centre: isolated TS 4232 9 54 46 9.3±2.4 0.6 −11 (35) +6 (19) −11 (29) +5 (17) 25040705 LINET centre 6337 5 72 28 10.8±3.3 0.8 −6 (39) +4 (33) −6 (16) +4 (12) 10100705 LINET centre 15 174 6 65 35 9.6±3.3 0.9 −7 (36) +4 (29) −6 (17) +4 (18) 12150705 LINET centre 8607 6 81 19 10.2±3.3 0.8 −8 (47) +4 (34) −5 (10) +3 (9) 15290705 LINET centre: isolated TS 2254 9 76 24 9.1±3.4 0.5 −12 (52) +6 (24) −8 (14) +4 (10) 292907054 LINET centre: isolated TS, red. 1761 11 81 19 9.0±3.5 0.4 −13 (58) +7 (23) −11 (12) +6 (7) 37
1 The LINET centre area over Brazil covers 21.5–22.5◦ S and 48.5–49.5◦ W (area with highest detection efficiency).2 The LINET centre area over Germany covers 48.5–49.5◦ N and 11.0–12.0◦ E (area with highest detection efficiency).3 For statistical reasons only days with at least 400 strokes (≥1 kA) in the LINET centre area were considered and strokes that were defined as IC or CGstrokes (undefined strokes were neglected). The numbers given are the total number of strokes registered between 00:00 and 24:00 UTC or for selectedanvils.4 Reduced dataset (sensor configuration similar to Brazilian configuration).*Anvil 1a (21.2–21.7◦ S and 48.9–49.2◦ W) is located at the edge of the LINET centre area and partly outside.**Anvil 5a (21.7–21.9◦ S and 48.4–48.7◦ W) is located mainly inside the LINET centre area and comparable to other estimates.***Anvil 2b (21.0–21.5◦ S and 49.7–50.1◦ W) is located just outside the LINET centre area where the fraction of IC strokes in general decreases, so estimatesfor this anvil penetration (especially IC height) are not directly comparable to the other estimates.****Subtropical thunderstorm system (19.4–20.0◦ S and 47.7–49.2◦ W, 14:00–21:00 UTC) is located along the LINET periphery (detection efficiency decreases)and therefore not well comparable to other estimates in this table (where peak currents ≥1 kA are considered).*****Anvil I-VI (19.3–19.8◦ S and 48.9–49.2◦ W, 19:30–21:00 UTC) is located along the LINET periphery (detection efficiency decreases) and therefore not wellcomparable to other estimates in this table (where peak currents ≥1 kA are considered).
14871

ACPD7, 14813–14894, 2007
Lightning activity inBrazilian
thunderstorms
H. Huntrieser et al.
Title Page
Abstract Introduction
Conclusions References
Tables Figures
J I
J I
Back Close
Full Screen / Esc
Printer-friendly Version
Interactive Discussion
EGU
Table 4b. Same as Table 4a, but for strokes with peak currents ≥10 kA.
Date Type of Thunderstorms/ Area1,2 Number Mean Peak CG IC Height Ratio Mean Peak Mean Peak Mean Peak Mean Peak Peakof Current, Strokes Strokes IC Positive/ Current Current Current Current CurrentStrokes3 kA (Fraction), (Fraction), Strokes, Negative (Fraction) (Fraction) (Fraction) (Fraction) ≥10 kA
% % km Strokes for CG-, for CG+, for IC-, for IC+, (Fraction),kA (%) kA (%) kA (%) kA (%) %
Tropical (Brazil)
230105 LINET centre 1144 19 <70 ≥30 10.8±2.9 0.3 −23 (57) +15 (13) −13 (18) +16 (12) 30240105 LINET centre 47 19 77 23 10.0±3.7 0.3 −20 (66) +13 (11) −20 (11) +13 (12) 28250105 LINET centre 130 21 61 39 9.3±2.3 0.6 −25 (42) +16 (19) −26 (19) +14 (20) 31040205 LINET centre 4379 20 73 27 9.5±3.2 0.3 −22 (62) +19 (11) −17 (13) +16 (14) 34040205 LINET centre: anvil 1a* 129 18 65 35 10.2±2.7 0.2 −20 (62) +16 (3) −13 (24) +16 (11) 26040205 LINET centre: anvil 5a** 123 26 98 2 (8.5±0.8) 0.1 −27 (86) +19 (12) −14 (1) +14 (1) 50040205 outside LINET centre: anvil 2b*** 308 19 70 30 (14.2±2.4) 0.3 −22 (58) +14 (12) −16 (19) +16 (11) 28250205 LINET centre 2406 18 65 35 11.0±4.0 0.4 −20 (50) +17 (15) −16 (20) +14 (15) 24
Transition Trop.-Subtrop. (Brazil)290105 LINET centre 68 18 80 20 8.3±3.5 0.1 −20 (74) +13 (6) −13 (16) +12 (4) 31050205 LINET centre 212 22 80 20 8.0±2.6 0.9 −23 (45) +24 (35) −16 (8) +17 (12) 33190205 LINET centre 1499 18 77 23 10.2±3.9 0.4 −19 (62) +15 (15) −16 (12) +15 (11) 25
Subtropical (Brazil)180205 LINET periphery**** 1914 17 – – – 0.4 – – – – 21180205 LINET periphery: anvil I-VI***** 130 17 – – – 0.4 – – – – 22
Mid-latitude or Subtr. (Germany)290605 LINET centre: isolated TS 1065 23 56 44 9.2±2.3 0.2 −24 (48) +24 (8) −24 (38) +16 (6) 44040705 LINET centre 607 20 71 29 9.7±3.0 0.2 −19 (56) +26 (15) −18 (24) +23 (5) 30100705 LINET centre 1845 20 71 29 9.3±3.4 0.2 −21 (60) +17 (11) −20 (23) +19 (6) 32150705 LINET centre 1253 19 90 10 10.3±3.3 0.1 −20 (80) +19 (10) −19 (9) +16 (1) 31290 705 LINET centre: isolated TS 659 21 87 13 7.4±3.4 0.1 −22 (76) +17 (11) −24 (11) +18 (2) 432907054 LINET centre: isolated TS, red. 659 21 87 13 7.4±3.4 0.1 −22 (76) +17 (11) −24 (11) +18 (2) 43
1 The LINET centre area over Brazil covers 21.5–22.5◦ S and 48.5–49.5◦ W (area with highest detection efficiency).2 The LINET centre area over Germany covers 48.5–49.5◦ N and 11.0–12.0◦ E (area with highest detection efficiency).3 For statistical reasons only days with at least 40 strokes (≥10 kA) in the LINET centre area were considered and strokes that were defined as IC or CGstrokes (undefined strokes were neglected). The numbers given are the total number of strokes registered between 00:00 UTC and 24:00 UTC or for selectedanvils.4 Reduced dataset (sensor configuration similar to Brazilian configuration).∗Anvil 1a (21.2–21.7◦ S and 48.9–49.2◦ W) is located at the edge of the LINET centre area and partly outside.∗∗Anvil 5a (21.7–21.9◦ S and 48.4–48.7◦ W) is located mainly inside the LINET centre area and comparable to other estimates.∗ ∗ ∗Anvil 2b (21.0–21.5◦ S and 49.7–50.1◦ W) is located just outside the LINET centre area where the fraction of IC strokes in general decreases, so estimatesfor this anvil penetration (especially IC height) are not directly comparable to the other estimates.∗ ∗ ∗∗Subtropical thunderstorm system (19.4–20.0◦ S and 47.7–49.2◦ W, 14:00 UTC–21:00 UTC) is located along the LINET periphery (detection efficiencydecreases) but can be compared with the other estimates in this table, since only peak currents ≥10 kA are considered here.∗ ∗∗∗∗Anvil I-VI (19.3–19.8◦ S and 48.9–49.2◦ W, 19:30–21:00 UTC) is located along the LINET periphery (detection efficiency decreases) but can be comparedwith the other estimates in this table, since only peak currents ≥10 kA are considered here.
14872

ACPD7, 14813–14894, 2007
Lightning activity inBrazilian
thunderstorms
H. Huntrieser et al.
Title Page
Abstract Introduction
Conclusions References
Tables Figures
J I
J I
Back Close
Full Screen / Esc
Printer-friendly Version
Interactive Discussion
EGU
Table 4c. Equivalent potential temperature (Θe) and wind velocity and direction (calculatedfrom ECMWF analyses) in the LINET centre area1 for selected days with LINET strokes aslisted in Table 4a–b.
Date Mean and Mean and Mean and Std WindStd2 Θe at Std Θe at Wind Velocity at Direction at850 hPa, K 500 hPa, K 200 hPa, m s−1 200 hPa
Tropical (Brazil)230105 349±2 341±1 11±3 SE240105 349±2 341±1 8±3 SE–SW250105 349±2 343±1 6±1 SW–NW040205 344±3 340±1 5±2 SE–SW250205 342±4 337±1 17±2 SWTransition Tropical-Subtropical (Brazil)290105 344±2 342±2 16±1 W050205 343±2 339±3 7±2 SW190205 347±3 330±2 34±2 WSubtropical (Brazil)180205 343±4 330±1 27±1 WMid-latitude (Germany)290605 331±3 326±2 21±2 NW–SW040705 323±6 323±1 14±2 W–SW100705 321±3 319±1 8±2 NE150 705 323±3 320±1 20±7 NWSubtropical (Germany)290705 340±5 325±2 19±3 SW
1 The LINET centre area over Brazil covers 21.5–22.5◦ S and 48.5–49.5◦ W, and over Germany48.5–49.5◦ N and 11.0–12.0◦ E.2 Std = Standard deviation.
14873

ACPD7, 14813–14894, 2007
Lightning activity inBrazilian
thunderstorms
H. Huntrieser et al.
Title Page
Abstract Introduction
Conclusions References
Tables Figures
J I
J I
Back Close
Full Screen / Esc
Printer-friendly Version
Interactive Discussion
EGU
Table 5. Overview over mean peak currents for negative (and partly for all1) CG flashes mea-sured in different regions (mainly United States = U.S.) indicating a latitudinal gradient as sug-gested by Orville (1990) and Orville et al. (2002). Higher mean peak currents were estimatedin the older studies owing to a lower detection efficiency of low peak currents. The U.S. NLDNwas upgraded in 1994–1995 (Cummins et al., 1998) and in 2002–2003 (Cummins et al., 2006).
Reference Lightning Detection Mean Peak Mean Peak Current Mean Peak(chronological) System Current CG- CG- (contiguous Current CG- (N
(SE U.S.), kA U.S.), kA and Central U.S.),kA
Orville (1990) NLDN (=National Florida: 40–451 New England: 25Lightning DetectionNetwork): 1988
Petersen and Rutledge Northern Australia: Darwin in(1992) 1989–1990 (magnetic tropical northern
direction-finding Australia: 391
lightning sensors from (similar as inU.S.) Florida)
Price et al. (1997) NLDN: summer 1988 Florida andMidwest: 36
Lyons et al. (1998) NLDN: 1991–1995 Large peakcurrents >75:preferable in SEU.S.
Wacker and Orville (1999) NLDN: 1989–1993 Florida: 41 contiguous U.S.: 38 Kansas: 33(pre-upgrade)
Wacker and Orville (1999) NLDN: 1994 Florida: 36 contiguous U.S.: 34 Kansas: 30(network upgraded)
Wacker and Orville (1999) NLDN: 1995 Florida: 33 contiguous U.S.: 30 Kansas: 26(network upgraded)
Orville and Huffines (1999) NLDN: 1995–1997 continental mountainous region:coastal areas of 15–202
the U.S.: >262
DeCaria et al. (2000) NLDN: 12 July 1996 Colorado: 151
Orville et al. (2002) NALDN (=North American Florida: 20–242 contiguous U.S.: 162 Central Canada: 12–182
Lightning DetectionNetwork, including Canadaplus contiguous U.S.):1998–2000
Langford et al. (2004) NLDN: 12 Sep 2002 Colorado: 15Ridley et al. (2004) NLDN: 29/16 July 2002 Florida: 20/26Chowdhuri et al. (2005) NLDN: 1997–1998 and 1999–2000 SE U.S.: 202 Central/NW U.S.: 16/182
this paper LINET: only CG strokes <-10 kA Subtropical Mid-latitude TropicalBrazil (18 Feb Germany (June– Brazil (Jan–2005): 193 July 2005): 19–24 Feb 2005): 19–27
1 Here mean value independent of polarity.2 Here median value instead of mean value.3 Here mean value for negative CG and IC strokes. No separation possible, since strokes occurred along LINET periphery.
14874

ACPD7, 14813–14894, 2007
Lightning activity inBrazilian
thunderstorms
H. Huntrieser et al.
Title Page
Abstract Introduction
Conclusions References
Tables Figures
J I
J I
Back Close
Full Screen / Esc
Printer-friendly Version
Interactive Discussion
EGU
Comparison LINET - RINDAT
04 February 2005
Longitude /°E
-49.8 -49.6 -49.4 -49.2 -49.0 -48.8 -48.6 -48.4 -48.2
Latit
ude
/°N
-22.6
-22.4
-22.2
-22.0
-21.8
-21.6
LINETRINDAT
(a)
18 February 2005
Longitude /°E
-49.4 -49.2 -49.0 -48.8 -48.6 -48.4 -48.2 -48.0 -47.8 -47.6
Latit
ude
/°N
-20.4
-20.2
-20.0
-19.8
-19.6
-19.4
-19.2
(b)
-21.4
Fig. 1. Horizontal distributions of RINDAT and LINET strokes for the (a) 4 February 2005 inthe centre area of the LINET detection network and for the (b) 18 February 2005 along thenorthern periphery, 00:00 UTC–24:00 UTC.
14875

ACPD7, 14813–14894, 2007
Lightning activity inBrazilian
thunderstorms
H. Huntrieser et al.
Title Page
Abstract Introduction
Conclusions References
Tables Figures
J I
J I
Back Close
Full Screen / Esc
Printer-friendly Version
Interactive Discussion
EGU
18 February 2005
LINET peak current /kA0 20 40 60 80 100 120 140 160
RIN
DA
T pe
ak c
urre
nt /k
A
0
20
40
60
80
100
120
140
160peak current LINET vs. RINDATregression LINET vs. RINDATPCRINDAT = -0.76 +0.68*PCLINET
r2 = 0.951 to 1 relationship
(b)
04 February 2005
LINET peak current /kA0 20 40 60 80 100 120 140 160
RIN
DA
T pe
ak c
urre
nt /k
A
0
20
40
60
80
100
120
140
160peak current LINET vs. RINDATregression LINET vs. RINDATPCRINDAT = -2.58 + 0.83*PCLINET
r2 = 0.921 to 1 relationship
(a)
Fig. 2. Correlation between LINET and RINDAT peak currents (PC) for 222 and 173 selectedstrokes on (a) 4 and (b) 18 February 2005, respectively, in the areas shown in Fig. 1a–b.
14876

ACPD7, 14813–14894, 2007
Lightning activity inBrazilian
thunderstorms
H. Huntrieser et al.
Title Page
Abstract Introduction
Conclusions References
Tables Figures
J I
J I
Back Close
Full Screen / Esc
Printer-friendly Version
Interactive Discussion
EGU
Method to estimate the global annual LNOx production based on field measurements
mean anvil-NOx
Falcon LINET strokes
mean BL-NOxsubtracted
mean χLNOx |Va-Vs| ρa
T, p
Δx, Δz
u, v
Radar
hor. LNOx mass flux F(LNOx) out of anvil
LNOx production rate per LINET stroke P(LNOx)LINET
LNOx production rate per LIS flash P(LNOx)LIS
global LNOx production rate per year G(LNOx)global LIS flash rate 44 s-1
LINET scaled with LIS
stroke rate in selected TS
strokes contributing to anvil-NOx
selected TS
FLEXPARTu, v
LIS
Geo-physica
Fig. 3. Flow chart showing the introduced method to estimate the annual global LNOx produc-tion rate from TROCCINOX field measurements (Falcon, Geophysica, LINET, Radar) combinedwith LIS data and model simulations (FLEXPART) of the selected thunderstorms (TS) all indi-cated with grey background. Different line colours are used to avoid misunderstanding of theflow direction at line intersections.
14877

ACPD7, 14813–14894, 2007
Lightning activity inBrazilian
thunderstorms
H. Huntrieser et al.
Title Page
Abstract Introduction
Conclusions References
Tables Figures
J I
J I
Back Close
Full Screen / Esc
Printer-friendly Version
Interactive Discussion
EGU
Fig. 4a. Horizontal distributions of LINET strokes on (a) 4 and (b) 18 February 2005. All strokesregistered before the Falcon penetration within the selected thunderstorm systems on 4 Febru-ary (tropical: labelled 1a, 5a and 2b) and 18 February (subtropical) are coloured. Falcon flightpaths and NOx mixing ratios are superimposed (colour/grey scale). The red arrows indicate thedirection of the storm motion and the green arrows the main wind direction in the anvil outflow.In addition, the positions of the 6 LINET sensors listed in Table 1 are indicated in (a).
14878

ACPD7, 14813–14894, 2007
Lightning activity inBrazilian
thunderstorms
H. Huntrieser et al.
Title Page
Abstract Introduction
Conclusions References
Tables Figures
J I
J I
Back Close
Full Screen / Esc
Printer-friendly Version
Interactive Discussion
EGU
Fig. 4b. Continued.
14879

ACPD7, 14813–14894, 2007
Lightning activity inBrazilian
thunderstorms
H. Huntrieser et al.
Title Page
Abstract Introduction
Conclusions References
Tables Figures
J I
J I
Back Close
Full Screen / Esc
Printer-friendly Version
Interactive Discussion
EGU
LINET stroke distributions
UTC14 15 16 17 18 19 20 21
num
ber o
f LIN
ET
stro
kes
(5 m
in.)-1
0
20
40
60
80
100180205: anvil I-VI040205: anvil 1a040205: anvil 2b040205: anvil 5a
I-VI1a 2b5a
Fig. 5. Time series of LINET stroke rates for the selected thunderstorms (only strokes withpeak currents ≥10 kA considered). On 4 February 2005, stroke rates in the investigated thun-derstorms (active) are shown from storm initiation until penetration (tropical: labelled 1a, 5aand 2b). On 18 February 2005, the stroke rate within the selected thunderstorm system (sub-tropical) is shown from storm initiation until decay. The repeated penetration started first at20:34 UTC (labelled I-VI) when the lightning activity decayed.
14880

ACPD7, 14813–14894, 2007
Lightning activity inBrazilian
thunderstorms
H. Huntrieser et al.
Title Page
Abstract Introduction
Conclusions References
Tables Figures
J I
J I
Back Close
Full Screen / Esc
Printer-friendly Version
Interactive Discussion
EGU
Fig. 6. Comparison between Falcon and ECMWF wind velocity (in black and blue, respectively)and wind direction (in red and orange, respectively) for the flight on 18 February 2005.
14881

ACPD7, 14813–14894, 2007
Lightning activity inBrazilian
thunderstorms
H. Huntrieser et al.
Title Page
Abstract Introduction
Conclusions References
Tables Figures
J I
J I
Back Close
Full Screen / Esc
Printer-friendly Version
Interactive Discussion
EGU
a)
b)
c)
d)
e)
f)
20:30-21:00
20:00-21:00
19:30-21:00
19:00-21:00
18:30-21:00
18:00-21:00
pmol mol-1
Fig. 7. FLEXPART lightning tracer simulations (NOx at 10 km in pmol mol−1) for the 18 Febru-ary 2005 subtropical thunderstorm system considering all LINET strokes (black dots) after (a)20:30 UTC, (b) 20:00 UTC, (c) 19:30 UTC, (d) 19:00 UTC, (e) 18:30 UTC, (f) 18:00 UTC anduntil 21:00 UTC. The Falcon track is superimposed in red.
14882

ACPD7, 14813–14894, 2007
Lightning activity inBrazilian
thunderstorms
H. Huntrieser et al.
Title Page
Abstract Introduction
Conclusions References
Tables Figures
J I
J I
Back Close
Full Screen / Esc
Printer-friendly Version
Interactive Discussion
EGU
a) b)
c) d)
19.0°S
20.0°S
49.5°W 48.0°W
18:00 UTC 19:00 UTC
20:00 UTC
21:00 UTC
21:00 UTC
Fig. 8. Radar reflectivity as PPI scan (PPI SURVEILLANCE operational product) in dBZ unitsmeasured at 0.0◦ elevation by the Bauru radar (22.4◦ S, 49.0◦ W) for the 18 February 2005 sub-tropical thunderstorm system (marked in red) at (a) 18:00 UTC, (b) 19:00 UTC, (c) 20:00 UTCand (d) 21:00 UTC.
14883

ACPD7, 14813–14894, 2007
Lightning activity inBrazilian
thunderstorms
H. Huntrieser et al.
Title Page
Abstract Introduction
Conclusions References
Tables Figures
J I
J I
Back Close
Full Screen / Esc
Printer-friendly Version
Interactive Discussion
EGU
**
(b)
(a)
48.0°W50.0°W
20.0°S
22.0°S
**
Fig. 9. Vertical maximum of the radar reflectivity (max CAPPI frame, unit dBZ). Compositefrom the Bauru (22.4◦ S, 49.0◦ W) and Presidente Prudente (22.1◦ S, 51.4◦ W) radars for the 4February 2005 thunderstorms at (a) 17:59:47 UTC, and (b) 19:00:14 UTC. Selected thunder-storms are marked (tropical: yellow circle anvil 1a, white circle anvil 5a and red circle anvil 2b).The change in location of each of these circles between (a) and (b) indicates the storm motion,which can be compared with the storm motion indicated by arrows in Fig. 4a. The Bauru andPresidente Prudente radar sites are indicated with a yellow and white *, respectively. The leftand upper axes give the distance in km, and the latitude and longitude are indicated in (a).(TITAN Software, installed at IPMet in collaboration with NCAR.)
14884

ACPD7, 14813–14894, 2007
Lightning activity inBrazilian
thunderstorms
H. Huntrieser et al.
Title Page
Abstract Introduction
Conclusions References
Tables Figures
J I
J I
Back Close
Full Screen / Esc
Printer-friendly Version
Interactive Discussion
EGU
TROCCINOX - F#11 180205b
CO /nmol mol-1
40 60 80 100 120
pres
sure
alti
tude
/m
0
2000
4000
6000
8000
10000
12000
O3 /nmol mol-1
10 20 30 40 50 60 70 80 90
NOx /nmol mol-10.0 0.1 0.2 0.3 0.4
COO3
NOx
(a)
Fig. 10a. (a) Vertical profiles for CO, O3, and NOx mixing ratios from the Falcon flight on 18February 2005. The red box at 2 km altitude indicates the top of the mixed layer.
14885
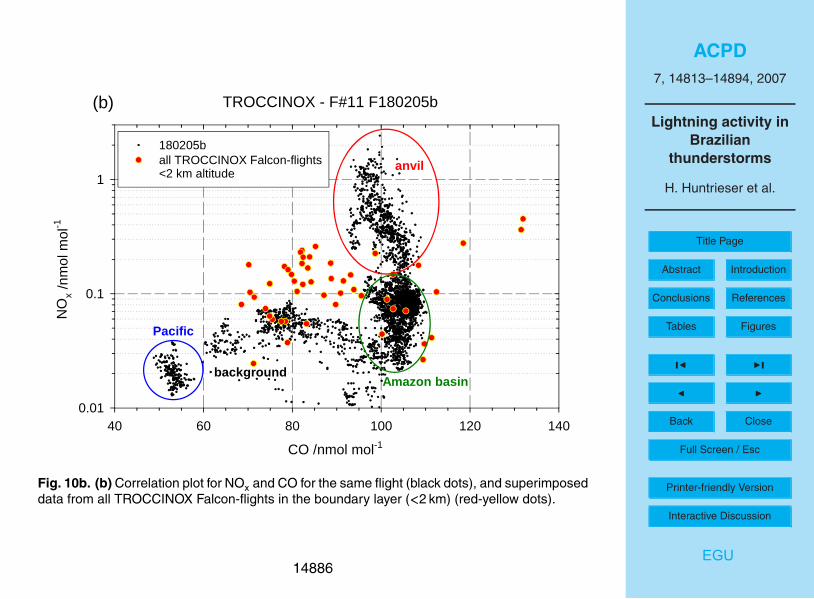
ACPD7, 14813–14894, 2007
Lightning activity inBrazilian
thunderstorms
H. Huntrieser et al.
Title Page
Abstract Introduction
Conclusions References
Tables Figures
J I
J I
Back Close
Full Screen / Esc
Printer-friendly Version
Interactive Discussion
EGU
TROCCINOX - F#11 F180205b
CO /nmol mol-140 60 80 100 120 140
NO
x /nm
ol m
ol-1
0.01
0.1
1
180205ball TROCCINOX Falcon-flights<2 km altitude anvil
Amazon basin
Pacific
background
(b)
Fig. 10b. (b) Correlation plot for NOx and CO for the same flight (black dots), and superimposeddata from all TROCCINOX Falcon-flights in the boundary layer (<2 km) (red-yellow dots).
14886

ACPD7, 14813–14894, 2007
Lightning activity inBrazilian
thunderstorms
H. Huntrieser et al.
Title Page
Abstract Introduction
Conclusions References
Tables Figures
J I
J I
Back Close
Full Screen / Esc
Printer-friendly Version
Interactive Discussion
EGU
elapsed UTC time in seconds since midnight73000 74000 75000 76000 77000 78000
verti
cal v
eloc
ity /m
s-1
0.01
0.1
1
NO
y m
ixin
g ra
tio /n
mol
mol
-1
0.01
0.1
1
|wpos||wneg|NOy
|wpos| mean|wneg| mean
TROCCINOX - F#11 180205b
I II III IV V VI
Fig. 11. Time series of NOy mixing ratio and absolute vertical velocity for the Falcon flight on18 February 2005. The anvil penetrations are labelled I–VI.
14887

ACPD7, 14813–14894, 2007
Lightning activity inBrazilian
thunderstorms
H. Huntrieser et al.
Title Page
Abstract Introduction
Conclusions References
Tables Figures
J I
J I
Back Close
Full Screen / Esc
Printer-friendly Version
Interactive Discussion
EGU
LIS flash
all LINET strokes
Bauru Radar
LINET 10 kA�
Fig. 12. Vertical maximum of the radar reflectivity (max CAPPI frame, unit dBZ) on 4 Febru-ary 2005 at 21:30 UTC measured by the Bauru (22.4◦ S, 49.0◦ W) and Presidente Prudente(22.1◦ S, 51.4◦ W) radars. Superimposed are the horizontal distributions of LIS flashes (in red)and LINET strokes (black and yellow) for the time period 21:23:45 UTC–21:25:21 UTC
14888

ACPD7, 14813–14894, 2007
Lightning activity inBrazilian
thunderstorms
H. Huntrieser et al.
Title Page
Abstract Introduction
Conclusions References
Tables Figures
J I
J I
Back Close
Full Screen / Esc
Printer-friendly Version
Interactive Discussion
EGU
040205_anvil 1a
0 20 40 60 80
num
ber o
f LIN
ET
stro
kes
(kA
)-1
tota
l NO
pro
d. /k
gN (k
A)-1
1
10
100
1000
0
10
20
30
40
50
60number of strokestotal LNOx massLNOx mass per stroke
(a)
CLINET = 30 km
040205_anvil 5a
0 20 40 60 80
num
ber o
f LIN
ET
stro
kes
(kA
)-1
tota
l NO
pro
d. /k
gN (k
A)-1
1
10
100
1000
0
10
20
30
40
50
60(b)
CLINET = 25 km
040205_anvil 2b
peak current /kA0 20 40 60 80
num
ber o
f LIN
ET
stro
kes
(kA
)-1
tota
l NO
pro
d. /k
gN (k
A)-1
1
10
100
1000
0
10
20
30
40
50
60(c)
180205b_anvil III
0 20 40 60 801
10
100
1000
NO
pro
d. /k
gN s
troke
-1
0
10
20
30
40
50
60
(d)
040205_LINET centre (00-24 UTC)
0 20 40 60 80 1001
10
100
1000
10000
NO
pro
d. /k
gN s
troke
-1
0
20
40
60
80
180205b_anvil I-VI (14-21 UTC)
peak current /kA0 20 40 60 80 100
1
10
100
1000
10000
NO
pro
d. /k
gN s
troke
-1
0
20
40
60
80
(e)
(f)
CLINET = 41 km
CLINET = 126 km
CLINET = 44 km
CLINET = 160 km
Fig. 13. Frequency distribution of LINET strokes (vertical grey bars) as a function of peak cur-rent for the selected tropical and subtropical thunderstorm systems on 4 and 18 February 2005,respectively (see Table 3). Superimposed is the laboratory result by Wang et al. (1998) modi-fied for LINET strokes (blue dashed line) according to Table 3 (CLINET) and the estimated totalamount of LNOx mass produced per 1 kA LINET stroke interval for the selected thunderstormsystems (red line), see mass estimates in Table 3.
14889

ACPD7, 14813–14894, 2007
Lightning activity inBrazilian
thunderstorms
H. Huntrieser et al.
Title Page
Abstract Introduction
Conclusions References
Tables Figures
J I
J I
Back Close
Full Screen / Esc
Printer-friendly Version
Interactive Discussion
EGU
040205_LINET centre (00-24 UTC)
peak current /kA0 20 40 60 80 100
num
ber o
f LIN
ET s
troke
s (k
A)-1
1
10
100
1000
10000
number of IC strokesnumber of CG strokes
Fig. 14. Frequency distributions of LINET strokes as a function of peak current separated forIC (blue) and CG (green) strokes on 4 February 2005.
14890

ACPD7, 14813–14894, 2007
Lightning activity inBrazilian
thunderstorms
H. Huntrieser et al.
Title Page
Abstract Introduction
Conclusions References
Tables Figures
J I
J I
Back Close
Full Screen / Esc
Printer-friendly Version
Interactive Discussion
EGU
ECMWF data
equi
vale
nt p
oten
tial t
empe
ratu
re /K
320
325
330
335
340
345
350
355
850 hPa500 hPa
Date
horiz
onta
l win
d ve
loci
ty /m
s-1
-30
-20
-10
0
10
20
30
40
50
u-comp. 200 hPa v-comp. 200 hPatotal 200 hPa
23 J
an.
28 J
an.
02 F
eb.
07 F
eb.
12 F
eb.
17 F
eb.
22 F
eb.
W
(a)
(b)
EN
S
27 F
eb.
Fig. 15. Time series of (a) equivalent potential temperature and (b) horizontal wind velocity(separated in N, E, W, and S components) at different levels for the period of the TROCCINOXfield phase in 2005 (22◦ S, 49◦ W). Days with registered LINET strokes in the LINET centre area(criterion: at least 40 strokes ≥10 kA, see Table 4b) are marked with grey patterns (tropicaldays: dense tilted, transition tropical/subtropical: less dense tilted, subtropical: crossed).
14891
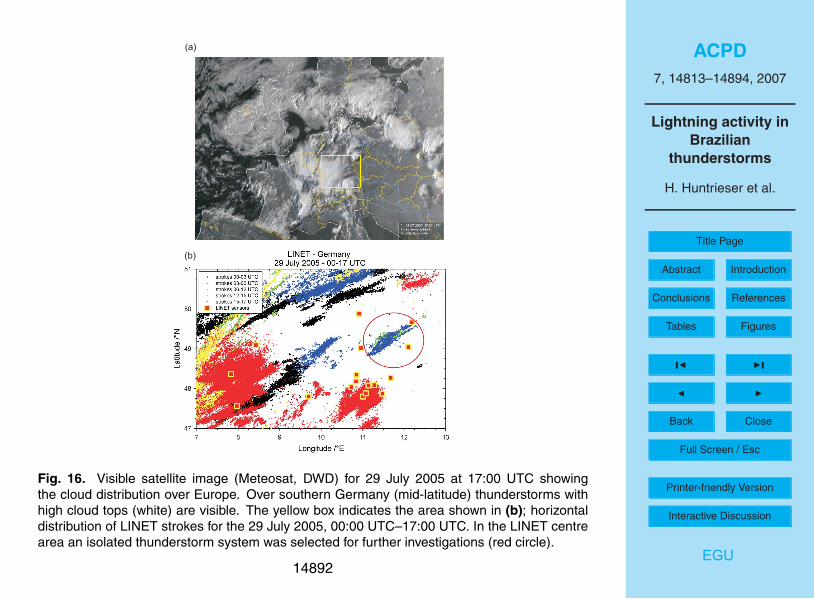
ACPD7, 14813–14894, 2007
Lightning activity inBrazilian
thunderstorms
H. Huntrieser et al.
Title Page
Abstract Introduction
Conclusions References
Tables Figures
J I
J I
Back Close
Full Screen / Esc
Printer-friendly Version
Interactive Discussion
EGU
(a)
(b)
Fig. 16. Visible satellite image (Meteosat, DWD) for 29 July 2005 at 17:00 UTC showingthe cloud distribution over Europe. Over southern Germany (mid-latitude) thunderstorms withhigh cloud tops (white) are visible. The yellow box indicates the area shown in (b); horizontaldistribution of LINET strokes for the 29 July 2005, 00:00 UTC–17:00 UTC. In the LINET centrearea an isolated thunderstorm system was selected for further investigations (red circle).
14892

ACPD7, 14813–14894, 2007
Lightning activity inBrazilian
thunderstorms
H. Huntrieser et al.
Title Page
Abstract Introduction
Conclusions References
Tables Figures
J I
J I
Back Close
Full Screen / Esc
Printer-friendly Version
Interactive Discussion
EGU
peak current /kA0 10 20 30 40 50 60 70
stro
ke fr
eque
ncy
/% (k
A)-1
0.01
0.1
1
10
100tropical /Brazil (78745 strokes)230105+040205+250205tropical /Brazil (36207 strokes)040205mid-latitude /Germany (58543 strokes)290605+040705+100705+150705+290705 mid-latitude /Germany (6738 strokes)290605_TSmid-latitude /Germany (3444 strokes)290705_TS
(b)
LINET - peak current distributions
peak current /kA0 20 40 60 80 100
stro
ke fr
eque
ncy
/% (k
A)-1
0
5
10
15
20
25
30
tropical Brazil: 040205mid-latitudes Germany: 290705mid-latitudes Germany: 290705reduced number of sensors
peak current /kA0 10 20 30 40 50 60 70
stro
ke fr
eque
ncy
/% (k
A)-1
0.01
0.1
1
10
100
(a)
Fig. 17. Frequency distributions of LINET strokes (in the LINET centre area) as a function ofpeak current for different datasets given in colour (for comparison all curves were normalised).(c) Estimated amount of NO produced per 1 kA stroke interval (based on the Wang et al. 1998relationship) for the dataset in (a) considering different values for CLINET.
14893
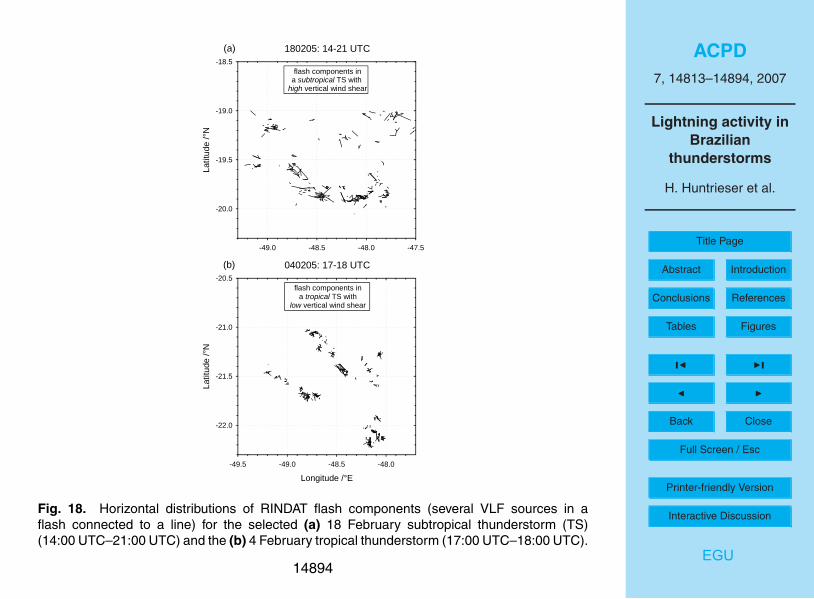
ACPD7, 14813–14894, 2007
Lightning activity inBrazilian
thunderstorms
H. Huntrieser et al.
Title Page
Abstract Introduction
Conclusions References
Tables Figures
J I
J I
Back Close
Full Screen / Esc
Printer-friendly Version
Interactive Discussion
EGU
180205: 14-21 UTC
-49.0 -48.5 -48.0 -47.5
Latit
ude
/°N
-20.0
-19.5
-19.0
-18.5
040205: 17-18 UTC
Longitude /°E-49.5 -49.0 -48.5 -48.0
Latit
ude
/°N
-22.0
-21.5
-21.0
-20.5
flash components ina subtropical TS with
high vertical wind shear
flash components ina tropical TS with
low vertical wind shear
(a)
(b)
Fig. 18. Horizontal distributions of RINDAT flash components (several VLF sources in aflash connected to a line) for the selected (a) 18 February subtropical thunderstorm (TS)(14:00 UTC–21:00 UTC) and the (b) 4 February tropical thunderstorm (17:00 UTC–18:00 UTC).
14894