Embed Size (px)
Citation preview

Atmos. Chem. Phys., 8, 921–953, 2008www.atmos-chem-phys.net/8/921/2008/© Author(s) 2008. This work is distributed underthe Creative Commons Attribution 3.0 License.
AtmosphericChemistry
and Physics
Lightning activity in Brazilian thunderstorms duringTROCCINOX: implications for NO x production
H. Huntrieser1, U. Schumann1, H. Schlager1, H. Holler1, A. Giez2, H.-D. Betz3, D. Brunner4,*, C. Forster5,** , O. PintoJr.6, and R. Calheiros7
1Institut fur Physik der Atmosphare, Deutsches Zentrum fur Luft- und Raumfahrt (DLR), Oberpfaffenhofen, Germany2Flugabteilung, Deutsches Zentrum fur Luft- und Raumfahrt (DLR), Oberpfaffenhofen, Germany3Physics Department, University of Munich, Germany4Institute for Atmospheric and Climate Science, ETH Zurich, Switzerland5Norwegian Institute for Air Research (NILU), Atmosphere and Climate Change Department, Kjeller, Norway6National Institute for Space Research, INPE, Brazil7Instituto de Pesquisas Meteorologicas – Universidade Estadual Paulista, IPMet/UNESP, Bauru, Brazil* now at: Laboratory for Air Pollution and Environmental Technology, Empa, Swiss Federal Laboratories for MaterialsTesting and Research, Dubendorf, Switzerland** now at: Institut fur Physik der Atmosphare, Deutsches Zentrum fur Luft- und Raumfahrt (DLR), Oberpfaffenhofen,Germany
Received: 12 September 2007 – Published in Atmos. Chem. Phys. Discuss.: 16 October 2007Revised: 18 January 2008 – Accepted: 25 January 2008 – Published: 25 February 2008
Abstract. During the TROCCINOX field experiment inJanuary and February 2005, the contribution of lightning-induced nitrogen oxides (LNOx) from tropical and subtropi-cal thunderstorms in Southern Brazil was investigated. Air-borne trace gas measurements (NO, NOy, CO and O3) wereperformed up to 12.5 km with the German research aircraftFalcon. During anvil penetrations in selected tropical andsubtropical thunderstorms of 4 and 18 February, NOx mix-ing ratios were on average enhanced by 0.7–1.2 and 0.2–0.8 nmol mol−1 totally, respectively. The relative contribu-tions of boundary layer NOx (BL-NOx) and LNOx to anvil-NOx were derived from the NOx-CO correlations. On aver-age∼80–90% of the anvil-NOx was attributed to LNOx. ALightning Location Network (LINET) was set up to moni-tor the local distribution of cloud-to-ground (CG) and intra-cloud (IC) radiation sources (here called “strokes”) and com-pared with lightning data from the operational Brazilian net-work RINDAT (Rede Integrada Nacional de Deteccao deDescargas Atmosfericas). The horizontal LNOx mass fluxout of the anvil was determined from the mean LNOx mix-
Correspondence to:H. Huntrieser([email protected])
ing ratio, the horizontal outflow velocity and the size of thevertical cross-section of the anvil, and related to the num-ber of strokes contributing to LNOx. The values of theseparameters were derived from the airborne measurements,from lightning and radar observations, and from a trajec-tory analysis. The amount of LNOx produced per LINETstroke depending on measured peak current was determined.The results were scaled up with the Lightning Imaging Sen-sor (LIS) flash rate (44 flashes s−1) to obtain an estimateof the global LNOx production rate. The final results gave∼1 and∼2–3 kg(N) per LIS flash based on measurements inthree tropical and one subtropical Brazilian thunderstorms,respectively, suggesting that tropical flashes may be less pro-ductive than subtropical ones. The equivalent mean annualglobal LNOx nitrogen mass production rate was estimated tobe 1.6 and 3.1 Tg a−1, respectively. By use of LINET ob-servations in Germany in July 2005, a comparison with thelightning activity in mid-latitude thunderstorms was also per-formed. In general, the same frequency distribution of strokepeak currents as for tropical thunderstorms over Brazil wasfound. The different LNOx production rates per stroke intropical thunderstorms compared with subtropical and mid-latitude thunderstorms seem to be related to the differentstroke lengths (inferred from comparison with laboratory
Published by Copernicus Publications on behalf of the European Geosciences Union.

922 H. Huntrieser et al.: Lightning activity in Brazilian thunderstorms
data and observed lengths). In comparison, the impact ofother lightning parameters as stroke peak current and strokerelease height was assessed to be minor. The results fromTROCCINOX suggest that the different vertical wind shearmay be responsible for the different stroke lengths.
1 Introduction
A general introduction to the LNOx topic and overviews ofpast and present measurements of LNOx in thunderstormsare given in accompanying papers by Huntrieser et al. (2007)(HH07) and by Schumann and Huntrieser (2007) (SH07).Observations from local field experiments have been extrap-olated to the global scale to estimate the average amountof LNOx produced annually over the globe which is onecrucial, yet highly uncertain, parameter in the global NOxbudget. A LNOx nitrogen mass source strength between 2and 20 Tg a−1 has frequently been given in the literature inthe past (WMO, 1995; Bradshaw et al., 2000). More re-cently, lower values between 1 and 14 Tg a−1 have been re-ported based on estimates from airborne and satellite mea-surements (Huntrieser et al., 2002; Beirle et al., 2004, 2006;Ridley et al., 2004; Boersma et al., 2005; Ott et al., 2007).Furthermore, chemical transport models (CTMs) have beenused to reduce the LNOx range by a comparison of modelledNOx concentrations, for different LNOx source strengths andvertical distributions, with local field and satellite measure-ments. The results obtained with model fits indicate best-estimate values for the global LNOx nitrogen mass between2 and 8 Tg a−1 (SH07).
Different methods have been used to estimate the amountof LNOx based on ground-based, airborne and laboratorymeasurements, and theoretical calculations, as reviewed bySH07. Airborne NOx measurements can be combined withlightning observations to estimate the amount of LNOx pro-duced per flash or per metre flash length. These numbershave been scaled up with the mean flash length and the an-nual global flash frequency. A large uncertainty in the es-timate of LNOx still results from the assumed NO produc-tion rates by CG and IC flashes (Martin et al., 2007). Upto now, it has been suggested that most components of adischarge produce NOx with varying, not determined effi-ciencies (Chameides, 1986; Coppens et al., 1998; Dye et al.,2000). In addition, it has been pointed out that the differentflash lengths for CG and IC flashes may play an importantrole in the LNOx production rate (Defer et al., 2003). Re-cently Rahman et al. (2007) presented first direct measure-ments of NOx generated by rocket-triggered lightning in thefield. Based on the results from a small data set of three trig-gered flashes, they suggest that it is the longer-lasting andcontinuous current portions of flashes that are responsible formost of the NO production. In comparison, the production byshort-term return strokes was found to be minor. However,
these longer and continuous current portions of flashes arecurrently not measured by operating lightning detection net-works as the National Lightning Detection Network (NLDN)and the very low frequency/low frequency (VLF/LF) light-ning location network LINET used here. NLDN only detectsthe high-current return stroke of a discharge.
Results from the European Lightning Nitrogen Oxides Ex-periment (EULINOX) and Stratosphere-Troposphere Exper-iment: Radiation, Aerosols, and Ozone (STERAO) (DeCariaet al., 2000; Fehr et al., 2004; DeCaria et al., 2005; Ridleyet al., 2005; Ott et al., 2007) indicate that IC flashes produceabout as much NO per flash as CG flashes (IC/CG produc-tion ratio 0.5–2). In addition, laboratory results from Gal-lardo and Cooray (1996) and model simulations from Zhanget al. (2003) support that IC and CG flashes are similarly en-ergetic. On the other hand, laboratory studies by Wang etal. (1998) showed that LNOx depends less on energy andmore on atmospheric pressure and the peak current of theflash. They concluded that “NO production per metre dis-charge length as a function of peak current appears to providea more appropriate scaling factor for estimates of total globalNO production”. The present study makes use of this findingby combining Wang et al. (1998) NOx measurements for lab-oratory flashes with our NOx and lightning peak current mea-surements from the field. First results were briefly presentedin Huntrieser et al. (2006), indicating differences for tropicaland subtropical thunderstorms in Brazil, which are discussedhere in more detail. A further study is in preparation by Ott etal. (2008)1. The authors find that the mean peak currents andthe NO production amounts per flash in five different thun-derstorms decrease with increasing latitude: the lowest valueof NO production (360 moles/flash) was found for a EULI-NOX storm (48◦ N) and the largest value of NO production(700 moles/flash) was found for a CRYSTAL-FACE storm(26◦ N). Recently, Barthe et al. (2007) incorporated the re-lationship between produced LNOx per m laboratory sparkand atmospheric pressure according to Wang et al. (1998) intheir simulations with an explicit electrical scheme and a 3-Dmesoscale model (Meso-NH).
Up to now, only a few airborne experiments have beenconducted that are suitable to provide an estimate of theLNOx production rate in the tropics (see SH07). In this pa-per we present measurements from the “Tropical Convection,Cirrus and Nitrogen Oxides Experiment“ (TROCCINOX)carried out in the wet season in January and February 2005 inthe State of Sao Paulo and its surroundings in southern Brazil(10◦ S to 28◦ S and 38◦ W to 55◦ W). Both tropical and sub-tropical thunderstorms were investigated, since the operationarea was located along the South Atlantic convergence zone
1 Ott, L. E., Pickering, K. E., DeCaria, A. J., Stenchikov, G. L.,Lin, F.-F., Wang, D., Lang, S., and Tao, W.-K.: Production of light-ning NOx and its vertical distribution calculated from 3-D cloudscale chemical transport simulations, in preparation, J. Geophys.Res., 2008.
Atmos. Chem. Phys., 8, 921–953, 2008 www.atmos-chem-phys.net/8/921/2008/

H. Huntrieser et al.: Lightning activity in Brazilian thunderstorms 923
(SACZ) (HH07). The main questions of this study are: 1.)How much LNOx is produced by these tropical and subtrop-ical thunderstorms? 2.) What are the relative contributionsfrom strokes with different peak currents? 3.) How large isthe LNOx production rate per stroke or flash? 4.) Is thisLNOx production rate different for tropical and subtropicalthunderstorms? 5.) What are the possible reasons for thedifference? 6.) Can the findings from TROCCINOX helpto explain the large LNOx productivity observed in Floridathunderstorms during CRYSTAL-FACE?
To answer these questions we analyse airborne measure-ments of NO, NOy, CO, and O3 mixing ratios, the J(NO2)photolysis rate and meteorological parameters performed inthe outflow of thunderstorms, trajectory analyses with theFLEXPART model and measurements from LINET, whichwas set up during TROCCINOX to monitor the local light-ning distribution (Sect. 2). This system registers VLF/LFradiation sources (here called “strokes”) from both CG andIC flashes. LINET data are compared with data from theoperational Brazilian lightning detection network RINDAT(Sect. 3) and with LIS data (Sect. 4). Airborne NOx andground-based lightning measurements are combined to givean estimate of the amount of LNOx produced per LINETstroke, and as a function of peak current according to Wanget al. (1998) (Sect. 4). From the ratio between LIS andLINET during one overpass, the amount of LNOx per LISflash is determined. Knowing the global and annual LISflash rate (44±5 flashes s−1, Christian et al., 2003; Chris-tian and Petersen, 2005), the equivalent annual global LNOxproduction rate based on individual TROCCINOX thunder-storms is estimated (Sect. 4). The different LNOx produc-tion rates estimated in tropical and subtropical thunderstormsare investigated through a comparison of LINET measure-ments, e.g. frequency distributions of stroke peak currentsand mean peak currents (Sect. 5). In addition, the light-ning properties are compared with those in mid-latitude thun-derstorms over Germany, where the same lightning locationnetwork (LINET) was set up in July 2005. Airborne NOxmeasurements over Germany are available from previouscampaigns (Huntrieser et al., 1998, 2002), but not for July2005 (Sect. 5). The results are discussed and summarisedin Sects. 6–7. The present study is the first to our knowl-edge that investigates whether tropical, subtropical and mid-latitude thunderstorms have different potentials to produceLNOx by combining lightning peak current measurementswith airborne NOx and meteorological measurements.
2 Data and model description
For general information on the TROCCINOX field exper-iment, see the papers by Schumann et al. (2004), HH07and SH07. The following subsections describe the air-borne data obtained mainly from the research aircraft Fal-con of the Deutsches Zentrum fur Luft- und Raumfahrt
(DLR) as well as partly from the Russian M55 Geophys-ica aircraft (Sect. 2.1), lightning data from LINET, LIS andRINDAT (Sect. 2.2) and model simulations from FLEX-PART (Sect. 2.3). In addition, we use data from two S-band Doppler radars in Bauru (22.4◦ S, 49.0◦ W) and in Pres-idente Prudente (22.1◦ S, 51.4◦ W) operated by the Institutode Pesquisas Meteorologicas (IPMet). Two different radarreflectivity products are presented: surveillance Plan Posi-tion Indicator (PPI, range 450 km) and 3.5 km Constant Al-titude PPI (CAPPI, range 240 km). The meteorological en-vironment of tropical, subtropical and mid-latitude thunder-storms was characterised with analysis data (temperature,water vapour mixing ratio, pressure, wind velocity and direc-tion) from the European Centre for Medium Range WeatherForecasts (ECMWF) with 3 h temporal resolution, 1◦ hori-zontal resolution and 60 vertical levels. The equivalent po-tential temperature is calculated as described in HH07. Theseparation of tropical and subtropical air masses is based onmeteorological data, as already discussed for the two selectedflights of 4 and 18 February 2005 in HH07. The 4 and 18February flights were classified as tropical and subtropical,respectively.
2.1 Airborne instrumentation: Falcon and Geophysica
Airborne measurements up to 12.5 km were carried out withthe Falcon, which was equipped with DLR instruments tomeasure NO, NOy, O3, CO and J(NO2). The chemical in-strumentation is the same as that used during several DLRfield campaigns in the past (HH07). Position, altitude, tem-perature, humidity, pressure and the 3-dimensional wind vec-tor (u, v andw) were measured with the standard Falcon me-teorological measurement systems (Schumann et al., 1995).Wind and pressure were measured with a Rosemount flowangle sensor (model 858) at the Falcon’s noseboom tip. Theaerodynamic measurements were analysed according to anextensive in-flight calibration programme (Bogel and Bau-mann, 1991).
In addition, NO and CO measurements were obtainedfrom the high-flying Geophysica aircraft (∼20 km) (Ste-fanutti et al., 2004). The SIOUX instrument, developedand operated by the DLR, measures the NO mixing ratio(chemiluminescence technique) with a time resolution of1 s, and an accuracy and precision of 10% and 5%, respec-tively. The CO-TDL instrument (cryogenic Tunable DiodeLaser technique) operated by the Istituto Nazionale di OtticaApplica/Consiglio Nazionale delle Ricerche (INOA/CNR),measures the CO mixing ratio with an averaging time of 5 s,the accuracy and precision being 5% and 2%, respectively.
All flight altitude values refer to pressure height and alltimes to UTC (Coordinated Universal Time) time (see alsoHH07).
www.atmos-chem-phys.net/8/921/2008/ Atmos. Chem. Phys., 8, 921–953, 2008
924 H. Huntrieser et al.: Lightning activity in Brazilian thunderstorms
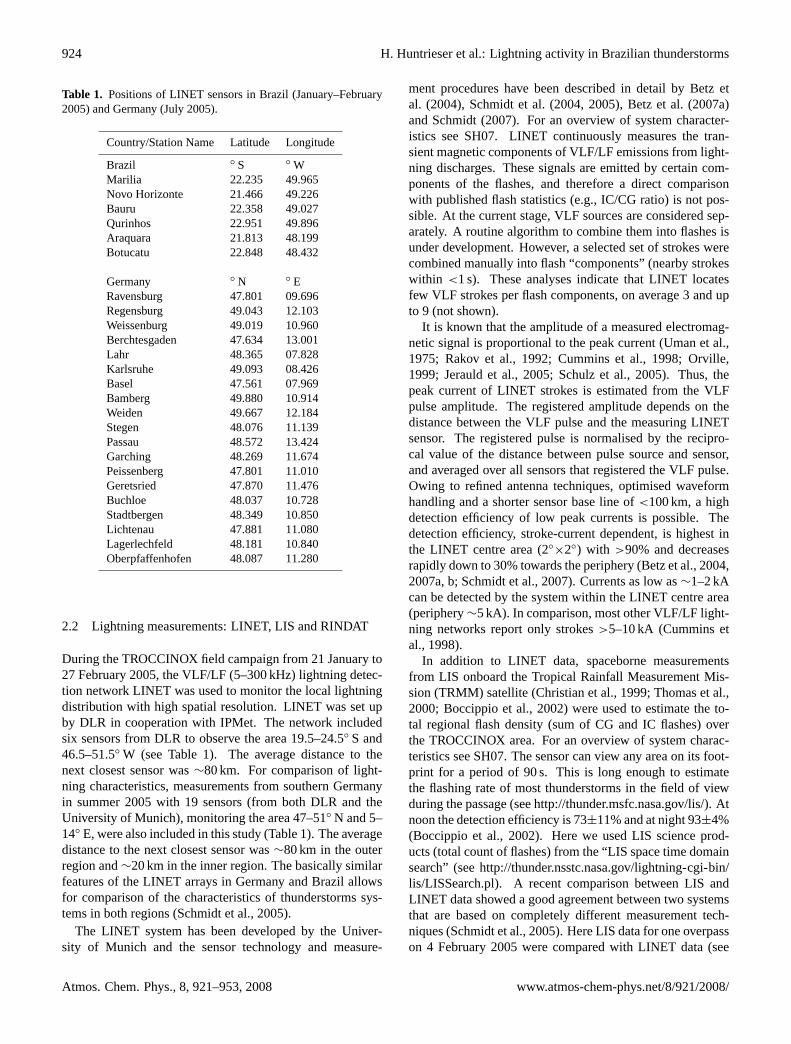
Table 1. Positions of LINET sensors in Brazil (January–February2005) and Germany (July 2005).
Country/Station Name Latitude Longitude
Brazil ◦ S ◦ WMarilia 22.235 49.965Novo Horizonte 21.466 49.226Bauru 22.358 49.027Qurinhos 22.951 49.896Araquara 21.813 48.199Botucatu 22.848 48.432
Germany ◦ N ◦ ERavensburg 47.801 09.696Regensburg 49.043 12.103Weissenburg 49.019 10.960Berchtesgaden 47.634 13.001Lahr 48.365 07.828Karlsruhe 49.093 08.426Basel 47.561 07.969Bamberg 49.880 10.914Weiden 49.667 12.184Stegen 48.076 11.139Passau 48.572 13.424Garching 48.269 11.674Peissenberg 47.801 11.010Geretsried 47.870 11.476Buchloe 48.037 10.728Stadtbergen 48.349 10.850Lichtenau 47.881 11.080Lagerlechfeld 48.181 10.840Oberpfaffenhofen 48.087 11.280
2.2 Lightning measurements: LINET, LIS and RINDAT
During the TROCCINOX field campaign from 21 January to27 February 2005, the VLF/LF (5–300 kHz) lightning detec-tion network LINET was used to monitor the local lightningdistribution with high spatial resolution. LINET was set upby DLR in cooperation with IPMet. The network includedsix sensors from DLR to observe the area 19.5–24.5◦ S and46.5–51.5◦ W (see Table 1). The average distance to thenext closest sensor was∼80 km. For comparison of light-ning characteristics, measurements from southern Germanyin summer 2005 with 19 sensors (from both DLR and theUniversity of Munich), monitoring the area 47–51◦ N and 5–14◦ E, were also included in this study (Table 1). The averagedistance to the next closest sensor was∼80 km in the outerregion and∼20 km in the inner region. The basically similarfeatures of the LINET arrays in Germany and Brazil allowsfor comparison of the characteristics of thunderstorms sys-tems in both regions (Schmidt et al., 2005).
The LINET system has been developed by the Univer-sity of Munich and the sensor technology and measure-
ment procedures have been described in detail by Betz etal. (2004), Schmidt et al. (2004, 2005), Betz et al. (2007a)and Schmidt (2007). For an overview of system character-istics see SH07. LINET continuously measures the tran-sient magnetic components of VLF/LF emissions from light-ning discharges. These signals are emitted by certain com-ponents of the flashes, and therefore a direct comparisonwith published flash statistics (e.g., IC/CG ratio) is not pos-sible. At the current stage, VLF sources are considered sep-arately. A routine algorithm to combine them into flashes isunder development. However, a selected set of strokes werecombined manually into flash “components” (nearby strokeswithin <1 s). These analyses indicate that LINET locatesfew VLF strokes per flash components, on average 3 and upto 9 (not shown).
It is known that the amplitude of a measured electromag-netic signal is proportional to the peak current (Uman et al.,1975; Rakov et al., 1992; Cummins et al., 1998; Orville,1999; Jerauld et al., 2005; Schulz et al., 2005). Thus, thepeak current of LINET strokes is estimated from the VLFpulse amplitude. The registered amplitude depends on thedistance between the VLF pulse and the measuring LINETsensor. The registered pulse is normalised by the recipro-cal value of the distance between pulse source and sensor,and averaged over all sensors that registered the VLF pulse.Owing to refined antenna techniques, optimised waveformhandling and a shorter sensor base line of<100 km, a highdetection efficiency of low peak currents is possible. Thedetection efficiency, stroke-current dependent, is highest inthe LINET centre area (2◦×2◦) with >90% and decreasesrapidly down to 30% towards the periphery (Betz et al., 2004,2007a, b; Schmidt et al., 2007). Currents as low as∼1–2 kAcan be detected by the system within the LINET centre area(periphery∼5 kA). In comparison, most other VLF/LF light-ning networks report only strokes>5–10 kA (Cummins etal., 1998).
In addition to LINET data, spaceborne measurementsfrom LIS onboard the Tropical Rainfall Measurement Mis-sion (TRMM) satellite (Christian et al., 1999; Thomas et al.,2000; Boccippio et al., 2002) were used to estimate the to-tal regional flash density (sum of CG and IC flashes) overthe TROCCINOX area. For an overview of system charac-teristics see SH07. The sensor can view any area on its foot-print for a period of 90 s. This is long enough to estimatethe flashing rate of most thunderstorms in the field of viewduring the passage (seehttp://thunder.msfc.nasa.gov/lis/). Atnoon the detection efficiency is 73±11% and at night 93±4%(Boccippio et al., 2002). Here we used LIS science prod-ucts (total count of flashes) from the “LIS space time domainsearch” (seehttp://thunder.nsstc.nasa.gov/lightning-cgi-bin/lis/LISSearch.pl). A recent comparison between LIS andLINET data showed a good agreement between two systemsthat are based on completely different measurement tech-niques (Schmidt et al., 2005). Here LIS data for one overpasson 4 February 2005 were compared with LINET data (see
Atmos. Chem. Phys., 8, 921–953, 2008 www.atmos-chem-phys.net/8/921/2008/

H. Huntrieser et al.: Lightning activity in Brazilian thunderstorms 925
Sect. 4.5). LNOx estimates per LINET stroke were scaled upwith LIS observations to provide an estimate of the regionaland global strength of the LNOx production.
LINET data were also compared with data from the oper-ational Brazilian lightning detection network RINDAT (seehttp://www.rindat.com.br/). Like LINET, RINDAT operatesin the VLF/LF range. The detection efficiency for strokeswith peak currents above 10 kA is 80–90% and the loca-tion accuracy is 0.5–2.0 km (Pinto and Pinto, 2003). TheRINDAT system mainly registers CG flashes. A recent com-parison between LINET and RINDAT strokes indicates rea-sonable agreement for CG strokes when LINET peak cur-rents are above 12 kA (Schmidt et al., 2005); see further com-parisons in Sect. 3.
2.3 Transport modelling: FLEXPART
The distribution of LNOx in the vicinity of thundercloudswas simulated with the Lagrangian particle dispersion modelFLEXPART. General information on FLEXPART used forTROCCINOX is given in HH07. The model has mainlybeen used for studying long-range air pollution transport(e.g. Stohl et al., 2003a, b; Huntrieser et al., 2005), but alsoto investigate LNOx transport (Stohl et al., 2003b; Beirle etal., 2006; Cooper et al., 2006).
The LNOx emissions used here as input for FLEXPARTwere based on lightning stroke data from the LINET sys-tem. LNOx was released uniformly in the vertical between5 km (freezing level with negative charge centre) and 13 kmaltitude (cloud top) at the accurate horizontal position of ob-served VLF sources. Previous cloud model simulations fortropical continental thunderstorms (Pickering et al., 1998),indicate that LNOx was released mainly between 5 and13 km increasing with altitude. However, because of thelow resolution of the ECMWF wind fields (0.5◦ horizontally)used as input for FLEXPART, the distribution of lightningsources is assumed to be uniform in the vertical in the presentstudy. A hundred particles were released per stroke, carryingthe mass of LNOx produced (here set to 1 kg). The convec-tion scheme, used in these FLEXPART applications, trans-ports the particles upward into the anvil, from where theyfollow trajectories computed with the ECMWF wind fields.No quantitative estimate of the amount of LNOx is possiblefrom these simulations; they can, however, be used to es-timate the extension of the LNOx field advected out of theanvil region.
3 Observations during the field experiment
An overview of the observations on the two selected TROC-CINOX days, 4 and 18 February 2005 with thunderstormsin tropical and subtropical air masses, respectively, is givenin HH07. Here we briefly focus on the performance of thelightning detection network LINET (Sect. 3.1) and on the
Comparison LINET - RINDAT
04 February 2005
Longitude /°E
-49.8 -49.6 -49.4 -49.2 -49.0 -48.8 -48.6 -48.4 -48.2
Latit
ude
/°N
-22.6
-22.4
-22.2
-22.0
-21.8
-21.6
LINETRINDAT
(a)
18 February 2005
Longitude /°E
-49.4 -49.2 -49.0 -48.8 -48.6 -48.4 -48.2 -48.0 -47.8 -47.6
Latit
ude
/°N
-20.4
-20.2
-20.0
-19.8
-19.6
-19.4
-19.2
(b)
-21.4
Fig. 1. Horizontal distributions of RINDAT and LINET strokes forthe (a) 4 February 2005 in the centre area of the LINET detectionnetwork and for the(b) 18 February 2005 along the northern pe-riphery, 00:00 UTC–24:00 UTC.
representation of the Falcon measurements in the anvil out-flow (Sect. 3.2).
3.1 Performance of LINET compared with RINDAT
To evaluate the performance of the LINET system in moredetail, a comparison with the operational lightning detec-tion network in Brazil (RINDAT) was carried out for 4 and18 February 2005. Horizontal distributions of RINDAT andLINET strokes were compared for the LINET centre areaon 4 February 2005 (Fig. 1a), and for the northern LINETperiphery area on 18 February 2005 (Fig. 1b), 00:00 UTC–24:00 UTC. Overall, a general agreement was found, butwith a slight shift of RINDAT strokes to the west comparedwith LINET strokes, especially in Fig. 1b. In some areas thedensity of LINET strokes was much larger than of RINDATstrokes (probably because IC strokes and strokes with lowpeak are not registered by RINDAT). The correlations be-tween LINET and RINDAT peak currents (absolute values)
www.atmos-chem-phys.net/8/921/2008/ Atmos. Chem. Phys., 8, 921–953, 2008

926 H. Huntrieser et al.: Lightning activity in Brazilian thunderstorms
18 February 2005
LINET peak current /kA0 20 40 60 80 100 120 140 160
RIN
DA
T pe
ak c
urre
nt /k
A
0
20
40
60
80
100
120
140
160peak current LINET vs. RINDATregression LINET vs. RINDATPCRINDAT = -0.76 +0.68*PCLINET
r2 = 0.951 to 1 relationship
(b)
04 February 2005
LINET peak current /kA0 20 40 60 80 100 120 140 160
RIN
DA
T pe
ak c
urre
nt /k
A
0
20
40
60
80
100
120
140
160peak current LINET vs. RINDATregression LINET vs. RINDATPCRINDAT = -2.58 + 0.83*PCLINET
r2 = 0.921 to 1 relationship
(a)
Fig. 2. Correlation between LINET and RINDAT peak currents(PC) for 222 and 173 selected strokes on(a) 4 and(b) 18 February2005, respectively, in the areas shown in Fig. 1a–b.
for 222 and 173 selected strokes of 4 February (21.5–22.5◦ Sand 48.5–49.5◦ W) and 18 February (19.4–20.0◦ S and 47.7–49.2◦ W) are shown in Fig. 2a and b, respectively. On 4February only negative CG strokes were compared. On 18February no separation between CG and IC strokes was pos-sible for the LINET data, owing to the location of the selectedstrokes along the northern periphery area. LINET strokeswere therefore compared with both positive and negative CGstrokes from RINDAT. About 10% of the selected LINETstrokes were positive ones. The strokes shown in Fig. 2 wereselected manually to represent peak current values over theentire current range. LINET peak currents above 13–14 kAare in general also detected by RINDAT, occasionally evenLINET peak currents down to 7 kA. The slope (0.83) seenin Fig. 2a indicates that a 20 kA LINET stroke is on aver-age registered as 14 kA by RINDAT. In Fig. 2b the slope isslightly lower (0.68) owing to the lower LINET detection ef-ficiency along the northern periphery. In addition, the meanpeak current is higher for LINET strokes (35 kA in Fig. 2a
and 31 kA in Fig. 2b) than for RINDAT strokes (27 kA inFig. 2a and 20 kA in Fig. 2b). The high correlation coef-ficient (r2= 0.92 and 0.95, respectively) between the peakcurrents of the two systems indicates a good agreement ingeneral. Lower RINDAT CG+ peak currents (<30 kA) arefrequently registered as IC+ by LINET (∼40%) and strongerRINDAT CG- peak currents (>100 kA) are frequently reg-istered as IC- by LINET (∼40%). This finding can be com-pared with results from EULINOX in Germany where flashesregistered with a LPATS system (same technology as used forRINDAT) were compared with the French Office Nationald’Etudes et de Recherches Aerospatiales (ONERA) VHF in-terferometer measurements. Thery (2001) found that 61% ofthe positive LPATS flashes (those of low intensity) and 32%of the negative LPATS flashes were in fact IC flashes. A re-cent study by Pinto et al. (2007) also confirmed that a largepercentage of the positive CG flashes registered by RINDATover Brazil are in fact IC flashes. For the analysed dataset wefound that weak positive RINDAT peak currents (<10 kA)are occasionally (<10%) registered as negative strokes byLINET.
3.2 NOx in the anvil outflow derived from aircraft measure-ments
In HH07 it was briefly discussed whether the outflow altitudewhere LNOx maximises was reached with the Falcon aircraft(important question for comparison with results from otherfield campaigns and for further calculations in Sect. 4). Itwas concluded that this altitude was reached with certaintyon 18 February, but on 4 February the Falcon measured thelargest mixing ratios in the uppermost flight levels so thatlarger mixing ratios at higher altitudes inside the anvil cannotbe excluded. Therefore, for the latter day measurements fromthe high-flying Geophysica in the upper part of this thunder-storm were briefly analysed as discussed below.
The Falcon measurements in two of the anvils of 4 Febru-ary (anvil 1a and 5a, listed in Table 2a and described inSect. 4.1) can be compared with coincident measurementswith the high-flying Geophysica. The Geophysica pene-trated anvil 1a during ascent between 15.9 and 16.6 km (pen-etration at flight time: 67 070–67 298 s, at position: 21.3–21.5◦ S and 49.1–49.3◦ W) and anvil 5a during descent be-tween 17.2 and 16.5 km (penetration at flight time: 66 569–66 696 s, at position: 21.8–21.9◦ S and 48.5–48.7◦ W). Themean NO mixing ratios in anvil 1a and anvil 5a were 0.30and 0.35 nmol mol−1, respectively. The mean anvil-NO mix-ing ratio is the mean value of all NO 1s-values measured be-tween the entrance and exit of the anvil (determined fromthe distinct increase and decrease in the NO mixing ra-tio). The mean mixing ratios measured by the Geophys-ica between∼16–17 km altitudes are distinctly lower thanthe NO mixing ratios measured by the Falcon at lower alti-tudes (10.6–10.7 km): 0.80 and 1.16 nmol mol−1 in anvil 1aand anvil 5a, respectively. The Geophysica measurements in
Atmos. Chem. Phys., 8, 921–953, 2008 www.atmos-chem-phys.net/8/921/2008/

H. Huntrieser et al.: Lightning activity in Brazilian thunderstorms 927
Table 2a.Estimates of horizontal LNOx mass fluxFLNOx, LINET stroke rateRLINET , LNOx production rate per LINET stroke and per LISflashPLNOx, and global LNOx production rate per yearGLNOx.
Flight Entry and Exit Pressure Mean, |Va − Vs |1, ρa , kg 1x, 1z,km F2
LNOx, R3LINET , PLNOx, g(N) PLNOx, g(N) GLNOx,
and Anvil Time (UTC), s Altitude, χLNOx m s−1 m−3 km g(N) s−1 (LINET (LINET (LIS flash)−1 Tg(N) a−1
Penetration / km nmol strokes)s−1 stroke)−1
tropical (t) mol−1
or subtropical (s)
0402051a (t) 66 199–66 433 10.6 0.76 6.5 0.36 35 4 120 0.055 2205 1103 1.50402055a (t) 67 682–67 833 10.7 1.10 5.9 0.36 25 4 113 0.054 2082 1041 1.40402052b (t) 69 905–70 169 10.1 0.57 9.2 0.39 45 4 178 0.061 2914 1457 2.0
mean tropical4 2400 1200 1.6180205bI (s) 74 056–74 209 10.6 0.42 17.7 0.36 28 3 109 0.025 4258 2129 3.0180205bII (s) 74 453–74 623 10.7 0.18 20.0 0.36 33 3 62 0.025 2430 1215 1.7180205bIII (s) 75 013–75 186 10.1 0.65 12.2 0.39 32 3 143 0.025 5623 2811 3.9180205bIV (s) 75 601–75 761 10.1 0.21 20.0 0.39 30 3 71 0.025 2792 1396 1.9180205bV (s) 76 102–76 280 9.4 0.39 11.9 0.41 33 3 91 0.025 3568 1784 2.5180205bVI (s) 76 584–76 757 9.4 0.13 17.7 0.41 35 3 48 0.025 1876 938 1.3
mean subtropical4 4483 2241 3.1relative max. error ∼50% ∼50% ∼40% ∼50% ∼190% ∼90% ∼280% ∼310% ∼320%
1 Horizontal anvil outflow velocity, calculated from values in Table 2b.2 The horizontal LNOx mass flux out of the anvil, see Eq. (4).3 Only LINET strokes with peak currents≥10 kA were considered for an equivalent comparison between 040205 (strokes mainly inside theLINET centre) and 180205b (strokes along LINET periphery).4 The mean value for the tropical anvil penetrations 1a, 5a and 2b of 4 February 2005 is given. The mean value for the subtropical anvilpenetrations I, III, and V of 18 February 2005 (penetrations closest to the maximum anvil outflow) is given.
the anvils on 4 February indicate an increase in NO mixingratios with decreasing altitude, opposite to the Falcon mea-surements. Hence the outflow level where NO mixing ratiosmaximise was likely to be located between the altitudes atwhich the Falcon and Geophysica penetrated the anvils. COmeasurements from the Geophysica (personal communica-tion P. Mazzinghi, INOA/CNR) can be used to determine thisoutflow level more precisely (on the assumtion that LNOxmaximises where CO maximises). The vertical CO profile(ascent and descent in the vicinity of the selected anvils)shows enhanced mixing ratios mainly between∼10–14 kmaltitude. The mixing ratios were rather constant throughoutthis layer,∼130–140 nmol mol−1. The outflow level, wherethe CO mixing ratio maximises (132–138 nmol mol−1), waslocated between∼12.0–12.5 km, about 1.5–2 km above theFalcon penetration. At the levels where the Falcon pene-trated the anvils (10.6–10.7 km), however, the CO mixingratio (132 nmol mol−1) was similar to the lowest Geophys-ica CO mixing ratios in the outflow level. The Falcon datamay therefore underestimate the mean NO mixing ratios inthe selected anvils to a degree which cannot be quantifiedfrom the available dataset. These mean NO mixing ratios areneeded for further calculations in the next section. Prelimi-nary results from cloud-resolved modelling for the 4 Febru-ary thunderstorms by Pickering et al. (2007) suggest thatthe anvil outflow NO maximum is located between 12 and13 km, which supports our estimates derived from the verti-cal CO profile.
Table 2b. Measured wind velocity and direction in the anvil outflowand at the steering level1.
Flight and Measured Measured Wind WindAnvil Wind Wind Direction VelocityPenetration Direction Velocity in at Steering at
in Anvil Anvil Level1ds , ◦ SteeringOutflow Outflow Level1Vs ,da , ◦ Va , m s−1 m s−1
0402051a 71±31 5.2±1.7 160 3.90402055a 182±50 3.9±2.7 280 3.90402052b 107±23 6.9±2.0 350 3.7180205bI 283±12 16.6±4.1 185 4.3180205bII 277±4 19.4±2.3 185 4.3180205bIII 274±11 11.5±5.3 185 4.3180205bIV 279±5 19.2±1.3 185 4.3180205bV 268±10 11.6±5.7 185 4.3180205bVI 278±5 16.9±1.4 185 4.3
1 The wind at the steering level∼3 km (∼700 hPa) determines themean motion of a thunderstorm cell.
4 Estimate of the LNOx production rate per flash andper year
In this section the measurements in selected tropical and sub-tropical thunderstorms of 4 and 18 February 2005 are dis-cussed in more detail. The spatial and temporal distribu-tions of LINET strokes are presented (Sect. 4.1). The con-tribution from observed LINET strokes to measured anvil-NOx mass and the resulting LINET stroke rates are estimated(Sect. 4.2). Furthermore, the contribution of BL-NOx and
www.atmos-chem-phys.net/8/921/2008/ Atmos. Chem. Phys., 8, 921–953, 2008

928 H. Huntrieser et al.: Lightning activity in Brazilian thunderstorms
Method to estimate the global annual LNOx production based on field measurements
mean anvil-NOx
Falcon LINET strokes
mean BL-NOxsubtracted
mean χLNOx |Va-Vs| ρa
T, p
Δx, Δz
u, v
Radar
hor. LNOx mass flux F(LNOx) out of anvil
LNOx production rate per LINET stroke P(LNOx)LINET
LNOx production rate per LIS flash P(LNOx)LIS
global LNOx production rate per year G(LNOx)global LIS flash rate 44 s-1
LINET scaled with LIS
stroke rate in selected TS
strokes contributing to anvil-NOx
selected TS
FLEXPARTu, v
LIS
Geo-physica
Fig. 3. Flow chart showing the introduced method to estimate the annual global LNOx production rate from TROCCINOX field measure-ments (Falcon, Geophysica, LINET, Radar) combined with LIS data and model simulations (FLEXPART) of the selected thunderstorms (TS)all indicated with grey background. Different line colours are used to avoid misunderstanding of the flow direction at line intersections.
LNOx to measured anvil-NOx is estimated (Sect. 4.3). Thehorizontal LNOx mass flux rate out of the anvils is calculatedby means of estimated LNOx mixing ratios and horizontaloutflow wind velocities from the flights combined with thesize of the vertical cross-section of the anvils (Sect. 4.4).LNOx nitrogen mass flux rates (g s−1) and LINET strokerates (strokes s−1) are combined to estimate the productionrate of LNOx (in g of nitrogen mass or number of NOxmolecules) per LINET stroke and per LIS flash (Sect. 4.5).Finally, the annual global LNOx nitrogen mass productionrate is estimated (in Tg a−1). Figure 3 gives an overview ofthese different steps described in detail in the following sub-sections, starting with the selection of a thunderstorm (TS)and ending with an estimate of the annual global LNOx pro-duction rate G(LNOx).
4.1 Spatial and temporal LINET stroke distributions
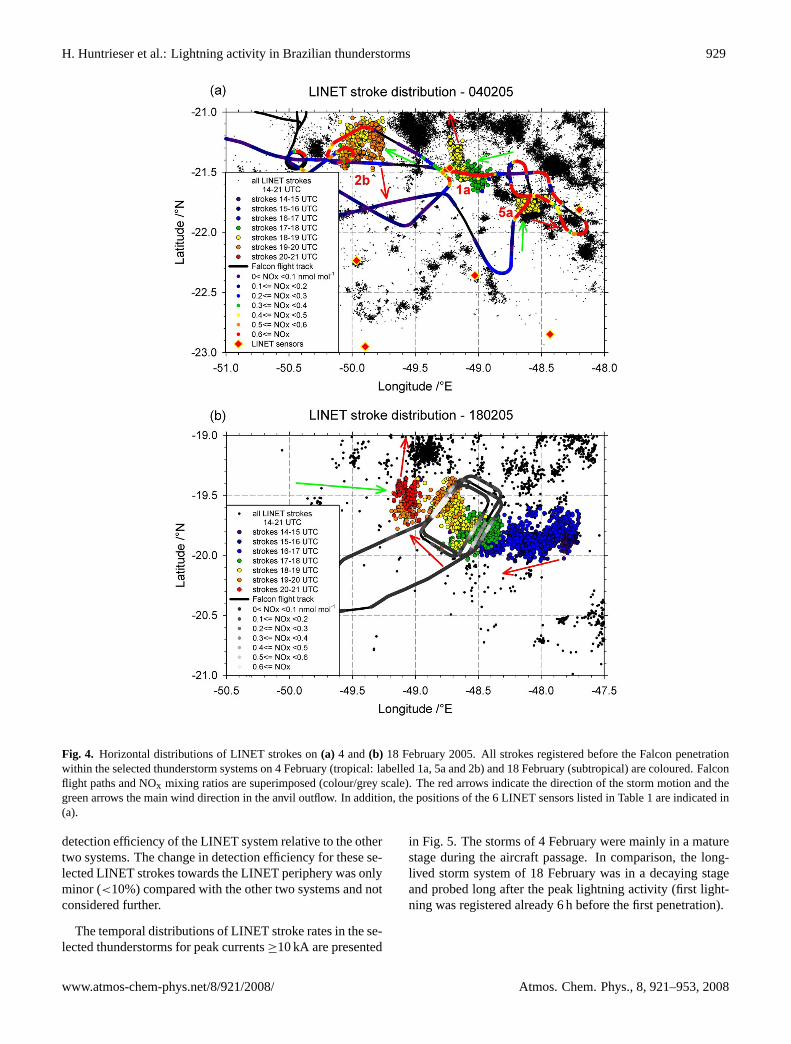
The spatial distributions of LINET strokes of 4 and 18 Febru-ary 2005 are shown in Fig. 4a and b, respectively. For theselected thunderstorms, strokes occurring before the penetra-tions by the Falcon are highlighted in colour. Superimposedis the Falcon track showing the successful, repeated penetra-tions of the subtropical thunderstorm system of 18 February,and the zigzag pattern between the tropical thunderstorms(labelled 1a, 5a and 2b) of 4 February. The time periodsof the anvil penetrations are listed in Table 2a. The direction
of the thunderstorm movement (red arrows in Fig. 4) is in-ferred from lightning data. The main wind direction in theanvil outflow (green arrows), as inferred from Falcon windmeasurements, controls the transport of LNOx out of theanvils. On 4 February the prevailing wind direction in theflight level (influenced by the Bolivian High, see Fig. 5c inHH07) varied between north-east and south-east in vicinityof anvil 1a and 2b, and was from the south-west in the vicin-ity of anvil 5a. The NOx mixing ratio along the flight trackis also superimposed in Fig. 4. Elevated mixing ratios ex-ceeding 0.6 nmol mol−1 NOx were frequently measured inthe anvil outflow downwind of nearby lightning strokes.
The selected thunderstorms of 4 and 18 February occurredin the centre and at the northern border line of the LINETnetwork, respectively. Because of a higher sensitivity inthe network centre, the fraction of strokes with low currents(<10 kA) was much higher on 4 February (87%) than on 18February (45%). For the latter thunderstorm system no sep-aration between IC and CG strokes was possible because ofthe large distance from the centre. For an adequate compar-ison of the stroke rates in these storms, it was necessary torestrict comparisons to higher stroke peak currents (≥10 kA)which were observed with about the same detection effi-ciency, independently of their location within the LINET net-work. On 4 February strokes were widespread with some atthe LINET periphery. LINET strokes were therefore com-pared with LIS flashes and RINDAT strokes to determine the
Atmos. Chem. Phys., 8, 921–953, 2008 www.atmos-chem-phys.net/8/921/2008/
H. Huntrieser et al.: Lightning activity in Brazilian thunderstorms 929
Fig. 4. Horizontal distributions of LINET strokes on(a) 4 and(b) 18 February 2005. All strokes registered before the Falcon penetrationwithin the selected thunderstorm systems on 4 February (tropical: labelled 1a, 5a and 2b) and 18 February (subtropical) are coloured. Falconflight paths and NOx mixing ratios are superimposed (colour/grey scale). The red arrows indicate the direction of the storm motion and thegreen arrows the main wind direction in the anvil outflow. In addition, the positions of the 6 LINET sensors listed in Table 1 are indicated in(a).
detection efficiency of the LINET system relative to the othertwo systems. The change in detection efficiency for these se-lected LINET strokes towards the LINET periphery was onlyminor (<10%) compared with the other two systems and notconsidered further.
The temporal distributions of LINET stroke rates in the se-lected thunderstorms for peak currents≥10 kA are presented
in Fig. 5. The storms of 4 February were mainly in a maturestage during the aircraft passage. In comparison, the long-lived storm system of 18 February was in a decaying stageand probed long after the peak lightning activity (first light-ning was registered already 6 h before the first penetration).
www.atmos-chem-phys.net/8/921/2008/ Atmos. Chem. Phys., 8, 921–953, 2008

930 H. Huntrieser et al.: Lightning activity in Brazilian thunderstorms
LINET stroke distributions
UTC14 15 16 17 18 19 20 21
num
ber o
f LIN
ET
stro
kes
(5 m
in.)-1
0
20
40
60
80
100180205: anvil I-VI040205: anvil 1a040205: anvil 2b040205: anvil 5a
I-VI1a 2b5a
Fig. 5. Time series of LINET stroke rates for the selected thun-derstorms (only strokes with peak currents≥10 kA considered).On 4 February 2005, stroke rates in the investigated thunderstorms(active) are shown from storm initiation until penetration (tropi-cal: labelled 1a, 5a and 2b). On 18 February 2005, the strokerate within the selected thunderstorm system (subtropical) is shownfrom storm initiation until decay. The repeated penetration startedfirst at 20:34 UTC (labelled I-VI) when the lightning activity de-cayed.
4.2 Contribution of LNOx to anvil-NOx and determiningLINET stroke rates
For evaluation of the LNOx production rate per stroke, itis necessary to estimate which of the LINET strokes duringthe storm lifetime contributed to the measured anvil-NOx en-hancement and its horizontal and vertical extension. Thisis a very difficult task which might be best performed byusing cloud-scale modelling. First cloud-resolving modelsimulations have been performed for selected TROCCINOXstorms of 4 February 2005 by Chaboureau et al. (2007) andby Pickering et al. (2007) but cloud-resolving simulations arepresently not available for the thunderstorm system of 18February 2005. Instead we make use of FLEXPART light-ning tracer simulations, as explained in Sect. 2.3. The simu-lations follow lightning tracers from the horizontal LINETstroke distributions (Fig. 4b) using ECMWF wind fields.For the long-lived thunderstorm case of 18 February, am-bient wind velocities were strong and LNOx was advectedfar downwind. The ECMWF wind agrees well with Falconmeasurements of wind velocity and direction, except in thecore of the anvil penetrations (Fig. 6). As shown later in thissection, comparison of the ECMWF wind fields and FLEX-PART results with radar and airborne wind and anvil-NOxobservations, as indicated in Fig. 3, supports the validity ofthe FLEXPART simulations of the 18 February thunderstormsystem, in spite of the coarse horizontal resolution (0.5◦) ofthe ECMWF wind velocity fields used.
For the thunderstorm system of 18 February, a time se-quence of FLEXPART lightning tracer simulations (Fig. 7)indicates a rather fast development of an elongated area withenhanced LNOx downwind of the storm system, followingthe wind in the upper troposphere (UT). Tracer distributionsfor six different simulations are shown in this figure (out-put resolution: 30 min and 0.08 degrees, horizontal cross-sections at 10 km altitude corresponding to the flight level)considering transport of emissions from strokes in varioustime intervals. The simulated tracer distributions may becompared with the anvil-NOx observations from the Falcon(Fig. 4b). Only the last four simulations (Fig. 7c–f) indicatedistinctly enhanced LNOx along the right hand side anviltransect, as observed by the Falcon. Furthermore, mixingratios in the left hand side transects, closer to the core, weretwice as high as in the right hand side transects. Given themeasured UT wind velocity of 15 to 20 m s−1, it is clear thatstrokes that occurred between 19:00–19:30 UTC (along theleft hand side anvil transect, 49.7–49.8◦ W) or earlier do notcontribute to the anvil-NOx enhancement observed along theright hand side anvil transect. The air with enhanced LNOxis advected further downwind to the right in Fig. 7d–f. Onlystrokes after 19:30 and before 20:55 UTC (when the stormdecayed) (Fig. 7c) were therefore considered to have con-tributed to the observed anvil-NOx. During this 85 min pe-riod about 130 strokes with peak currents≥10 kA were de-tected, corresponding to a stroke rate of 0.025 strokes s−1
(Table 2a).For the 18 February 2005 thunderstorm system, the hor-
izontal extension (1x) of FLEXPART lightning tracer inFig. 7c, perpendicular to the wind direction (see Fig. 4b), wasestimated to be∼30–35 km. This width agrees well with theextension of the flight path segment with enhanced NOx ob-served during the single anvil transects (28–35 km); see thegrey scale along the flight track in Fig. 4b and Table 2. Thisparameter (1x) will be used to estimate the horizontal LNOxmass flux out of the anvil in Sect. 4.4.
Finally, a radar image of the 18 February thunderstormsystem (Bauru radar, elevation angle 0◦), indicates a pro-nounced, elongated structure of the storm system (Fig. 8),similar to the FLEXPART result at 10 km altitude. The 18February thunderstorm system is located in the upper, north-ern domain of the radar range, about 240 km from the radarsite. Unfortunately, the radar information is sparse in this re-gion and no more detailed data are available since the domainis out of the quantification range where volumetric data arecollected.
For the thunderstorms of 4 February, no FLEXPART simu-lations were performed since the storms just developed aboutone hour before the penetrations and this time was consid-ered too short for realistic simulations. In addition, the am-bient UT wind velocities were low (4–7 m s−1) and LNOxremained in the vicinity of the storms. Instead, as indicatedin Fig. 3, the LNOx production rate per stroke and the width1x were estimated from a combination of horizontal LINET
Atmos. Chem. Phys., 8, 921–953, 2008 www.atmos-chem-phys.net/8/921/2008/

H. Huntrieser et al.: Lightning activity in Brazilian thunderstorms 931
Fig. 6. Comparison between Falcon and ECMWF wind velocity (in black and blue, respectively) and wind direction (in red and orange,respectively) for the flight on 18 February 2005.
stroke distributions, radar images, Falcon wind and anvil-NOx observations. The average altitude (arithmetical mean)of all IC strokes (Table 4a) in anvil 1a (10.0 km) and anvil 5a(11.6 km) was below or just above the flight level (10.6 kmand 10.7 km, respectively; see Table 2a), indicating that themajority of LNOx, produced by the observed strokes left theanvil at about the flight level.
It is assumed that all LINET strokes observed in thevicinity of these storms between storm initiation and Fal-con penetration (coloured in Fig. 4a) contributed to the ob-served anvil-NOx (Fig. 4a). (This is a working hypothesiswith large uncertainties, which cannot be quantified with-out cloud-model simulations.) For comparison with the 18February case, only the number of strokes with peak cur-rents≥10 kA is counted. In anvil 1a about 278 strokes wereregistered between 16:55 and 18:20 UTC, in anvil 5a about130 strokes were registered between 18:05 and 18:45 UTCand in anvil 2b about 311 strokes were registered between17:55 and 19:20 UTC; see Fig. 5, which corresponds to thefollowing stroke rates: 0.055, 0.054 and 0.061 strokes s−1,respectively (see Table 2a).
For each of the three anvil penetrations, the width (1x) ofthe LNOx plume perpendicular to the wind direction was es-timated from the horizontal LINET stroke distribution, fromthe anvil-NOx observations (Fig. 4a) and from the radar im-ages at the time of the penetrations (shown only hourly inFig. 9). The1x values are∼35, ∼25 and∼45 km foranvils 1a, 5a and 2b, respectively (see Table 2a).
4.3 Contribution of BL-NOx to anvil-NOx
The boundary layer (BL) contribution (χBL−NOx) to the NOxmixing ratio in the anvil (χAnvil−NOx) is derived from the cor-relation between NOx and CO mixing ratios in the BL and inthe anvil. It is assumed, that BL air is transported upwardsrapidly within strong, well-developed updrafts with little am-bient mixing and without chemical loss of NOx and CO.Hence, about the same CO mixing ratio is observed in the
main anvil outflow (χAnvil−CO) as in the BL layer (χBL−CO):
χAnvil−CO = χBL−CO (1)
and LNOx (χLNOx) is the difference between anvil-NOx andBL-NOx :
χLNOx = χAnvil−NOx − χBL−NOx (2)
These assumptions are supported by cloud-model simula-tions (Pickering et al., 1992; Thompson et al., 1997; Ott etal., 2007) and airborne thunderstorm observations (Dicker-son et al., 1987; Hauf et al., 1995; Huntrieser et al., 1998,2002; Holler et al., 1999; Lopez et al., 2006; Bertram et al.,2007; Koike et al., 2007). The ratio of NOx to CO in the BL(<2 km) is conserved during the rapid upward transport intothe anvil:
χBL−NOx/χBL−CO = (χAnvil−NOx − χLNOx)/χAnvil−CO (3)
Vertical NOx, CO, and O3-profiles from the 18 Februaryflight are shown in Fig. 10a. The CO mixing ratios, mea-sured during the anvil penetrations, are in a similar range asthose measured at∼2 km altitude (see red box), supportingthe assumption of rapid upward transport from the top of theBL into the anvils. Unfortunately, no NOx measurements areavailable below 3 km for this flight. Instead, NOx measure-ments in the BL were only available for ten TROCCINOX“fair weather” flights without active thunderstorms (Fig. 1ain HH07). NOx and CO data from all available flights inthe BL (<2 km) were therefore used to estimate the averageBL NOx-CO correlation. It can be justified that this rela-tionship is representative, since CO mixing ratios in the BLwere in the same range both for “thunderstorm” and for “fairweather” flights. The BL data were sampled mainly duringtake-off and landing near the campaign base. Hence, it wasassumed that these values are representative for the entire BLcovered by the selected flights.
In Fig. 10b the correlation between measured NOx andCO for the Falcon flight of 18 February is shown (blackdots). Different types of air mass origin (Pacific, Amazonbasin, anvil and background), as discussed in HH07, are
www.atmos-chem-phys.net/8/921/2008/ Atmos. Chem. Phys., 8, 921–953, 2008

932 H. Huntrieser et al.: Lightning activity in Brazilian thunderstorms
a)
b)
c)
d)
e)
f)
20:30-21:00
20:00-21:00
19:30-21:00
19:00-21:00
18:30-21:00
18:00-21:00
pmol mol-1
Fig. 7. FLEXPART lightning tracer simulations (NOx at 10 km in pmol mol−1) for the 18 February 2005 subtropical thunderstorm systemconsidering all LINET strokes (black dots) after(a)20:30 UTC,(b) 20:00 UTC,(c)19:30 UTC,(d) 19:00 UTC,(e)18:30 UTC,(f) 18:00 UTCand until 21:00 UTC. The Falcon track is superimposed in red.
marked. The measured NOx mixing ratios were mainly be-low 0.2 nmol mol−1, except during the anvil penetrations.The average NOx-CO correlation in the BL for all TROC-CINOX flights (data from Fig. 1 in HH07) is also shown inFig. 10b (red-yellow dots). Average CO mixing ratios dur-ing the anvil penetrations of the 18 and 4 February flightswere 95–105 and 105–115 nmol mol−1, respectively. Fromthe measured BL-CO (90–120 nmol mol−1) and the correla-tion, the average BL-NOx mixing ratio and its standard de-viation (std) were estimated to be 0.11±0.07 nmol mol−1.For the anvil penetrations of 4 and 18 February listed inTable 2a, average LNOx volume mixing ratios (χLNOx)
were determined by subtraction of the mean BL-NOx con-tribution (0.11 nmol mol−1) from the mean anvil-NOx val-ues. The mean values for anvil-NOx range between 0.2–0.8 nmol mol−1 in the subtropical thunderstorm of 18 Febru-ary and between 0.7–1.2 nmol mol−1 in the tropical thun-derstorms of 4 February (Table 2a in HH07). As a result,χLNOx values in the range from 0.1 to 1.1 nmol mol−1 wereobtained, as listed in Table 2a in the present paper.
Overall, the contribution of BL-NOx to anvil-NOx in theselected thunderstorms of 4 February (anvil 1a, 5a, and 2b)and 18 February (only anvil penetrations I, III and V clos-est to the core considered here) was∼10–20%. This range
Atmos. Chem. Phys., 8, 921–953, 2008 www.atmos-chem-phys.net/8/921/2008/

H. Huntrieser et al.: Lightning activity in Brazilian thunderstorms 933
a) b)
c) d)
19.0°S
20.0°S
49.5°W 48.0°W
18:00 UTC 19:00 UTC
20:00 UTC
21:00 UTC
21:00 UTC
Fig. 8. Radar reflectivity as PPI scan (PPISURVEILLANCE operational product) in dBZ units measured at 0.0◦ elevation by the Baururadar (22.4◦ S, 49.0◦ W) for the 18 February 2005 subtropical thunderstorm system (marked in red) at(a) 18:00 UTC,(b) 19:00 UTC,(c)20:00 UTC and(d) 21:00 UTC.
is slightly lower than the average found in European thun-derstorms with 25 to 40% (Huntrieser et al., 1998, 2002).In the investigated TROCCINOX thunderstorms, the contri-bution from LNOx clearly dominated the anvil-NOx budgetwith ∼80–90%. This contribution is higher than observedduring the TRACE-A experiment at the end of the dry (burn-ing) season, where only 30–40% of anvil-NOx was attributedto LNOx (Pickering et al., 1996).
4.4 Estimate of the horizontal LNOx mass flux
Cloud-model simulations indicate that most LNOx producedin a thunderstorm is transported into the anvil (Skamarock etal., 2003). If the total LNOx mass in the anvil region (depen-dent on the LNOx mixing ratio and the volume covered bythis LNOx) and the total number of flashes in the thunder-storm that contributed to this LNOx were known, the LNOxproduction rate per flash could be estimated, assuming a con-stant LNOx production per flash. Up to now, however, nomethod exists which can determine the required parametersexactly. Model approaches have e.g. estimated the horizontalNOx flux out of the anvil through a vertical control surface(Skamarock et al., 2003; Barthe et al., 2007). A combinationof in situ aircraft observations and cloud-model simulationswas used to separate the outflow flux into a LNOx flux andan environmental NOx flux. This approach was originally
introduced by Chameides et al. (1987) for airborne measure-ments in thunderstorms during GTE/CITE and has also beenapplied by us for measurements in LINOX and EULINOXthunderstorms (Huntrieser et al., 1998, 2002). Alternatively,the NO content in the thunderstorm is estimated from theproduct of airborne in situ measurements of NO at certainlevels in the anvil and the estimated volume of the appro-priate cloud segments (Ridley et al., 2004). The total vol-ume is derived from the sum of the vertically staggered flightsegments. The two methods are described in more detail inSH07.
The TROCCINOX thunderstorm penetrations listed in Ta-ble 2a provide only snapshots of the conditions at a certainlevel of the cloud at a certain time. It is not known how rep-resentative these anvil penetrations are for the average anvilconditions (see also discussion in Sect. 3.2). These are, how-ever, the only measurements that are available. Time se-ries of trace gas measurements (NOx, CO, and O3) duringthe penetrations listed in Table 2a have already been pre-sented and discussed in HH07. On the 18 February flight,the anvil outflow from the selected thunderstorm system wassuccessfully penetrated 6 times (Fig. 4b). In addition to thementioned trace gases, NOy was measured and mixing ratiosduring the 6 penetrations are shown together with the ver-tical velocity (absolute values) in Fig. 11. The 1 s absolute
www.atmos-chem-phys.net/8/921/2008/ Atmos. Chem. Phys., 8, 921–953, 2008

934 H. Huntrieser et al.: Lightning activity in Brazilian thunderstorms
**
(b)
(a)
48.0°W50.0°W
20.0°S
22.0°S
**
Fig. 9. Vertical maximum of the radar reflectivity (max CAPPIframe, unit dBZ). Composite from the Bauru (22.4◦ S, 49.0◦ W) andPresidente Prudente (22.1◦ S, 51.4◦ W) radars for the 4 February2005 thunderstorms at(a) 17:59:47 UTC, and(b) 19:00:14 UTC.Selected thunderstorms are marked (tropical: yellow circle anvil 1a,white circle anvil 5a and red circle anvil 2b). The change in loca-tion of each of these circles between (a) and (b) indicates the stormmotion, which can be compared with the storm motion indicated byarrows in Fig. 4a. The Bauru and Presidente Prudente radar sitesare indicated with a yellow and white *, respectively. The left andupper axes give the distance in km, and the latitude and longitudeare indicated in (a). (TITAN Software, installed at IPMet in collab-oration with NCAR.)
velocity values mainly varied between 0.1 and 1.0 m s−1 in-dicating that the measurements were carried out outside thecore region of the thunderstorm cell, where far higher verti-cal velocities are to be expected. The highest NOy mixingratios were measured during the anvil penetrations with thestrongest vertical velocities, which is closer to the core re-gion (∼10–30 km) where most lightning occurs (penetrationI, III and V). The closest penetration to the maximum anviloutflow level was penetration III, where the mean updraft ve-locity (0.8 m s−1) was distinctly higher than the mean down-draft velocity (0.2 m s−1), and the highest mean NOy mixingratio (1.1 nmol mol−1) was measured. About 30 km fartherdownwind (penetration II, IV, VI), the measurements indi-cate that a large part of the outflow already mixed with theambient air (similar mean updraft and downdraft velocities).
Moreover, on 4 February the selected thunderstorms werepenetrated only once, but rather close to the core. Hence,too few repeated anvil penetrations and limited radar reflec-tivity data are available to apply the method introduced by
TROCCINOX - F#11 180205b
CO /nmol mol-1
40 60 80 100 120
pres
sure
alti
tude
/m0
2000
4000
6000
8000
10000
12000
O3 /nmol mol-1
10 20 30 40 50 60 70 80 90
NOx /nmol mol-10.0 0.1 0.2 0.3 0.4
COO3
NOx
(a)
TROCCINOX - F#11 F180205b
CO /nmol mol-140 60 80 100 120 140
NO
x /nm
ol m
ol-1
0.01
0.1
1
180205ball TROCCINOX Falcon-flights<2 km altitude anvil
Amazon basin
Pacific
background
(b)
Fig. 10. (a)Vertical profiles for CO, O3, and NOx mixing ratiosfrom the Falcon flight on 18 February 2005. The red box at 2 kmaltitude indicates the top of the mixed layer.(b) Correlation plotfor NOx and CO for the same flight (black dots), and superimposeddata from all TROCCINOX Falcon-flights in the boundary layer(<2 km) (red-yellow dots).
Ridley et al. (2004). We therefore use a modified version ofthe method introduced by Chameides et al. (1987) and as-sume that the measurements during each anvil penetration(snapshots) are representative average anvil conditions. Weconsider the horizontal mass flux of LNOx through a ver-tical control surface. The vertical surface dimensions can
Atmos. Chem. Phys., 8, 921–953, 2008 www.atmos-chem-phys.net/8/921/2008/

H. Huntrieser et al.: Lightning activity in Brazilian thunderstorms 935
be estimated from the combination of e.g. airborne measure-ments and FLEXPART simulations as explained before inSect. 4.2 and as indicated in Fig. 3. Repeated penetrationsof the 18 February thunderstorm system indicated that1zwas >1.3 km (10.7–9.4 km, Table 2a). The entire verticalextent of the anvil outflow can be most clearly seen in ver-tical profiles of the CO mixing ratio measured by the high-flying Geophysica (personal communication, P. Mazzinghi,INOA/CNR). On 18 February the most distinct enhancementin the CO mixing ratio was observed between∼9–12 kmaltitudes and1z was set to∼3 km (see Table 2a). On 4February the enhancement in CO was less clear owing toelevated background mixing ratios: enhanced mixing ratioswere mainly observed between∼10–14 km altitudes and1zwas set to∼4 km (see Table 2a).
The horizontal LNOx mass fluxFLNOx (in nitrogen massper time, g s−1) was calculated for each thunderstorm pene-tration listed in Table 2a according to:
FLNOx = χLNOx ·MN
Mair· ρa(Va − Vs) · 1x · 1z (4)
whereχLNOx is the mean NOx volume mixing ratio producedby lightning (mol mol−1), MN andMair are the molar massesof nitrogen (14 g mole−1) and air (29 g mole−1), respectively,ρa is the air density (g m−3) calculated from measured tem-perature and pressure in the anvil, andVa − Vs is the differ-ence between the wind vectors in the anvil outflow and at thesteering level (see Table 2b). The last term1x·1z is the area(m2) of the vertical cross-section perpendicular to the winddirection in the anvil outflow. In general, the wind at thesteering level (∼700 hPa) determines the mean motion of athunderstorm cell (e.g. Keenan and Carbone, 1992), but thisparameter is not available from the airborne measurements.Instead, horizontal LINET stroke distributions, as shown inFig. 4, were plotted with a higher temporal resolution (10min) and the storm motion (Vs) was determined from thetemporal stroke evolution. The parameters in Eq. 4, except1x (Sect. 4.2) and1z, were calculated directly from Falconmeasurements by averaging the measured data over the timeperiod when the thundercloud was penetrated (between entryand exit of anvil), see Table 2a.
FLNOx values were calculated for the selected thunder-storms by insertion of the parameters listed in Table 2a intoEq. 4, which give nitrogen mass flux values between 48 and178 g s−1 (Table 2a). The flux values for subtropical thun-derstorms (only anvil I, II, and V considered) and tropicalthunderstorms are within a similar range. The flux values inTable 2a can be divided by the molar mass for nitrogen andthe area of the vertical cross-section (1x·1z) to estimate theflux in the unit mol m−2 s−1. The range of these fluxes, 3.3–7.1×10⁻⁸ mol m−2 s−1, is well comparable to nitrogen massflux values simulated by Barth et al. (2007) who ran differentcloud-scale models (range 2.7–13.0×10⁻⁸ mol m−2 s−1) andto Barthe et al. (2007), who simulated 6×10⁻⁸ mol m−2 s−1
on average in the anvil outflow of a STERAO storm.
elapsed UTC time in seconds since midnight73000 74000 75000 76000 77000 78000
verti
cal v
eloc
ity /m
s-1
0.01
0.1
1
NO
y m
ixin
g ra
tio /n
mol
mol
-1
0.01
0.1
1
|wpos||wneg|NOy
|wpos| mean|wneg| mean
TROCCINOX - F#11 180205b
I II III IV V VI
Fig. 11. Time series of NOy mixing ratio and absolute vertical ve-locity for the Falcon flight on 18 February 2005. The anvil penetra-tions are labelled I–VI.
The parameters listed in Table 2a have large uncertainties.The relative maximal error of theFLNOx estimate was there-fore calculated. The uncertainty forχLNOx is given by thestandard deviation (on average∼50% of the mean value);for Va−Vs the standard deviations listed in Table 2b indicatean uncertainty of up to∼50%; for 1x the uncertainty was∼5–10 km corresponding to∼40%; and for1z the verticalanvil extension on 4 February varied between 3.5–6 km andon 18 February between 2–4 km indicating an uncertainty upto ∼50%. Summing up these uncertainties, the relative max-imal error of theFLNOx estimate is∼190%.
4.5 Estimate of the LNOx production rate per stroke andper year
For the estimate of the LNOx production ratePLNOx (nitro-gen mass per stroke, in g stroke−1), the horizontal LNOxmass fluxFLNOx (g s−1) is divided by the LINET stroke rateRLINET (strokes s−1):
PLNOx =FLNOx
RLINET(5)
PLNOx estimates for the selected anvil penetrations resultedin values between 1.9 and 5.6 kg stroke−1, see Table 2a. Un-fortunately, the dataset in Table 2a is very sparse. Never-theless, meanPLNOx values for three tropical and one sub-tropical thunderstorms (only anvil penetrations I, III and Vconsidered) are estimated to 2.4 and 4.5 kg stroke−1, re-spectively, which corresponds to 4.8×1025 and 9.0×1025
molecules NO stroke−1. These results suggest that a sub-tropical thunderstorm may produce more LNOx per LINETstroke than a tropical thunderstorm (factor∼2). Possible rea-sons for this difference will be discussed in Sects. 5 and 6.
www.atmos-chem-phys.net/8/921/2008/ Atmos. Chem. Phys., 8, 921–953, 2008

936 H. Huntrieser et al.: Lightning activity in Brazilian thunderstorms
LIS flash
all LINET strokes
Bauru Radar
LINET 10 kA�
Fig. 12. Vertical maximum of the radar reflectivity (max CAPPI frame, unit dBZ) on 4 February 2005 at 21:30 UTC measured by the Bauru(22.4◦ S, 49.0◦ W) and Presidente Prudente (22.1◦ S, 51.4◦ W) radars. Superimposed are the horizontal distributions of LIS flashes (in red)and LINET strokes (black and yellow) for the time period 21:23:45 UTC–21:25:21 UTC.
For comparison with other published results, thePLNOxestimates per LINET stroke were scaled toPLNOx estimatesper LIS flash. During the TROCCINOX field period from 21January to 27 February 2005, only one overpass of 4 Febru-ary at 21:23:45–21:25:21 UTC provided a sufficient large setof coincident LINET and LIS measurements. On this day,lightning activity in the LINET centre area (21.5–22.5◦ S and48.5–49.5◦ W) and close-by (covering totally 20.0–23.0◦ Sand 48.5–50.5◦ W) was suitable for comparison. Overall82 LIS flashes and 481 LINET strokes were registered inthe studied area during the∼90 s measurement. LINETstrokes with peak currents down to at least 4 kA (absolutevalue) were sensed by LIS. For the selected time period,Fig. 12 shows the horizontal distributions of all availableLINET strokes (black dots) and LIS flashes (red dots) forthe area where most lightning occurred (21.4–22.4◦ S and48.5–50.0◦ W) together with radar reflectivity (grey). ForthePLNOx estimate, only stronger LINET strokes with peakcurrents≥10 kA are considered (in total 41 strokes, yellowdots) as mentioned before in Sect. 4.1. The LIS detectionefficiency at night (0.93) was taken into account (21:23–21:25 UTC = 19:23–19:25 Brazilian Summer Time). Thisimplies a LINET/LIS ratio of about (41/82)×0.93=0.5, con-sidering only LINET strokes with peak currents≥10 kA.
By means of this ratio, the mean values forPLNOx per LISflash for tropical and subtropical thunderstorms (only anvilpenetrations I, III, and V considered) are 1.2 and 2.2 (range0.9–2.8) kg, respectively, corresponding to 2.4 and 4.5 (range1.9–5.6)×1025 molecules NO. These estimates for TROC-
CINOX are well within the range of more recent estimates.From a review of previous investigations, SH07 derive a best-estimate of 3.5 (range 0.5–10) kg of nitrogen per flash.
The estimates forPLNOx per LIS flash were multi-plied with the number of LIS flashes occurring globally,44 flashes s−1. If the selected tropical and subtropical TROC-CINOX thunderstorms were representative for the globe, theimplied mean annual global LNOx production rateGLNOxwould be∼1.6 and 3.1 Tg a−1, respectively (factor∼2 differ-ence). These values are close to previous best estimates formid-latitude thunderstorms, see introduction. The individualestimates for the single thunderstorm penetrations listed inTable 2a, however, range from 1.3 to 3.9 Tg a−1, indicatinga wide range of values and large uncertainties depending onwhere (horizontally and vertically) the anvil was penetrated.
Finally, the relative maximal errors of thePLNOx andGLNOx estimates (Table 2a) were calculated. The uncertaintyfor RLINET was estimated from the standard deviations of thetime series of the LINET stroke rates (Fig. 5). The standarddeviations varied between 50–90% of the mean values. Fromthe estimates forFLNOx ∼190% andRLINET ∼90%, the rel-ative maximal error of thePLNOx estimate for LINET strokeswas∼280%. For thePLNOx estimate for LIS flashes, it wasassumed that the uncertainty in the conversion of LINETstrokes (≥10 kA) to LIS flashes was∼30% (depending onwhich LIS detection efficiency was used: day or night). Thisgives a relative maximal error of∼310%. For theGLNOx es-timate, the uncertainty in the global LIS flash rate was givenwith ∼10%, which gives a final relative maximal error of
Atmos. Chem. Phys., 8, 921–953, 2008 www.atmos-chem-phys.net/8/921/2008/

H. Huntrieser et al.: Lightning activity in Brazilian thunderstorms 937
040205_anvil 1a
0 20 40 60 80
num
ber o
f LIN
ET
stro
kes
(kA
)-1
tota
l NO
pro
d. /k
gN (k
A)-1
1
10
100
1000
0
10
20
30
40
50
60number of strokestotal LNOx massLNOx mass per stroke
(a)
CLINET = 30 km
040205_anvil 5a
0 20 40 60 80
num
ber o
f LIN
ET
stro
kes
(kA
)-1
tota
l NO
pro
d. /k
gN (k
A)-1
1
10
100
1000
0
10
20
30
40
50
60(b)
CLINET = 25 km
040205_anvil 2b
peak current /kA0 20 40 60 80
num
ber o
f LIN
ET
stro
kes
(kA
)-1
tota
l NO
pro
d. /k
gN (k
A)-1
1
10
100
1000
0
10
20
30
40
50
60(c)
180205b_anvil III
0 20 40 60 801
10
100
1000
NO
pro
d. /k
gN s
troke
-1
0
10
20
30
40
50
60
(d)
040205_LINET centre (00-24 UTC)
0 20 40 60 80 1001
10
100
1000
10000
NO
pro
d. /k
gN s
troke
-1
0
20
40
60
80
180205b_anvil I-VI (14-21 UTC)
peak current /kA0 20 40 60 80 100
1
10
100
1000
10000
NO
pro
d. /k
gN s
troke
-1
0
20
40
60
80
(e)
(f)
CLINET = 41 km
CLINET = 126 km
CLINET = 44 km
CLINET = 160 km
Fig. 13. Frequency distribution of LINET strokes (vertical grey bars) as a function of peak current for the selected tropical and subtropicalthunderstorm systems on 4 and 18 February 2005, respectively (see Table 3). Superimposed is the laboratory result by Wang et al. (1998)modified for LINET strokes (blue dashed line) according to Table 3 (CLINET ) and the estimated total amount of LNOx mass produced per1 kA LINET stroke interval for the selected thunderstorm systems (red line), see mass estimates in Table 3.
∼320%. Given this relative maximum error, the final rangefor the GLNOx values listed in Table 2a is between 0.4 and12 Tg a−1. This range is comparable to other ranges givenfor GLNOx in previous publications (see Sect. 1 and SH07).
5 Possible explanations for different LNOx productionrates in tropical, subtropical and mid-latitude thun-derstorms
The results in the previous section lead us to hypothesise thattropical thunderstorms over Brazil may produce less LNOxper stroke than subtropical thunderstorms. In this section weinvestigate whether these differences in the LNOx productionrate may be related to differences in the stroke peak currents(Sect. 5.1), stroke lengths (Sect. 5.1) or stroke release heights
(Sect. 5.2) (relationships investigated by Wang et al., 1998,in the laboratory). Furthermore, mean stroke peak currentsobserved by LINET are compared for several tropical andmid-latitude thunderstorms and for one subtropical thunder-storm (Sects. 5.3–5.4).
5.1 LNOx production rate as a function of stroke peak cur-rent
In this subsection we combine the result of laboratory mea-surements by Wang et al. (1998) with our field measurementsto determine the LNOx production rate as a function of peakcurrent. Wang et al. (1998) determined the NO productionrate per unit laboratory spark, whereas our analysis providesthe NO production rate per LINET stroke in the field. We as-sume that both follow the same dependency on peak current
www.atmos-chem-phys.net/8/921/2008/ Atmos. Chem. Phys., 8, 921–953, 2008

938 H. Huntrieser et al.: Lightning activity in Brazilian thunderstorms
Table 3. Lightning-produced NO mass per LINET strokePLNOx, for tropical and subtropical thunderstorms considering different strokepeak currents.
Flight and Anvil Registered/ Duration, Number RLINET , F(LNOx)3, Integral4, CLINET5, m Total PLNOx
7, S,g(N) Pressure,Penetration/ Considered of Stroke of LINET (LINET g(N) s−1 strokes s−1 laboratory Nitrogen g(N) (kA)−1 hPatropical (t) or Stroke Peak Activity2, Strokes2 strokes) ×10−3g m−1 spark Mass (LINET (×103
subtropical (s) Currents1, min s−1 laboratory stroke−1 Produced6, stroke)−1 laboratorykA spark ×103g spark)−1
0402051a (t) ≥ 2 85 1287 0.252 120 4.04 29732 613 476 2.0 2400402055a (t) ≥2 40 400 0.167 113 4.52 24 946 271 677 2.3 2350402052b (t) ≥2 85 1492 0.293 178 4.31 41 239 906 607 1.8 260180205bIII (s) ≥ 6 85 236 0.046 143 1.13 126 393 731 3097 1.9 2600402051a (t) ≥ 10 85 278 0.055 120 2.71 44 390 613 2205 2.8 2400402055a (t) ≥ 10 40 130 0.054 113 3.72 30 285 271 2082 2.6 2350402052b (t) ≥ 10 85 311 0.061 178 2.48 71 516 906 2914 2.1 260180205bIII (s) ≥ 10 85 130 0.025 143 0.89 160 324 731 5623 2.1 260
1 On 4 February 2005 strokes with peak currents down to 2 kA were registered (mainly within the LINET centre). On 18 February 2005only strokes with peak currents≥6 kA were registered (mainly along the LINET periphery). Thus, on 18 February the detection efficiencyfor low peak currents was lower than on 4 February and the stroke characteristics are not comparable (upper half of the table). For a moreequivalent comparison between the 4 and 18 February only strokes with peak currents≥10 kA were considered (lower half of the table).2 On 4 February 2005 the registered/considered strokes until penetration were active from 16:55 to 18:20 UTC within anvil 1a (85 min.),from 17:55 to 19:20 UTC within anvil 2b (85 min) and from 18:05 to 18:45 UTC within anvil 5a (40 min) On 18 February 2005 the regis-tered/considered strokes until storm decay were active between 19:30 and 20:55 UTC (85 min).3 The horizontal LNOx mass flux out of the anvil (see Eq. 4). Values from Table 2a are given.4 For every 1 kA, the total number of strokesNLINET , within the duration of the stroke activity, are summed up and divided by the durationof the stroke activity which givesRLINET(I ) (see Eq. 9).RLINET(I ) is then multiplied with the Wang et al. 1998 laboratory relationship
MNOlab(I ) (see below6 and Eq. 7) and summed up over all 1 kA intervals (part of Eq. 8 and Eq. 9):∞∫
I=1RLINET(I ) × MNOlab(I ) dI where
RLINET(I )=1t
t∫t=0
NLINET(I, t) dt
5 Conversion of the Wang et al. 1998 laboratory relationship to LINET strokes (see Eq. 8):
CLINET = FLNOx/∞∫
I=1RLINET(I ) × MNOlab(I ) dI
6 The total nitrogen mass produced by the thunderstorm within the duration of the stroke activity. For every 1 kA interval and the duration ofthe stroke activity,MNOlab(I ) (Eq. 7) modified for LINET (Eq. 10) is multiplied with the total number of strokesNLINET(I ) and summedup over all peak currents.7 Nitrogen mass produced per considered stroke.
as given by Wang et al. (1998). Hence, both differ only by aconstant factor, which has the dimension of laboratory sparklength per LINET stroke. This factor will be determined be-low.
The relationship between the peak current and NO pro-duced per spark as found by Wang et al. (1998) from mea-surements in the laboratory (at 1.01×10⁵ Pa) is given by:
nNOlab(I ) = a + b × I + c × I2 (6)
where nNOlab(I ) is the NO production normalised to 1 mspark length (1021 molecules NO m−1), a=0.14, b=0.026,and c=0.0025 andI is the peak current of the spark (kA).The number of NO molecules can be converted to the massof nitrogen according to:
MNOlab(I ) = MW × nNOlab(I ) (7)
whereMNOlab(I ) is the nitrogen production per to 1 m sparklength (10−3 g m−1) andMW is a constant (molecular weight
of N, unit g molecule−1). According to Eq. (7) a laboratoryspark with 10 kA would produce 0.015 g nitrogen m−1.
Furthermore, Eq. (7) was multiplied with a constant fac-tor CLINET (m laboratory spark per LINET stroke) to con-vert the production per laboratory sparks and metre to thetotal number of LINET strokes. Here we assume that allLINET strokes in one specific anvil have the same length,independent of peak current and flash component, since nofurther information is available from our dataset. The factorCLINET was estimated from Eq. (8). Values from Table 3 foranvil 1a (lower half of table, here only strokes≥10 kA con-sidered) were inserted in Eq. (8); the mean LNOx mass flux,FLNOx, (120 g s−1), and the LINET stroke rate (strokes s−1),RLINET(I ), for a given peak currentI :
FLNOx = CLINET
∞∫I=10
RLINET(I ) × MNOlab(I ) dI (8)
Atmos. Chem. Phys., 8, 921–953, 2008 www.atmos-chem-phys.net/8/921/2008/

H. Huntrieser et al.: Lightning activity in Brazilian thunderstorms 939
whereRLINET(I ) was estimated from Eq. (9):
RLINET(I ) =1
t
t∫t=0
NLINET(I, t) dt (9)
andNLINET(I, t) is the number of LINET strokes for a givenpeak current and time.
The value of RLINET in Eq. (9), integrated over allpeak currents (here≥10 kA), is 0.055 strokes s−1 (Ta-ble 3 lower half, anvil 1a). The total integral in Eq. (8)(peak currents from anvil 1a inserted) is estimated to2.71×10−3 strokes s−1 g m−1laboratory spark. The corre-sponding LINET factor,CLINET , was estimated to 44.4×10³
(=120/(2.71×10−3)) m laboratory spark stroke−1 (see Ta-ble 3). We expect a LINET stroke in the atmosphere tobe shorter than this calculated length (44 km), but probablybroader than a laboratory spark. One metre LINET stroke istherefore probably more efficient in producing LNOx than alaboratory spark.
Applied to LINET strokes, Eq. (7) changes to:
MNOlinet(I ) = CLINET × MNOlab(I ) (10)
where MNOlinet(I ) is the nitrogen mass production perLINET stroke (g stroke−1). A LINET stroke with a peakcurrent of 10 kA (anvil 1a) would produce 0.7 kg nitrogen ac-cording to Eq. (10). This value is rather large because peakcurrents<10 kA were neglected (Table 3, lower half) and thetotal LNOx mass was distributed only over strokes≥10 kAin Eq. (8).
The same calculations were performed for other selectedthunderstorm penetrations of 4 and 18 February 2005, asshown in Figs. 13a–d and as listed in Table 3. In Table 3 ev-ery thunderstorm penetration is listed twice. For the first cal-culation (upper half in the table) all registered strokes wereconsidered (peak currents down to 2 and 6 kA, depending onthe detection efficiency in that area). For a comparison be-tween the 4 and 18 February selected penetrations, however,only strokes with peak currents≥10 kA were considered, aslisted in the lower half of the table.
In Fig. 13a–d the frequency distributions of LINET strokes(grey bars) per 1 kA peak current interval are shown for theselected thunderstorms of 4 and 18 February 2005. Thestroke frequency rapidly decreases with increasing peak cur-rent. Superimposed are the laboratory results by Wang etal. (1998) concerning the NO dependency on peak currentmodified for LINET strokes (blue dashed line) according toTable 3 (differentCLINET values considered), and in addi-tion the estimated total amount of nitrogen mass producedper 1 kA LINET stroke interval for the selected thunderstormsystems (red line). The total mass estimates are listed in Ta-ble 3.
In Fig. 13e–f the same type of calculations were performedfor datasets with a larger number of LINET strokes to pointout more clearly the differences between the stroke peak
current frequency distributions of 4 and 18 February. Allstrokes (≥10 kA) in the LINET centre area on 4 Februarybetween 00:00 and 24:00 UTC were considered in Fig. 13e.In Fig. 13f the same calculations were performed for the se-lected thunderstorm system of 18 February for all strokes(≥10 kA) between 14:00 UTC and 21:00 UTC (see Fig. 4b).The integral over all peak currents gives a total nitrogen massof 8.8×10³ kg produced by 4359 tropical strokes on 4 Febru-ary (Fig. 13e), and a larger value of 11.2×10³ kg producedby 2034 subtropical strokes on 18 February (Fig. 13f). Thisexample also suggests that a subtropical stroke may producea larger amount of nitrogen mass than a tropical stroke (hereby a factor 2.7), mainly owing to differences in the strokelength (160 and 44 km, respectively). The higher productionrate of LNOx by subtropical strokes was not caused by thestroke peak currents, since this frequency distribution wasshifted to lower peak currents on 18 February (mean 31 kA,calculated from data in Fig. 2) compared with 4 February(mean 35 kA), as indicated in Fig. 13e–f.
From the stroke frequency distributions of 4 February itwas estimated that strokes with peak currents≥5 kA (only30% of all strokes) produce the bulk amount (70%) of thetotal nitrogen mass. This result indicates that the numerousweak strokes with peak currents<5 kA are less important forthe LNOx production. In Fig. 14 the same stroke frequencydistribution separated, however, into IC and CG strokes, in-dicates that these weak strokes are mainly IC strokes. Fur-thermore, Fig. 13a–b indicates that there was a large fractionof these strokes with low peak currents in anvil 1a comparedwith anvil 5a. Yet, the high stroke rate in anvil 1a (0.252 s−1)
produces a similar mean LNOx mass flux, FLNOx, value asin anvil 5a with a much lower stroke rate (0.167 s−1) (Ta-ble 3, upper half). (The calculations forFLNOx are based onsimilar penetration levels: 10.6 and 10.7 km.) Furthermore,the calculated stroke length was slightly shorter in anvil 5a(∼25 km) compared with anvil 1a (∼30 km), and the ICstroke release height (Table 4a) was slightly higher in anvil5a (11.6 km) compared with anvil 1a (10.0 km). This resultindicates that the lower stroke rate, shorter stroke length andhigher stroke release height (see Sect. 5.2) in anvil 5a can-not explain the similarFLNOx values determined for anvil 1aand 5a. Only if the higher stroke peak currents in anvil 5a(mean 12 kA, Table 4a) compared with anvil 1a (mean 8 kA)are considered, these may give an explanation in this case.
5.2 LNOx production rate as a function of atmosphericpressure
A further explanation for the different LNOx productionrates of tropical and subtropical strokes in the selectedBrazilian thunderstorms may be related to the release heightof the strokes. Laboratory measurements by Wang etal. (1998) indicate that the LNOx production rate increaseswith increasing atmospheric pressure:
nNOlab(p) = a + b × p (11)
www.atmos-chem-phys.net/8/921/2008/ Atmos. Chem. Phys., 8, 921–953, 2008

940 H. Huntrieser et al.: Lightning activity in Brazilian thunderstorms
Table 4a. LINET statistics of positive and negative CG and IC stroke fractions (here VLF pulses) and mean peak currents estimated forstrokes with peak currents≥1 kA.
Date Type of Thunderstorms/ Area1,2 Number Mean Peak CG IC Height Ratio Mean Peak Mean Peak Mean Peak Mean Peak Peakof Current, Strokes Strokes IC Positive/ Current Current Current Current CurrentStrokes3 kA (Fraction), (Fraction), Strokes, Negative (Fraction) (Fraction) (Fraction) (Fraction)≥10 kA
% % km Strokes for CG-, for CG+, for IC-, for IC+, (Fraction),kA (%) kA (%) kA (%) kA (%) %
Tropical (Brazil)230105 LINET centre 11 324 6 <44 ≥56 10.3±2.9 1.0 −9 (23) +5 (21) −5 (28) +4 (28) 10240105 LINET centre 419 6 37 63 10.5±3.3 1.1 −11 (21) +5 (16) −5(26) +4 (37) 11250105 LINET centre 848 7 47 53 9.6±2.8 1.6 −11 (21) +5 (26) −8 (17) +5 (36) 15040205 LINET centre 36 234 6 43 57 9.7±3.1 1.2 −10 (24) +5 (19) −5 (22) +4 (35) 12040205 LINET centre: anvil1a* 1278 8 24 76 10.0±3.4 0.7 −15 (20) +5 (4) −8 (40) +5 (36) 22040205 LINET centre: anvil5a** 439 12 88 12 11.6±3.2 0.7 −17 (55) +7 (33) −4 (5) +4 (7) 34040205 outside LINET centre: anvil2b*** 1466 8 (55) (45) (14.0±2.5) 0.7 −11 (34) +6 (21) −7 (25) +6 (20) 21250205 LINET centre 31 221 5 42 58 10.3±3.6 1.5 −7 (19) +5 (23) −5 (20) +4 (38) 8
Transition Trop.-Subtrop. (Brazil)290105 LINET centre 419 6 40 60 8.6±3.0 1.3 −12 (25) +5 (15) −6 (19) +4 (41) 16050205 LINET centre 1608 6 66 34 9.1±3.3 1.8 −9 (25) +6 (41) −5 (11) +5 (23) 13190205 LINET centre 17 228 5 47 53 9.6±3.3 1.6 −9 (21) +5 (26) −5 (17) +4 (36) 9
Subtropical (Brazil)180205 LINET periphery**** 3368 (13) – – – 0.5 - – – – (57)180205 LINET periphery: anvil I-VI***** 236 (13) – – – 0.6 - – – – (55)
Mid-latitude or Subtr. (Germany)290605 LINET centre: isolated TS 4232 9 54 46 9.3±2.4 0.6 −11 (35) +6 (19) −11 (29) +5 (17) 25040705 LINET centre 6337 5 72 28 10.8±3.3 0.8 −6 (39) +4 (33) −6 (16) +4 (12) 10100705 LINET centre 15 174 6 65 35 9.6±3.3 0.9 −7 (36) +4 (29) −6 (17) +4 (18) 12150705 LINET centre 8607 6 81 19 10.2±3.3 0.8 −8 (47) +4 (34) −5 (10) +3 (9) 15290705 LINET centre: isolated TS 2254 9 76 24 9.1±3.4 0.5 −12 (52) +6 (24) −8 (14) +4 (10) 292907054 LINET centre: isolated TS, red. 1761 11 81 19 9.0±3.5 0.4 −13 (58) +7 (23) −11 (12) +6 (7) 37
1 The LINET centre area over Brazil covers 21.5–22.5◦ S and 48.5–49.5◦ W (area with highest detection efficiency).2 The LINET centre area over Germany covers 48.5–49.5◦ N and 11.0–12.0◦ E (area with highest detection efficiency).3 For statistical reasons only days with at least 400 strokes (≥1 kA) in the LINET centre area were considered and strokes that were definedas IC or CG strokes (undefined strokes were neglected). The numbers given are the total number of strokes registered between 00:00 and24:00 UTC or for selected anvils.4 Reduced dataset (sensor configuration similar to Brazilian configuration).∗Anvil 1a (21.2–21.7◦ S and 48.9–49.2◦ W) is located at the edge of the LINET centre area and partly outside.∗∗Anvil 5a (21.7–21.9◦ S and 48.4–48.7◦ W) is located mainly inside the LINET centre area and comparable to other estimates.∗∗∗Anvil 2b (21.0–21.5◦ S and 49.7–50.1◦ W) is located just outside the LINET centre area where the fraction of IC strokes in generaldecreases, so estimates for this anvil penetration (especially IC height) are not directly comparable to the other estimates.∗∗∗∗Subtropical thunderstorm system (19.4–20.0◦ S and 47.7–49.2◦ W, 14:00–21:00 UTC) is located along the LINET periphery (detectionefficiency decreases) and therefore not well comparable to other estimates in this table (where peak currents≥1 kA are considered).∗∗∗∗∗Anvil I-VI (19.3–19.8◦ S and 48.9–49.2◦ W, 19:30–21:00 UTC) is located along the LINET periphery (detection efficiency decreases)and therefore not well comparable to other estimates in this table (where peak currents≥1 kA are considered).
wherenNOlab(p) is the NO production normalised to 1 mspark length (1021 molecules NO m−1), a=0.34, andb=1.30,andp is the pressure (105 Pa). A laboratory spark at 1000 hPa(ground level) would produce 0.038 gN m−1; at 500 hPa(300 hPa) about 0.023 (0.017) gN m−1 would be produced.The average height of IC strokes at mid-latitudes (Table 4a)is ∼10.0 km (270 hPa) and in the tropics∼10.5 km (250 hPa)(Table 4a). The calculated difference in LNOx produc-tion rate (factor 1.1) between these two altitudes (0.016 and0.015 gN m−1, respectively) is only minor and cannot ex-plain the distinctly higher LNOx production rate of subtrop-ical strokes. Only if we make the unrealistic assumption thatall subtropical strokes are CG strokes (mean release height∼700 hPa) and all tropical strokes are IC strokes (mean re-lease height 250 hPa) can a factor of∼2 (=0.029/0.015) dif-ference be achieved.
In the last subsection it was concluded that weak strokeswith peak currents<5 kA are less important for the LNOx
production. The majority of strokes with peak currents<5 kA are IC strokes according to the frequency distribu-tions of IC and CG strokes in Fig. 14. These IC strokes arereleased in the UT at low pressure. Taking this further rela-tionship into account (decreasing LNOx production rate withdecreasing pressure), we find that the large number of veryweak strokes with peak currents<5 kA only have a minorcontribution to the LNOx budget.
5.3 Comparison of mean stroke peak currents in severaltropical and one subtropical Brazilian thunderstorms
The results in the previous subsections lead us to hypothe-sise that the different stroke lengths (calculated) may mainlycontribute to the different LNOx production rates determinedfor several tropical and one subtropical Brazilian thunder-storms. The contribution from the different stroke peakcurrent frequency distributions was found to be minor, but
Atmos. Chem. Phys., 8, 921–953, 2008 www.atmos-chem-phys.net/8/921/2008/

H. Huntrieser et al.: Lightning activity in Brazilian thunderstorms 941
Table 4b. Same as Table 4a, but for strokes with peak currents≥10 kA.
Date Type of Thunderstorms/ Area1,2 Number Mean Peak CG IC Height Ratio Mean Peak Mean Peak Mean Peak Mean Peak Peakof Current, Strokes Strokes IC Positive/ Current Current Current Current CurrentStrokes3 kA (Fraction), (Fraction), Strokes, Negative (Fraction) (Fraction) (Fraction) (Fraction)≥10 kA
% % km Strokes for CG-, for CG+, for IC-, for IC+, (Fraction),kA (%) kA (%) kA (%) kA (%) %
Tropical (Brazil)
230105 LINET centre 1144 19 <70 ≥30 10.8±2.9 0.3 −23 (57) +15 (13) −13 (18) +16 (12) 30240105 LINET centre 47 19 77 23 10.0±3.7 0.3 −20 (66) +13 (11) −20 (11) +13 (12) 28250105 LINET centre 130 21 61 39 9.3±2.3 0.6 −25 (42) +16 (19) −26 (19) +14 (20) 31040205 LINET centre 4379 20 73 27 9.5±3.2 0.3 −22 (62) +19 (11) −17 (13) +16 (14) 34040205 LINET centre: anvil1a* 129 18 65 35 10.2±2.7 0.2 −20 (62) +16 (3) −13 (24) +16 (11) 26040205 LINET centre: anvil5a** 123 26 98 2 (8.5±0.8) 0.1 −27 (86) +19 (12) −14 (1) +14 (1) 50040205 outside LINET centre: anvil2b*** 308 19 70 30 (14.2±2.4) 0.3 −22 (58) +14 (12) −16 (19) +16 (11) 28250205 LINET centre 2406 18 65 35 11.0±4.0 0.4 −20 (50) +17 (15) −16 (20) +14 (15) 24
Transition Trop.-Subtrop. (Brazil)290105 LINET centre 68 18 80 20 8.3±3.5 0.1 −20 (74) +13 (6) −13 (16) +12 (4) 31050205 LINET centre 212 22 80 20 8.0±2.6 0.9 −23 (45) +24 (35) −16 (8) +17 (12) 33190205 LINET centre 1499 18 77 23 10.2±3.9 0.4 −19 (62) +15 (15) −16 (12) +15 (11) 25
Subtropical (Brazil)180205 LINET periphery**** 1914 17 – – – 0.4 – – – – 21180205 LINET periphery: anvil I-VI***** 130 17 – – – 0.4 – – – – 22
Mid-latitude or Subtr. (Germany)290605 LINET centre: isolated TS 1065 23 56 44 9.2±2.3 0.2 −24 (48) +24 (8) −24 (38) +16 (6) 44040705 LINET centre 607 20 71 29 9.7±3.0 0.2 −19 (56) +26 (15) −18 (24) +23 (5) 30100705 LINET centre 1845 20 71 29 9.3±3.4 0.2 −21 (60) +17 (11) −20 (23) +19 (6) 32150705 LINET centre 1253 19 90 10 10.3±3.3 0.1 −20 (80) +19 (10) −19 (9) +16 (1) 31290 705 LINET centre: isolated TS 659 21 87 13 7.4±3.4 0.1 −22 (76) +17 (11) −24 (11) +18 (2) 432907054 LINET centre: isolated TS, red. 659 21 87 13 7.4±3.4 0.1 −22 (76) +17 (11) −24 (11) +18 (2) 43
1 The LINET centre area over Brazil covers 21.5–22.5◦ S and 48.5–49.5◦ W (area with highest detection efficiency).2 The LINET centre area over Germany covers 48.5–49.5◦ N and 11.0–12.0◦ E (area with highest detection efficiency).3 For statistical reasons only days with at least 40 strokes (≥10 kA) in the LINET centre area were considered and strokes that were definedas IC or CG strokes (undefined strokes were neglected). The numbers given are the total number of strokes registered between 00:00 UTCand 24:00 UTC or for selected anvils.4 Reduced dataset (sensor configuration similar to Brazilian configuration).∗Anvil 1a (21.2–21.7◦ S and 48.9–49.2◦ W) is located at the edge of the LINET centre area and partly outside.∗∗Anvil 5a (21.7–21.9◦ S and 48.4–48.7◦ W) is located mainly inside the LINET centre area and comparable to other estimates.∗∗∗Anvil 2b (21.0–21.5◦ S and 49.7–50.1◦ W) is located just outside the LINET centre area where the fraction of IC strokes in generaldecreases, so estimates for this anvil penetration (especially IC height) are not directly comparable to the other estimates.∗∗∗∗Subtropical thunderstorm system (19.4–20.0◦ S and 47.7–49.2◦ W, 14:00 UTC–21:00 UTC) is located along the LINET periphery (de-tection efficiency decreases) but can be compared with the other estimates in this table, since only peak currents≥10 kA are considered here.∗∗∗∗∗Anvil I-VI (19.3–19.8◦ S and 48.9–49.2◦ W, 19:30–21:00 UTC) is located along the LINET periphery (detection efficiency decreases)but can be compared with the other estimates in this table, since only peak currents≥10 kA are considered here.
maybe important to explain differences between single trop-ical thunderstorms as mentioned in Sect. 5.1. In this subsec-tion, values of the mean peak current (also separated for CGand IC strokes) are analysed in detail for a larger number oftropical Brazilian thunderstorms in the period with availableLINET measurements (21 January–27 February 2005) to in-vestigate the differences between a number of tropical thun-derstorms and the subtropical thunderstorm of 18 February.
For an equivalent comparison only strokes in the centre ofthe LINET detection network (from 21.5◦ S to 22.5◦ S and48.5◦ W to 49.5◦ W, 00:00–24:00 UTC) were considered toavoid changes in detection efficiency and in the IC/CG VLFsource ratio towards the border line. Selected days with alarge number of LINET strokes suitable for statistical calcu-lations are listed in Table 4a (4b) for peak currents≥1 kA(≥10 kA).
The selected days were classified according to HH07 intodifferent categories: tropical, transition tropical-subtropical
and subtropical cases, by use of the meteorological parame-ters listed in Table 4c (daily mean values) and as indicated inFig. 15 (3 h values). In Table 4c the equivalent potential tem-perature (2e) at 850 and 500 hPa, and the wind velocity anddirection at 200 hPa are listed for the selected LINET days inTable 4a–b. As suggested in HH07,2e in tropical air massesexceeded 345 K at 850 hPa and 332 K at 500 hPa and the UTwind velocity was in general low∼5–10 m s−1, influencedby the Bolivian High.
The 4 February 2005 was selected as a case representativefor tropical thunderstorm activity in general. In the selectedregion∼36 000 strokes were registered during the whole day(Table 4a). As expected for tropical thunderstorms, the frac-tion of IC strokes dominates over CG strokes and amountsto at least 57%. The≥ symbol indicates that the fraction ofIC strokes may be even larger. The 3-D procedure appliedto discriminate between IC and CG strokes categorises somestrokes as uncertain. In most cases, this stroke is a CG stroke
www.atmos-chem-phys.net/8/921/2008/ Atmos. Chem. Phys., 8, 921–953, 2008

942 H. Huntrieser et al.: Lightning activity in Brazilian thunderstorms
Table 4c. Equivalent potential temperature (2e) and wind velocity and direction (calculated from ECMWF analyses) in the LINET centrearea1 for selected days with LINET strokes as listed in Table 4a–b.
Date Mean and Mean and Mean and Std WindStd2 2e at Std2e at Wind Velocity at Direction at850 hPa, K 500 hPa, K 200 hPa, m s−1 200 hPa
Tropical (Brazil)230105 349±2 341±1 11±3 SE240105 349±2 341±1 8±3 SE–SW250105 349±2 343±1 6±1 SW–NW040205 344±3 340±1 5±2 SE–SW250205 342±4 337±1 17±2 SWTransition Tropical-Subtropical (Brazil)290105 344±2 342±2 16±1 W050205 343±2 339±3 7±2 SW190205 347±3 330±2 34±2 WSubtropical (Brazil)180205 343±4 330±1 27±1 WMid-latitude (Germany)290605 331±3 326±2 21±2 NW–SW040705 323±6 323±1 14±2 W–SW100705 321±3 319±1 8±2 NE150 705 323±3 320±1 20±7 NWSubtropical (Germany)290705 340±5 325±2 19±3 SW
1 The LINET centre area over Brazil covers 21.5–22.5◦ S and 48.5–49.5◦ W, and over Germany 48.5–49.5◦ N and 11.0–12.0◦ E.2 Std = Standard deviation.
(and was here defined as CG), but for unfavourable positionsof the measuring network stations it cannot be excluded thatit is an IC stroke. This uncertainty may lead to significantbiases in the results presented below in Table 4a–b. Note thatwe do not deal here with flash counts but with flash com-ponent (stroke) counts. In Table 4a the fraction of positiveand negative IC and CG strokes for 4 February (all data) wasdetermined to≥35% (IC+),≥22% (IC-),<24% (CG-) and<19% (CG+). The overall mean peak current (magnitude)was 6 kA. The mean peak currents for the different types ofstrokes (as mentioned above) were +4,−5, −10 and +5 kA,respectively. The ratio of positive to negative strokes was 1.2.The mean height of IC strokes was 9.7 km. Furthermore, thelast column in Table 4a indicates that the fraction of peakcurrents≥10 kA was 12%.
These results from the 4 February tropical thunderstormscan be compared with other tropical thunderstorms (see Ta-ble 4a–b) and the 18 February subtropical thunderstorm. InTable 4a a high mean peak current of 13 kA is given for the18 February which, however, is not comparable to the restof the data in Table 4a, since the storm was located alongthe northern periphery of the LINET network (detection ef-ficiency lower). For an equivalent comparison, only strokes≥10 kA, as listed in Table 4b, were considered and an areaalong the northern periphery of the LINET detection network(19.4–20.0◦ S and 47.7–49.2◦ W, see Fig. 4b), where the sub-tropical thunderstorm of 18 February 2005 developed, was
selected. The calculated mean peak currents for this areaindicate a slightly lower mean peak value, 17 kA, for thesubtropical thunderstorm of 18 February compared with themean peak value for tropical thunderstorms of 4 Februaryfor the same area, 20 kA (same value as found for the LINETcentre area listed in Table 4b, indicating that the detectionefficiency for higher peak currents is about the same in theLINET centre and along the northern periphery, as also dis-cussed in Sect. 4.1).
Overall, the mean peak currents in different tropical thun-derstorms of 4 February (and other tropical thunderstormslisted in Table 4b) were highly variable between 18 and26 kA (probably depending on thunderstorm intensity). Inthe next section these values are compared with mean peakcurrents in mid-latitude thunderstorms over Germany to in-vestigate if any major differences exist.
5.4 Comparison of mean stroke peak currents in severaltropical and mid-latitude thunderstorms
The LINET network was also operated in southern Germanyin summer 2005 (Sect. 2.2). LINET measurements cov-ered an area reaching from 47◦ N to 51◦ N and from 5◦ E to14◦ E. 29 July 2005 was one of the days in summer 2005with the highest lightning activity over Germany. In theLINET area ∼500 000 strokes were registered during thewhole day. In Fig. 16a–b the cloud distribution over Europeon this day is shown together with the horizontal distribution
Atmos. Chem. Phys., 8, 921–953, 2008 www.atmos-chem-phys.net/8/921/2008/

H. Huntrieser et al.: Lightning activity in Brazilian thunderstorms 943
040205_LINET centre (00-24 UTC)
peak current /kA0 20 40 60 80 100
num
ber o
f LIN
ET s
troke
s (k
A)-1
1
10
100
1000
10000
number of IC strokesnumber of CG strokes
Fig. 14. Frequency distributions of LINET strokes as a function ofpeak current separated for IC (blue) and CG (green) strokes on 4February 2005.
of LINET strokes over southern Germany and the positionsof the LINET sensors.
For further estimates with LINET data, only data inthe LINET centre region were considered (here 48.5◦ N to49.5◦ N and 11◦ E to 12◦ E), as mentioned previously. Otherdays during the German field campaign in June and July2005 with a high LINET stroke activity in this area were 29June and 4, 10 and 15 July. The stroke statistics from thesedays are listed in Table 4a–b (for peak currents≥1 kA and≥10 kA, respectively) (lower half of table) and can be com-pared with LINET stroke statistics from Brazil (upper half oftable). On 29 June and 29 July strokes in two intense, iso-lated fast-moving thunderstorms (TS) with high flash rateswere considered. On 4, 10 and 15 July all strokes in theLINET centre area were considered. The mean peak cur-rents on the latter days (Table 4a) were 5–6 kA, comparableto the lowest values observed in tropical Brazilian thunder-storms with 5–12 kA (probably lower over Germany owingto the slightly higher detection efficiency in the LINET cen-tre because of a more dense network of LINET sensors). Forthe same reasons, the fraction of peak currents≥10 kA inthese German thunderstorms with 10–15% was comparableto the lowest values in tropical Brazilian thunderstorms with8–34%. If only strokes with peak currents≥10 kA are con-sidered, however, (Table 4b), the stroke statistics results fromthe 4, 10 and 15 July German thunderstorms (mean peak cur-rent 19–20 kA, ratio of peak currents≥10 kA is 30–32%) arewithin the range for tropical Brazilian thunderstorms (18–26 kA, 24–50%).
On 29 June and 29 July 2005 two strong, isolated fast mov-ing thunderstorm systems ahead of cold fronts over Germanywith a high stroke frequency were selected, as listed in Ta-ble 4a–b and as marked in Fig. 16b for 29 July. In Table 4athe mean peak currents (≥1 kA) in these storms were higher
ECMWF data
equi
vale
nt p
oten
tial t
empe
ratu
re /K
320
325
330
335
340
345
350
355
850 hPa500 hPa
Date
horiz
onta
l win
d ve
loci
ty /m
s-1
-30
-20
-10
0
10
20
30
40
50
u-comp. 200 hPa v-comp. 200 hPatotal 200 hPa
23 J
an.
28 J
an.
02 F
eb.
07 F
eb.
12 F
eb.
17 F
eb.
22 F
eb.
W
(a)
(b)
EN
S
27 F
eb.
Fig. 15. Time series of(a) equivalent potential temperature and(b) horizontal wind velocity (separated in N, E, W, and S compo-nents) at different levels for the period of the TROCCINOX fieldphase in 2005 (22◦ S, 49◦ W). Days with registered LINET strokesin the LINET centre area (criterion: at least 40 strokes≥10 kA,see Table 4b) are marked with grey patterns (tropical days: densetilted, transition tropical/subtropical: less dense tilted, subtropical:crossed).
with 9 kA compared with 4, 10 and 15 July, and also the ratioof peak currents≥10 kA was higher with 25 and 29%, moresimilar to the upper values in Brazilian thunderstorms. Asexpected for mid-latitude thunderstorms (e.g. Prentice andMackerras, 1977), the fraction of IC strokes≥19–46% wason average less than in tropical Brazilian thunderstorms andthe CG fraction dominated with<54–81% (all mid-latitudecases in Table 4a considered). Furthermore, the mean heightof IC strokes was∼0.5 km lower over Germany comparedwith Brazil.
To investigate how the different configurations and num-bers of sensors over Germany and Brazil influenced the re-sults, an additional dataset was analysed. For all selectedGerman days, a dataset with a reduced number of LINETsensors was created. In the original LINET dataset from 29July between 5 and 8 sensors (average 7) were considered forthe stroke determination in the selected thunderstorm sys-tem (indicated in Fig. 16b). In the reduced LINET dataset
www.atmos-chem-phys.net/8/921/2008/ Atmos. Chem. Phys., 8, 921–953, 2008
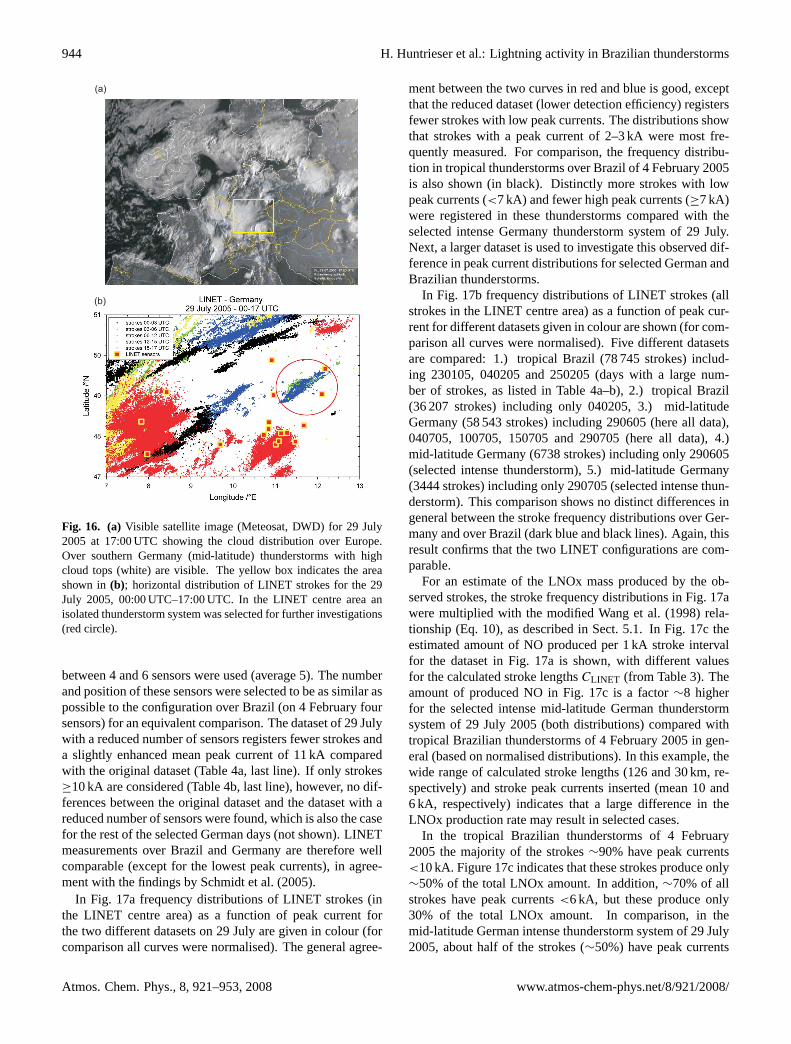
944 H. Huntrieser et al.: Lightning activity in Brazilian thunderstorms
(a)
(b)
Fig. 16. (a)Visible satellite image (Meteosat, DWD) for 29 July2005 at 17:00 UTC showing the cloud distribution over Europe.Over southern Germany (mid-latitude) thunderstorms with highcloud tops (white) are visible. The yellow box indicates the areashown in(b); horizontal distribution of LINET strokes for the 29July 2005, 00:00 UTC–17:00 UTC. In the LINET centre area anisolated thunderstorm system was selected for further investigations(red circle).
between 4 and 6 sensors were used (average 5). The numberand position of these sensors were selected to be as similar aspossible to the configuration over Brazil (on 4 February foursensors) for an equivalent comparison. The dataset of 29 Julywith a reduced number of sensors registers fewer strokes anda slightly enhanced mean peak current of 11 kA comparedwith the original dataset (Table 4a, last line). If only strokes≥10 kA are considered (Table 4b, last line), however, no dif-ferences between the original dataset and the dataset with areduced number of sensors were found, which is also the casefor the rest of the selected German days (not shown). LINETmeasurements over Brazil and Germany are therefore wellcomparable (except for the lowest peak currents), in agree-ment with the findings by Schmidt et al. (2005).
In Fig. 17a frequency distributions of LINET strokes (inthe LINET centre area) as a function of peak current forthe two different datasets on 29 July are given in colour (forcomparison all curves were normalised). The general agree-
ment between the two curves in red and blue is good, exceptthat the reduced dataset (lower detection efficiency) registersfewer strokes with low peak currents. The distributions showthat strokes with a peak current of 2–3 kA were most fre-quently measured. For comparison, the frequency distribu-tion in tropical thunderstorms over Brazil of 4 February 2005is also shown (in black). Distinctly more strokes with lowpeak currents (<7 kA) and fewer high peak currents (≥7 kA)were registered in these thunderstorms compared with theselected intense Germany thunderstorm system of 29 July.Next, a larger dataset is used to investigate this observed dif-ference in peak current distributions for selected German andBrazilian thunderstorms.
In Fig. 17b frequency distributions of LINET strokes (allstrokes in the LINET centre area) as a function of peak cur-rent for different datasets given in colour are shown (for com-parison all curves were normalised). Five different datasetsare compared: 1.) tropical Brazil (78 745 strokes) includ-ing 230105, 040205 and 250205 (days with a large num-ber of strokes, as listed in Table 4a–b), 2.) tropical Brazil(36 207 strokes) including only 040205, 3.) mid-latitudeGermany (58 543 strokes) including 290605 (here all data),040705, 100705, 150705 and 290705 (here all data), 4.)mid-latitude Germany (6738 strokes) including only 290605(selected intense thunderstorm), 5.) mid-latitude Germany(3444 strokes) including only 290705 (selected intense thun-derstorm). This comparison shows no distinct differences ingeneral between the stroke frequency distributions over Ger-many and over Brazil (dark blue and black lines). Again, thisresult confirms that the two LINET configurations are com-parable.
For an estimate of the LNOx mass produced by the ob-served strokes, the stroke frequency distributions in Fig. 17awere multiplied with the modified Wang et al. (1998) rela-tionship (Eq. 10), as described in Sect. 5.1. In Fig. 17c theestimated amount of NO produced per 1 kA stroke intervalfor the dataset in Fig. 17a is shown, with different valuesfor the calculated stroke lengthsCLINET (from Table 3). Theamount of produced NO in Fig. 17c is a factor∼8 higherfor the selected intense mid-latitude German thunderstormsystem of 29 July 2005 (both distributions) compared withtropical Brazilian thunderstorms of 4 February 2005 in gen-eral (based on normalised distributions). In this example, thewide range of calculated stroke lengths (126 and 30 km, re-spectively) and stroke peak currents inserted (mean 10 and6 kA, respectively) indicates that a large difference in theLNOx production rate may result in selected cases.
In the tropical Brazilian thunderstorms of 4 February2005 the majority of the strokes∼90% have peak currents<10 kA. Figure 17c indicates that these strokes produce only∼50% of the total LNOx amount. In addition,∼70% of allstrokes have peak currents<6 kA, but these produce only30% of the total LNOx amount. In comparison, in themid-latitude German intense thunderstorm system of 29 July2005, about half of the strokes (∼50%) have peak currents
Atmos. Chem. Phys., 8, 921–953, 2008 www.atmos-chem-phys.net/8/921/2008/

H. Huntrieser et al.: Lightning activity in Brazilian thunderstorms 945
peak current /kA0 10 20 30 40 50 60 70
stro
ke fr
eque
ncy
/% (k
A)-1
0.01
0.1
1
10
100tropical /Brazil (78745 strokes)230105+040205+250205tropical /Brazil (36207 strokes)040205mid-latitude /Germany (58543 strokes)290605+040705+100705+150705+290705 mid-latitude /Germany (6738 strokes)290605_TSmid-latitude /Germany (3444 strokes)290705_TS
(b)
LINET - peak current distributions
peak current /kA0 20 40 60 80 100
stro
ke fr
eque
ncy
/% (k
A)-1
0
5
10
15
20
25
30
tropical Brazil: 040205mid-latitudes Germany: 290705mid-latitudes Germany: 290705reduced number of sensors
peak current /kA0 10 20 30 40 50 60 70
stro
ke fr
eque
ncy
/% (k
A)-1
0.01
0.1
1
10
100
(a)
LINET - peak current distributions
peak current /kA0 10 20 30 40 50 60 70 80 90 100
light
ning
-pro
duce
d N
O /k
g kA
-1
0
2
4
6
8
10
12
14tropical Brazil: 040205CLINET = 30 kmmid-latitude Germany: 290705CLINET = 126 kmmid-latitude Germany: 290705CLINET = 126 kmreduced number of sensors
(c)
Fig. 17. (a–b) Frequency distributions of LINET strokes (inthe LINET centre area) as a function of peak current for differ-ent datasets given in colour (for comparison all curves were nor-malised). (c) Estimated amount of NO produced per 1 kA strokeinterval (based on the Wang et al. 1998 relationship) for the datasetin (a) considering different values forCLINET .
<6 kA, but these strokes produce only∼10% of the LNOxamount. Only a small fraction of all strokes∼10% havepeak currents>20 kA, which produce∼60% of the total
+++
----
wind direction
altit
ude
+++
Fig. 18.Schematic illustrating the hypothesis that enhanced verticalwind shear in vicinity of a thunderstorm causes horizontal separa-tion of charged regions (indicated by the ovals with positive chargesigns) in the upper parts of a thunderstorm and hence generatinglonger flashes (arrows) with higher NOx production per flash.
LNOx amount. These examples again indicate that the LNOxamount produced by a thunderstorm mainly depends on thenumber of strokes with peak currents>5 kA.
6 Discussion
The results in the previous section indicate that the amount ofnitrogen produced by lightning in a thunderstorm is not wellcorrelated with the number of strokes only (Table 3). Wesuggest, in accordance with Wang et al. (1998) and Bartheet al. (2007), that other lightning parameters such as strokelength, peak current and release height also necessarily haveto be taken into account. The amount of nitrogen producedper m flash and kA for a given pressure level, see parameterS in Table 3, would be more appropriate for comparison, butall of these parameters are in general not available from op-erational lightning detection networks. Up to now, all theseparameters have not been taken into account concurrently,which may explain the wide range of values for the LNOxproduction rate per flash given in the literature (SH07). Fur-thermore, for a more equivalent comparison it would also bedesirable to always relate the estimates from a specific light-ning detection network to global lightning detection systemssuch as LIS.
From the analyses of TROCCINOX data, which suggest ahigher LNOx production rate for a subtropical thunderstormcompared with several tropical thunderstorms, the strokelength was found to be the most important parameter respon-sible for the differences. The calculated stroke length wason average a factor∼3 longer in the investigated subtropi-cal thunderstorm (Table 3). We suggest that the reason forthe longer strokes may be related to the enhanced verticalshear in the horizontal wind in this thunderstorm comparedwith tropical thunderstorms. In the subtropical case, the windvelocity difference between the pressure levels 200 hPa and
www.atmos-chem-phys.net/8/921/2008/ Atmos. Chem. Phys., 8, 921–953, 2008

946 H. Huntrieser et al.: Lightning activity in Brazilian thunderstorms
180205: 14-21 UTC
-49.0 -48.5 -48.0 -47.5
Latit
ude
/°N
-20.0
-19.5
-19.0
-18.5
040205: 17-18 UTC
Longitude /°E-49.5 -49.0 -48.5 -48.0
Latit
ude
/°N
-22.0
-21.5
-21.0
-20.5
flash components ina subtropical TS with
high vertical wind shear
flash components ina tropical TS with
low vertical wind shear
(a)
(b)
Fig. 19. Horizontal distributions of RINDAT flash compo-nents (several VLF sources in a flash connected to a line)for the selected(a) 18 February subtropical thunderstorm (TS)(14:00 UTC–21:00 UTC) and the(b) 4 February tropical thunder-storm (17:00 UTC–18:00 UTC).
700 hPa is 2–3 times larger than in the tropical thunderstorm(Table 2a–b, see also Fig. 14 in HH07). The elevated windvelocity in the upper region may distribute charged parti-cles in the subtropical anvil region over longer horizontaldistances generating longer flashes, as shown schematicallyin Fig. 18. Recent simulations by Barthe and Pinty (2007)of an ideal supercellular storm case, using a 3-D mesoscalemodel with an explicit lightning flash scheme, give somehints in this direction. Furthermore, conceptual models of theelectrical structure in a mesoscale convective system (MCS)by Stolzenburg et al. (1994) and in a supercell by Wiens etal. (2005) (both storm types related to elevated wind shear)indicate that the charged regions in the upper part of thecloud may stretch far away from the convective region withprecipitation. A lateral displacement of upper level chargeon the convective scale (∼10 km) because of vertical windshear (0–6 km) was first suggested by Pierce (1955), Brooket al. (1982), Ray et al. (1987), and Hill (1988) (knownas “tilted dipole mechanism”). Later, observations by En-
gholm et al. (1990) of MCS confirmed a tilted deformationof the convective charge centre by the vertical wind shear.Contrarily, Rutledge and MacGorman (1988) first suggestedthat the origin of charge for positive ground flashes in thetrailing-stratiform region of MCSs was the rearward advec-tion of positive charge on large aggregates of ice particlesfrom the MCS convective charge centre (leading line) bythe mesoscale storm-relative winds (now known as “chargeadvection mechanism”). More recently, these mechanismshave also been discussed by Gilmore and Wicker (2002),Carey et al. (2005), Carey and Buffalo (2007) and Steigeret al. (2007a, b). However, the VHF lightning observa-tions by Carey et al. (2005) clearly indicate that the “tilteddipole mechanism” and the “charge advection mechanism”are two different mechanism on different scales (convec-tive and mesoscale) that should be considered separately. Insummary these references support our hypothesis as shownschematically in Fig. 18.
Unfortunately, for our dataset the actual stroke length can-not be determined from the available lightning data. Fromthe RINDAT data it is possible, however, to compare thelength between different VLF sources along a flash (“flashcomponent”). VLF sources within<1 s were grouped toa flash component. In Fig. 19a–b the horizontal locationsof the flash components are shown for two selected cases.For the 18 February subtropical thunderstorm (strokes con-sidered from 14:00 UTC–21:00 UTC, Fig. 4b) a clear pat-tern with longer flash components mainly between NW andSE results, influenced by the strong vertical wind shear(Fig. 19a). In contrast, for the 4 February tropical thunder-storms (17:00 UTC–18:00 UTC, Fig. 4a) the horizontal dis-tribution of these flash components shows no preferred direc-tion (Fig. 19b), owing to the lower vertical wind shear. In ad-dition, the flash components are on average shorter comparedwith the subtropical thunderstorm. The average length ofthe selected 224 flash components on 4 February was 1.6 kmcompared with 3.1 km on 18 February based on the 173 flashcomponents, a factor 1.9 difference in the lengths.
The thunderstorm observations during TROCCINOX canalso be compared with observations in Florida thunderstormsduring CRYSTAL-FACE. Ridley et al. (2004) observed thatNO mixing ratios in fresh (not heavily polluted) anvils weredistinctly higher than observed anywhere else up to then infresh anvils. Average anvil-NO mixing ratios varied between∼1–4 nmol mol−1, compared with 0.2–1.6 nmol mol−1NOxon average in Brazilian anvils during TROCCINOX (HH07)and 1.3±0.7 nmol mol−1 NOx in more polluted thunder-storms during EULINOX (Huntrieser et al., 2002). For twothunderstorms during CRYSTAL-FACE, Ridley et al. (2004)determined (3.3–6.6)×1025 and (17–23)×1025 moleculesNO per flash (LIS) for a moderate size and a large storm,respectively. Only the values for the moderate size storm arewithin the range of the mean value for a subtropical thun-derstorm during TROCCINOX: 4.5×1025 molecules NO perflash (LIS).
Atmos. Chem. Phys., 8, 921–953, 2008 www.atmos-chem-phys.net/8/921/2008/

H. Huntrieser et al.: Lightning activity in Brazilian thunderstorms 947
Table 5. Overview over mean peak currents for negative (and partly for all1) CG flashes measured in different regions (mainly United States= U.S.) indicating a latitudinal gradient as suggested by Orville (1990) and Orville et al. (2002). Higher mean peak currents were estimatedin the older studies owing to a lower detection efficiency of low peak currents. The U.S. NLDN was upgraded in 1994–1995 (Cummins etal., 1998) and in 2002–2003 (Cummins et al., 2006).
Reference Lightning Detection Mean Peak Mean Peak Current Mean Peak(chronological) System Current CG- CG- (contiguous Current CG- (N
(SE U.S.), kA U.S.), kA and Central U.S.),kA
Orville (1990) NLDN (=National Florida: 40–451 New England: 25Lightning DetectionNetwork): 1988
Petersen and Rutledge Northern Australia: Darwin in(1992) 1989–1990 (magnetic tropical northern
direction-finding Australia: 391
lightning sensors from (similar as inU.S.) Florida)
Price et al. (1997) NLDN: summer 1988 Florida andMidwest: 36
Lyons et al. (1998) NLDN: 1991–1995 Large peakcurrents>75:preferable in SEU.S.
Wacker and Orville (1999) NLDN: 1989–1993 Florida: 41 contiguous U.S.: 38 Kansas: 33(pre-upgrade)
Wacker and Orville (1999) NLDN: 1994 Florida: 36 contiguous U.S.: 34 Kansas: 30(network upgraded)
Wacker and Orville (1999) NLDN: 1995 Florida: 33 contiguous U.S.: 30 Kansas: 26(network upgraded)
Orville and Huffines (1999) NLDN: 1995–1997 continental mountainous region:coastal areas of 15–202
the U.S.:>262
DeCaria et al. (2000) NLDN: 12 July 1996 Colorado: 151
Orville et al. (2002) NALDN (=North American Florida: 20–242 contiguous U.S.: 162 Central Canada: 12–182
Lightning DetectionNetwork, including Canadaplus contiguous U.S.):1998–2000
Langford et al. (2004) NLDN: 12 Sep 2002 Colorado: 15Ridley et al. (2004) NLDN: 29/16 July 2002 Florida: 20/26Chowdhuri et al. (2005) NLDN: 1997–1998 and 1999–2000 SE U.S.: 202 Central/NW U.S.: 16/182
this paper LINET: only CG strokes<−10 kA Subtropical Mid-latitude TropicalBrazil (18 Feb Germany (June– Brazil (Jan–2005): 193 July 2005): 19–24 Feb 2005): 19–27
1 Here mean value independent of polarity.2 Here median value instead of mean value.3 Here mean value for negative CG and IC strokes. No separation possible, since strokes occurred along LINET periphery.
The reason for these extreme NO production rates inFlorida anvils may be related to a combination of the light-ning parameters mentioned above. First, the high flash ratein these storms may play an important role. The high flashdensity over Florida (>9 flashes km−2 a−1, Orville et al.,2002), however, is comparable to that of Brazil (mean 6–8flashes and up to 10–15 flashes km−2 a−1 based on NLDNand RINDAT, respectively) (Pinto and Pinto, 2003). Fur-thermore, it has been reported that the mean peak current
of CG flashes is shifted to higher values in Florida thun-derstorms compared with other regions in the United States:see mean peak values for different regions listed in Table 5.The NLDN detection efficiency for flashes with peak cur-rents>5 kA is 80–90% since the upgrade of the system in1994–1995 (Cummins et al., 1998) and 90–95% since the up-grade in 2002–2003 (Cummins et al., 2006). Values based onLINET data are also listed in Table 5 for comparison, whichindicate a low mean value in the investigated subtropical
www.atmos-chem-phys.net/8/921/2008/ Atmos. Chem. Phys., 8, 921–953, 2008

948 H. Huntrieser et al.: Lightning activity in Brazilian thunderstorms
thunderstorm, but just within the range of mean LINET val-ues for tropical and mid-latitude thunderstorms. In the lat-ter two storm types, the range of the mean peak currents iscomparable, but the highest values were observed in tropicalthunderstorms. The results presented in Table 5 indicate alatitudinal variation of mean peak current for NLDN, but notfor LINET. Finally, the higher wind velocities in the UT overFlorida (15 and 20 m s−1, Garrett et al., 2005) compared withtropical Brazil indicates that the stroke length may be longerin Florida thunderstorms. We therefore conclude that sev-eral lightning parameters, such as flash density, mean peakcurrent and possibly flash length (related to UT wind veloc-ity), achieve especially high values in Florida thunderstorms,which may be responsible for the high anvil-NO mixing ra-tios and LNOx production rates per stroke observed. Otherauthors also mentioned that the most severe thunderstormson earth occur in the central-eastern United States owing tothe unique combination of steep lapse rates, moist boundarylayer inflow and substantial wind shear (Doswell, 2001; DelGenio et al., 2007).
Furthermore, in our study we find that the LNOx produc-tion rate per stroke may be a factor∼2 (up to 8) larger forsubtropical and mid-latitude strokes than for tropical strokes(Table 2a, b, Fig. 17c). We therefore suggest that differentestimates for the amount of LNOx produced per stroke de-pending on region are needed for more accurate global LNOxestimates, taking stroke peak currents, stroke release heightand stroke lengths (related to the vertical wind shear betweenupper and lower troposphere) into account. In agreement, re-cent simulations with the GEOS-CHEM model (Hudman etal., 2007) reveal that upper tropospheric NOx mixing ratiosobserved over the southern United States during ICARTT(July–August 2004) can only be reproduced if the LNOxyield in the model is increased by a factor 4 relative to theOtt et al. (2007) value estimated from EULINOX and othermid-latitude and subtropical storms. For the same model andperiod Martin et al. (2006) increased northern mid-latitudelightning NOx emissions by a factor 4 to fit aircraft obser-vations while tropical lightning NOx emissions remained un-changed. Furthermore, preliminary cloud-model results fromPickering et al. (2007) for the 4 February 2005 case suggestthat IC flashes in tropical thunderstorms in Brazil produceless LNOx (factor 1.6) compared with previous cloud-modelresults based on 5 mid-latitude and one subtropical thunder-storms. From our analyses of TROCCINOX data, we suggestthat mainly the different vertical wind shear in these regions(as it impacts the stroke length) may explain why differentLNOx production rates per stroke are needed in the models.
7 Summary and conclusions
During the TROCCINOX field experiment in southern Brazilin the wet season of 2005, lightning-produced NOx (LNOx)in and around tropical and subtropical thunderstorms was in-
vestigated in large detail with the DLR Falcon and partly withthe high-flying M55 Geophysica aircraft. On two selecteddays (4 and 18 February), enhanced NOx mixing ratios in therange of 0.2 to 1.2 nmol mol−1 (width 25–45 km) on averagewere observed during anvil penetrations at 9–11 km altitudes.The main part of this NOx enhancement, 80–90%, was at-tributed to LNOx while the contribution from the boundarylayer (BL) was in general less important (10–20%). Overall,NOx mixing ratios in the anvil outflow region were compa-rable in magnitude to those measured at mid-latitudes duringother campaigns (SH07), but distinctly lower than observedin fresh anvils during CRYSTAL-FACE over Florida,∼1–4 nmol mol−1 NO (Ridley et al., 2004).
A lightning detection network, LINET, was set up to mon-itor the local stroke distribution (here VLF sources), whichgenerally agreed well with observations from the operationallightning detection network in Brazil, RINDAT, and withobservations from LIS. The horizontal LNOx mass flux inTROCCINOX thunderstorms was estimated from the air-borne measurements and trajectory simulations, and com-bined with LINET stroke rates. The average LNOx produc-tion rate per stroke and per LIS flash were estimated. Thefinal results gave∼1 and∼2–3 kg per LIS flash for threetropical and one subtropical Brazilian thunderstorms, respec-tively, suggesting a higher LNOx production rate in the lat-ter storm type (factor∼2). The estimated LNOx productionrates were multiplied with the number of LIS flashes occur-ring globally, 44 flashes s−1. From these values, the mean an-nual global LNOx production rate was estimated to 1.6 and3.1 Tg a−1, respectively, from the two storm types mentionedabove. These values are well within the range of more recentestimates in SH07. The spread of the results for differentthunderstorms penetrations (1.3–3.9 Tg a−1), however, indi-cates a large variability. This variety mainly results from theextrapolation from single measurements in the anvil outflow,which depends on the aircraft position relative to the thun-derstorm core. The large uncertainty (∼320% relative max.error) in the estimates gives a final range of 0.4–12 Tg a−1.
The analyses from TROCCINOX indicate that the amountof nitrogen produced by lightning in a thunderstorm is notwell correlated with the number of strokes only. It is sug-gested, from laboratory findings by Wang et al. (1998), thatother lightning parameters such as stroke length, peak cur-rent and release height also necessarily have to be taken intoaccount. Wang et al. (1998) observed a positive correlationbetween NO production rates per m laboratory spark andstroke peak currents and ambient pressure, which was ap-plied to the present study. According to the first relation-ship, data from TROCCINOX indicate that the total amountof nitrogen produced by a thunderstorm mainly depends onthe number of strokes with peak currents>5 kA. The anal-yses from TROCCINOX further suggest that the reason forthe higher LNOx production rate in the subtropical thunder-storm of 18 February (factor∼2), compared with tropicalthunderstorms of 4 February, may be related to the different
Atmos. Chem. Phys., 8, 921–953, 2008 www.atmos-chem-phys.net/8/921/2008/

H. Huntrieser et al.: Lightning activity in Brazilian thunderstorms 949
stroke lengths (factor∼3 longer calculated for the subtropi-cal storm) and is not related to differences in the mean strokepeak current (slightly lower in the subtropical thunderstormcompared with the tropical thunderstorms). Furthermore, themean IC stroke height was∼0.5 km lower in the subtropicalthunderstorm, though this difference may cause only a minordifference in the LNOx production rate. From these results itwas suggested that the longer stroke length in the subtropicalthunderstorm may be related to the higher vertical wind shearbetween 200 and 700 hPa (factor∼2–3), spreading chargedparticles in the anvil over larger distances. We therefore sug-gest that the vertical wind shear may be an important pa-rameter influencing the amount of LNOx produced per flash,which has not been taken into account up to now. For fu-ture model studies with CTMs, we recommend the incor-poration of global meteorological fields of the vertical windshear to account for the different regional LNOx productionrates per stroke. Furthermore, for future field campaigns wesuggest using lightning location systems that determine theflash length more precisely (e.g. the French ONERA VHFinterferometric mapper or the New Mexico Tech LightningMapping Array, LMA).
In addition, a comparison between the lightning activity inTROCCINOX thunderstorms over Brazil and in mid-latitudethunderstorms over Germany was carried out, as measure-ments with the LINET system were available for both areasin 2005. The stroke frequency distribution as a function ofpeak current and the range of mean peak currents were ingeneral similar in Brazilian tropical thunderstorms and Ger-man mid-latitude thunderstorms. For a selected case, how-ever, it was estimated that the LNOx production rate perLINET stroke may be distinctly higher in intense Germanmid-latitude thunderstorms compared with tropical Brazil-ian thunderstorms in general (up to factor∼8), owing to thelonger stroke length (related to higher vertical wind shear)and the higher mean peak current in these storms.
Finally, the results from Brazilian thunderstorms duringTROCCINOX were compared with Florida thunderstormsduring CRYSTAL-FACE, where especially high anvil-NOmixing ratios and LNOx production rates per flash have beenobserved. Results from the available literature indicate thatseveral lightning parameters, such as flash density, meanpeak current and stroke length (related to UT wind velocity),all achieve especially high values in Florida thunderstormscompared with other regions, which we suggest may be re-sponsible for the high NO mixing ratios observed in Floridastorms.
We conclude that one advantage of the present study is theuse of a lightning location system where the whole spectraof peak currents down to∼1 kA can be detected. In addition,CG and IC strokes can be separated, and measurements withthe same system were performed in tropical, subtropical andmid-latitude regions. With this system new insights into theLNOx potential for different types of strokes are possible,but it has to be pointed out that the present study is based on
a very limited dataset containing few, random airborne pen-etrations of single subtropical and tropical thunderstorm sys-tems. Unfortunately, it is not known how representative thesemeasurements are. The main uncertainties originate from theestimate of mean anvil-NOx mixing ratios during few anvilpenetrations, and from the limited altitude range covered bythe aircraft. Also the attribution of the set of observed strokeevents (only strokes with peak currents≥10 kA considered)to the LNOx increase is very uncertain. Furthermore, thedata were obtained only from a small set of thunderstorm sys-tems over Germany and Brazil. Finally, the scaling betweenLINET and LIS observations is uncertain because only oneshort time segment was available to compare both systemsdirectly. Owing to these restrictions the uncertainties in thepresented results may be large and the stated generalisationsought to be used with caution. We are aware of the very lim-ited dataset presented in this paper, but with this paper wewould like to give a hint in which direction further researchconcerning measurements of LNOx in the field could take.Recently during AMMA (August 2006), the anvil outflowfrom African thunderstorms was probed with several aircraft.In addition, recent measurements in tropical thunderstormsover Australia (Darwin) from the SCOUT campaign in De-cember 2005 can be investigated in the same manner as pre-sented in this paper. During both field experiments lightningmeasurements were carried out with the LINET system.
Even though the majority of global lightning occurs in thetropics (Christian et al., 2003), our study suggests that sub-tropical and mid-latitude thunderstorms may contribute withan essential fraction to global LNOx, since we observe atendency that the stroke length (related to the vertical windshear) is longer in these storms. As a result, more LNOx maybe produced per stroke in these storms with elevated verticalwind shear compared with tropical low-shear thunderstormsas observed over Brazil. Finally, we would like to point outthat the estimated amount of LNOx produced per flash, asgiven in many studies (SH07), largely depends on the type oflightning detection system used and therefore these estimatesshould be compared more carefully in future. Furthermore,the relationship between the used lightning system and LISmust be known if the values are scaled up with the annualglobal LIS flash rate (44 s−1), as demonstrated in this paper.
Acknowledgements.TROCCINOX was partially funded by theCommission of the European Community under the contractEVK2-CT-2001-00122 and by the DLR (Deutsches Zentrumfur Luft- und Raumfahrt) and other TROCCINOX partners.TROCCINOX was performed as a coordinated action of Europeanand Brazilian research institutes and agencies together with theBrazilian project Tropical Convection and Cirrus ExperimentBrazil (TroCCiBras), see detailed acknowledgements in HH07.Furthermore, we are especially grateful to A. Minikin for hiscontribution to flight planning and his work as mission scien-tist on some of the flights, to A. Roiger, M. Lichtenstern andP. Stock (DLR-Oberpfaffenhofen) for instrument preparation, toC. Schwierz (ETH-Zurich) for meteorological support during the
www.atmos-chem-phys.net/8/921/2008/ Atmos. Chem. Phys., 8, 921–953, 2008

950 H. Huntrieser et al.: Lightning activity in Brazilian thunderstorms
field campaign and post-campaign meteorological analyses andto A. Stohl (NILU-Kjeller) for post-campaign meteorologicalanalyses and helpful comments on draft manuscripts. We thank theFalcon pilots (M. Grossrubatscher, D. Gunther, M. Hinterwaldnerand R. Welser), engineers and scientists of the flight departmentof DLR for the excellent support during the campaigns andthe Geophysica team (especially P. Mazzinghi, F. D’Amato andS. Viciani, INOA/CNR, for the CO measurements). Further, T. Fehr(DLR), the Brazilian IPMet team and K. Schmidt, B. Fuchs andW. P. Oettinger from the LINET team (University of Munich) aregreatly acknowledged for setting up and running the LINET systemin Brazil and Germany. We thank P. S. Borges (IPMet, Sao PaoloState University/UNESP, Bauru) for preparing the radar imagesfrom southern Brazil. We express our gratitude to the lightningteam at MSFC-NASA for the access to the LIS data. The EuropeanCentre for Medium Weather Forecasts (ECMWF) and the GermanWeather Service (DWD) are acknowledged for permitting accessto the ECMWF archives. Finally, we are especially grateful tothe two anonymous reviewers for their helpful comments, andto E. Defer (LERMA, Observatoire de Paris) and K. Pickering(NASA Goddard Space Flight Center Greenbelt) who criticallyreviewed draft manuscripts and gave insightful comments andhelpful suggestions for the data analysis.
Edited by: M. G. Lawrence
References
Barth, M. C., Kim, S.-W., Wang, C., et al.: Cloud-scale model inter-comparison of chemical constituent transport in deep convection,Atmos. Chem. Phys. Discuss., 7, 8035–8085, 2007,http://www.atmos-chem-phys-discuss.net/7/8035/2007/.
Barthe, C. and Pinty, J.-P.: Simulation of a supercellular stormusing a three-dimensional mesoscale model with an explicitlightning flash scheme, J. Geophys. Res., 112, D06210,doi:10.1029/2006JD007484, 2007.
Barthe, C., Pinty, J.-P., and Mari, C.: Lightning-produced NOx in anexplicit electrical scheme tested in a Stratosphere-TroposphereExperiment: Radiation, Aerosols, and Ozone case study, J. Geo-phys. Res., 112, D04302, doi:10.1029/2006JD007402, 2007.
Beirle, S., Platt, U., Wenig, M., and Wagner, T.; NOx production bylightning estimated with GOME, Adv. Space Res., 34, 793–797,2004.
Beirle, S., Spichtinger, N., Stohl, A., Cummins, K. L., Turner, T.,Boccippio, D., Cooper, O. R., Wenig, M., Grzegorski, M., Platt,U., and Wagner, T.: Estimating the NOx produced by lightningfrom GOME and NLDN data: a case study in the Gulf of Mexico,Atmos. Chem. Phys., 6, 1075–1089, 2006,http://www.atmos-chem-phys.net/6/1075/2006/.
Bertram, T. H., Perring, A. E., Wooldridge, P. J., et al.: Direct mea-surements of the convective recycling of the upper troposphere,Science, 315, 816–820, 2007.
Betz, H.-D., Schmidt, K., Oettinger, W. P., and Wirz, M.:Lightning detection with 3D-discrimination of intracloud andcloud-to-ground discharges, Geophys. Res. Lett., 31, L11108,doi:10.1029/2004GL019821, 2004.
Betz, H.-D., Schmidt, K., Fuchs, B., Oettinger, W. P., and Holler,H.: Cloud lightning: Detection and utilization for total lightning
measured in the VLF/LF regime, J. Lightning Res., 2, 1–17,http://www.jorl.org., 2007a.
Betz, H.-D., Schmidt, K., Laroche, P., Blanchet, P., Oettinger W.P., and Defer, E.: LINET - A New Lightning Detection Networkin Europe, 13th Int. Conf. on Atmospheric Electricity, Beijing,13–18 August 2007b.
Boccippio, D. J., Koshak, W. J., and Blakeslee, R. J.: Performanceassessment of the tropical transient detector and lightning imag-ing sensor. Part I: Predicted diurnal variability, J. Atmos. OceanicTechnol., 19, 1318–1332, 2002.
Boersma, K. F., Eskes, H. J., Meijer, E. W., and Kelder, H. M.:Estimates of lightning NOx production from GOME satellite ob-servations, Atmos. Chem. Phys., 5, 2311–2331, 2005,http://www.atmos-chem-phys.net/5/2311/2005/.
Bogel, W. and Baumann, R.: Test and calibration of the DLR Fal-con wind measuring system by maneuvers, J. Atmos. OceanicTechnol., 8, 5–18, 1991.
Bradshaw, J., Davis, D., Grodzinsky, G., Smyth, S., Newell, R.,Sandholm, S., and Liu, S.: Observed distributions of nitrogen ox-ides in the remote free troposphere from the NASA global tropo-spheric experiment programs, Rev. Geophys., 38, 61–116, 2000.
Brook, M., Nakano, M., Krehbiel, P., and Takeuti, T: The electri-cal structure of the Hokuriku winter thunderstorms, J. Geophys.Res., 87, 1207–1215, 1982.
Carey, L. D., Murphy, M. J., McCormick, T. L., and Demetriades,N. W. S.: Lightning location relative to storm structure in aleading-line, trailing-stratiform mesoscale convective system, J.Geophys. Res., 110, D03105, doi:10.1029/2003JD004371, 2005.
Carey, L. D. and Buffalo, K. M.: Environmental control of cloud-to-ground lightning polarity in severe storms, Mon. Weather Rev.,135, 1327–1353, 2007.
Chaboureau, J.-P., Cammas, J.-P., Duron, J., Mascart, P. J., Sitnikov,N., and Voessing, H.-J.: A numerical study of tropical cross-tropopause transport by convective overshoots, Atmos. Chem.Phys., 7, 1731–1740, 2007,http://www.atmos-chem-phys.net/7/1731/2007/.
Chameides, W. L.: The role of lightning in the chemistry of theatmosphere, in The Earth’s Electrical Environment, pp. 70–77,Nat. Acad. Press, Washington, D.C., 1986.
Chameides, W. L., Davis, D. D., Bradshaw, J., Rodgers, M., Sand-holm, S., and Bai, D. B.: An estimate of the NOx productionrate in electrified clouds based on NO observations from theGTE/CITE 1 fall 1983 field operation, J. Geophys. Res., 92,2153–2156, 1987.
Chowdhuri, P., Anderson, J. G., Chisholm W. A., et al.: Parame-ters of lightning strokes: A Review, IEEE Transactions on PowerDelivery, 20(1), 346–358, 2005.
Christian, H. J., Blakeslee, R. J., Goodman, S. J., et al.: The Light-ning Imaging Sensor, Proceedings of the 11th International Con-ference on Atmospheric Electricity, Guntersville, Alabama, 7–11June 1999, 746–749, 1999.
Christian, H. J., Blakeslee, R. J., Boccippio, D. J., et al.: Globalfrequency and distribution of lightning as observed from spaceby the Optical Transient Detector, J. Geophys. Res., 108, 4005,doi:10.1029/2002JD002347, 2003.
Christian, H. J. and Petersen, W.: Global lightning activity, Con-ference on Meteorological Applications of Lightning Data, 85thAMS Annual Meeting, San Diego, CA, 10–12 January 2005.
Cooper, O. R., Stohl, A., Trainer, M., et al.: Large upper tropo-
Atmos. Chem. Phys., 8, 921–953, 2008 www.atmos-chem-phys.net/8/921/2008/

H. Huntrieser et al.: Lightning activity in Brazilian thunderstorms 951
spheric ozone enhancements above mid-latitude North Americaduring summer: In situ evidence from the IONS and MOZAICozone measurement network, J. Geophys. Res., 111, D24S05,doi:10.1029/2006JD007306, 2006.
Coppens, F., Berton, R., Bondiou-Clergerie, A., and Gallimberti, I.:Theoretical estimate of NOx production in lightning corona, J.Geophys. Res., 103, 10 769–10 785, 1998.
Cummins, K. L., Murphy, M. J., Bardo, E. A., Hiscox, W. L., Pyle,R. B., and Pifer, A. E.: A combined TOA/MDF technology up-grade of the U.S. National Lightning Detection Network, J. Geo-phys. Res., 103, 9035–9044, doi:10.1029/98JD00153, 1998.
Cummins, K., Cramer, J. A., Biagi, C. J., Krider, E. P., Jerauld,J., Uman, M. A., and Rakov, V. A.: The U.S. national light-ning detection network: post-upgrade status, The 86th AMS An-nual Meeting, 2nd Conference on Meteorological Applicationsof Lightning Data, Paper 6.1, 28 January–3 February 2006, At-lanta, GA, 2006.
DeCaria, A. J., Pickering, K. E., Stenchikov, G. L., Scala, J. R.,Stith, J. L., Dye, J. E., Ridley, B. A., and Laroche, P.: Acloud-scale model study of lightning-generated NOx in an indi-vidual thunderstorm during STERAO-A, J. Geophys. Res., 105,11 601–11 616, 2000.
DeCaria, A. J., Pickering, K. E., Stenchikov, G. L., and Ott, L.E.: Lightning-generated NOx and its impact on troposphericozone production: A three-dimensional modelling study ofa Stratosphere-Troposphere Experiment: Radiation, Aerosols,and Ozone (STERAO-A) thunderstorm, J. Geophys. Res., 110,D14303, doi:10.1029/2004JD005556, 2005.
Defer, E., Laroche, P., Dye, J. E., and Skamarock, W.: Use of to-tal lightning lengths to estimate NOx production in a Coloradothunderstorm, paper presented at 12th International Conferenceon Atmospheric Electricity, 9–13 June, Int. Comm. on Atmos.Electr., Versailles, France, 2003.
Del Genio, A. D., Yao, M.-S., and Jonas, J.: Will moist convec-tion be stronger in a warmer climate?, Geophys. Res. Lett., 34,L16703, doi:10.1029/2007GL030525, 2007.
Dickerson, R. R., Huffman, G. J., Luke, W. T., et al.: Thunder-storms: An important mechanism in the transport of air pollu-tants, Science, 235, 460–465, 1987.
Doswell III, C. A.: Severe Convective Storms, Meteorol. Monogr.Ser., vol. 28(50), 570 pp., Am. Meteorol. Soc., Boston, Mass.,USA, 2001.
Dye, J. E., Ridley, B. A., Skamarock, W., et al.: An overview ofthe Stratospheric-Tropospheric Experiment: Radiation, aerosols,and ozone (STERAO)-Deep convection experiment with resultsfor the July 10, 1996 storm, J. Geophys. Res, 105, 10 023–10 045, 2000.
Engholm, C. D., Williams, E. R., and Dole R. M.: Meteorologi-cal and electrical conditions associated with positive cloud-to-ground lightning, Mon. Weather Rev., 118, 470–487, 1990.
Fehr, T., Holler, H., and Huntrieser, H.: Model study on pro-duction and transport of lightning-produced NOx in an EU-LINOX supercell storm, J. Geophys. Res., 109, D09102,doi:10.1029/2003JD003935, 2004.
Gallardo, L. and Cooray, V.: Could cloud-to-cloud discharges beas effective as cloud-to-ground discharges in producing NOx?,Tellus, 48B, 641–651, 1996.
Garrett, T. J., Navarro, B. C., Twohy, C. H., et al.: Evolution of aFlorida cirrus anvil, J. Atmos. Sci., 62, 2352–2372, 2005.
Gilmore, M. S. and Wicker, L. J.: Influences of the local environ-ment on supercell cloud-to-ground lightning, radar characteris-tics, and severe weather on 2 June 1995, Mon. Weather Rev.,130, 2349–2372, 2002.
Hauf, T., Schulte, P., Alheit, R., and Schlager, H.: Rapid verticaltrace gas transport by an isolated mid-latitude thunderstorm, J.Geophys. Res., 100, 22 957–22 970, 1995.
Hill, R. D.: Interpretation of bipole patterns in a mesoscale storm,Geophys. Res. Lett., 23, 643–645, 1988.
Holler, H., Finke, U., Huntrieser, H., Hagen, M., and Feigl, C.:Lightning produced NOx (LINOX) – Experimental design andcase study results, J. Geophys. Res., 104, 13 911–13 922, 1999.
Hudman, R. C., Jacob, D. J., Turquety, S., et al.: Surface and light-ning sources of nitrogen oxides in the United States: Magnitudes,chemical evolution, and outflow, J. Geophys. Res., 112, D12S05,doi:10.1029/2006JD007912, 2007.
Huntrieser, H., Schlager, H., Feigl, C., and Holler, H.: Transportand production of NOx in electrified thunderstorms: Survey ofprevious studies and new observations at mid-latitudes. J. Geo-phys. Res., 103, 28 247–28 264, 1998.
Huntrieser, H., Feigl, C., Schlager, H., Schroder, F., Gerbig, C.,van Velthoven, P., Flatøy, F., Thery, C., Petzold, A., Holler,H., and Schumann, U.: Airborne measurements of NOx, tracerspecies and small particles during the European Lightning Ni-trogen Oxides Experiment, J. Geophys. Res., 107(D11), 4113,doi:10.1029/2000JD000209, ACH 5-1–ACH 5-24, 2002.
Huntrieser, H., Heland, J., Schlager, H., et al.: Intercontinental airpollution transport from North America to Europe: Experimentalevidence from airborne measurements and surface observations,J. Geophys. Res., 110, D01305, doi:10.1029/2004JD005045,2005.
Huntrieser, H., Schlager, H., Holler, H., Schumann, U., Betz, H.-D.,Boccippio, D., Brunner, D., Forster, C., and Stohl, A.: Lightning-produced NOx in tropical, subtropical and mid-latitude thunder-storms: New insights from airborne and lightning observations,European Geosciences Union, General Assembly 2006, Vienna,Austria, 2–7 April 2006, Oral Paper Nr. EGU06-A-03286, Geo-phys. Res. Abstracts, vol. 8, 2006.
Huntrieser, H., Schlager, H., Roiger, A., Schumann, U., Holler, H.,Kurz, C., Brunner, D., Schwierz, C., Richter, A., and Stohl, A.:Lightning-produced NOx over Brazil during TROCCINOX: air-borne measurements in tropical and subtropical thunderstormsand the importance of mesoscale convective systems, Atmos.Chem. Phys., 7, 2987–3013, 2007,http://www.atmos-chem-phys.net/7/2987/2007/.
Jerauld, J., Rakov, V. A., Uman, M. A., Rambo, K. J., Jordan, D. M.,Cummins, K. L., and Cramer, J. A.: An evaluation of the perfor-mance characteristics of the U.S. National Lightning DetectionNetwork in Florida using rocket-triggered lightning, J. Geophys.Res., 110, D19106, doi:10.1029/2005JD005924, 2005.
Keenan, T. D. and Carbone, R. E.: A preliminary morphology ofprecipitation systems in tropical northern Australia, Q. J. Roy.Meteorol. Soc., 118, 283–326, 1992.
Koike, M., Kondo, Y., Kita, K., et al.: Measurements of reactivenitrogen produced by tropical thunderstorms during BIBLE-C, J.Geophys. Res., 112, D18304, doi:10.1029/2006JD008193, 2007.
Langford, A. O., Portmann, R. W., Daniel, J. S., Miller, H. L., andSolomon, S.: Spectroscopic measurements of NO2 in a Coloradothunderstorm: Determination of the mean production by cloud-
www.atmos-chem-phys.net/8/921/2008/ Atmos. Chem. Phys., 8, 921–953, 2008

952 H. Huntrieser et al.: Lightning activity in Brazilian thunderstorms
to-ground lightning flashes, J. Geophys. Res., 109, D11304,doi:10.1029/2003JD004158, 2004.
Lopez, J. P., Fridlind, A. M., Jost, H.-J., et al.: CO signatures in sub-tropical convective clouds and anvils during CRYSTAL-FACE:An analysis of convective transport and entrainment using ob-servations and a cloud-resolving model, J. Geophys. Res., 111,D09305, doi:10.1029/2005JD006104, 2006.
Lyons, W. A., Uliasz, M., and Nelson, T. E.: Large peak currentcloud-to-ground lightning flashes during the summer months inthe contiguous United States, Mon. Weather Rev., 126, 2217–2233, 1998.
Martin, R. V., Sioris, C. E., Chance, K., et al.: Evaluationof space-based constraints on global nitrogen oxide emis-sions with regional aircraft measurements over and downwindof eastern North America, J. Geophys. Res., 111, D15308,doi:10.1029/2005JD006680, 2006.
Martin, R. V., Sauvage, B., Folkins, I., et al.: Space-based con-straints on the production of nitric oxide by lightning, J. Geo-phys. Res., 112, D09309, doi:10.1029/2006JD007831, 2007.
Orville, R. E.: Peak-current variations of lightning return strokes asa function of latitude, Nature, 343, 149–151, 1990.
Orville, R. E.: Comments on “Large peak current cloud-to-groundlightning flashes during the summer months in the contiguousUnited States”, Mon. Weather Rev., 127, 1937–1938, 1999.
Orville, R. E. and Huffines, G. R.: Lightning ground flash mea-surements over the contiguous United States: 1995–1997, Mon.Weather Rev., 127, 2693–2703, 1999.
Orville, R. E., Huffines, G. R., Burrows, W. R., Holle, R. L., andCummins, K. L.: The North American lightning detection net-work (NALDN) – First results: 1998–2000, Mon. Weather Rev.,130, 2098–2109, 2002.
Ott, L. E., Pickering, K. E., Stenchikov, G. L., Huntrieser,H., and Schumann, U.: Effects of lightning NOx produc-tion during the July 21 European Lightning Nitrogen Ox-ides Project storm studied with a three-dimensional cloud-scalechemical transport model, J. Geophys. Res., 112, D05307,doi:10.1029/2006JD007365, 2007.
Petersen, W. A. and Rutledge, S. A.: Some characteristics of cloud-to-ground lightning in tropical northern Australia, J. Geophys.Res., 97, 11 553–11 560, 1992.
Petersen, W. A., Christian, H. J., and Rutledge, S. A.: TRMMobservations of the global relationship between ice watercontent and lightning, Geophys. Res. Lett., 32, L14819,doi:10.1029/2005GL023236, 2005.
Pickering, K. E., Thompson, A. M., Scala, J. R., Tao, W.-K., Dicker-son, R. R., and Simpson, J.: Free tropospheric ozone productionfollowing entrainment of urban plumes into deep convection, J.Geophys. Res., 97, 17 985–18 000, 1992.
Pickering, K. E., Thompson, A. M., Wang, Y., et al.: Convec-tive transport of biomass burning emissions over Brazil duringTRACE A, J. Geophys. Res., 101, 23 993–24 012, 1996.
Pickering, K. E., Wang, Y., Tao, W.-K., Price, C., and Muller, J.-F.: Vertical distributions of lightning NOx for use in regional andglobal chemical transport models, J. Geophys. Res., 103, 31 203–31 216, 1998.
Pickering, K. E., Huntemann, T., Ott, L., Barth, M., Huntrieser, H.,Schlager, H., Schumann, U., Vaughan, G., and Volz-Thomas, A.:Cloud-resolved simulations of lightning-NOx in observed trop-ical thunderstorms, European Geosciences Union, General As-
sembly 2007, Vienna, Austria, 15–20 April 2007, Oral Paper Nr.EGU2007-A-11013, Geophys. Res. Abstr., vol. 9, 2007.
Pierce, E. T.: The development of lightning discharges, Q. J. Roy.Meteor. Soc., 81, 229–240, 1955.
Pinto, I. R. C. A. and Pinto Jr., O.: Cloud-to-ground lightning dis-tributions in Brazil, J. Atmos. Solar-Terr. Phys., 65, 733–737,2003.
Pinto Jr., O., Pinto, I. R. C. A., and Naccarato, K. P.: Maximumcloud-to-ground lightning flash densities observed by lightninglocation systems in the tropical region: A review, Atmos. Res.,84, 189–200, 2007.
Price, C., Penner, J., and Prather, M.: NOx from lightning: 1. Globaldistribution based on lightning physics, J. Geophys. Res., 102,5929–5941, 1997.
Prentice, S. A. and Mackerras, D.: The ratio of cloud to cloud-ground lightning flashes in thunderstorms, J. Appl. Meteorol.,16, 545–550, 1977.
Rahman, M., Corray, V., Rakov, V. A., Uman, M. A., Liyanage, P.,DeCarlo B. A., Jerauld, J., and Olsen III, R. C.: Measurementsof NOx produced by rocket-triggered lightning, Geophys. Res.Lett., 34, L03816, doi:10.1029/2006GL027956, 2007.
Rakov, V. A., Thottapillil, R., and Uman, M. A.: On the empiricalformula of Willett et al. relating lightning return-stroke peak cur-rent and peak electric field, J. Geophys. Res., 97, 11 527–11 533,1992.
Ray, P. S, MacGorman, D. R., Rust, W. D., Taylor, W. L., and Ras-mussen, L. W.: Lightning location relative to storm structure ina supercell storm and a multicell storm, J. Geophys. Res., 92,5713–5724, 1987.
Ridley, B. A., Dye, J. E., Walega, J. G., Zheng, J., Grahek, F. E.,and Rison, W.: On the production of active nitrogen by thunder-storms over New Mexico, J. Geophys. Res., 101, 20 985–21 005,1996.
Ridley, B. A., Ott, L., Pickering, K., et al.: Florida thunderstorms: Afaucet of reactive nitrogen to the upper troposphere, J. Geophys.Res., 109, D17305, doi:10.1029/2004JD004769, 2004.
Ridley, B. A., Pickering, K. E., and Dye, J. E.: Comments on theparameterization of lightning-produced NO in global chemistry-transport models, Atmos. Environ., 39, 6184–6187, 2005.
Rutledge, S. A. and MacGorman, D. R.: Cloud-to-ground lightningactivity in the 10–11 June 1985 mesoscale convective system ob-served during the Oklahoma-Kansas PRE-STORM project, Mon.Weather Rev., 116, 1393–1408, 1988.
Schmidt, K., Betz, H.-D., Oettinger, W. P., Wirz, M., and Diendor-fer, G.: A new lightning detection network in southern Germany,27th International Conference on Lightning Protection (ICLP),September 2004, Avignon, France, 2004.
Schmidt, K., Betz, H.-D., Oettinger, W. P., Wirz, M., Pinto Jr., O.,Naccarato, K. P., Holler, H., Fehr, T., and Held, G.: A com-parative analysis of lightning data during the EU-Brazil TROC-CINOX/TroCCiBras campaign, VIII International Symposiumon Lightning Protection (SIPDA), 21–25 November 2005, SaoPaulo, Brazil, 2005.
Schmidt, K.: Ortung und Analyse von Blitzentladungen mittelsRegistrierung von VLF-Atmospherics innerhalb eines Mess-netzes, Ph.D. thesis, Ludwig-Maximilians-Universitat, Munich,Germany, 2007.
Schmidt, K., Betz, H.-D., Fuchs, B., Meyer, V., Laroche, P.,Blanchet, P., Oettinger, W. P., and Defer, E.: Detection of low-
Atmos. Chem. Phys., 8, 921–953, 2008 www.atmos-chem-phys.net/8/921/2008/

H. Huntrieser et al.: Lightning activity in Brazilian thunderstorms 953
amplitude lightning with LINET in Europe, 13th Int. Conf. onAtmospheric Electricity, Aug. 13-18, Beijing, 2007.
Schulz, W., Cummins, K., Diendorfer, G., and Dorninger, M.:Cloud-to-ground lightning in Austria: A 10-year study using datafrom a lightning location system, J. Geophys. Res., 110, D09101,doi:10.1029/2004JD005332, 2005.
Schumann, U., Konopka, P., Baumann, R., Busen, R., Gerz, T.,Schlager, H., Schulte P., and Volkert, H.: Estimate of diffusionparameters of aircraft exhaust plumes near the tropopause fromnitric oxide and turbulence measurements, J. Geophys. Res., 100,14 147–14 162, 1995.
Schumann, U., Huntrieser, H., Schlager, H., Bugliaro, L.,Gatzen, C., and Hoeller, H.: Nitrogen Oxides fromthunderstorms- Results from experiments over Europe and theContinental Tropics, paper presented at Deutsch-Osterreichisch-Schweizerische Meteorologen-Tagung (DACH), Deutsche Mete-orologische Gesellschaft, Karlsruhe, Germany, 7–10 September,2004.
Schumann, U. and Huntrieser, H.: The global lightning-induced ni-trogen oxides source rate, Atmos. Chem. Phys., 7, 3823–3907,2007,http://www.atmos-chem-phys.net/7/3823/2007/.
Skamarock, W. C., Dye, J. E., Defer, E., Barth, M. C., Stith,J. L., Ridley, B. A., and Baumann, K.: Observational-and modelling-based budget of lightning-produced NOx ina continental thunderstorm, J. Geophys. Res., 108, 4305,doi:10.1029/2002JD002163, 2003.
Stefanutti, L., MacKenzie, A. R., Santacesaria, V., et al.: The APE-THESEO Tropical Campaign: An overview, J. Atmos. Chem.,48, 1–33, 2004.
Steiger, S. M., Orville, R. E., and Carey, L. D.: Total lightningsignatures of thunderstorm intensity over North Texas. Part I:Supercells, Mon. Weather Rev., 135, doi:10.1175/MWR3472.1,2007a.
Steiger, S. M., Orville, R. E., and Carey, L. D.: Total light-ning signatures of thunderstorm intensity over North Texas. PartII: Mesoscale Convective Systems, Mon. Weather Rev., 135,doi:10.1175/MWR3483.1, 2007b.
Stohl, A., Forster, C., Eckhardt, S., Huntrieser, H., Heland, J.,Schlager, H., Aufmhoff, H., Arnold, F., and Cooper, O.: Abackward modelling study of intercontinental pollution trans-port using aircraft measurements, J. Geophys. Res., 108, 4370,doi:10.1029/2002JD002862, 2003a.
Stohl, A., Huntrieser, H., Richter, A., Beirle, S., Cooper, O., Eck-hardt, S., Forster, C., James, P., Spichtinger, N., Wenig, M., Wag-ner, T., Burrows, J., and Platt, U.: Rapid intercontinental air pol-lution transport associated with a meteorological bomb, Atmos.Chem. Phys., 3, 969–985, 2003b.
Stolzenburg, M., Marshall, T. C., Rust, W. D., et al.: Horizontaldistribution of electrical and meteorological conditions acrossthe stratiform region of a mesoscale convective system, Mon.Weather Rev., 122, 1777–1797, 1994.
Thery, C.: Evaluation of LPATS data using VHF interferometricobservations of lightning flashes during the Eulinox experiment,Atmos. Res., 56, 397–409, 2001.
Thomas, R. J., Krehbiel, P. R., Rison, W., Hamlin, T., Boccip-pio, D. J., Goodman, S. J., and Christian, H. J.: Comparisonof ground-based 3–dimensional lightning mapping observationswith satellite-based LIS observations in Oklahoma, Geophys.Res. Lett., 27, 1703–1706, 2000.
Thompson, A. M., Tao, W.-K., Pickering, K. E., Scala, J. R., andSimpson, J.: Tropical deep convection and ozone formation,Bull. Am. Meteorol. Soc., 78, 1043–1054, 1997.
Uman, M. A., McLain, D. K., and Krider, E. P.: The electromag-netic radiation from a finite antenna, Am. J. Phys., 43, 33–38,1975.
Wacker, R. S. and Orville, R. E.: Changes in measured lightningflash count and return stroke peak current after the 1994 U.S.National Lightning Detection Network upgrade: 1. Observation,J. Geophys. Res., 104, 2151–2157, 1999.
Wang, Y., DeSilva, A. W., and Goldenbaum, G. C.: Nitric oxideproduction by simulated lightning: Dependence on current, en-ergy, and pressure, J. Geophys. Res., 103, 19 149–19 159, 1998.
Wiens, K. C., Rutledge, S. A., and Tessendorf, S. A.: The 29 June2000 supercell observed during STEPS. Part II: Lightning andcharge structure, J. Atmos. Sci., 62, 4151–4177, 2005.
WMO: Scientific Assessment of Ozone Depletion: 1994, WorldMeteorological Organization Global Ozone Research and Moni-toring Project, Report No. 37, 1995.
Zhang, X. J., Helsdon, J. H., and Farley, R. D.: Numerical modelingof lightning-produced NOx using an explicit lightning scheme:1. Two-dimensional simulations as a “proof of concept”, J. Geo-phys. Res., 108, 4579, doi:10.1029/2002JD003224, 2003.
www.atmos-chem-phys.net/8/921/2008/ Atmos. Chem. Phys., 8, 921–953, 2008