Embed Size (px)
Citation preview

Australasian Transport Research Forum 2013 Proceedings 2 - 4 October 2013, Brisbane, Australia
Publication website: http://www.patrec.org/atrf.aspx
1
Light Rail in Australia – Performance and Prospects Prof Graham Currie1, Dr Matthew Burke2
1 Institute of Transport Studies, Monash University, Clayton, VIC, 3800 2Urban Research Program, Griffith University, 170 Kessels Road, Nathan, QLD, 4111
Email for correspondence: [email protected]
Abstract Following a decade of heavy investment in busways, most notably in cities such as Brisbane, light rail has re-emerged as an inner-city transit investment for many Australian cities. In the next decade Australian light rail network size is expected to grow by about a quarter with new routes on the Gold, Coast, Sydney, Canberra and Perth. Analysis shows that Australian light rail is dominated by the substantial Melbourne streetcar network, which is one of the largest in the world. Although light rail has not expanded much in terms of network size over the last decade, ridership growth has been substantial (+46% between 2001-2 and 2011-12) and well above system-wide (all mode) public transport ridership growth in most cities. In general, service levels on Australian trams are low compared to European and North American systems. Also service levels have not kept pace with ridership growth, acting to increase the ridership productivity of most Australian light rail over the last decade. Melbourne leads Australia in terms of ridership productivity (passengers per vehicle kms) and Melbourne tram route 109 has the highest light rail route ridership in Australia (935K p.a.) and the highest ridership effectiveness (11.5 boardings per vehicle km). While the contemporary history of light rail planning has focussed on what might be termed the ‘streetcar struggle’, medium term plans for new system development see light rail as a solution for urban access, urban redevelopment and the provision of reliable and higher capacity in congested inner urban contexts.
1. Introduction Transport in Australian cities was once dominated by trams; in 1945 almost 70% of passenger kms in Australian cities were made by public transport and 53% of public transport boardings were made by tram (e.g.BITRE 2013). Australians made over 1 billion trips annually by tram in 1945.
Funding shortfalls and automobile-centred transport planning saw the removal of most systems in the 1960s and 70s, except for Melbourne where an expansive system remained (now the world’s largest), and a single line in Adelaide. A new line in Sydney in 1997 along a disused freight corridor failed to attract much patronage or inspire other new developments for over a decade.
Today however there are signs of a new and significant change. One of the nation’s largest urban transport investments is a new Light Rail Transit (LRT) system for Gold Coast City, Adelaide has revamped and expanded its tram system into a modern light railway and Sydney, Canberra and Perth have advanced plans for new and expanded light rail systems.
In contemplating the reasons why and if trams/LRT1 are back on the agenda, it is important to understand what is actually happening, and how firm these new commitments to tram/LRT 1 Light Rail Transit (LRT) is usually used to describe modern low floor trams operating in a right of way separate from other vehicle traffic. Trams are generally considered to be older vehicles often with steps to access the cab. These tend to operate in on-street or “streetcar” contexts but can have some degree of segregated right of way. “Streetcar” operations have an on-street right of way track shared with private car and freight vehicle traffic.

2
actually are in the Australian context. This paper seeks to detail the current scope of tram/LRT usage, operations, planning and development in Australia, and to explore its future prospects. Two methods are employed to achieve these outcomes:
i) an audit of current system operations in Australian cities, looking back at changes and performance over the last 10-20 years, and
ii) a review of present developments and future planning across all Australian cities, looking to outline LRT’s future in Australia.
The paper is structured as follows; a review of available published literature on trams in Australia is presented next. This is followed by an overview of current Australian tram systems, their markets and operations and a review of contemporary trends in ridership performance. A review of system development plans and prospects is then presented. The paper concludes with a discussion of the implications of these findings for future light rail planning in Australia.
2. The Research Literature Because of its illustrious past, a great deal of published literature on trams in the Australian context focus on its historical development and decline. A plethora of historical books chart this path (e.g. Clark and Keenan 1977; Keenan 1979; Brimson 1983; Cooper 1993; Campbell 1999; Vines 2011) and a number of state and local historical associations have summarised historical trends on the internet (Railpage 2013). What these sources tell is a history of significant system growth and usage as Australian cities grow, followed by a tale of decline as car ownership and use takes over as the primary means of travel. Although most historical system development was over a century ago (between around 1861 and the 1940’s), it is worth remembering that the majority of inner-city residential and commercial development centred around tram systems (Brimson 1983). Trams were also seen to be highly innovative in adopting what was then considered advanced technologies such as electrification (Cross N et al. 1993).
There is a limited academic technical literature on Australian tram system performance and development and almost all of this has focussed on Melbourne. A series of research papers have charted Melbourne’s struggle to modernise its streetcar system into a modern tramway (e.g. Currie and Cliche 2008) a challenge shared by the world’s second largest streetcar system in Toronto, Canada (Currie and Shalaby 2007). Melbourne is identified as both the world’s largest operating light rail system (Currie and Smith 2006) but significantly also the largest streetcar system (with some 180kms of tram tracks located in the centre lanes of roads also shared by road traffic). This is reported to result in some of the slowest light rail systems in the world (average speeds identified at 15 kms/hour and falling due to increased traffic congestion (Currie and Cliche 2008) and also significant safety and access issues. Some 1,200 of Melbourne’s 1,800 tram stops are kerbside stops, where passengers wait at the kerb and cross busy roads to access vehicles. This results in some 38 to 53 pedestrian car accidents annually (Currie et al. 2011). Despite one of the largest low floor tram fleets in the world, most tram stops are not accessible for disabled people as a result of kerbside stops where boarding is from the road surface not at a platform. Indeed national mandated disability access legislation has been specifically amended to delay compliance for Melbourne trams (Currie and Smith 2006) due to the significant costs involved.
Australian tram research has focused on the identification, development and assessment of solutions to the Melbourne ‘streetcar problem’. Indeed, given the lack of published research of this type internationally, it is not unreasonable to suggest that Melbourne has led the world in developing approaches to deal with this issue. Melbourne trams have had Australia’s first and largest traffic signal priority systems for several decades (over 600 signals since the mid 1980’s, Currie 2006). However the system has been criticised for providing priority for trams that run early, acting to make them run even earlier (Currie and Shalaby 2008). Melbourne

Light Rail in Australia – Performance and Prospects
3
was the first city in the world to test the concept of the ‘dynamic fairway’ (termed intermittent bus lane for buses, Viegas and Lu 2001) where priority is only provided when trams are present. However a trial (on Toorak Road) was withdrawn due to poor performance in congested traffic (Currie and Lai 2008). Considerable benefits have been demonstrated with wider priority initiatives in Melbourne including part time tram lanes (Currie and Sarvi 2013). Melbourne has been the home to the original ‘hook turn’ traffic treatment for over 70 years. This provides benefits to trams in mixed traffic at intersections by relocating traffic turning right at intersections to the kerbside lane. This removes waiting right turning cars from the tram tracks. It has been shown to demonstrate tram operations and traffic safety benefits and also acts to makes general traffic movement work better in inner city contexts (Currie and Reynolds 2011).
A major program of platform stop development has been undertaken in Melbourne which has been shown to produce considerable safety benefits (Currie and Reynolds 2010; Currie et al. 2011) as well as improvements in tram operating speeds and reliability (Currie et al. 2012). This has included use of innovative new stop designs including the ‘easy access stop’ where the kerbside lane of a 2 lane road is raised to provide both a tram stop and a roadway, again demonstrating safety and operational benefits (Currie and Smith 2006; Currie and Reynolds 2010). However an innovative media program called ‘obey the yellow’ to educate and encourage car drivers to follow the road rules (to give priority to trams around yellow road marking lines) has been shown to have only modest impact because these road rules are hard to understand and remain a weak means of controlling driver behaviour around trams (Currie 2009).
Ridership performance of Australian trams has been the focus of one study with Australian systems found to demonstrate ridership about half the ridership per route km of European systems (433,820 vs. 879,754/ route km p.a.) and 26% below North American routes (433,820 vs 582,320/ route km p.a., Currie et al. 2011). The reasons for this are of interest in understanding the overall context of Australian light rail compared to international practices:
• Service levels (frequency and span of hours) are particularly low on Australian light rail; Australian trams operate an average of 64,260 vehicle trips per route p.a.. This is 32% below average European systems and 44% below North American systems. This is a particularly telling concern because service frequency was identified as one of the most influential ridership drivers in this research (Currie et al. 2011).
• Average speeds were found to be particularly low on average Australian tram routes (32% lower than average European services and 5% lower than North American routes).
• Stop spacing was notably short in Australia; an average of 279m between stops compared with 722m in Europe and 841m in North America. This is a particular legacy of the Melbourne Streetcar network and removing stops to increase stop spacing has been a major priority of the Melbourne operator (Cliche D and Reid 2009).
• The share of right of way which is segregated is particularly low on the average Australian tram route (24% compared to 54% in Europe and 39% in North America. This is again a legacy of the Melbourne streetcar network.
Interestingly the same study identified that Australian light rail operated in higher residential and commercial activity densities compared to average routes in Europe and North America. Australian systems were also found to have a higher share of integrated ticketing (96% of routes compared to 50% in Europe and 76% in North America). Integrated (transfer free) fares are known to encourage ridership on light rail (Hass-Klau and Crampton 2002). Barrier free, honour based (often termed proof of payment) ticketing systems have also been shown to be popular on light rail in improving ridership and reducing stop dwell time (no driver issued tickets) (Shalaby et al. 2007). However these ticketing approaches can also act to encourage higher fare evasion rates (Dauby and Kovacs 2006) and Melbourne trams

4
have been identified as having one of the highest reported fare evasion rates for light rail in the world (14.4% of trips in 2011-12, Victoran Auditor-General 2012).
3. Systems and Performance 3.1 Route network Figure 1 illustrates the route networks of tram and light rail services provided in Australia (April, 2013) using an at scale plan of the systems in Melbourne, Adelaide and Sydney (below) and a more detailed plan of the Melbourne network (top). All systems are radial to the central CBD area although Melbourne has two non-radial routes. Clearly the Australian systems are dominated by Melbourne with a total of 30 routes while Adelaide and Sydney have a single route each.
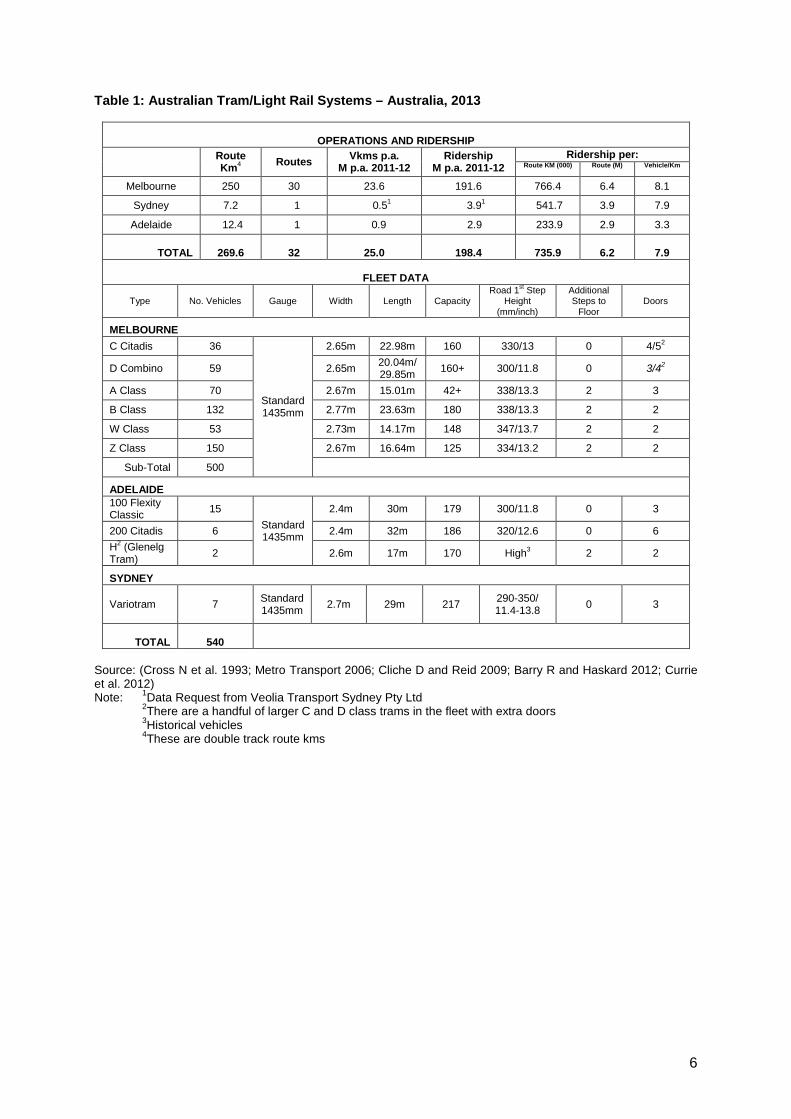
3.2 System operations and ridership Table 1 presents some overview data on current tram system scale and performance. Australia has 32 routes and a network of some 270kms and carries almost 200M passengers annually (2011-12). The Melbourne network dominates trams in Australia; it represents 93% of network kms, 95% of vehicle kms and 97% of ridership.
On average each tram route in Australia carries some 6.2M passengers annually or 736,000 riders per route km and 8 boardings per vehicle km. In ridership effectiveness terms, Melbourne routes perform better than those in both Sydney and Adelaide. Per route, Melbourne trams achieve 6.4M boardings annually compared to 3.89M in Sydney and 2.9M in Adelaide. Per vehicle km Melbourne is also highest (8.1) similar to Sydney (7.9) but Adelaide performs poorly (at 3.3 boardings/vkm). Overall average route length of a tram service in Australia is 9.3 kms.
Table 1 also suggests there are some 540 light rail vehicles in Australia and 10 vehicle classes. All use standard gauge tracks but have a wide range of vehicle dimensions. Only 107 trams/light rail vehicles (LRV) or 20% of the fleet are low floor with no step access (from a platform stop). Door numbers range from 2 to 6 per tram/LRV. Interesting the longest LRV’s are in Adelaide (the 100 Flexity Class at 30M and Alstom Citadis 302’s at 32m).

Light Rail in Australia – Performance and Prospects
5
Figure 1: Current (2013) Australian Light Rail Systems – Melbourne, Sydney and Adelaide
Note: Melbourne shown in detail (top), central business districts shaded (Bottom); recent extensions shown (dashed lines) for Adelaide and soon-to-open extension shown for Sydney.
6
Table 1: Australian Tram/Light Rail Systems – Australia, 2013
OPERATIONS AND RIDERSHIP
Route Km4 Routes Vkms p.a.
M p.a. 2011-12 Ridership
M p.a. 2011-12 Ridership per:
Route KM (000) Route (M) Vehicle/Km
Melbourne 250 30 23.6 191.6 766.4 6.4 8.1
Sydney 7.2 1 0.51 3.91 541.7 3.9 7.9
Adelaide 12.4 1 0.9 2.9 233.9 2.9 3.3
TOTAL
269.6
32
25.0
198.4
735.9
6.2
7.9
FLEET DATA
Type No. Vehicles Gauge Width Length Capacity Road 1st Step
Height (mm/inch)
Additional Steps to
Floor Doors
MELBOURNE C Citadis 36
Standard 1435mm
2.65m 22.98m 160 330/13 0 4/52
D Combino 59 2.65m 20.04m/ 29.85m 160+ 300/11.8 0 3/42
A Class 70 2.67m 15.01m 42+ 338/13.3 2 3
B Class 132 2.77m 23.63m 180 338/13.3 2 2
W Class 53 2.73m 14.17m 148 347/13.7 2 2
Z Class 150 2.67m 16.64m 125 334/13.2 2 2
Sub-Total 500
ADELAIDE 100 Flexity Classic 15
Standard 1435mm
2.4m 30m 179 300/11.8 0 3
200 Citadis 6 2.4m 32m 186 320/12.6 0 6 H2 (Glenelg Tram) 2 2.6m 17m 170 High3 2 2
SYDNEY
Variotram 7 Standard 1435mm 2.7m 29m 217 290-350/
11.4-13.8 0 3
TOTAL
540
Source: (Cross N et al. 1993; Metro Transport 2006; Cliche D and Reid 2009; Barry R and Haskard 2012; Currie et al. 2012) Note: 1Data Request from Veolia Transport Sydney Pty Ltd
2There are a handful of larger C and D class trams in the fleet with extra doors 3Historical vehicles 4These are double track route kms

Australasian Transport Research Forum 2013 Proceedings 2 - 4 October 2013, Brisbane, Australia
Publication website: http://www.patrec.org/atrf.aspx
7
Table 2: Australian Tram/Light Rail Route Data (Selected Major Routes)
Note: Major source for this is (Currie et al. 2011). Patronage and service data is for 2007, other major measures undertaken by an analysis in 2008/9.
Peak Direction Vehicle Trips
Effective Headway
(mins)
Average Scheduled
Peak Speed Incl Stopping
Residential Density
Employment Density
Car Ownership
2007 km % No % M No Mins Kph Boardings p.a. residents per square metre
Jobs per square metre
Cars/1,000 Residents
MELBOURNE1 - East Coburg - South Melbourne 840,000 13.4 5% 57 11% 240 15 8.0 16.6 14.3 7,100,000 8.5 529,851 3,877 10,431 408 3/3a - Melbourne University - East Malvern 780,000 14.8 14% 59 12% 256 11 10.9 15.7 12.1 3,900,000 5.0 263,514 3,914 8,275 445 5 - Melbourne University - Malvern 560,000 12.8 26% 48 21% 272 13 9.2 14.9 13.1 3,200,000 5.7 250,000 4,168 9,816 446 6 - Melbourne University - Glen Iris 750,000 12.9 2% 50 8% 263 12 10.0 14.5 12.5 4,700,000 6.3 364,341 3,811 10,012 450 8 - Moreland - Toorak 1,110,000 16.0 2% 61 5% 267 17 7.1 14.5 21.5 7,800,000 7.0 487,500 3,794 8,209 455 16 - Melbourne University - Kew via St Kilda Be 1,310,000 20.4 6% 83 7% 249 13 9.2 14.2 21.1 7,700,000 5.9 377,451 3,755 6,892 463 19 - North Coburg - City Elizabeth St 990,000 10.3 2% 41 2% 258 22 5.5 15.8 17.3 10,000,000 10.1 970,874 2,904 9,454 362 48 - North Balwyn - Victoria Harbour Docklands 1,030,000 15.1 15% 54 19% 285 16 7.5 17.3 16.4 6,000,000 5.8 397,351 2,768 7,918 486 55 - West Coburg - Domain Interchange 870,000 12.6 38% 45 18% 286 22 5.5 17.2 19.2 5,900,000 6.8 468,254 3,046 8,824 417 57 - West Maribyrnong - City Elizabeth St 890,000 11.7 8% 47 4% 255 22 5.5 16.0 19.2 5,100,000 5.7 435,897 2,659 9,342 401 59 - Airport West - City Elizabeth St 1,210,000 14.8 27% 60 20% 251 19 6.3 17.8 18.6 8,400,000 6.9 567,568 2,869 7,168 433 64 - Melbourne University - East Brighton 880,000 16.3 27% 64 19% 258 11 10.9 16.0 12.9 4,000,000 4.5 245,399 3,951 7,916 465 67 - Melbourne University - Carnegie 850,000 15.6 14% 69 10% 230 11 10.9 14.7 13.4 5,700,000 6.7 365,385 4,059 7,710 448 70 - Waterfront City Docklands - Wattle Park 970,000 15.9 20% 61 16% 265 13 9.2 15.4 15.5 4,400,000 4.5 276,730 2,425 7,841 508 72 - Melbourne University - Camberwell 980,000 17.0 4% 68 6% 254 10 12.0 14.7 13.3 5,000,000 5.1 294,118 3,466 7,955 482 75 - City (Spencer St) - Vermont South 1,490,000 22.9 36% 78 29% 298 15 8.0 18.0 21.8 8,500,000 5.7 371,179 2,921 6,514 501 78 - North Richmond - Prahran 380,000 7.3 1% 32 0% 234 11 10.9 15.1 6.7 1,700,000 4.5 232,877 5,107 3,345 470 79 - North Richmond - St Kilda Beach 7.3 6 20.0 16.2 3.4 - - - 82 - Moonee Ponds - Footscray 340,000 9.1 21% 31 13% 304 9 13.3 19.9 5.2 1,300,000 3.8 142,857 2,097 1,473 489 86 - Bundoora RMIT - Waterfront City Docklan 1,760,000 22.5 44% 72 33% 317 18 6.7 17.3 26.6 12,600,000 7.2 560,000 2,780 6,927 439 96 - East Brunswick - St Kilda Beach 1,140,000 14.0 40% 141 13% 100 17 7.1 17.0 16.5 13,100,000 11.5 935,714 3,733 11,405 405 109 - Box Hill - Port Melbourne 1,570,000 19.4 29% 67 34% 294 18 6.7 16.5 24.2 14,900,000 9.5 768,041 3,063 35,258 477 112 - West Preston - St Kilda 1,450,000 20.6 21% 144 8% 144 20 6.0 19.6 24.3 11,000,000 7.6 533,981 3,781 9,096 442
Note 1792 stop network wide in Currie Cliche (2007)Sub-Total 22,150,000 342.7 - 1,432 - - 15 8.1 16.3 369.3 152,000,000 6.9 443,537 - - -
Sub-Average 1,006,818 14.9 18% 65 14% 254 6,909,091 6.9 463,697 3,259 8,773 430 ADELAIDE Adelaide Glenelg Tram 772,861 12.4 89% 22 100% 564 12 10.0 33.1 12.9 2,572,000 3.3 207,419 2,000 1,950 550
SYDNEYSydney Light Rail 517,973 7.2 79% 13 100% 554 10 12.0 34.6 5.4 3,500,000 6.8 486,111 6,555 12,000 280
Total 24,447,652 377.2 - 1,467 - - - - - 387.6 158,072,000 6.5 419,067 - - -Average 976,701 14.5 24% 61 21% 279 14.5 9.1 17.7 15.5 6,586,333 6.7 454,481 3,340 8,629 429
Annual Route Ridership
(2007)
Performance Measures Catchment Characteristics (2008)Boardings
per Vehicle
Km
Boardings per Route
Km
Share Accessible
Stop Spacing
A.M. Peak 07:00-09:00Estimated
Peak Vehicle
Requirement
Route Name Service Kms p.a.
Route Length
Segregated Right of
Way
No. Stops

Australasian Transport Research Forum 2013 Proceedings 2 - 4 October 2013, Brisbane, Australia
Publication website: http://www.patrec.org/atrf.aspx
8
3.3. Tram route performance
Table 2 presents a series of summary data on the performance of major tram routes in Australia (only larger tram routes in Melbourne are included). This suggests the largest tram route in Australia in patronage terms is Route 109 in Melbourne which carried almost 15M passengers annually in 2007. Melbourne routes 96, 82, 112 and 19 all carry over 10M passengers p.a. Melbourne route 75 to Vermont South is Australia’s longest route (22.9 kms) while the Sydney light rail route is Australia’s shortest (7.2 kms). The Melbourne routes analysed in Table 2 have an average of only 18% of route kms segregated from traffic whilst Adelaide and Sydney have over 70% segregated. Stop spacing is very short in Melbourne (as low as 100m on route 96 and much longer in Sydney (554m) and Adelaide (564m).
The share of stops which were accessible is 100% in Adelaide and Sydney whilst an average of 14% were accessible on the Melbourne routes (at the time of analysis no stops on Melbourne route 78 were accessible). Average peak direction headways are 8 minutes for Melbourne routes, 10mins for Adelaide, and 12 mins for Sydney. Australia’s most frequent tram routes are Melbourne route 19, 55 and 57 with an average effective headway of 5.5mins. Average peak effective speeds in Melbourne are low (between 13.4 and 19.9 kph, average of routes is 16.3kph) whilst Sydney is 34.6 and Adelaide is 33.1. These patterns correlate well with slow streetcar operations and faster segregated right of way between systems.
In terms of service effectiveness, Melbourne route 96 achieves the highest boardings per vkm at 11.5. This route also has the highest boardings per route km (over 934,000 p.a.). The Adelaide Glenelg tram has the poorest service effectiveness performance of routes in Australia in terms of boardings per vkm (3.3) while Melbourne route 82 has the lowest boardings per route km (142,000 p.a./km). Route 82 is a non CBD radial route and one of the few cross corridor tram services in Australia. Its poor performance suggests radial services tend to carry more ridership.
Route catchment data suggests that Sydney light rail operates in the highest residential and employment densities while Melbourne route 109 has a very high residential density. Sydney’s light rail catchment also has the lowest car ownership context (280 vehicles /1,000 residents) whilst Adelaide light rail has the highest car ownership catchment (550 vehicles /1,000 residents).
4. Contemporary trends Figure 2 illustrates trends in light rail ridership and service supplied compared to city wide all mode public transport trends over the last 10 years. This suggests that light rail ridership has been particularly robust;
• Tram total ridership has increased by 46% between 2001-2 and 2011-12. Tram ridership increases have been greatest in Melbourne but some decline was apparent in Sydney between 2002 and 2007 and also between 2009 and 2011. Service levels have been adjusted in Sydney accordingly.
• While total tram ridership has increased by 46% city-wide, the public transport (all mode) ridership only increased by 9%.
• This result is slightly different by city; while Melbourne tram ridership increased by 46%, total system ridership increased by 53%. In Sydney, tram ridership growth has been particularly high (39%) compared to a Sydney system-wide ridership decline of 17%. In Adelaide tram ridership grew by 40% while system-wide ridership grew by only 8%.

Australasian Transport Research Forum 2013 Proceedings 2 - 4 October 2013, Brisbane, Australia
Publication website: http://www.patrec.org/atrf.aspx
9
Figure 2: Contemporary Trends in Australian Tram/Light Rail System Ridership and Service
Change in Tram Service and Ridership (2001-2=100) (2001-2=100)
Change in Tram vs Total City PT Ridership Change in Tram Service Effectiveness Boardings/ Vkms (2001-2=100)
Melbourne -Service
Sydney -Service
Adelaide - Service
Melbourne -Ridership
Sydney -Ridership
Adelaide -Ridership
80
90
100
110
120
130
140
150
160
170
180
Inde
x 200
1-2=
100
Year
Melbourne -Total
Sydney - Total
Adelaide - Total
Melbourne -Tram
Sydney - Tram
Adelaide - Tram
80
90
100
110
120
130
140
150
160
Inde
x 200
1-2=
100
Year
Melbourne
Sydney
Adelaide
70
80
90
100
110
120
130
140
150
160
Inde
x 200
1-2=
100
Year
Source Data
Year Melbourne Sydney Adelaide Total Melbourne Sydney Adelaide Total Melbourne Sydney Adelaide Total Melbourne Sydney Adelaide Total
2001-2 21.6 0.6 0.5 22.7 131.4 2.8 2.1 136.3 351.5 589.3 58.7 999.5 6.1 5.0 4.2 6.0 2002-3 22.0 0.6 0.5 23.1 134.7 2.6 2.1 139.4 358.7 570.8 60.1 989.6 6.1 4.6 4.2 6.0 2003-4 22.5 0.5 0.5 23.5 134.7 2.6 2.2 139.4 362.4 568.2 60.2 990.8 6.0 4.7 4.4 5.9 2004-5 21.9 0.5 0.5 22.9 135.9 2.5 2.1 140.5 364.4 565.5 61.2 991.1 6.2 5.1 4.3 6.1 2005-6 23.1 0.5 0.5 24.1 145.3 2.5 2.1 149.9 381.3 569.5 63.9 1,014.7 6.3 5.0 4.2 6.2 2006-7 23.1 0.5 0.5 24.1 154.9 2.7 2.4 159.9 418.5 572.4 65.0 1,055.9 6.7 5.4 4.6 6.6 2007-8 23.1 0.5 0.6 24.2 158.3 3.0 2.6 163.8 450.8 585.6 66.2 1,102.6 6.9 5.9 4.2 6.8 2008-9 23.3 0.5 0.7 24.4 175.1 2.9 2.6 180.6 479.5 607.6 67.5 1,154.6 7.5 6.0 3.9 7.4 2009-10 23.3 0.5 0.7 24.5 175.6 2.8 2.9 181.3 497.0 623.9 68.4 1,189.3 7.5 6.1 4.0 7.4 2010-11 23.6 0.5 0.9 24.9 182.7 2.7 3.2 188.6 517.7 617.1 66.0 1,200.8 7.7 6.0 3.7 7.6 2011-12 23.6 0.5 0.9 25.0 191.6 3.9 2.9 198.4 536.8 491.0 63.5 1,091.3 8.1 7.9 3.3 7.9
Service Effectiveness (Boardings per km)
Service Levels - Tram (M Vkms p.a.)
Ridership - Tram (M boardings p.a.)
All Mode Public Ttransport Ridership (M p.a.)
Performance Index - 2001-2=100
Year Melbourne Sydney Adelaide Total Melbourne Sydney Adelaide Total Melbourne Sydney Adelaide Total Melbourne Sydney Adelaide Total
2001-2 100 100 100 100 100 100 100 100 100 100 100 100 100 100 100 100 2002-3 102 100 100 102 103 94 100 102 102 97 102 99 101 93 100 101 2003-4 104 97 100 104 103 92 104 102 103 96 103 99 98 95 104 98 2004-5 101 89 100 101 103 91 101 103 104 96 104 99 102 102 101 102 2005-6 107 88 100 106 111 89 100 110 108 97 109 102 103 101 100 103 2006-7 107 87 105 106 118 95 114 117 119 97 111 106 110 109 110 110 2007-8 107 89 126 107 120 106 125 120 128 99 113 110 113 120 99 112 2008-9 108 86 136 108 133 103 127 133 136 103 115 116 124 120 93 123 2009-10 108 81 148 108 134 99 142 133 141 106 116 119 124 123 96 123 2010-11 109 82 175 110 139 98 152 138 147 105 112 120 127 120 87 126 2011-12 109 87 177 110 146 139 140 146 153 83 108 109 133 159 79 132
Service Effectiveness (Boardings per km)
Service Levels - Tram (M Vkms p.a.)
Ridership - Tram (M boardings p.a.)
All Mode Public Ttransport Ridership (M p.a.)

Australasian Transport Research Forum 2013 Proceedings 2 - 4 October 2013, Brisbane, Australia
Publication website: http://www.patrec.org/atrf.aspx
10
• In general service levels on trams however have not kept pace with ridership growth; nationally tram service levels increased by 10% while ridership grew by 46%. In Sydney tram service levels declined by 13% while ridership increased by 39%. In Melbourne service increased by 9% and ridership 46%.
• A very different service level/ridership pattern is shown in Adelaide. Service increased by 77% while ridership grew by 40%.
• The impact of these trends has been to improve the overall service effectiveness of light rail in Australia. National tram boardings/vkm have increased from 6.0 to 7.9, a 32% increase in productivity. Sydney light rail productivity improved most (+59% although there was some decline in 2003-4) and Melbourne second (+33%). Productivity measured as boardings per vkm have declined in Adelaide (by 21%) due to the large increase in service after 2006-7 and less than proportionate increase in ridership at this time.
Figure 3 illustrates contemporary trends in the volume and share of travel to work by tram in Australian cities based on census data. Data is index in the graphics to the census year 2001 (because the Sydney Light Rail was not operating when the 1996 census was undertaken. This enables comparison of Sydney data with other Light rail/tram systems in post 2001 census years). This data indicates that:
• As with total ridership, Melbourne tram dominates the volume of travel to work carrying 70,496 passengers in 2011 (much higher than tram usage in Sydney and Adelaide and higher that total all mode public transport work travel in Adelaide).
• The total volume of tram travel to work has consistently increased over the last 20 years. Since 2001, Adelaide work travel by tram has grown most (+284%) closely followed by Sydney (+240%) The growth in Melbourne tram commuting since 2001 is 59%.
• The volume of tram travel to work has grown at a higher rate than total work travel by public transport in all cases. However Adelaide and Sydney growth rate performance has again been highest.
• Tram commuting as a share of total city commuting (all modes including car) is highest in Melbourne at 3.4% (2011).
• Tram commuting as a share of total travel (all mode) has grown substantially in Adelaide and Sydney. In 2011 there was a slight decline in the share of commuting made by tram in Melbourne compared to 2001.
• For all Australian tram systems, the share of total commuting by tram has increased at a higher rate than public transport travel as a share of total travel. Again this effect has been highest in Adelaide and Sydney.
Overall these figures suggest a strong recovery is underway in existing tram and light rail systems. However from another perspective, improving performance of inner urban rail might be expected given increasing inner urban residential populations and strong employment and commercial growth in Australian city CBD’s. It is difficult to establish cause and effect: does LRT act to increase inner urban activity and hence ridership or is investment in inner urban light rail undertaken because this is where growing urban activity and development is occurring?
Melbourne dominates in terms of operations scale, ridership and mode share however the smaller single route systems in Adelaide and Sydney demonstrate much higher growth rates in ridership and mode share than Melbourne. Is this suggestive of a degree of ‘saturation’ of the large scale inner urban network in Melbourne? Perhaps larger growth rates in Adelaide/Sydney are caused by the very low/poor starting ridership levels. Certainly higher growth in Adelaide is at least partly explained by the route extension in 2007 and the upgrade of the vehicle fleet to modern low floor light rail vehicles. In this context plans and

Light Rail in Australia – Performance and Prospects
11
progress in service development may be a significant factor explaining contemporary and future service performance of trams/light rail in Australia.
Figure 3: Contemporary Trends in Tram and Total Public Transport Volume of Travel to Work and Share of Total Travel
Source: Analysis of ABS Census Journey to Work Survey (e.g. ABS (Australian Bureau of Statistics) 2001)
5. System Development – plans and progress 5.1 Proposed LRT expansions New systems in Perth, Canberra and the Gold Coast, and expansions in Adelaide and Sydney have been approved. A total of 30.6km of additional light rail track is currently being constructed across Australia, and another 46km has been approved (we have excluded the
Volume of Journey to Work Trips1996 2001 2006 2011 1996 2001 2006 2011
Melbourne Tram (2001=100) 36,585 44,371 55,799 70,496 82 100 126 159 Melbourne PT (2001=100) 142,745 164,171 192,413 256,407 87 100 117 156 Adelaide Tram (2001=100) 734 885 1,400 2,514 83 100 158 284 Adelaide PT (2001=100) 32,359 34,500 37,507 41,681 94 100 109 121 Sydney Tram (2001=100) 801 1,426 1,920 100 178 240 Sydney PT (2001=100) 305,363 343,692 297,684 362,611 89 100 87 106
Journey to Work Share of Total Travel1996 2001 2006 2011 1996 2001 2006 2011
Melbourne Tram (2001=100) 3.1% 3.4% 3.9% 3.4% 90 100 115 99 Melbourne PT (2001=100) 12.1% 12.7% 13.6% 12.4% 95 100 107 97 Adelaide Tram (2001=100) 0.2% 0.2% 0.3% 0.5% 88 100 143 227 Adelaide PT (2001=100) 8.7% 8.8% 8.7% 8.5% 100 100 99 96 Sydney Tram (2001=100) 0.1% 0.1% 0.1% 100 169 208 Sydney PT (2001=100) 21.2% 22.0% 18.1% 20.1% 96 100 82 92
Index 2001=100Values
Values Index 2001=100
Adelaide Tram
MelbourneTram
MelbourneAll Public Transport
AdelaideAll Public Transport
SydneyAll Public Transport
80
100
120
140
160
180
200
220
240
260
280
300
1996 2001 2006 2011
Tota
l Vol
ume
of Jo
urne
y to
Wor
k Ri
ders
(200
1=10
0)
Year
Change in the Volume of Journey to Work Trips by Mode (2001=100)
MelbourneTram
MelbourneAll PT
Adelaide Tram
AdelaideAll PT
SydneyAll PT
SydneyTram
80
100
120
140
160
180
200
220
240
1996 2001 2006 2011
Tota
l Sha
re o
f Jou
rney
to
Wor
k Ri
ders
of T
otal
Tra
vel (
2001
=100
)
Year
Change in the Share of Total Journey to Work Trips
by Mode (2001=100)

12
Adelaide extensions that have recently been put on hold). An at-scale plan of the proposed extensions is provided in Figure 4.
Figure 4: Routes for Light Rail System Expansion in Gold Coast, Sydney, Perth and Canberra
A 13km light rail system is under construction in the heart of Gold Coast City. The project runs north-south along a dense coastal corridor dominated by high-rise tourist accommodation, through commercial and retail centres before terminating at the city’s largest university campus and hospital. It stops short of connecting with the heavy rail line nearby though connection is proposed in the medium term. The majority of the route is on dedicated right-of-way but in two key commercial centres the route reverts to streetcar operations in mixed traffic. Notably, the system does not connect all the way through to the Gold Coast (heavy) rail line at Helensvale as originally planned, due to budget constraints, and will now require multiple modal interchanges for passengers travelling from Southport to/from Brisbane. The recently released Draft Gold Coast City Transport Strategy 2031 (Gold Coast City Council 2013) proposes significant further expansion of the light rail system, including links to heavy rail, and places it at the centre of the city’s transport and urban development future.

Light Rail in Australia – Performance and Prospects
13
Sydney is extending its current light rail line in the inner western suburbs another 5.6km further along a disused freight corridor. Nine new stops are being added. More recently announced, funding is being provided for the first lines through the central business district (CBD) and to the South Eastern suburbs (Transport NSW 2012). This 12km extension will run from near the city’s famous Opera House at Circular Quay past two football stadia with branches south to the main University of New South Wales campus and south east to a major hospital.
In Canberra, the Australian Capital Territory government has committed to the first stage of a new light rail system with a 12km line from the Civic central area to Gungahlin in the north. A further 42km of light rail is proposed to eventually provide four lines in the city, though planning for this has not yet passed beyond feasibility analysis.
Adelaide recently added to its modernised system with a short 2.8km extension to link in the city’s major Entertainment Centre and a major park’n’ride facility on the fringe of the city centre. However, a proposed US$35m extension further north-west towards Port Adelaide and Semaphore was put on hold by the South Australian government in 2012, with no timeframe provided for its construction.
Other Australian cities are exploring light rail as a possible investment option, including the Sunshine Coast, though they are not advanced to feasibility stage. Data items on the extensions proposed are provided in Table 3.
Table 3: Australian Tram/Light Rail Route Data (Selected Major Routes)
Route Name Indicative Cost (A$m)
Route length (km)
Segregated right-of-way
%
No. Stops Ave Stop
Spacing (m)
Estimated boardings
Under Construction
Gold Coast (opening 2014)
Broadbeach-Parkwood
1,000 13 99 16 812 50,000 per day by 2016
Sydney (opening 2014)
Lilyfield-Dulwich Hill
172 5.6 100 9 622 3,105 per weekday by
2016
Approved*
Perth
Perth-Mirrabooka
1,800 22 - 15 1,467 25,000 per day
Sydney CBD-UNSW/Prince
of Wales Hospital
1,600 12 - - - -
Canberra Civic-Gunghalin 614 12 - 15 800 - *The proposed Adelaide-Semaphore link is not included. The South Australian Government placed light rail expansion to Port Adelaide and Semaphore on hold indefinitely in 2012.
5.2 Rationale for approved LRT expansion The justification provided by government in each of these Australian cities for investing in light rail differs significantly including
• Clearance of busy central business district from bus congestion • Provide higher capacity for commuters • Provide the basis for urban residential and commercial land use re/development • Linking key educational and health facilities • Enabling last-kilometre city centre distribution of passengers.

14
On the Gold Coast, the light rail system is providing the first line-haul public transport corridor in the dense coastal core of the city. The project rationale has been specifically couched in terms of city building and urban development within the city without building more roads and adding to congestion (Translink et al. 2008).
In a similar manner, the Sydney light rail extension into the CBD and through to the university and hospital in the South East is proposed partly to remove bus movements and free up capacity for pedestrianisation and public transport in the central area. The south east extension is also proposed to provide for inner-city distribution of passengers arriving by heavy rail and other modes around the city centre, and to provide links to key education, sporting and health facilities (Transport for NSW 2013). By contrast, the touted benefits of the Sydney inner west expansion are more around improving basic public transport access between homes and work, and connections to key shopping, entertainment and public transport hubs (Transport for NSW 2013).
In Perth the stated objectives of their light rail scheme are to support urban transformation by providing high-capacity service and stimulating revitalisation and development in the corridor (Government of Western Australia 2013) and to provide access to educational, shopping, health and leisure facilities (WA Department of Transport 2013). In Canberra the proposed system is promoted as offering a way of integrated the dispersed urban development of the city with public transport.
6. Discussion and Conclusions Since 1997 with the development of Sydney’s first new route, light rail in Australia has represented some 270 route kms with only minor additions to network size in Adelaide and Melbourne. Planning and development of light rail in this time was focussed on modernising older streetcar systems. To some extent Australia has led this field internationally however progress has been slow and expensive.
Following a decade of heavy investment in busways, most notably in cities such as Brisbane (Currie and Delbosc 2010), light rail has re-emerged as an inner-city transit investment for many Australian cities. In 2013 two new light rail routes are under construction and represent an 18.6 km or about a 7% growth in national system size. A further 3 routes have been approved representing an additional 46 route kms or an additional 17% increase in system size. Including systems in construction, Australian light rail is likely to increase by almost a quarter in size in the next decade following a decade of only minor change.
Analysis has established that Australian light rail is dominated by the substantial Melbourne streetcar network which is one of the largest in the world. Although light rail has not expanded much in terms of network size over the last decade, ridership growth has been substantial (+46% between 2001-2 and 2011-12) substantively above system wide (all mode) public transport ridership growth in most cities. In general service levels on Australian trams are low compared to European and North American systems. Also service levels have not kept pace with ridership growth acting to increase the ridership productivity of most Australian light rail over the last decade. Melbourne leads Australia in terms of ridership productivity (passengers per vehicle kms) and Melbourne Tram route 109 has the highest light rail route ridership in Australia (935K p.a.) and the highest ridership effectiveness (11.5 boardings per vehicle km).
While the contemporary history of light rail planning has focussed on what might be termed the ‘streetcar struggle’, medium term plans for new system development see light rail as a solution for urban access, urban redevelopment and provision of reliable and higher capacity in congested inner urban contexts. Planners engaged in these developments would be well advised to heed the lessons of the Melbourne ‘streetcar struggle’ to free trams from the

Light Rail in Australia – Performance and Prospects
15
influence of congested traffic. It is appropriate that new light rail systems seek segregated rights of way to maximise reliability and capacity benefits.
The longer term future of light rail development in Australia is unclear. Statements made by the federal opposition parties, widely predicted to take power in September 2013, suggest no federal monies will be provided to support urban public transport in future (Ironside 2013). Light rail may not be prioritised by state and local governments if contributory funding from the Commonwealth ceases. The ACT government may find it difficult proceeding beyond stage one of Canberra’s light rail scheme. And the interest in similar investments being expressed by leaders on the Sunshine Coast and elsewhere could conceivably dissipate quickly.
This research has been limited to the use of archival materials and published plans. For future research, interviews with key planners or decision-makers may provide more detailed insight into why LRT is resurgent in Australian cities beyond the statements in published reports. Other key research needs include development of improved funding mechanisms, including possible use of value capture, in the Australian context, and pre- and post-construction evaluation of key new projects, especially the Gold Coast’s new system. The authors hope to contribute to this agenda.
Acknowledgements The authors would like to thank a number of people for assistance in completing this work. We would like to thank Alexa Delbosc for compiling some of the data used in the paper and both Alexa and Siti Amri for their GIS and mapping support. Our gratitude goes to Jonathan Metcalf and Matt Baynie of Veolia Transport Sydney, Frank Milthorpe and Bettina Pon of the NSW Bureau of Transport Statistics and Troy Sibbick and Ben Mulkerin of the South Australian Dept. of Planning, Transport and Infrastructure for access to tram performance data, and to Jason Ward of Goldlinq for data on Gold Coast Rapid Transit. The research was in part funded by an Australian Research Council Future Fellowship grant (project number FT120100976). The views expressed are the authors alone and do not represent the views of any organisation. The authors take full responsibility for any and all errors or omissions.
References ABS (Australian Bureau of Statistics) (2001). Census of Population and Housing: Basic Community Profiles: Victoria, Australian Bureau of Statistics.
Barry R and P. Haskard (2012). Adelaide's New Electric Multiple Units Adelaide's New Trams. Council of Australian Tramway Museums of Australia Conference. Adelaide, Australia.
BITRE (2013). Public transport use in Australia’s capital cities: Modelling and forecasting - Report 129. 'Department of Infrastructure and Transport'. Canberra, Australia, 'Bureau of Infrastructure, Transport and Regional Economics'.
Brimson, S. (1983). The Tramways of Australia. Dreamweaver Books.
Campbell, B. (1999). Getting there by Tram in Western Australia. Mt Lawley WA Perth Electric Tramway Society Inc.
Clark, H. and D. Keenan (1977). "Brisbane Tramways - The Last Decade", Transit Press, 1977 (Reprinted 1985).
Cliche D and S. Reid (2009). Growing Patronage – Think tram? 10th International Conference on Competition and Ownership in Land Passenger Transport. Hamilton Island, Australia.
Cooper, I. (1993). Hobart Tramways: A Centenary Commemorative Review. . Sydney, Australia, Transit Australia Publishing.

16
Cross N, Budd D and Wilson R (1993). Destination City - Melbourne's Electric Trams - 5th Edition. NSW Australia, Transit Australia Publishing.
Currie, G. (2006). Assessing Australian Transit Signal Priority Against World Best Practice. Australian Road Research Board National Conference. Canberra, Australia, ARRB.
Currie, G. (2009). "Improving Driver Compliance with Streetcar Transit Lanes Using a Public Education Campaign." Transportation Research Record Volume 2112 pp 62-69
Currie, G., A. Ahern and A. Delbosc (2011). "Exploring the drivers of light rail ridership: An empirical route level analysis of selected Australian, North American and European systems." Transportation Volume 38 No 3.
Currie, G. and D. Cliche (2008). ‘Transforming City Streets With Sustainable Transport Infrastructure – Melbourne Streetcar Regeneration’ Transportation Research Board Meeting Washington DC.
Currie, G. and A. Delbosc (2010). "Bus Rapid Transit in Australasia An Update on Progress." Built Environment 36(3): 328-343.
Currie, G., A. Delbosc and J. Reynolds (2012). "Modelling dwell time on Melbourne and Toronto streetcars." Transportation Research Record Vol No. 2275: pp. 22–29.
Currie, G. and H. Lai (2008). "Intermittent and Dynamic Transit Lanes: The Melbourne Experience." Transportation Research Record. Volume 2072: pp 49–56.
Currie, G. and J. Reynolds (2010). "Vehicle and Pedestrian Safety at Light Rail Stops in Mixed Traffic." Transportation Research Record Vol. 2146, pp. 26-34.
Currie, G. and J. Reynolds (2011). "Managing Trams and Traffic at Intersections with Hook Turns – Safety and Operational Impacts." Transportation Research Record No 2219 No 4( pp 10-19).
Currie, G. and M. Sarvi (2013). "Benchmarking the Secondary Benefits of Transit Priority." Transportation Research Record No 2276: pp 63-71.
Currie, G. and A. Shalaby (2007). "Success and Challenges in Modernising Streetcar Systems – Experience in Melbourne and Toronto." Transportation Research Record Volume 2006: pp 31-39
Currie, G. and A. Shalaby (2008). "Active Transit Signal Priority for Streetcars - Experience in Melbourne and Toronto." Transportation Research Record Volume 2042: pp 41–49.
Currie, G. and P. Smith (2006). "Innovative Design for Safe and Accessible Light Rail or Tram Stops Suitable for Streetcar-Style Conditions." Transportation Research Record Volume 1955: pp 37-46.
Currie, G., K. Tivendale and R. Scott (2011). "Analysis and Mitigation of Safety Issues at Curbside Tram Stops." Transportation Research Record: Journal of the Transportation Research Board 2219(1): 20-29.
Dauby, L. and Z. Kovacs (2006). Fare evasion in light rail systems. Joint International Light Rail Conference. St. Louis, Missouri: 230-246.
Gold Coast City Council (2013). Gold Coast City Transport Strategy 2031. Gold Coast, Queensland, Australia, GCCC.
Government of Western Australia. (2013, not available). "Light Rail." Get the Bigger Picture Retrieved 18 April 2013, 2013, from http://getthebiggerpicture.wa.gov.au/light-rail/.
Hass-Klau, C. and G. Crampton (2002). Future of urban Transport; Learning from Success and Weakness; Light Rail. Brighton, UK, Environment and Transport Planning.

Light Rail in Australia – Performance and Prospects
17
Ironside, R. (2013). Opposition leader Tony Abbott backtracks on 2010 election promise taking Brisbane cross river rail off list. The Courier Mail, News Corporation. 2013: online edition.
Keenan, D. (1979). Tramways of Sydney, Transit Press.
Metro Transport. (2006). "Technical Details and all that stuff... ." from http://www.metrotransport.com.au/Technical/LightRailTechSheet.pdf (Last Accessed March 2013).
Railpage. (2013). "Trams of Australia Homepage." April 2013, from http://www.railpage.org.au/tram/history.html. (Last Accessed March 2013).
Shalaby, A., A. Georgi, K. Ling, J. Sinikas and A. Salzberg (2007). “Evaluation of Proof-of-Payment and Multiple-Unit Operation in Different Streetcar Route Configurations”. 86th Annual Transportation Research Board Meeting. Washington D.C.
Translink, Gold Coast City Council and Queensland Transport (2008). Draft Concept Design and Impact Management Plan, Translink, GCCC and Queensland Transport.
Transport for NSW (2013). CBC and South East Light Rail Project. N. Government. Sydney, NSW, Transport for NSW.
Transport for NSW. (2013, 19 March 2013). "Inner West Light Rail Extension." Retrieved 19 April, 2013, from http://www.transport.nsw.gov.au/lightrail-program/inner-west-light-rail-extension.
Transport NSW (2012). Sydney's Light Rail Future: Expanding public transport, revitalising our city Sydney, NSW, State of New South Wales through the Director General of Transport for NSW: 28.
Victorian Auditor-General (2012). Fare Evasion on Public Transport. Melbourne, Australia, Victorian Auditor-Generals Office.
Viegas, J. and B. Lu (2001). "Widening the Scope for Bus Priority with Intermittent Bus Lanes." Transport Planning and Technology Vol 24: pp 87-110.
Vines, G. (2011). Melbourne Metropolitan Tramway Heritage Study. Melbourne, Australia, Heritage Victoria: http://www.dpcd.vic.gov.au/heritage/publications-and-research/thematic-and-typological-studies/tram-heritage-study (last accessed April 2013).
WA Department of Transport. (2013, 15 March 2013). "MAX: Metro Area Express." Retrieved 19 April 2013, 2013, from http://www.max.wa.gov.au/56.html.