Embed Size (px)
Citation preview

Electronic Supplementary Material (ESI) for Physical Chemistry Chemical Physics This journal is © The Royal Society of Chemistry 2015
S1
Electronic Supplementary Information
Ligand-exchange mechanism: new insight into solid-phase extraction of uranium based on a combined
experimental and theoretical study Yin Tian,a,b Jia Fu,b Yi Zhang,b Kecheng Cao,a Chiyao Bai,a Dongqi Wang,d Shoujian
Li,*,a Ying Xue,*,a Lijian Ma,*,a Chong Zheng*,c a College of Chemistry, Sichuan University, Chengdu 610064, People’s Republic of China b College of Physical Science and Technology, Sichuan University, Chengdu 610064, People’s Republic of China c Department of Chemistry and Biochemistry, Northern Illinois University, DeKalb, Illinois 60115, USA d CAS Key Laboratory of Nuclear Radiation and Nuclear Energy Techniques, and Institute of High Energy Physics, Chinese Academy of Sciences, Beijing 100049, China
Corresponding authors: [email protected]; [email protected]; [email protected]; [email protected]
1. Synthesis and characterization of solid-phase extractant: Urea-functionalized graphite oxide (Urea-GO) ........................................................................................ S2
1.1 Preparation of graphite oxide (GO) .......................................................... S2
1.2 Scanning electron microscope SEM ......................................................... S2
1.3 Fourier transform infrared (FT-IR) spectra ............................................... S3
1.4 X-ray photoelectron spectroscopy (XPS) measurements .......................... S4
1.5 The X-ray diffraction (XRD) ................................................................... S5
1.6 Elemental analysis (EA) .......................................................................... S6
2. The hydration sphere of uranyl ions and density functional theory (DFT) calculations. ............................................................................................................ S7
3. Density functional theory (DFT) calculations are used to explore coordinating atoms..................................................................................................................... S10
4. DFT calculations is used to investigate the mechanism of extraction.................. S11
4.1 Extraction reaction processes .................................................................... S12
Electronic Supplementary Material (ESI) for Physical Chemistry Chemical Physics.This journal is © the Owner Societies 2015

Electronic Supplementary Material (ESI) for Physical Chemistry Chemical Physics This journal is © The Royal Society of Chemistry 2015
S2
4.2 Natural bond orbital (NBO) analysis ......................................................... S14
4.3 The effect of nitrate ions on uranium extraction ........................................ S19
5. The uranium (VI) extraction experiments. ......................................................... S22
5.1 Effect of pH .............................................................................................. S22
5.2 Effect of contact time ............................................................................... S23
5.3 Effect of initial concentration ................................................................... S23
5.4 Effect of temperature ................................................................................ S24
References ............................................................................................................. S24
1. Synthesis and characterization of solid-phase extractant: Urea-functionalized graphite oxide (Urea-GO)
1.1 Preparation of graphite oxide (GO)
GO was synthesized from natural graphite powder using Hummers method.1 At first,
10g of graphite powder was added to 230mL of concentrated H2SO4. Then, about 30g
of KMnO4 was added gradually with stirring in an ice bath. The temperature of the
suspension was maintained below 10 °C. After removal of the ice-bath, the
suspension was stirred at room temperature for 30 min. Then distilled water (230 mL)
was slowly added to cause an increase in temperature to 98 °C and the suspension was
maintained at that temperature for 15 min. And then 100 mL of H2O2 was added to
the system before further dilution with plenty of distilled water (1.4 L). The solid
product was separated by centrifugation, and washed repeatedly with 5% HCl solution
until sulphate could not be detected with BaCl2, then washed with distilled water until
the pH of the washes becomes neutral and finally dried at 55 °C in vacuum.
1.2 Scanning electron microscope SEM
The morphologies of GO and its derivatives were studied using SEM as shown in
Figure S1. The pattern of GO shows a lamellar structure with a number of smooth
sheets stacking together (Figure S1a). While for di-isocyanate-functionalized graphite
oxide (iGO) and Urea-GO, the surface-covering sheets and the edges of sheets

Electronic Supplementary Material (ESI) for Physical Chemistry Chemical Physics This journal is © The Royal Society of Chemistry 2015
S3
gradually became rougher and thicker respectively after grafting with TDI (Figure
S1b) and subsequently modifying with ETA (Figure S1c).
Figure S1. SEM images of (a) GO, (b) iGO, (c) Urea-GO
1.3 Fourier transform infrared (FT-IR) spectra
For FT-IR characterization, the test sample is prepared according to following
procedure: firstly, transfer some KBr out of an oven (at a constant temperature of
100°C) into a mortar, add about 1 to 2 % of the GO-based solid sample, mix and grind
to a fine powder, then, the powder is tabletted using an infrared manual press to
obtain the FT-IR pellet.
FT-IR spectra of GO, iGO and Urea-GO are shown in Figure S2. Figure S2a
represents a typical FTIR spectrum of GO. The absorption band at 1728 cm−1 is
attributed to the stretching vibration of the C=O bond of carboxyl groups. The
stretching vibration of C–O–C and C–OH functional groups is observed at 1053 cm−1
and 1224 cm−1, respectively. The band at 1617 cm−1 is assigned to the deformation
vibrations of the adsorbed water molecules or the free hydroxyl groups.2−4
As shown in Figure S2b, after grafting TDI onto GO, the new band at 2274 cm−1
is attributed to the stretch of –NCO groups. The new band at 1643 cm−1 is attributed
to an amide carbonyl-stretching mode, and the band at 1542 cm−1 can originate from
carbamate esters and corresponds to the coupling of the C–N stretching vibration with
the CHN deformation vibration. The bands at 1597 cm−1 and 1448 cm−1 can be
assigned to benzene ring skeleton vibration. So it could be conjectured that the –NCO
groups of TDI are chemically grafted on GO sheets through carbamate esters
linkage.2,5

Electronic Supplementary Material (ESI) for Physical Chemistry Chemical Physics This journal is © The Royal Society of Chemistry 2015
S4
For Urea-GO (Figure S2c), after modification with ethanolamine, the –NCO
absorption band at 2274 cm−1 disappears. The band at 1641 cm−1 can be assigned to
NH–CO in urea and carbamate, and furthermore, the other absorption bands in Figure
2b retain unchanged which conforms the occurrence of chemical reaction between the
–NCO groups on iGO and the –NH2 groups of ETA. The data suggest that the desired
modification has been achieved. We must point out that the isocyanate groups react
with amines much faster than alcohols.6
The sample preparation process for FT-IR characterization: Firstly, the small
amount of solid material was mixed with potassium bromide (KBr, SP). And then, the
test sample was obtained by grinding and pressing.
Figure S2. FT-IR spectra of (a) GO, (b) iGO, (c) Urea-GO
1.4 X-ray photoelectron spectroscopy (XPS) measurements
The GO, Urea-GO and Urea-GO-U samples were characterized by XPS in Figure S3
(a). We can find three peeks, C 1S: 284–286 eV, N 1S: 399.4–401.7 eV, O 1S:
531.5–533.5 eV, U 4f: 375–400 eV. It is observed that content of nitrogen was
increased obviously after chemical modification, and the content of uranium was
appeared obviously after extraction experiments. The C1s XPS spectrum of GO
(Figure S3b) showed binding energies at 284.6 eV (C–C and C–H) , 286.6 eV ( C–OH
and C–O–C), 288.3 eV (O–C=O). In Figure S3c, The peak at 288.1 eV was attributed

Electronic Supplementary Material (ESI) for Physical Chemistry Chemical Physics This journal is © The Royal Society of Chemistry 2015
S5
to amide (N−C=O), and the peak at 289.2 eV to urea structure, both corresponded to
grafting of TDI and ETA.7−9
Figure S3. The X-ray photoelectron spectroscopy. (a) XPS survey spectra of (a-1) GO, (a-2) Urea-GO, (a-3) Urea-GO-U. (b) C 1s core-level spectra of GO is fitted with Gaussian-Lorentzian waveforms. (c) C 1s core-level spectra of Urea-GO is fitted with Gaussian-Lorentzian waveforms.
1.5 The X-ray diffraction (XRD)
Figure S4 shows the X-ray diffraction patterns of the pristine graphite (PG), GO and
Urea-GO. The PG shows a strong peak at 2θ = 26.60°, which indicates that the
average interlayer spacing of PG is 3.35 Å. But after chemical modification, the
characteristic 2θ peak of GO appearing at 10.10° corresponds to an average interlayer
spacing of 8.76Å. Compared to GO, the diffraction peak of the Urea-GO shifts toward
to a lower 2θ angle of 7.94° and, therewith, the interlayer spacing is increased to
11.13 Å due to presence of the urea groups between the sheets of the GO. This result

Electronic Supplementary Material (ESI) for Physical Chemistry Chemical Physics This journal is © The Royal Society of Chemistry 2015
S6
provides further support for the in situ assembly of the urea moieties to the interlayer
and surface of the GO sheets.5
Figure S4. The X-ray diffraction (XRD). XRD pattern of pristine graphite (PG), GO and Urea-GO.
1.6 Elemental analysis (EA)
Table S1 collects the results of the elemental analysis of the samples. An obvious
increase in N% from GO to iGO corresponds to the loading of TDI onto GO matrix.
About 2.79 mmol TDI per gram of iGO are calculated from the increment of N
content. From iGO to Urea-GO, the content of nitrogen continues to increase, which
suggests that ETA has been assembled successfully on iGO sheets as shown in Figure
1. The loading ratio of ETA could be calculated as 0.578 mmol g−1 on Urea-GO. The
results are in agreement with the outcome of the FTIR spectra.
Table S1. Elemental analysis of GO and its derivatives
Simple C% H% N%
GO 50.70 2.21 0.00
iGO 58.50 3.15 7.84
Urea-GO 57.40 3.97 8.37

Electronic Supplementary Material (ESI) for Physical Chemistry Chemical Physics This journal is © The Royal Society of Chemistry 2015
S7
2. The hydration sphere of uranyl ions and density functional theory (DFT) calculations. A clear understanding of uranyl speciation at high nitrate concentration solution is
very important because there are generally numerous nitrate ions in real nuclear
industry effluents.10,11 The crystal structure of UO2(NO3)2(H2O)2 reveals that the two
nitrates bind in a bidentate mode in the equatorial plane of the uranyl ions,12,13 and,
on the other hand, theoretical research also demonstrated that the uranyl species also
prefers this binding motif in nitrate solution.14
Therefore, the most practical solvation model should comprise the explicit
inclusion of waters in the first solvation sphere combined with continuum solvation
model for the remainder of the solvation sphere. 15 Now, uranyl pentahydrate
[UO2(H2O)5]2+ and uranyl nitrate dihydrate UO2(NO3)2(H2O)2 structures were
optimized at the B3LYP/6-31G(d)/RECP level of theory in gas phase (298.15 K, 0.1
MPa) and in aqueous solution (CPCM, UFF). The optimized structures of
[UO2(H2O)5]2+ and UO2(NO3)2(H2O)2 are shown in Figure S5. These results along
with other available experimental and theory data were shown in Table S4 and Table
S5 for comparison. To provide insight into the bonding nature of these species, NBO
analysis was performed at the same level of theory (Table S3). As reported in Table
S4 and Table S5, All optimized geometrical parameters agree well with both
experimental and theoretical data.
For the interaction between the uranyl hydrates ([UO2(H2O)5]2+) and nitrate ions
in the same adsorption system, the changes in enthalpy and the Gibbs free energy are
−169.84 and −184.97 kJ mol−1 (see Table S2), respectively, suggesting that the neutral
uranyl nitrate hydrates (UO2(NO3)2(H2O)2) is more stable than the charged uranyl
hydrate [UO2(H2O)5]2+. That is, nitrate ion, which acts as bidentate ligand in this case,
has much stronger coordination ability towards uranyl than water molecule. Therefore,
uranyl ion prefers to coordinate to the nitrate ion when nitrate ions exist in aqueous
reaction medium.16
Meanwhile, for uranyl nitrate hydrates (UO2(NO3)2(H2O)2), Shi et al.16 report only
one conformer like (1) in Figure S5(e), and other researcher don’t pay great attention
to the conformers of UO2(NO3)2(H2O)2. But we found that UO2(NO3)2(H2O)2 exists in
two different conformations, which are shown in Figure S5(e). The ∆H, ∆S and ∆G of

Electronic Supplementary Material (ESI) for Physical Chemistry Chemical Physics This journal is © The Royal Society of Chemistry 2015
S8
the (1)→(2) process in aqueous medium (in Table S2) indicate that this process is a
spontaneous exothermic process and (2) is the lower energy conformer. So, (2) is
more stability conformer.
Figure S5. The structure of uranyl ion in gas (298.15 K, 0.1 MPa) and in aqueous solution(CPCM). The optimized structures of the stationary points for uranyl hydrates ([UO2(H2O)5]2+) (a) in gas and (b) in aqueous solution obtained by the DFT calculations. (b) The optimized structures of the stationary points for uranyl nitrate hydrates (UO2(NO3)2(H2O)2) (c) in gas and (d) in aqueous solution obtained by the DFT calculations. (e) The optimized structures of two conformers for UO2(NO3)2(H2O)2 obtained by the DFT calculations.
Table S2. The changes in enthalpy (∆H, kJ mol−1), entropy (∆S, J mol−1 K−1), and gibbs free energy (∆G, kJ mol-1) for the process (a) →(b) and (1)→(2) in aqueous solu on (CPCM, UFF) at Figure S5.
reaction ∆H ∆S ∆G
[UO2(H2O)5]2+ + 2(NO3)−→[UO2(NO3)2(H2O)2] + 3H2O −169.84 50.77 −184.97
(1)→(2) −0.01 1.08 −0.42

Electronic Supplementary Material (ESI) for Physical Chemistry Chemical Physics This journal is © The Royal Society of Chemistry 2015
S9
Table S3. The NBO analysis of uranyl hydrates ([UO2(H2O)5]2+) and uranyl nitrate hydrates (UO2(NO3)2(H2O)2). The wiberg bond orders (WBOs) of U–O bonds and nature charges on uranium and oxygen atom in the aqueous solution (CPCM).
species U‒Oax U‒Owater U‒O1nitrate Q(U) Q(Oax) Q(Owater) Q(O1nitrate)
[UO2(H2O)5]2+ 2.210 0.433 – 1.802 −0.501 −0.876 ‒
UO2(NO3)2(H2O)2 2.178 0.410 0.461 1.477 −0.526 −0.860 −0.443
Table S4. The selected geometrical parameters of [UO2(H2O)5]2+ obtained by the DFT calculations in comparison with available experimental and theory data. The average bond lengths (Å) d(U–Oax), d(U–Owater) are described in Figure S6(a). The θ(Oax–U–Oax) denote the bond angle (degree) and the n(H2O)eq refers to the hydration number in the first solvation sphere (in the equatorial plane).
d(U–Oax) d(U–Owater) θ(Oax–U‒Oax) n(H2O)eq
Theory This work (in gas) 1.747 2.484 179.73 5
This work (in solution) 1.755 2.463 178.34 5
VASP (GGA) 17 1.82 2.43 174 5
Hartree-Fock 18 1.70 2.50 5
DFT (PBE96) 19 1.77 2.44 179.8 5
DFT (B3LYP) 20 1.787 2.424 5
DFT (B3LYP) 21 1.756 2.516 5
DFT (SVWN) 21 1.778 2.423 5
experiment HEXS 22 1.766 2.420 5
EXAFS 23 1.76 2.41 4.7
EXAFS 24 1.76 2.41 5.3
EXAFS 25 1.78 2.41 4.5±0.4
XRD 26 1.702 2.421 5
XRS 27 1.766 2.420 4/5
EXAFS 28 1.77 2.42 4.7
Table S5. The selected geometrical parameters of UO2(NO3)2(H2O)2 obtained by the DFT calculations in comparison with available experimental and theory data. The average bond lengths (Å) d(U‒Oax), d(U‒Owater), d(U‒O1nitrate), d(N‒O2nitrate) and d(N‒O1nitrate) are described in Figure S6(b).
d(U‒Oax) d(U‒Owater) d(U‒O1nitrate)
d(N‒O2nitrate) d(N‒O1nitrate)
theory This work (in gas) 1.766 2.541 2.473 1.204 1.289
This work (in solution) 1.768 2.521 2.486 1.209 1.285
Hartree-Fock29 1.72 2.49 1.20 1.31
experiment Neutron Diffraction12 1.76 2.40 2.53
Neutron Diffraction13 1.758 2.452 2.497 1.202 1.265
XRD30 1.75 2.39 2.53 1.22 1.27

Electronic Supplementary Material (ESI) for Physical Chemistry Chemical Physics This journal is © The Royal Society of Chemistry 2015
S10
3. Density functional theory (DFT) calculations are used to explore coordinating atoms the coordination ability of three possible coordinating atoms on Urea-GO, including
the hydroxylic oxygen atom, the double bond oxygen in urea and nitrogen atom in
urea, with uranyl hydrates ([UO2(H2O)5]2+) in aqueous solution were evaluated by
DFT calculations (reaction: [UO2(H2O)5]2+ + L → [UO2L(H2O)5-x]2+ + xH2O, x=1 for
oxygen and x=2 for nitrogen). The coordination structures are described in Figure S6.
The Wiberg bond orders (WBOs) and selected natural charges (Q) and changes in
atom charges (∆Q) in aqueous solution obtained by natural bond orbital (NBO)
analysis are listed in Table S6.

Electronic Supplementary Material (ESI) for Physical Chemistry Chemical Physics This journal is © The Royal Society of Chemistry 2015
S11
Figure S6. Searching for coordinating atom. The optimized coordinating structures of the uranyl with different coordinating atom in urea including (a-1) the nitrogen atom, (b-1) the hydroxylic oxygen atom and (c-1) the double bond oxygen which corresponds to three optimized urea conformers of the stationary points (a-2), (b-2) and (c-2). The important bond lengths for the extraction structures are also depicted.
Table S6. The NBO analysis of coordination structures in Figure S7. The Wiberg bond orders (WBOs) of chemical bonds between uranium and coordinating atom (U–(CA)), selected natural charges (Q) and changes in atom charges (∆Q) in the aqueous solution (CPCM, UFF) obtained by the B3LYP method
coordinating atom Q(CA) ∆Q (CA) ∆Q (U) U‒(CA)
nitrogen N1 −0.690 −0.034 0.079
0.340
nitrogen N2 −0.689 0.014 0.248
hydroxyl oxygen −0.777 0.065 −0.008 0.442
ketone oxygen −0.725 0.070 −0.098 0.699
Table S7. The steric-hindrance effect of ligand. The changes in enthalpy (∆H, kJ mol−1), entropy (∆S, J mol−1 K−1), and gibbs free energy (∆G, kJ mol−1) for the change in structures of urea from three stable conformers to coordinated structure of them in aqueous solution (CPCM, UFF) at Figure S6.
urea structure ∆H ∆S ∆G
comformer-1 (a-2) → coordinated structure in (a-1) 32.96 −14.53 37.29
comformer-2 (b-2) → coordinated structure in (b-1) 3.63 −11.54 7.07
comformer-3 (c-2) → coordinated structure in (b-1) 15.21 −20.28 21.25
4. DFT calculations is used to investigate the mechanism of extraction The alkyl phosphate ester (APE), such as tri-n-butyl phosphate (TBP),
n-octyl(phenyl)-N, N-diisobutyl-methylcarbamoyl phosphine oxide (CMPO), were
mostly employed in uranium LLE process at industrial scale (for example PUREX
process and so on).31 We investigated the interaction processes of the urea ligand on
the as-synthesized solid-phase extractant with uranyl ion using DFT calculations,
along with the trimethyl phosphate (TMP, which is similar to TBP, used for
simplifying the calculation)32,33 for comparison.

Electronic Supplementary Material (ESI) for Physical Chemistry Chemical Physics This journal is © The Royal Society of Chemistry 2015
S12
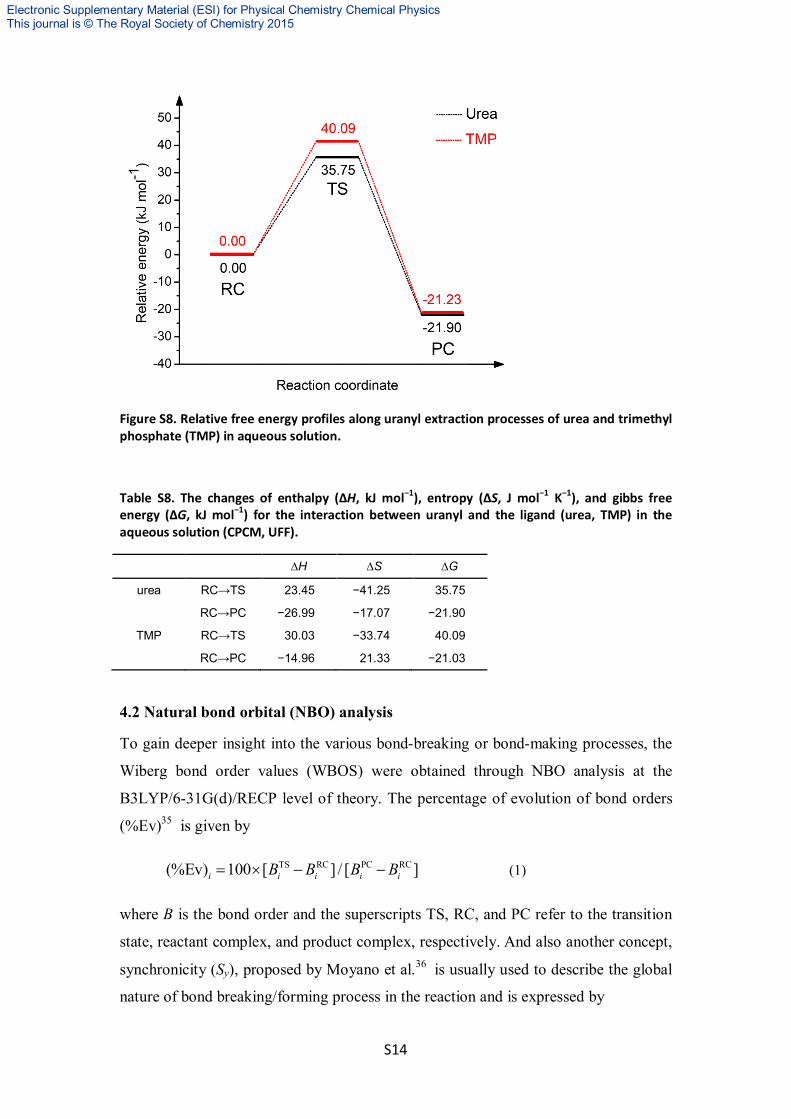
4.1 Extraction reaction processes
The optimized structures of reactant complexes (RC), transition states (TS) and
product complexes (PC) for urea/TMP extraction processes in aqueous solution are
shown in Figure S7 (Figure S9 in gas). Meanwhile, the potential energy profiles for
the reactions in aqueous solution are presented in Figure S8 (Figure S10 in gas), and
the changes in enthalpy(∆H), Entropy(∆S) and Gibbs free energy (∆G) in aqueous
solution are given in Table S7 (Table 11 in gas). It can be observed that both
ligand-water exchanges are exothermic process. The activation energy barrier of the
urea-involving process is 35.75 kJ/mol, lower than that in TMP-involving process
(40.09 kJ/mol), which indicates that the ligand-water interchange mechanism may be
slightly more favorable for urea-involving process than for TMP-involving process.
And the lower activation barrier will be induced by the more negative ∆q values,
defined as q(atom in TS) – q (atom in RC),34 shown in Table S10. In the transition
state (TS) for extraction reactions of urea and TMP ligands, Urea-TS and TMP-TS,
the imaginary frequency are 66.81i cm−1 and 29.68i cm−1 ( −56.99i cm−1 and −68.69i
cm−1 in gas), respectively, associated with the nucleophilic attack of the OL atom to
the U atom. Our calculations figure out that uranyl extraction processes of urea and
TMP have nearly similar minimal energy path, indicating that the urea structure has
nearly the same strong uranyl extraction ability as alkyl phosphates.

Electronic Supplementary Material (ESI) for Physical Chemistry Chemical Physics This journal is © The Royal Society of Chemistry 2015
S13
Figure S7. The optimized structures of reactant complexes (RC), transition states (TS) and product complexes (PC) for urea/TMP extraction processes in aqueous solution (CPCM). The energy and important bond lengths are also shown in this figure.
Electronic Supplementary Material (ESI) for Physical Chemistry Chemical Physics This journal is © The Royal Society of Chemistry 2015
S14
Figure S8. Relative free energy profiles along uranyl extraction processes of urea and trimethyl phosphate (TMP) in aqueous solution.
Table S8. The changes of enthalpy (∆H, kJ mol−1), entropy (∆S, J mol−1 K−1), and gibbs free energy (∆G, kJ mol−1) for the interaction between uranyl and the ligand (urea, TMP) in the aqueous solution (CPCM, UFF).
∆H ∆S ∆G
urea RC→TS 23.45 −41.25 35.75
RC→PC −26.99 −17.07 −21.90
TMP RC→TS 30.03 −33.74 40.09
RC→PC −14.96 21.33 −21.03
4.2 Natural bond orbital (NBO) analysis
To gain deeper insight into the various bond-breaking or bond-making processes, the
Wiberg bond order values (WBOS) were obtained through NBO analysis at the
B3LYP/6-31G(d)/RECP level of theory. The percentage of evolution of bond orders
(%Ev)35 is given by
TS RC PC RC(%Ev) 100 [ ] / [ ] i i i i iB B B B (1)
where B is the bond order and the superscripts TS, RC, and PC refer to the transition
state, reactant complex, and product complex, respectively. And also another concept,
synchronicity (Sy), proposed by Moyano et al.36 is usually used to describe the global
nature of bond breaking/forming process in the reaction and is expressed by

Electronic Supplementary Material (ESI) for Physical Chemistry Chemical Physics This journal is © The Royal Society of Chemistry 2015
S15
nav
1 avy
(%Ev) (%Ev)(%Ev)12 2
i
iSn
(2)
In Eq. (2), the average percentage of evolution of bond orders [(Ev)av%] is given by
av1
1(%Ev) (%Ev)
n
iin
(3)
and n refers to the number of bonds directly involved in the reaction.
The Wiberg bond order values, percentage of evolution of bond orders (%Ev) and
synchronicity (Sy) in aqueous solution are shown in Table S10 (Table S14 in gas). For
the Urea-involving process, the values of WBOs and %Ev combined with the changes
in U‒O(L) and U‒O1(H2O) bond lengths (table S9) indicate that the U‒O(L)
bond-forming (%Ev=33.94%) and U‒O1(H2O) bond-breaking (%Ev = 10.46%)
which corresponds to the process of ligands interchange. We found that the
synchronicity values are 0.710 and 0.660 for urea-involving process and
TMP-involving process, respectively, which show that the TMP-involving process is
almost the same as urea-involving process, and the TMP-process of this mechanism is
slightly asynchronous.
Table S9. The selected geometrical parameters of the reactant complexes (RC), transition states (TS), and product complexes(PC) for extraction reaction processes in the aqueous solution (CPCM, UFF) obtained by the DFT calculations.
d(U‒O1water) d(U‒OL) θ(Owater‒U‒OL) θ(Oax‒U‒Oax)
urea RC 2.450 3.845 178.51
TS 2.530 2.984 54.71 173.27
PC 4.113 2.280 176.90
TMP RC 2.452 3.950 179.14
TS 2.602 2.916 57.01 170.50
PC 4.355 2.345 176.89

Electronic Supplementary Material (ESI) for Physical Chemistry Chemical Physics This journal is © The Royal Society of Chemistry 2015
S16
Table S10. Wiberg bond orders (WBOs), Percentage of Evolution of Bond Orders %Ev and Synchronicity (Sy) in the aqueous solution (CPCM, UFF).
WBOs(RC) WBOs(TS) WBOs(PC) %Ev Sy
Urea U—O(L) 0.014 0.215 0.686 29.92
U—O(1) 0.464 0.419 0.006 9.83
U—O(2) 0.489 0.451 0.393 39.58
U—O(3) 0.402 0.421 0.433 61.29 0.710
U—O(4) 0.446 0.413 0.411 94.29
U—O(5) 0.420 0.413 0.464 −15.91
TMP U—O(L) 0.009 0.212 0.564 36.57
U—O(1) 0.456 0.374 0.006 18.22
U—O(2) 0.477 0.439 0.414 60.32
U—O(3) 0.402 0.418 0.523 13.22 0.660
U—O(4) 0.447 0.419 0.391 50.00
U—O(5) 0.423 0.413 0.411 83.33
Table S11. The selected charges and changes in atom charges determined by natural population analysis in the aqueous solution (CPCM, UFF).
U O(L) O(1) O(2) O(3) O(4) O(5)
urea RC 1.777 −0.791 −0.903 −0.895 −0.878 −0.869 −0.878
TS 1.750 −0.774 −0.896 −0.881 −0.871 −0.876 −0.873
RC→TS −0.027 0.017 0.007 0.014 0.007 −0.007 0.005
PC 1.694 −0.660 −0.976 −0.875 −0.892 −0.878 −0.886
TMP RC 1.785 −1.146 −0.896 −0.889 −0.878 −0.870 −0.879
TS 1.768 −1.098 −0.895 −0.877 −0.874 −0.876 −0.872
RC→TS −0.017 0.048 0.001 0.012 0.004 −0.006 0.007
PC 1.726 −1.003 −0.959 −0.884 −0.887 −0.880 −0.875

Electronic Supplementary Material (ESI) for Physical Chemistry Chemical Physics This journal is © The Royal Society of Chemistry 2015
S17
Figure S9. The optimized structures of reactant complexes (RC), transition states (TS) and product complexes (PC) for urea/TMP extraction processes in gas (298.15 K, 0.1 MPa). The energy and important bond lengths are also shown in this figure.
Electronic Supplementary Material (ESI) for Physical Chemistry Chemical Physics This journal is © The Royal Society of Chemistry 2015
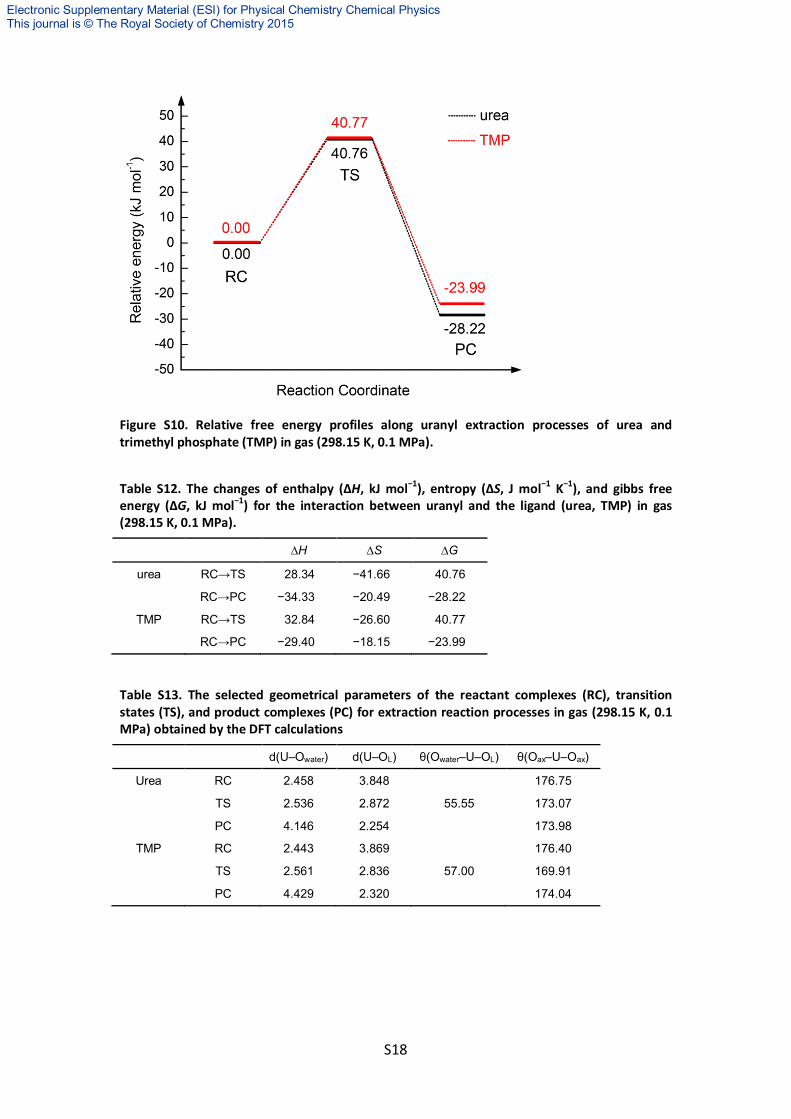
S18
Figure S10. Relative free energy profiles along uranyl extraction processes of urea and trimethyl phosphate (TMP) in gas (298.15 K, 0.1 MPa).
Table S12. The changes of enthalpy (∆H, kJ mol−1), entropy (∆S, J mol−1 K−1), and gibbs free energy (∆G, kJ mol−1) for the interaction between uranyl and the ligand (urea, TMP) in gas (298.15 K, 0.1 MPa).
∆H ∆S ∆G
urea RC→TS 28.34 −41.66 40.76
RC→PC −34.33 −20.49 −28.22
TMP RC→TS 32.84 −26.60 40.77
RC→PC −29.40 −18.15 −23.99
Table S13. The selected geometrical parameters of the reactant complexes (RC), transition states (TS), and product complexes (PC) for extraction reaction processes in gas (298.15 K, 0.1 MPa) obtained by the DFT calculations
d(U‒Owater) d(U‒OL) θ(Owater‒U‒OL) θ(Oax‒U‒Oax)
Urea RC 2.458 3.848 176.75
TS 2.536 2.872 55.55 173.07
PC 4.146 2.254 173.98
TMP RC 2.443 3.869 176.40
TS 2.561 2.836 57.00 169.91
PC 4.429 2.320 174.04

Electronic Supplementary Material (ESI) for Physical Chemistry Chemical Physics This journal is © The Royal Society of Chemistry 2015
S19
Table S14. Wiberg bond orders (WBOs), percentage of evolution of bond orders %Ev and synchronicity (Sy) in gas (298.15 K, 0.1 MPa).
WBOs(RC) WBOs(TS) WBOs(PC) %Ev Sy
Urea U—O(L) 0.016 0.263 0.744 33.94
U—O(1) 0.446 0.400 0.006 10.46
U—O(2) 0.462 0.422 0.371 43.96
U—O(3) 0.372 0.393 0.404 65.62 0.7178
U—O(4) 0.394 0.377 0.376 94.44
U—O(5) 0.375 0.382 0.428 13.21
TMP U—O(L) 0.013 0.252 0.600 40.76
U—O(1) 0.468 0.396 0.005 15.55
U—O(2) 0.492 0.443 0.412 61.25
U—O(3) 0.392 0.417 0.486 26.60 0.8305
U—O(4) 0.416 0.411 0.372 11.36
U—O(5) 0.398 0.406 0.389 −88.89
4.3 The effect of nitrate ions on uranium extraction
Similar effect of nitrate ions was also observed in extraction of uranium by TMP in
solvent-extraction system (CPCM, UFF) (Table S15). For comparison, the extraction
processes are also studied in gas phase (298.15 K, 0.1 MPa). For the reaction
[UO2(H2O)5]2+ + TMP → [UO2(TMP)(H2O)4]2+ + H2O in aqueous solution, the
changes in the Gibbs free energy is −15.55 kJ mol−1 (−132.92 kJ mol−1 in gas), much
more negative than that for the reaction UO2(NO3)2(H2O)2 + TMP → [UO2(NO3)2
(TMP)(H2O)4] + H2O (−2.07 kJ mol−1 in aqueous solution and 8.91 kJ mol−1 in gas).
As shown in Table S16, the WBOs of the U‒OL (Urea and TMP) bonds are larger
than those of the U‒Owater bonds, which indicates that the urea ligands have much
stronger coordination ability towards uranyl ions than water molecules.

Electronic Supplementary Material (ESI) for Physical Chemistry Chemical Physics This journal is © The Royal Society of Chemistry 2015
S20
Figure S11. The optimized structures of the stationary points for [UO2(Urea)(H2O)4]2+, UO2(NO3)2(Urea)(H2O), [UO2(TMP)(H2O)4]2+ and UO2(NO3)2(TMP)(H2O) in aqueous solution (CPCM, UFF).
Table S15. DFT calculations of the changes in enthalpy (∆H, kJ mol−1), entropy (∆S, J mol−1 K−1), and gibbs free energy (∆G, kJ mol−1) for the extraction of uranium in aqueous solution (CPCM, UFF).
Extraction reaction ∆H ∆S ∆G
[UO2(H2O)5]2+ + Urea → [UO2(Urea)(H2O)4]2+ + H2O −50.87 −64.97 −31.50
UO2(NO3)2(H2O)2 + Urea → [UO2(NO3)2(Urea)(H2O)] + H2O −35.44 −42.09 −22.89
[UO2(H2O)5]2+ + TMP → [UO2(TMP)(H2O)4]2+ + H2O −30.71 −50.85 −15.55
UO2(NO3)2(H2O)2 + TMP → UO2(NO3)2(TMP)(H2O) + H2O −8.40 −21.23 −2.07

Electronic Supplementary Material (ESI) for Physical Chemistry Chemical Physics This journal is © The Royal Society of Chemistry 2015
S21
Table S16. Wiberg bond orders (WBOs) of U‒O Bonds and natural charges on the U and O atoms for the complexes of uranyl ion and L (L=TMP and Urea) in aqueous solution (CPCM, UFF).
species U‒OL U‒Owater
U‒O1nitrate Q(U) Q(OL)
[UO2(H2O)5]2+ 0.433 1.802
UO2(NO3)2(H2O)2 0.410 0.461 1.477
[UO2(Urea)(H2O)4]2+ 0.699 0.416 1.705 −0.655
UO2(NO3)2 (Urea)(H2O) 0.628 0.404 0.450 1.403 −0.635
[UO2(TMP)(H2O)4]2+ 0.571 0.424 1.744 −1.004
UO2(NO3)2(TMP)(H2O) 0.551 0.403 0.449 1.435 −0.987
Figure S12. The optimized structures of the stationary points for [UO2(Urea)(H2O)4]2+, UO2(NO3)2(Urea)(H2O), [UO2(TMP)(H2O)4]2+ and UO2(NO3)2(TMP)(H2O) in gas (298.15 K, 0.1 MPa).

Electronic Supplementary Material (ESI) for Physical Chemistry Chemical Physics This journal is © The Royal Society of Chemistry 2015
S22
Table S17. DFT calculations of the changes in enthalpy (∆H, kJ mol−1), entropy (∆S, J mol−1 K−1), and gibbs free energy (∆G, kJ mol−1) for the extraction of uranium in gas (298.15 K, 0.1 MPa).
Extraction reaction ∆H ∆S ∆G
[UO2(H2O)5]2+ + Urea → [UO2(Urea)(H2O)4]2+ + H2O −202.62 −70.37 −181.64
UO2(NO3)2(H2O)2 + Urea → [UO2(NO3)2 (Urea)(H2O)] + H2O −41.10 −48.73 −26.57
[UO2(H2O)5]2+ + TMP → [UO2(TMP)(H2O)4]2+ + H2O −148.92 −53.66 −132.92
UO2(NO3)2(H2O)2 + TMP → UO2(NO3)2 (TMP)(H2O) + H2O −17.01 −27.17 −8.91
Table S18. Wiberg bond orders (WBOs) of U‒O Bonds and natural charges on the U and O atoms for the complexes of uranyl ion and L (L = TMP and Urea) in gas (298.15 K, 0.1 MPa).
species U‒OL U‒Owater
U‒O1nitrate Q(U) Q(OL)
[UO2(H2O)5]2+ 0.433 1.802
UO2(NO3)2(H2O)2 0.410 0.461 1.477
[UO2(Urea)(H2O)4]2+ 0.699 0.416 1.705 −0.655
UO2(NO3)2 (Urea)(H2O) 0.628 0.404 0.450 1.403 −0.635
[UO2(TMP)(H2O)4]2+ 0.571 0.424 1.744 −1.004
UO2(NO3)2(TMP)(H2O) 0.551 0.403 0.449 1.435 −0.987
5. The uranium (VI) extraction experiments.
5.1 Effect of pH
The effect of pH on the adsorption capability of Urea-GO toward uranium(VI) was
investigated and the results are shown in Fig. S13. The adsorption amount of uranium
increased drastically with increasing of pH values.

Electronic Supplementary Material (ESI) for Physical Chemistry Chemical Physics This journal is © The Royal Society of Chemistry 2015
S23
Figure S13. Effect of pH on the solid-phase extraction of uranyl(VI). ( the initial concentrations c0 = 0.42 mmol L−1 for uranyl ions, the volume of testing solution V = 25 mL, experiment temperatures T = 293 K, all flasks shaking time t = 120 min, and the weight of adsorbent w = 10 mg)
5.2 Effect of contact time
The effect of contact time on the uranium(VI) adsorption by Urea-GO was shown in
Fig. S14. The adsorption amount of uranyl ions increased rapidly during the first five
minutes and then gradually tended to equilibrium. It is worth noting that over 65% of
total adsorption amount was achieved in the first minute.
Figure S14. Effect of contact time on the solid-phase extraction of uranyl(VI). (pH = 4.5, the initial concentrations c0 = 0.42 mmol L−1 for uranyl ions, the volume of testing solution V = 25 mL, experiment temperatures T = 293 K, and the weight of adsorbent w = 10 mg)
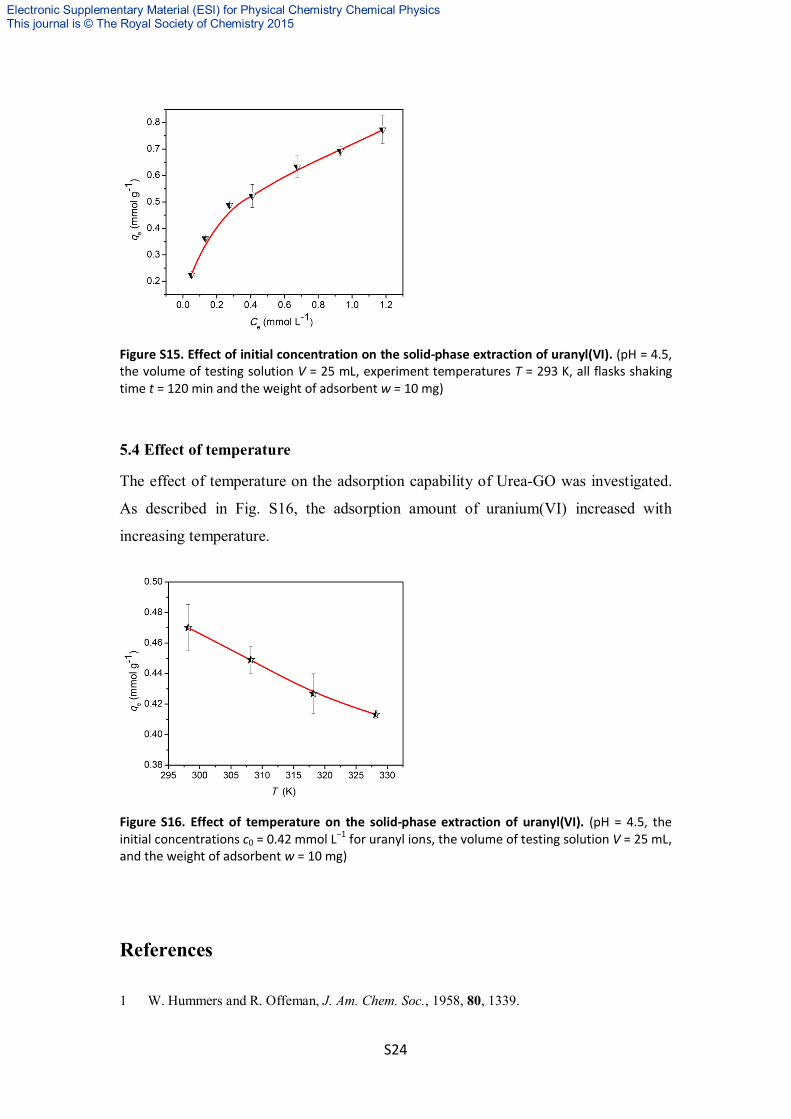
5.3 Effect of initial concentration
The adsorption isotherm of uranium(VI) were studied by batch equilibrium
experiments and the results are presented in Fig. S15. As depicted in Fig. S15, the
adsorption amount of uranyl ions by Urea-GO increased with increasing equilibrium
U(VI) concentration.
Electronic Supplementary Material (ESI) for Physical Chemistry Chemical Physics This journal is © The Royal Society of Chemistry 2015
S24
Figure S15. Effect of initial concentration on the solid-phase extraction of uranyl(VI). (pH = 4.5, the volume of testing solution V = 25 mL, experiment temperatures T = 293 K, all flasks shaking time t = 120 min and the weight of adsorbent w = 10 mg)
5.4 Effect of temperature
The effect of temperature on the adsorption capability of Urea-GO was investigated.
As described in Fig. S16, the adsorption amount of uranium(VI) increased with
increasing temperature.
Figure S16. Effect of temperature on the solid-phase extraction of uranyl(VI). (pH = 4.5, the initial concentrations c0 = 0.42 mmol L−1 for uranyl ions, the volume of testing solution V = 25 mL, and the weight of adsorbent w = 10 mg)
References 1 W. Hummers and R. Offeman, J. Am. Chem. Soc., 1958, 80, 1339.

Electronic Supplementary Material (ESI) for Physical Chemistry Chemical Physics This journal is © The Royal Society of Chemistry 2015
S25
2 S. Stankovich, R. D. Piner, S. T. Nguyen and R. S. Ruoff, Carbon, 2006, 44, 3342.
3 W. Gao, L. B. Alemany, L. Ci and P. M. Ajayan, Nature Chem. 2009, 1, 403
4 D. W. Lee, V. L. De Los Santos, J. W. Seo, L. L. Felix, D. A. Bustamante, J. M. Cole and C.
H. W. Barnes, J. Phys. Chem. B, 2010, 114, 5723.
5 C. Xu, X. Wu, J. Zhu and X. Wang, Carbon, 2008, 46, 386.
6 J. H. Saunders and R. J. Slocombe, Chem. Rev., 1948, 43, 203.
7 S. Park, J. An, R. D. Piner, I. Jung, D. Yang, A. Velamakanni, S. T. Nguyen and R. S. Ruoff,
Chem. Mater., 2008, 20, 6592.
8 C. Shan, H. Yang, J. Song, D. Han, A. Ivaska and L. Niu, Anal. Chem., 2009, 81, 2378.
9 Y. Yang, J. Wang, J. Zhang, J. Liu, X. Yang and H. Zhao, Langmuir, 2009, 25,11808.
10 X. Ye, R. B. Smith, S. Cui, V. de Almeida and B. Khomami, Solvent Extr. Ion Exch., 2010,
28, 1.
11 M. Jayasinghe and T. L. Beck, J. Phys. Chem. B, 2009, 113, 11662.
12 J. C. Taylor and M. H. Mueller, Acta Cryst. 1965, 19, 536.
13 B. N. Dalley, M. H. Mueller and S. H. Simonsen, Inorg. Chem., 1971, 10, 323.
14 M. Bühl, H. Kabrede, R. Diss and G. Wipff, J. Am. Chem. Soc., 2006, 128, 6357.
15 G. A. Shamov and G. Schreckenbach, J. Phys. Chem. A, 2005, 109, 10961.
16 C. Wang, J. Lan, Y. Zhao, Z. Chai, Y. Wei and W. Shi, Inorg. Chem., 2013, 52, 196.
17 K. Sebbari, J. Roques, E. Simoni, C. Domain, H. Perron and H. Catalette, Surf. Sci., 2012,
606, 1135.
18 S. Tsushima and A. Suzuki, J. Molec. Struct. (Theochem), 2000, 529, 21.
19 P. Nichols, E. J. Bylaska, G. K. Schenter and W. de Jong, J. Chem. Phys., 2008, 128, 124507.
20 B. Siboulet, C. J. Marsden and P. Vitorge, Chem. Phys., 2006, 326, 289.
21 P. J. Hay, R. L. Martin and G. Schreckenbach, J. Phys. Chem. A, 2000, 104, 6259.
22 L. Soderholm, S. Skanthakumar and J. Neuefeind, Anal. Bioanal. Chem., 2005, 383, 48.
23 L. Sémon, C. Boehme, I. Billard, C. Hennig, K. Lützenkirchen, T. Reich, A. Roßberg, I.
Rossini and G. Wipff, ChemPhysChem, 2001, 2, 591.
24 P. G. Allen, J. J. Bucher, D. K. Shuh, N. M. Edelstein and T. Reich, Inorg. Chem., 1997, 36,
4676.
25 U. Wahlgren, H. Moll, I. Grenthe, B. Schimmelpfennig, L. Maron, V. Vallet and O. Gropen,
J. Phys. Chem. A, 1999, 103, 8257
26 M. Åberg, D. Ferri, J. Glaser and I. Grenthe, Inorg. Chem., 1983, 22, 3986.
27 J. Neuefeind, L. Soderholm and S. Skanthakumar, J. Phys. Chem. A, 2004, 108, 2733.
28 C. Den Auwer, R. Drot, E. Simoni, S. D. Conradson, M. Gailhanou and J. Mustre de Leon,
New J. Chem., 2003, 27, 648.
29 J. S. Craw, M. A. Vincent, I. H. Hiller and A. L. Wallwork, J. Phys. Chem., 1995, 99, 10181.
30 I. A. Charushnikova and C. Den Auwer, Russ. J. Coord. Chem., 2004, 30, 511.

Electronic Supplementary Material (ESI) for Physical Chemistry Chemical Physics This journal is © The Royal Society of Chemistry 2015
S26
31 K. L. Nash, R. E. Barrans, R. Chiarizia, M. L. Dietz, M. P. Jensen and P. G. Rickert, Solvent
Extr. Ion Exch., 2000, 18, 605.
32 X. Ye, S. Cui, V. F. de Almeida and B. Khomami, J. Phys. Chem. B, 2009, 113, 9852.
33 X. Ye, S. Cui, V. F. de Almeida, B. P. Hay and B. Khomami, Phys. Chem. Chem. Phys.,
2010, 12, 15406.
34 X. Sun, X. Wei, X. Wu, Y. Ren, N. Wong, W. Li, J. Phys. Chem. A, 2010, 114, 595.
35 J. Gao, Y. Zeng, C. Zhang, Y. Xue, J. Phys. Chem. A, 2009, 113, 325.
36 A. Moyano, M. A. Pericàs, A. Valenti, J. Org. Chem., 1989, 54, 573.


![P-Chiral Phosphorus Ligands: Synthesis and Application in ...¶rn_Gschwend.pdf · [4b] Later, Knowles’ P-stereogenic diphosphine ligand DIPAMP was synthesized by oxidative coupling](https://img.dokumen.tips/doc/110x75/5fb1050757199a29b110498b/p-chiral-phosphorus-ligands-synthesis-and-application-in-rngschwendpdf.jpg)